A Pilot Study of Chronological Microbiota Changes in a Rat Apical Periodontitis Model

 , ,
, , 
Abstract
:1. Introduction
2. Materials and Methods
2.1. Animals
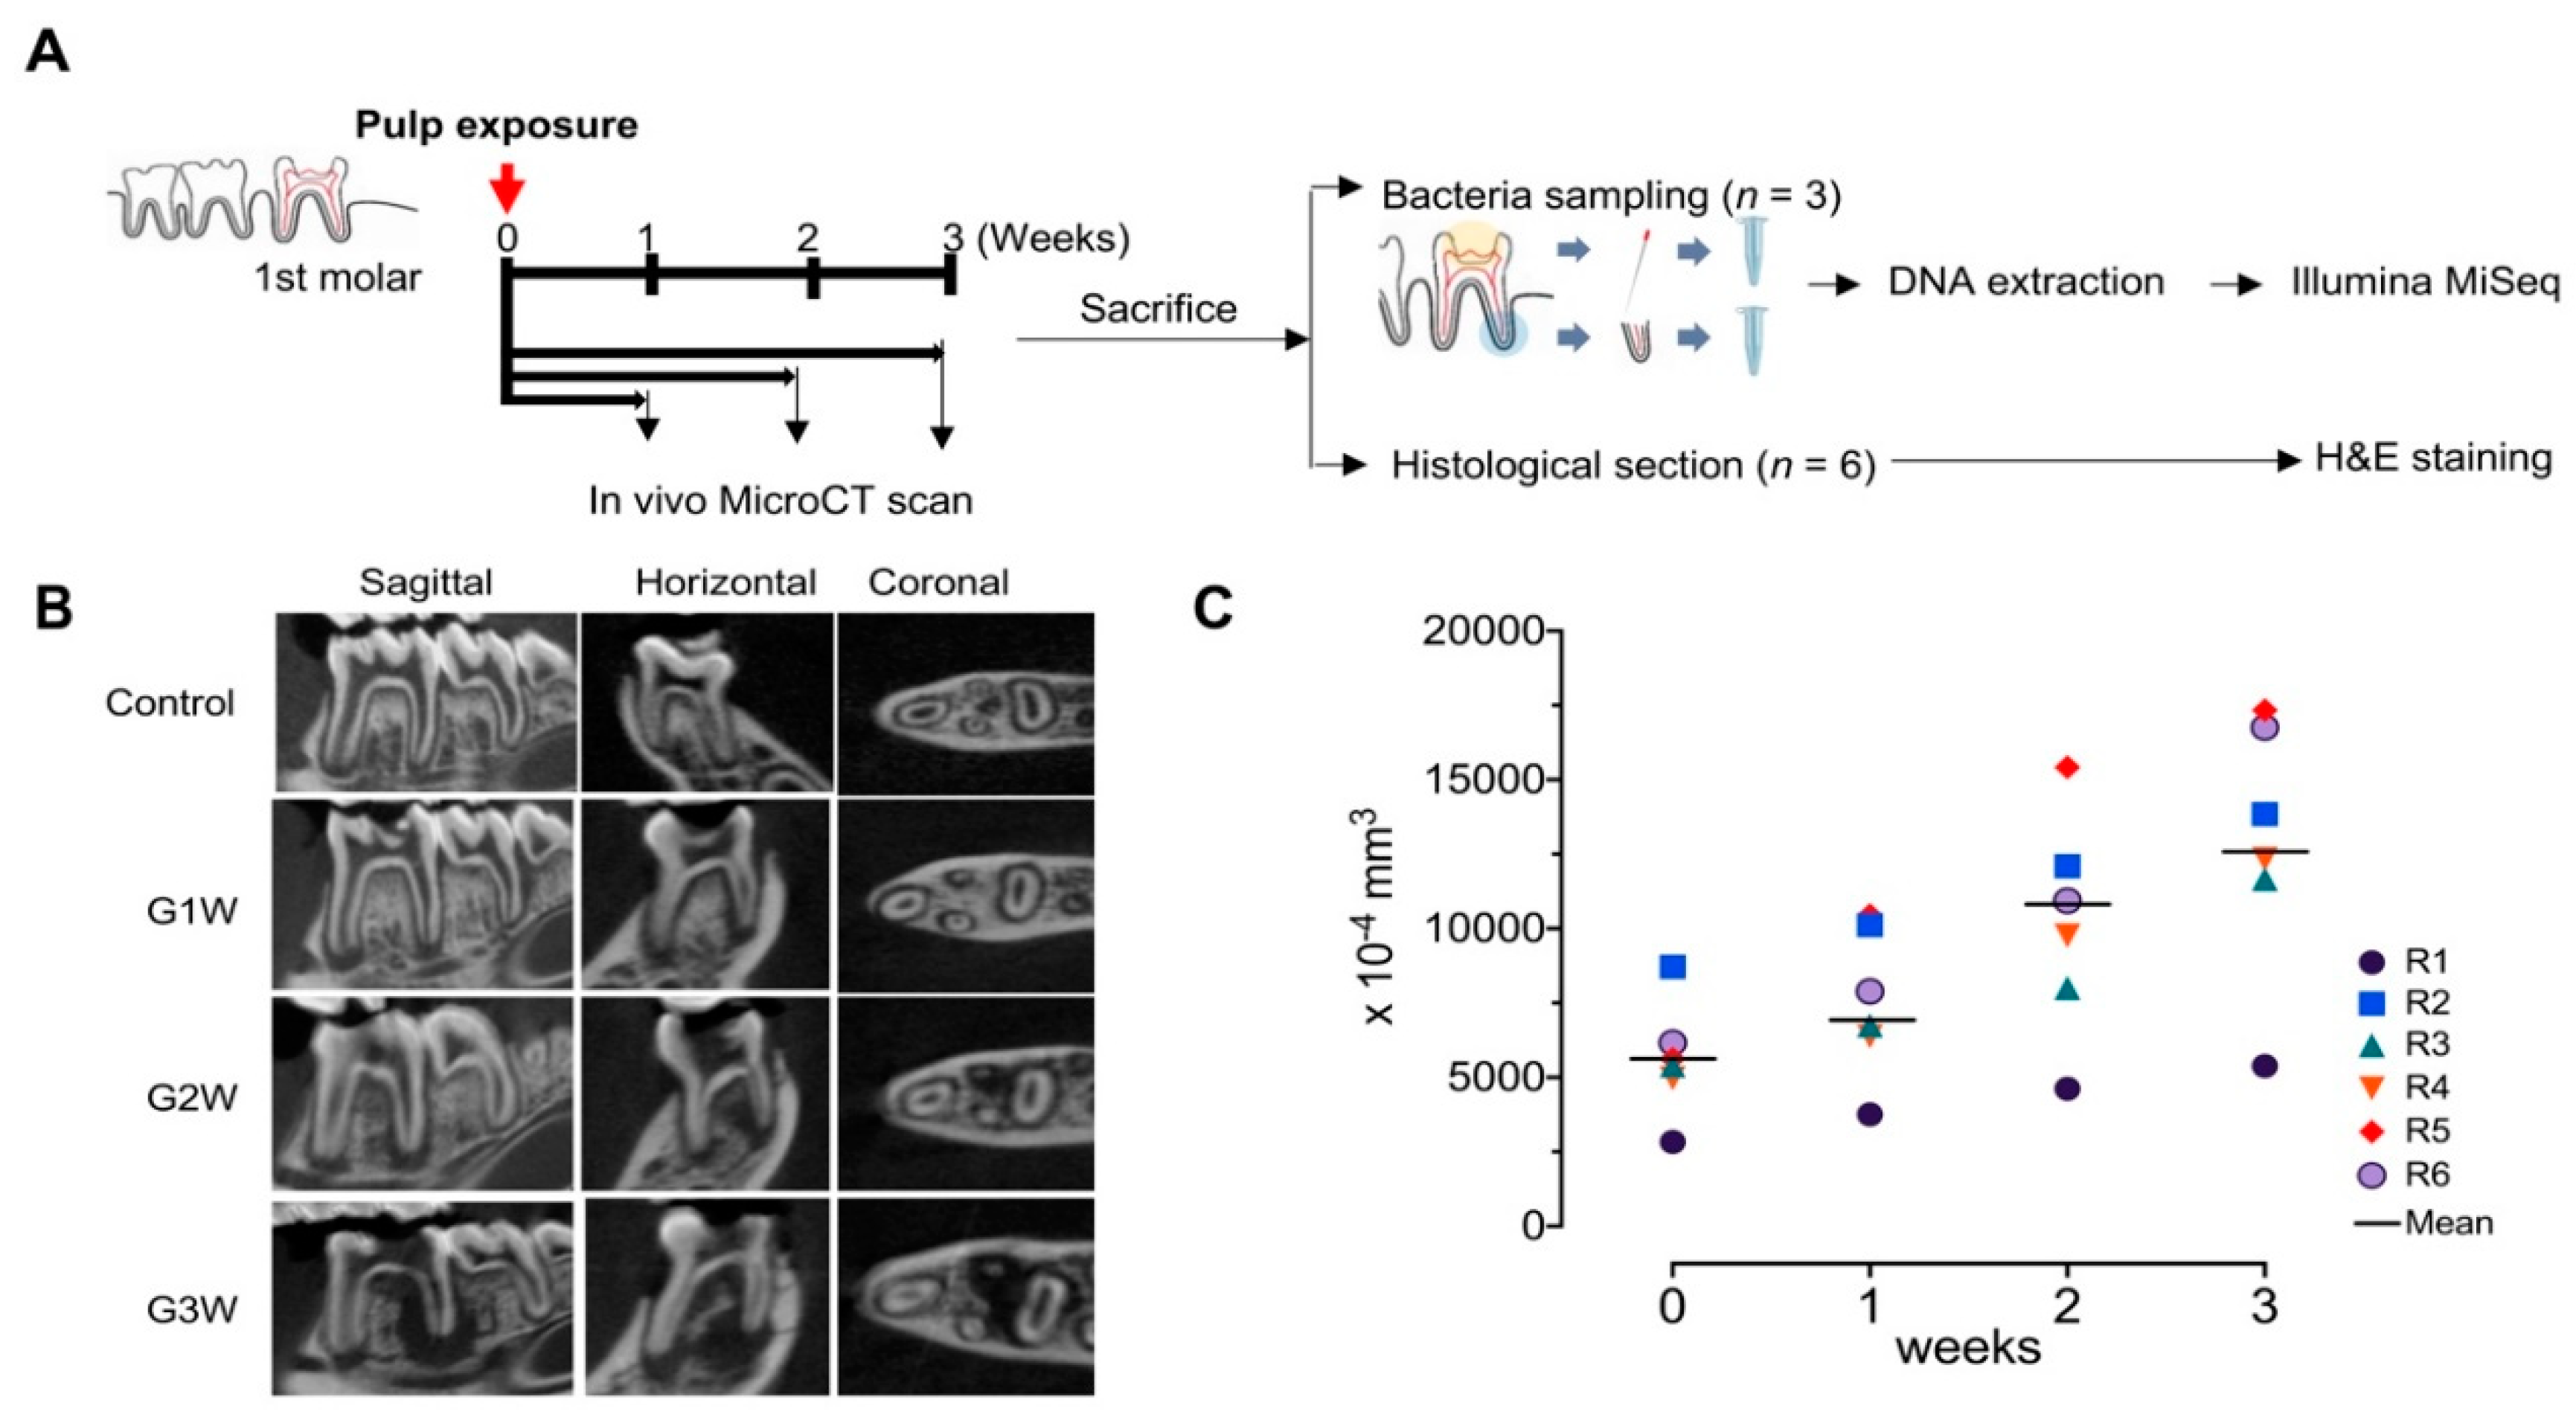
2.2. Pulp Exposure
2.3. In Vivo Micro-CT Imaging and Analysis
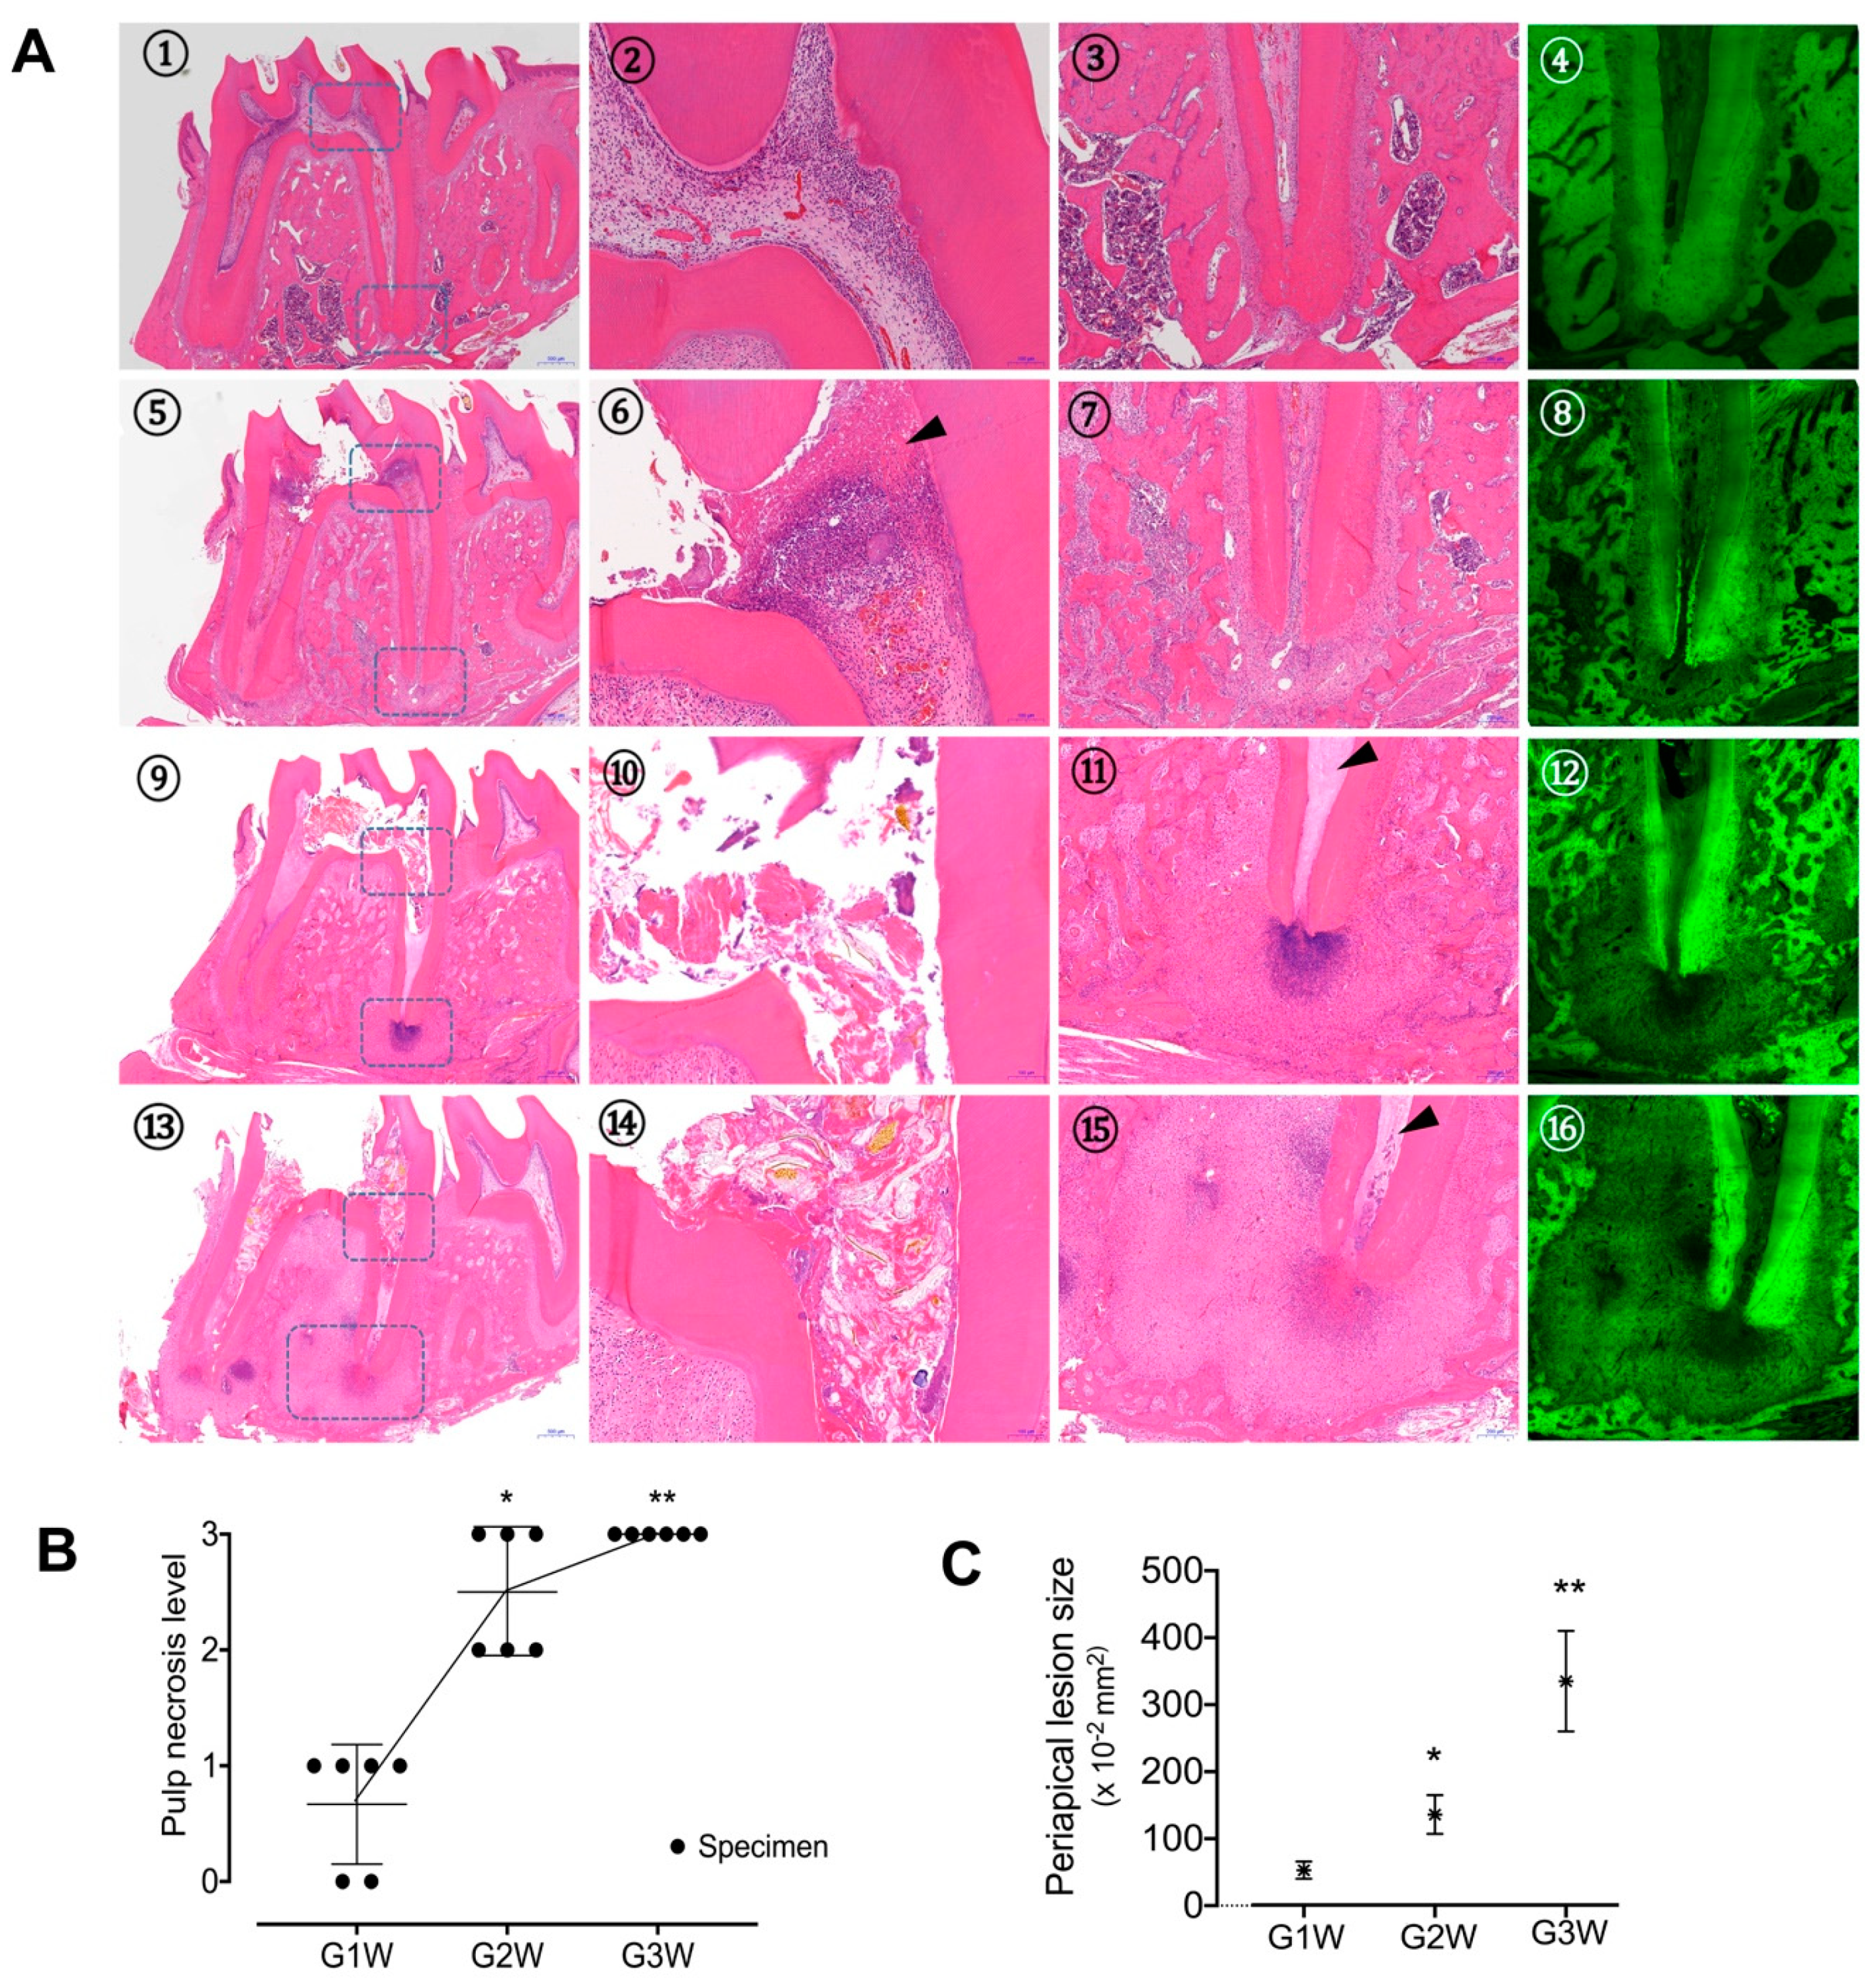
2.4. Histopathologic Analysis
2.5. Sampling, Genomic DNA Extraction, Amplification, and Sequencing
2.6. Taxonomic Assignment of Individual Sequencing Reads, Bioinformatics, and Statistical Analysis
3. Results
3.1. In Vivo Micro-CT Observations and Analysis
3.2. Histologic Features of Apical Periodontitis Progression
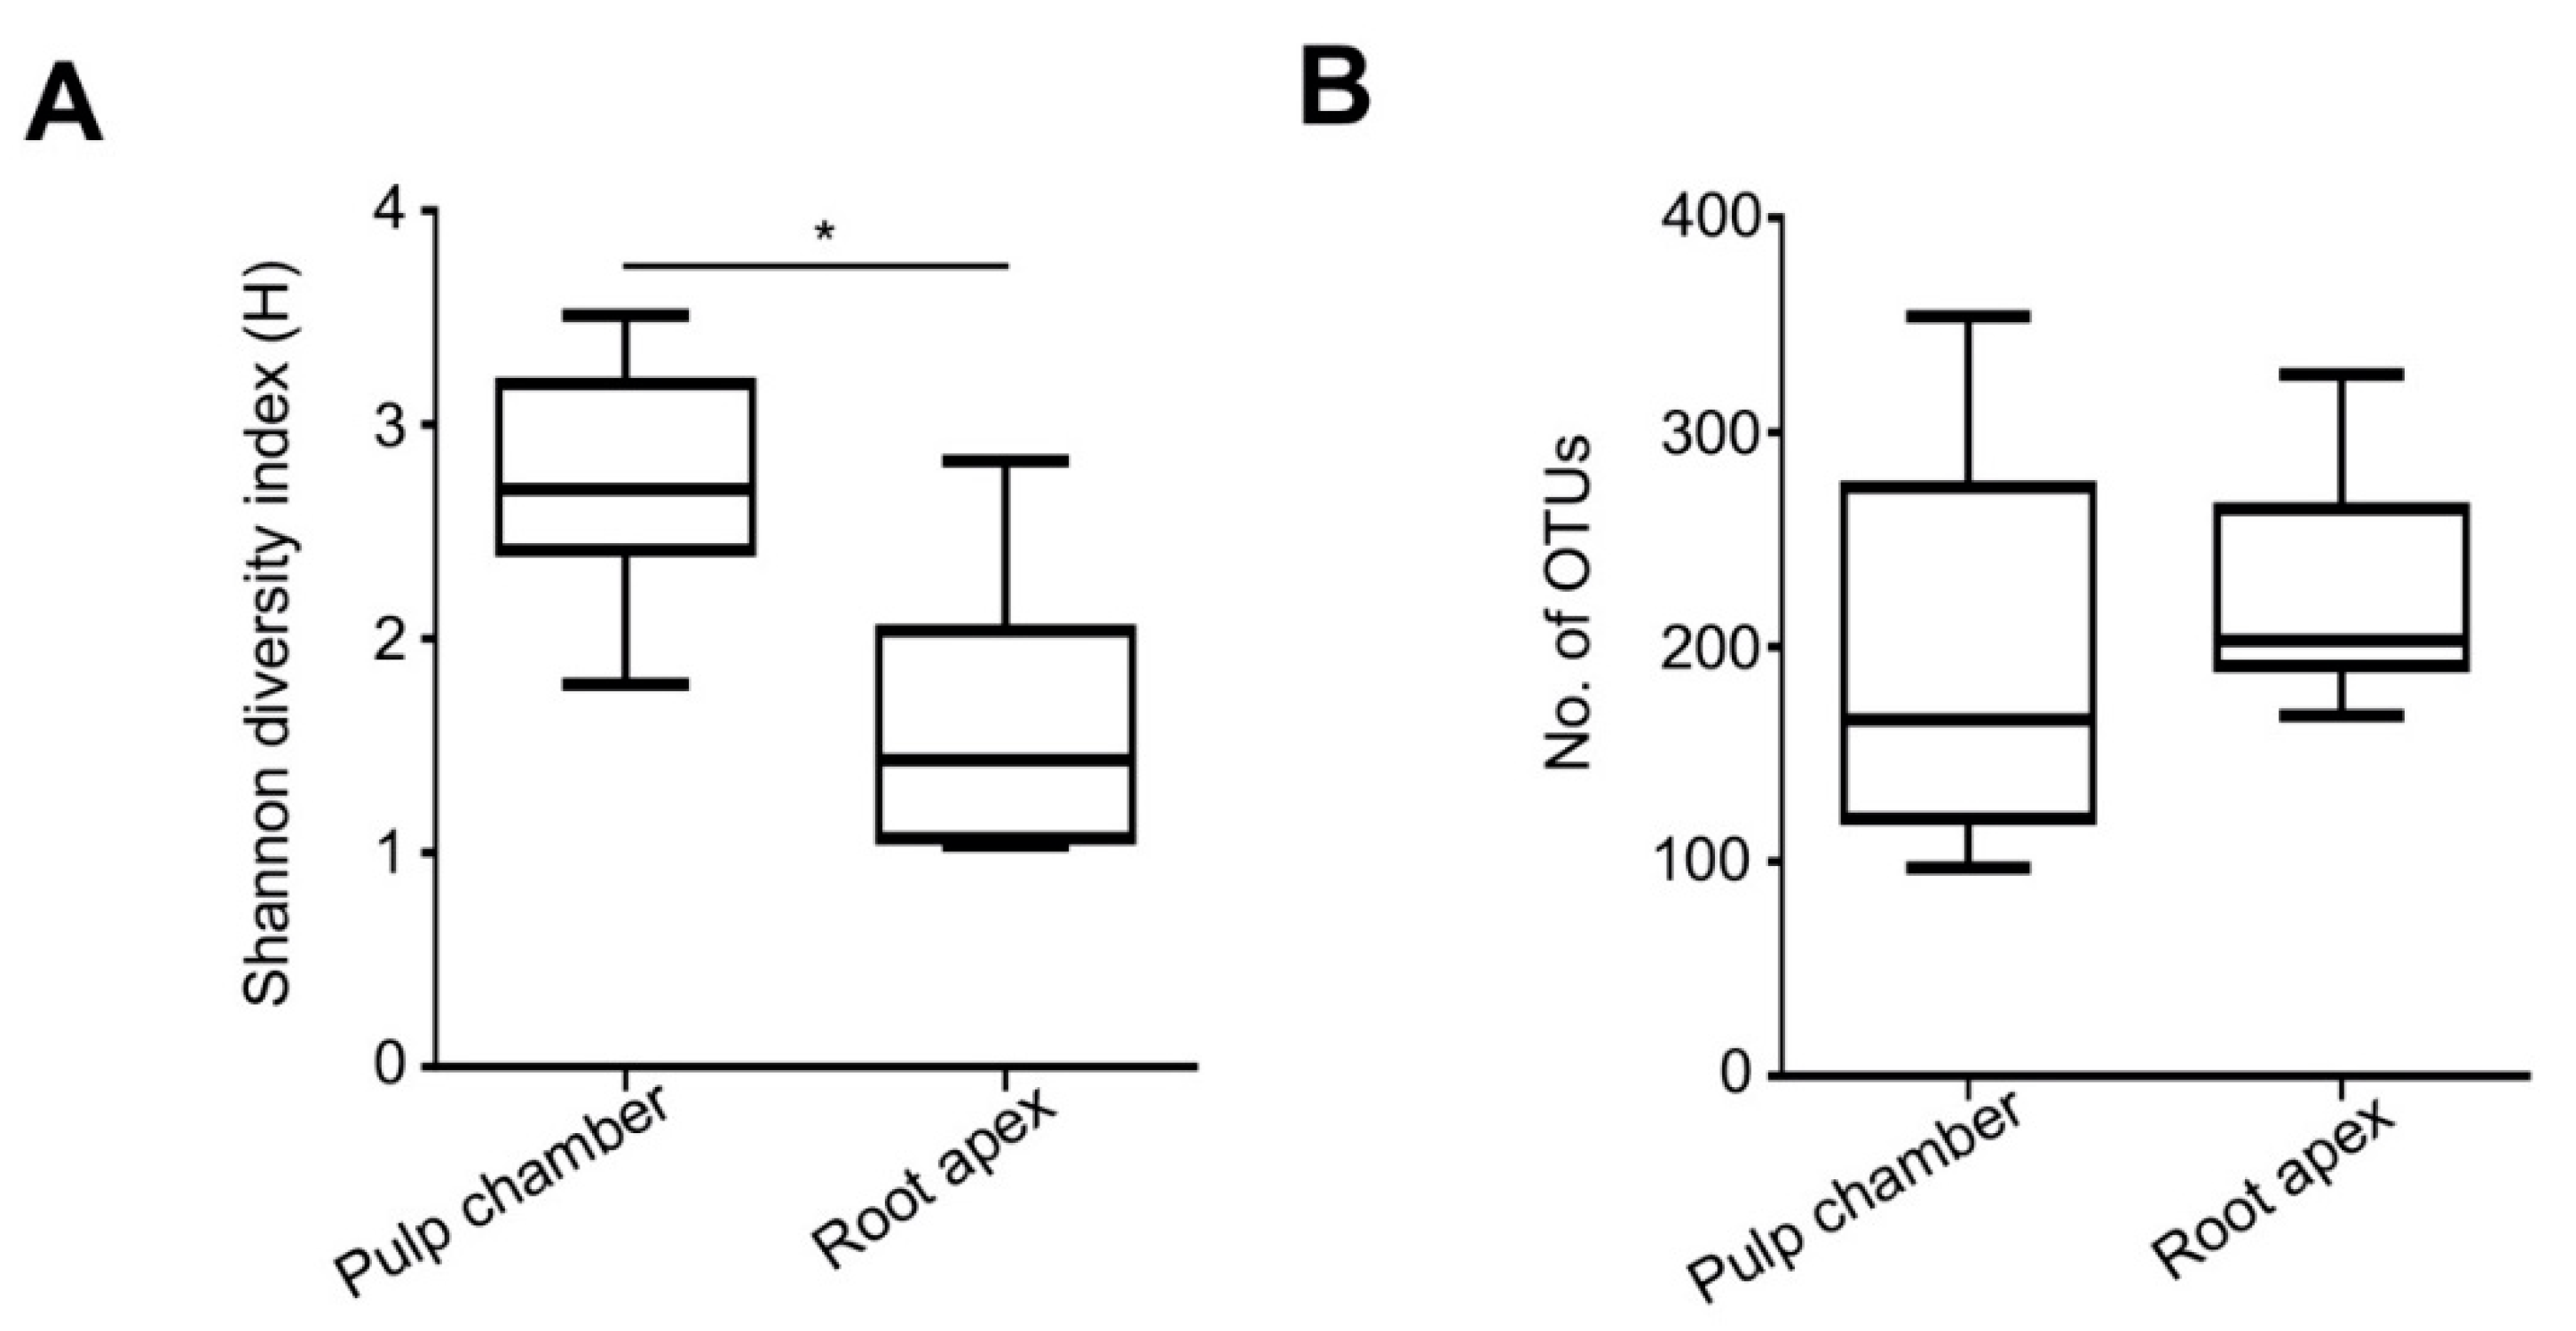
3.3. Richness of Bacterial Species
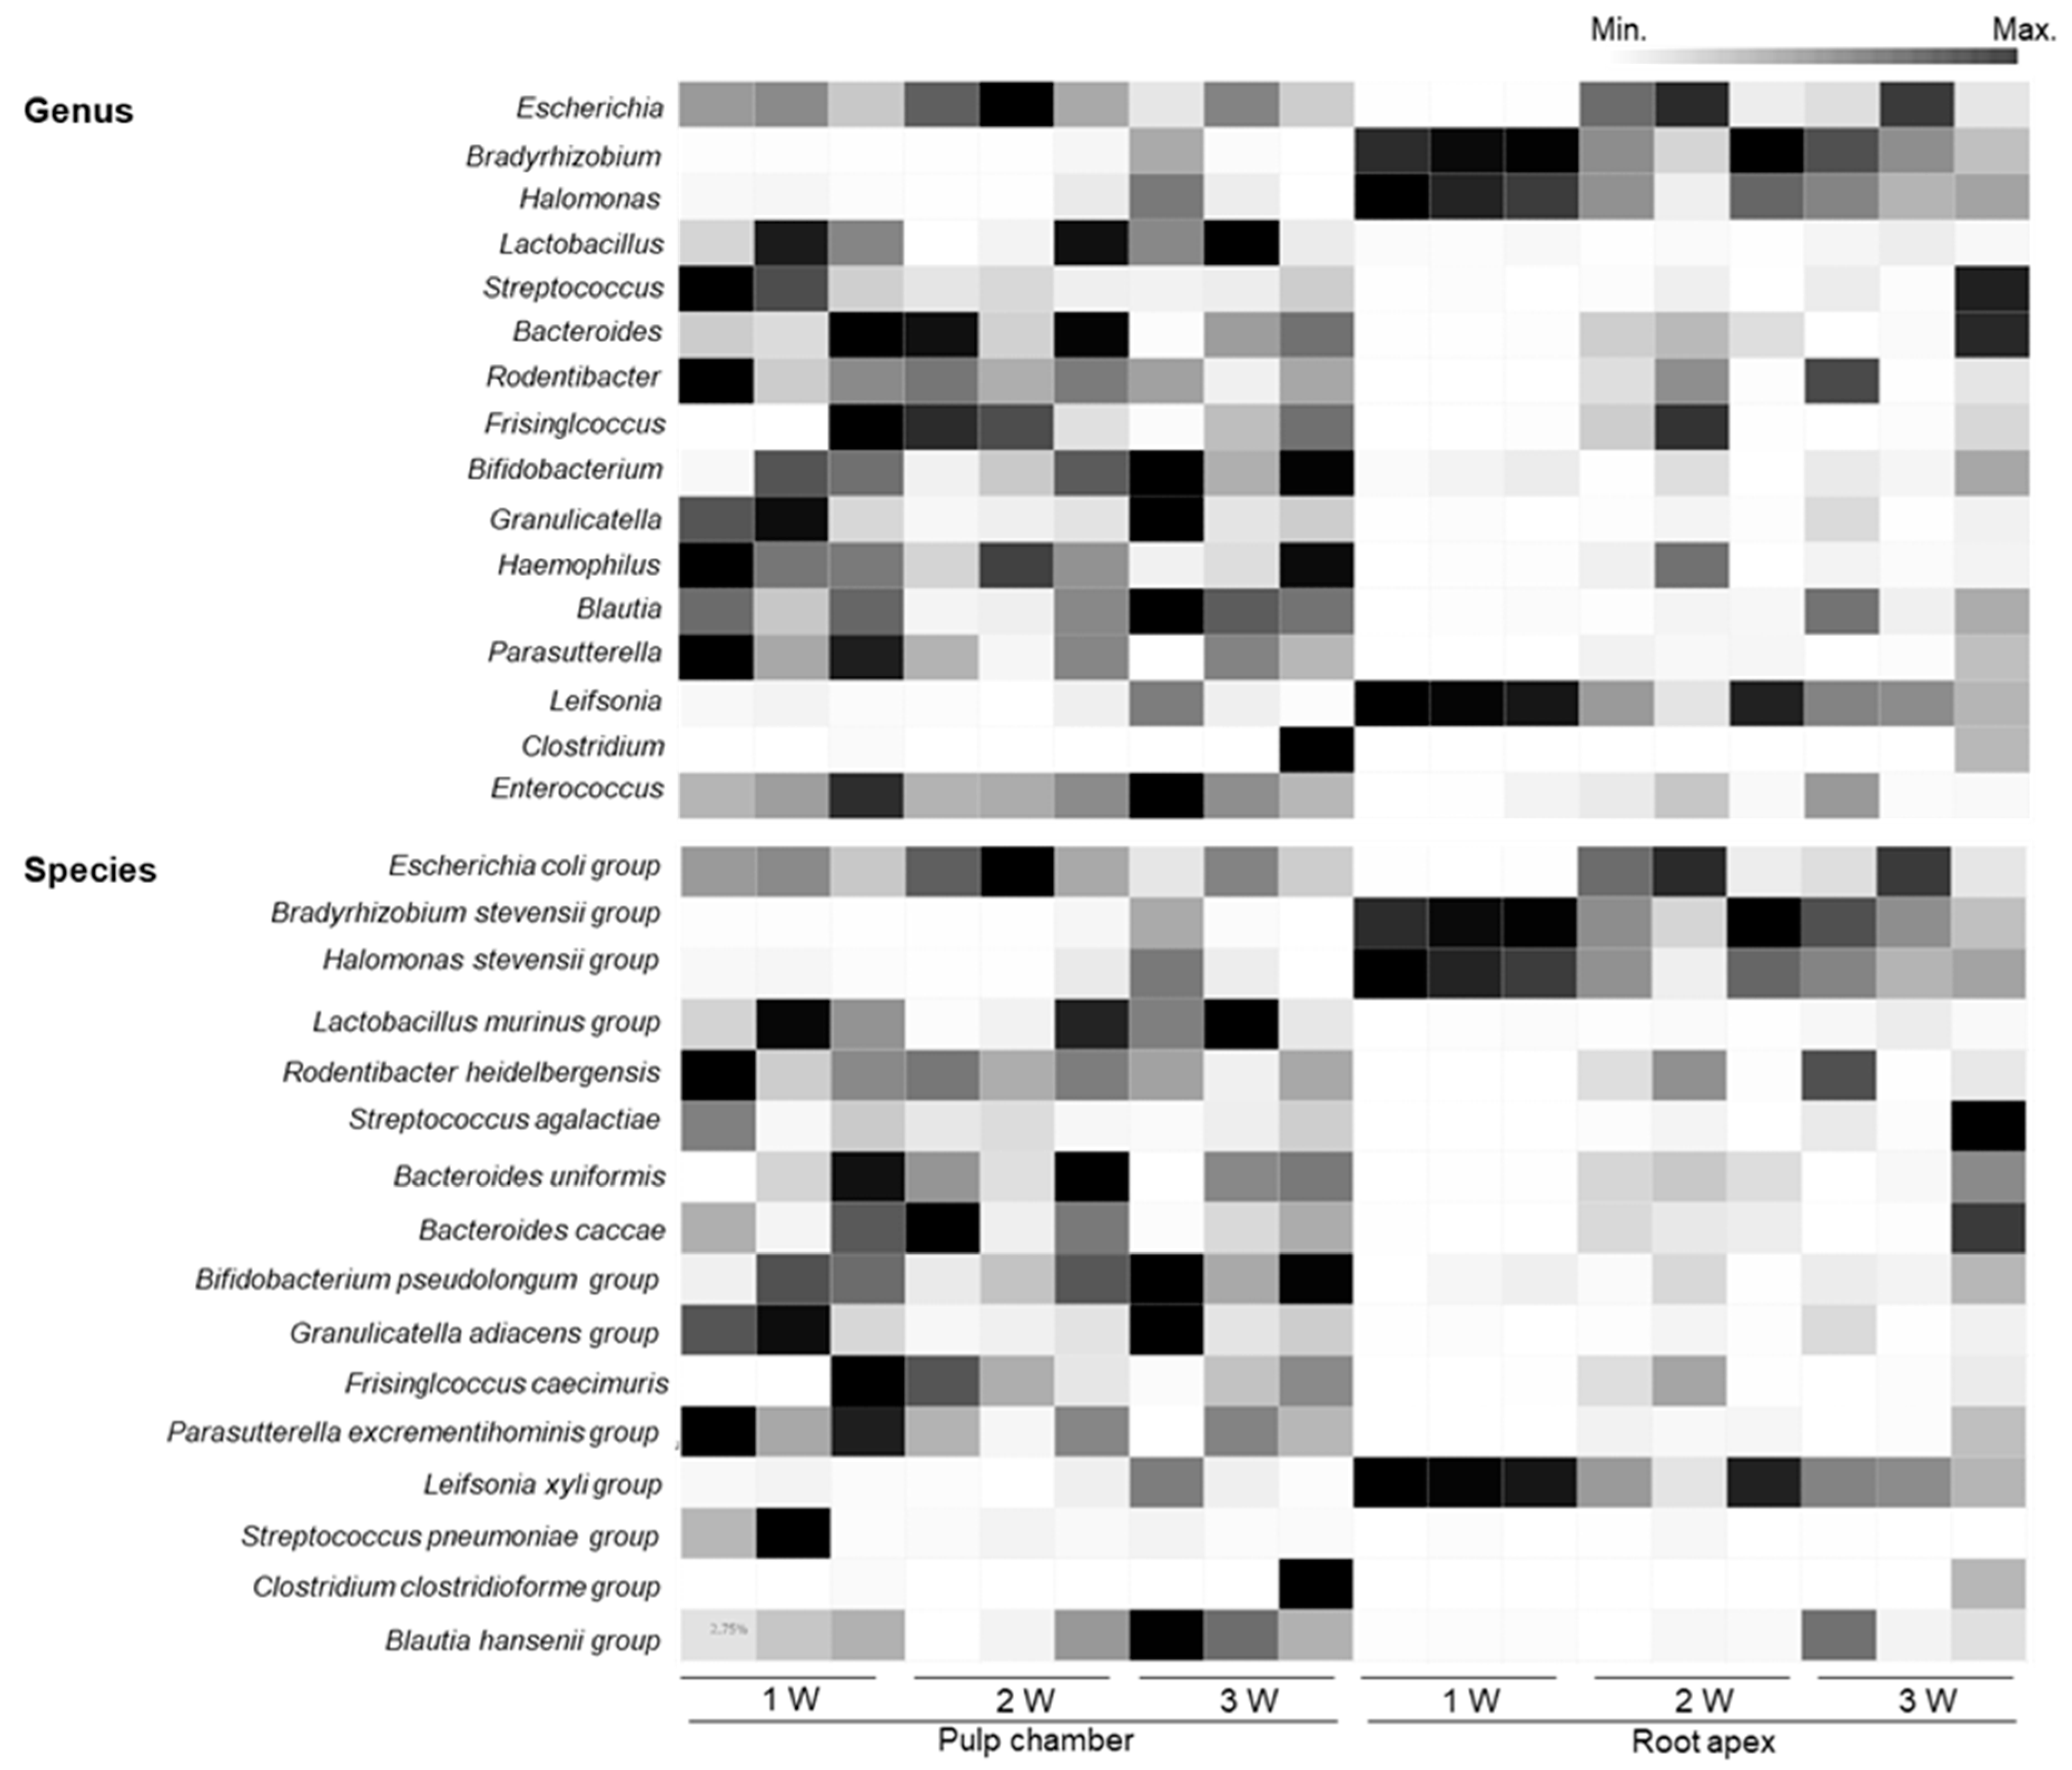
3.4. Comparison of Bacterial Communities
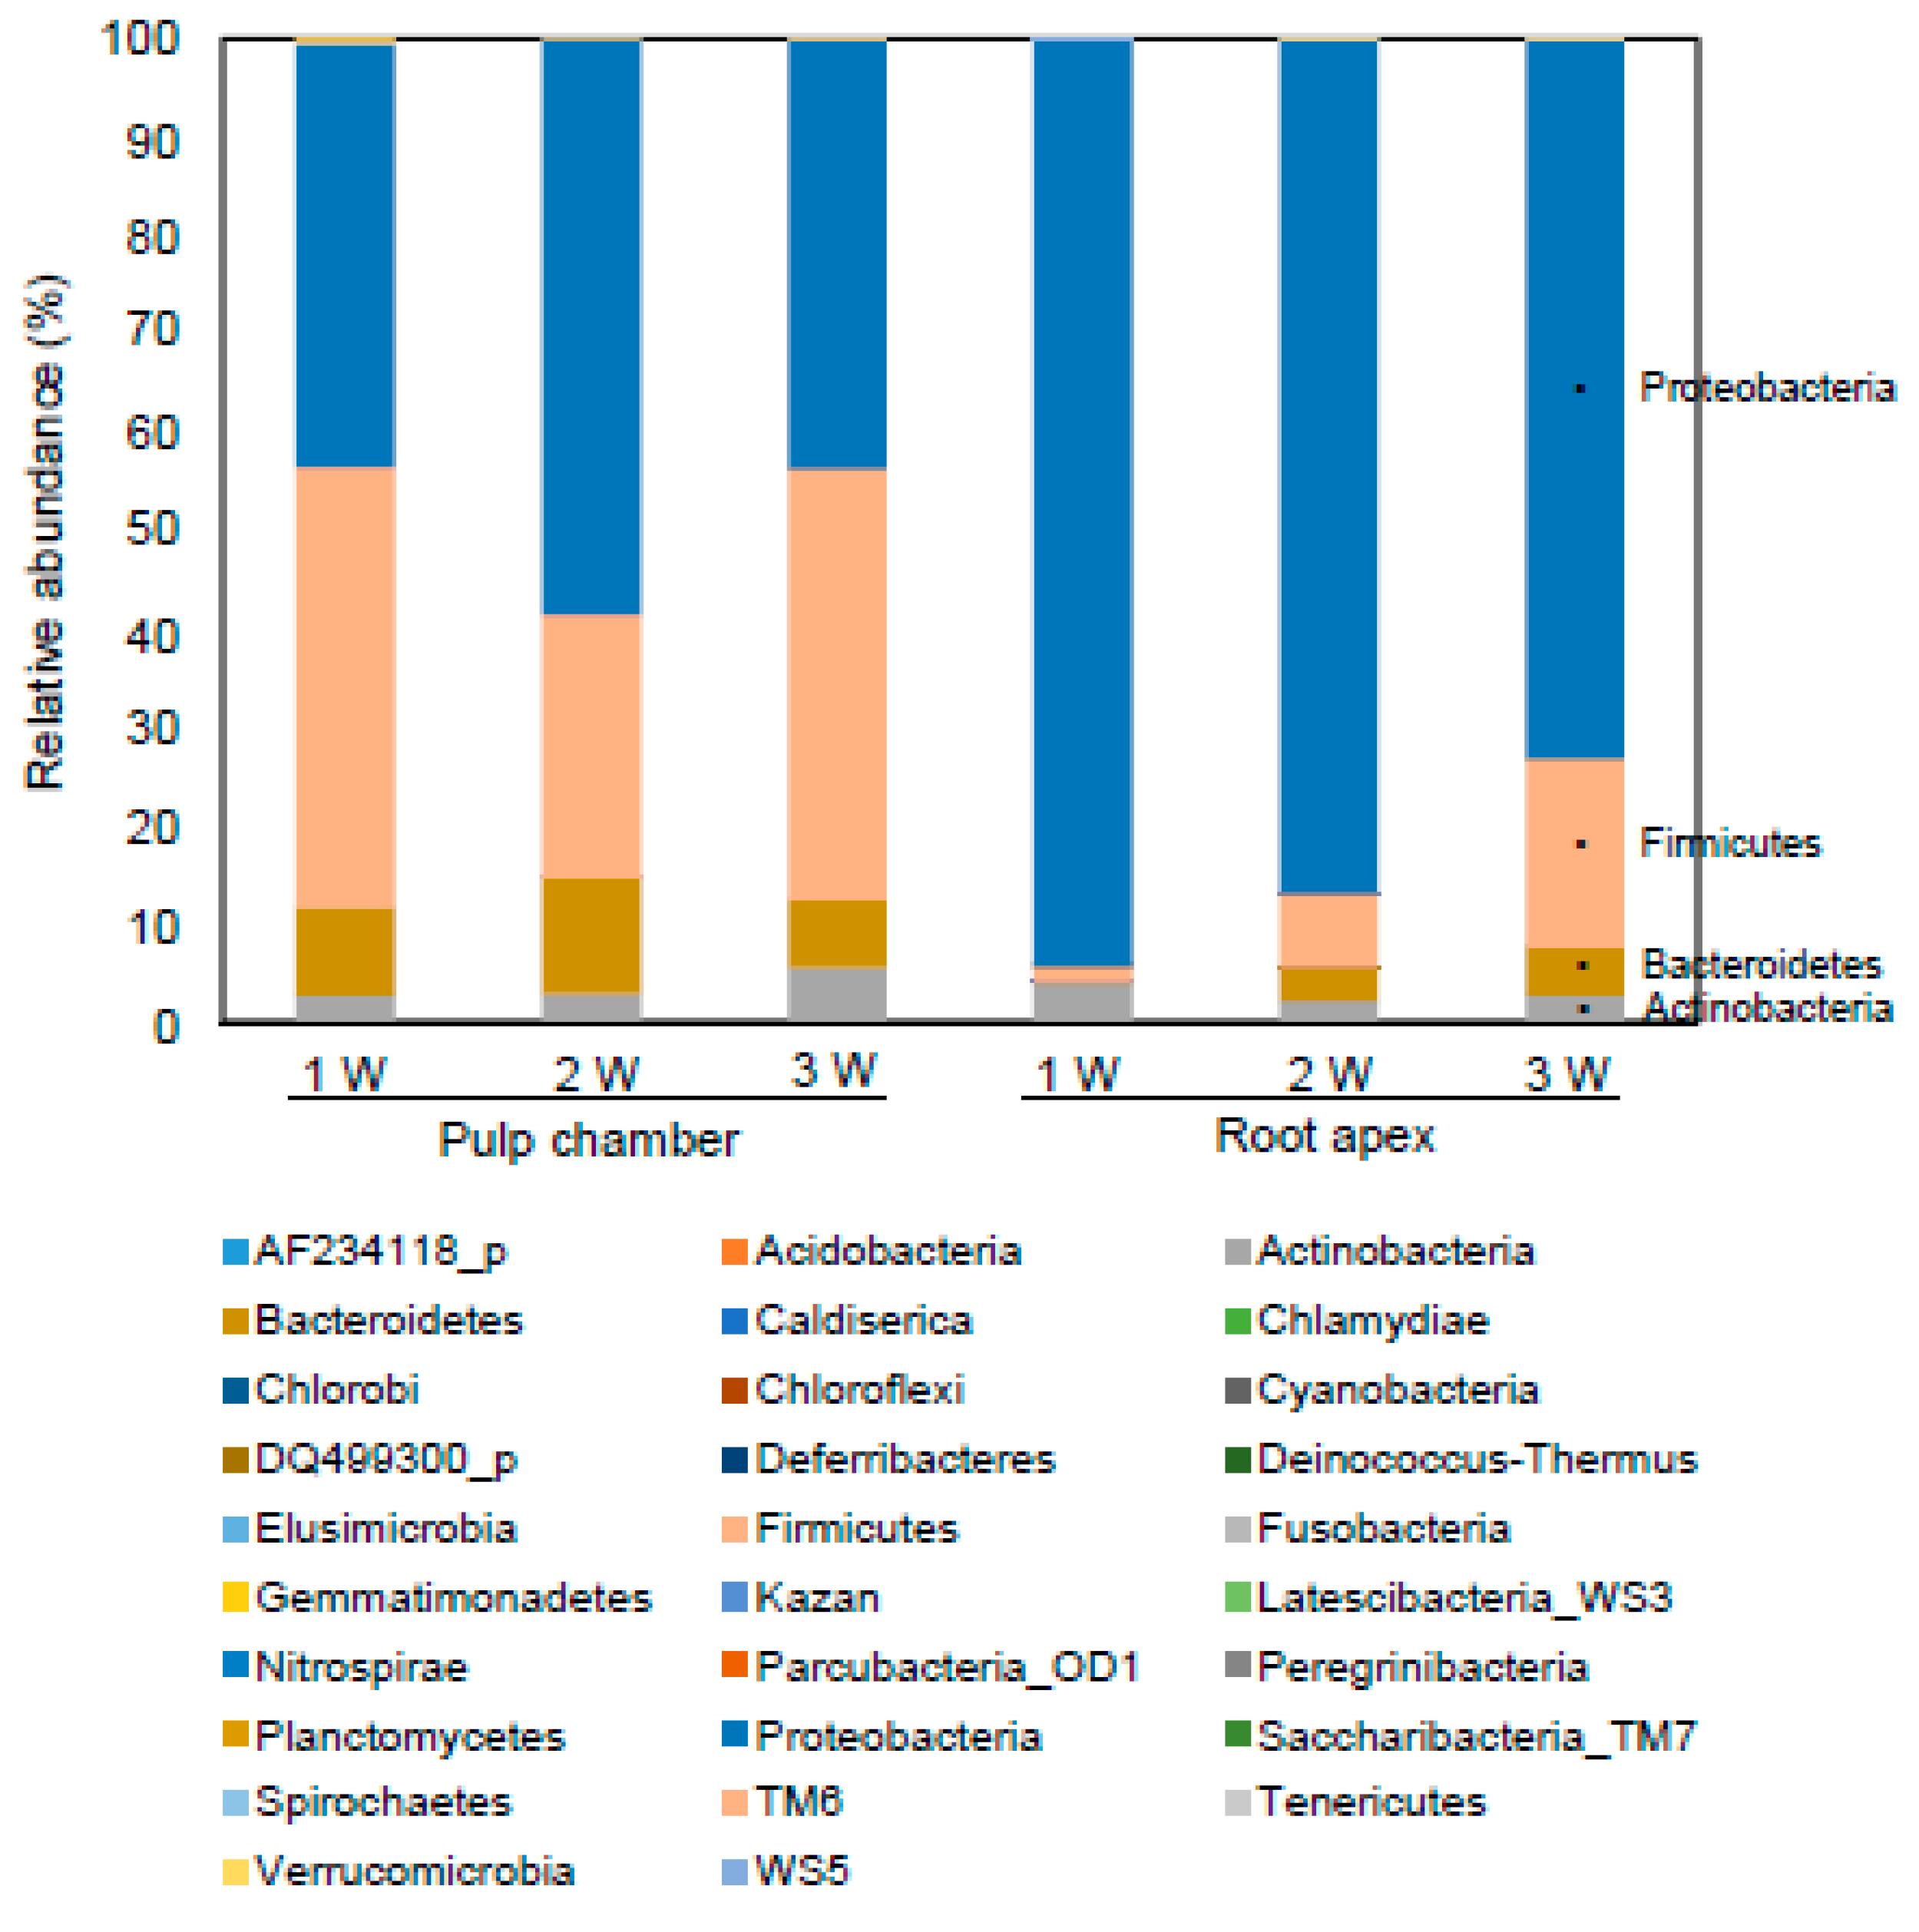
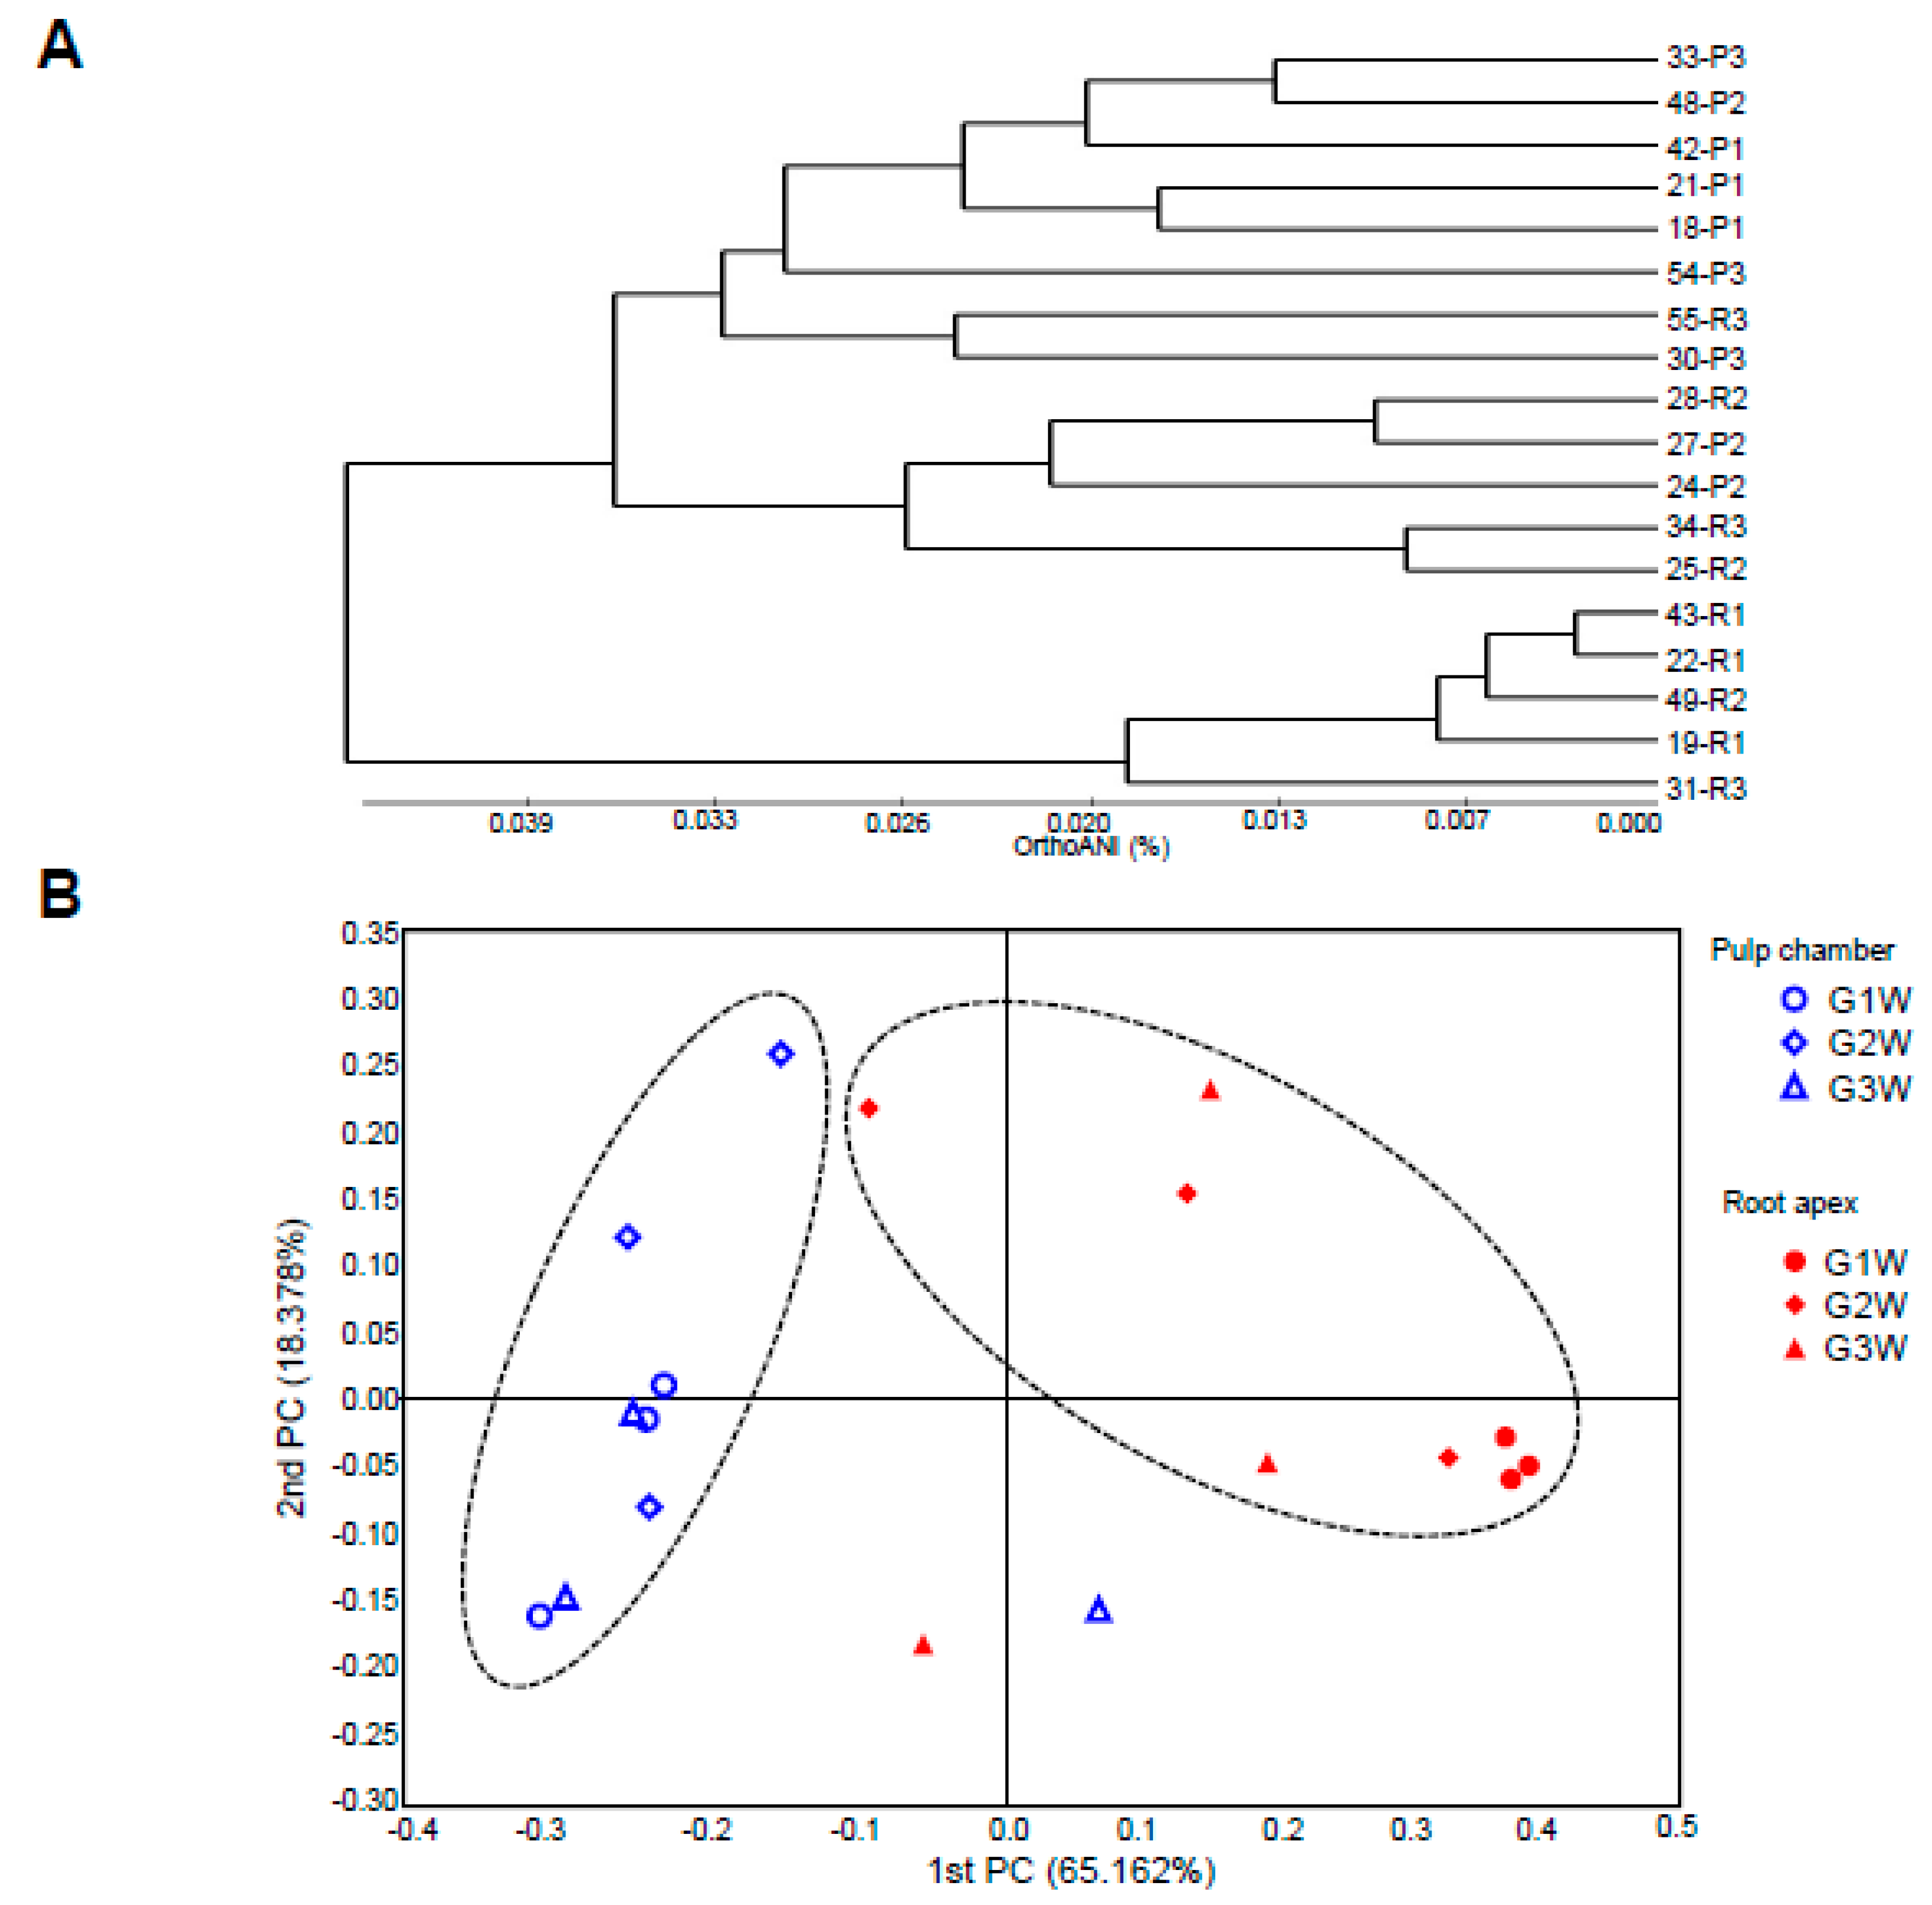
3.5. Pattern of Bacterial Community Based on Phylogenetic Analysis
4. Discussion
Supplementary Materials
Author Contributions
Funding
Acknowledgments
Conflicts of Interest
References
- Ricucci, D.; Siqueira, J.F., Jr. Biofilms and apical periodontitis: Study of prevalence and association with clinical and histopathologic findings. J. Endod. 2010, 36, 1277–1288. [Google Scholar] [CrossRef] [PubMed]
- Kirkevang, L.L.; Vaeth, M.; Horsted-Bindslev, P.; Bahrami, G.; Wenzel, A. Risk factors for developing apical periodontitis in a general population. Int. Endod. J. 2007, 40, 290–299. [Google Scholar] [CrossRef] [PubMed]
- Nair, P.N. Pathogenesis of apical periodontitis and the causes of endodontic failures. Crit. Rev. Oral Biol. Med. 2004, 15, 348–381. [Google Scholar] [CrossRef] [PubMed] [Green Version]
- Le Goff, A.; Bunetel, L.; Mouton, C.; Bonnaure-Mallet, M. Evaluation of root canal bacteria and their antimicrobial susceptibility in teeth with necrotic pulp. Oral Microbiol. Immunol. 1997, 12, 318–322. [Google Scholar] [CrossRef]
- Siqueira, J.F., Jr.; Rocas, I.N. Exploiting molecular methods to explore endodontic infections: Part 2--Redefining the endodontic microbiota. J. Endod. 2005, 31, 488–498. [Google Scholar] [CrossRef]
- Sundqvist, G. Associations between microbial species in dental root canal infections. Oral Microbiol. Immunol. 1992, 7, 257–262. [Google Scholar] [CrossRef]
- Siqueira, J.F., Jr.; Rocas, I.N. Community as the unit of pathogenicity: An emerging concept as to the microbial pathogenesis of apical periodontitis. Oral Surg. Oral Med. Oral Pathol. Oral Radiol. Endod. 2009, 107, 870–878. [Google Scholar] [CrossRef]
- Ozok, A.R.; Persoon, I.F.; Huse, S.M.; Keijser, B.J.; Wesselink, P.R.; Crielaard, W.; Zaura, E. Ecology of the microbiome of the infected root canal system: A comparison between apical and coronal root segments. Int. Endod. J. 2012, 45, 530–541. [Google Scholar] [CrossRef]
- Shin, J.M.; Luo, T.; Lee, K.H.; Guerreiro, D.; Botero, T.M.; McDonald, N.J.; Rickard, A.H. Deciphering Endodontic Microbial Communities by Next-generation Sequencing. J. Endod. 2018, 44, 1080–1087. [Google Scholar] [CrossRef]
- Santos, A.L.; Siqueira, J.F., Jr.; Rocas, I.N.; Jesus, E.C.; Rosado, A.S.; Tiedje, J.M. Comparing the bacterial diversity of acute and chronic dental root canal infections. PLoS ONE 2011, 6, e28088. [Google Scholar] [CrossRef] [Green Version]
- Tzanetakis, G.N.; Azcarate-Peril, M.A.; Zachaki, S.; Panopoulos, P.; Kontakiotis, E.G.; Madianos, P.N.; Divaris, K. Comparison of Bacterial Community Composition of Primary and Persistent Endodontic Infections Using Pyrosequencing. J. Endod. 2015, 41, 1226–1233. [Google Scholar] [CrossRef] [PubMed] [Green Version]
- Anderson, A.C.; Al-Ahmad, A.; Elamin, F.; Jonas, D.; Mirghani, Y.; Schilhabel, M.; Karygianni, L.; Hellwig, E.; Rehman, A. Comparison of the bacterial composition and structure in symptomatic and asymptomatic endodontic infections associated with root-filled teeth using pyrosequencing. PLoS ONE 2013, 8, e84960. [Google Scholar] [CrossRef] [PubMed] [Green Version]
- Clemente, J.C.; Ursell, L.K.; Parfrey, L.W.; Knight, R. The impact of the gut microbiota on human health: An integrative view. Cell 2012, 148, 1258–1270. [Google Scholar] [CrossRef] [PubMed] [Green Version]
- Stashenko, P.; Wang, C.Y.; Tani-Ishii, N.; Yu, S.M. Pathogenesis of induced rat periapical lesions. Oral Surg. Oral Med. Oral Pathol. 1994, 78, 494–502. [Google Scholar] [CrossRef]
- Halheit, S.; Benabdelkader, S. Rigid Image Registration using Mutual Informationand Wavelet Transform. In Proceedings of the International Conference on Signal, Image, Vision and their Applications (SIVA), Guelma, Algeria, 26–27 November 2018; pp. 1–6. [Google Scholar] [CrossRef]
- Khanmohammadia, S.; Adibeig, N.; Shanehbandy, S. An improved overlapping k-means clustering method for medical applications. Expert Syst. Appl. 2017, 67, 12–18. [Google Scholar] [CrossRef]
- Hore, S.; Chakraborty, S.; Chatterjee, S.; Dey, N.; Ashour, A.S.; Chung, L.V.; Le, D.-N. An Integrated Interactive Technique for Image Segmentation using Stack based Seeded Region Growing and Thresholding. Int. J. Electr. Comput. Eng. 2016, 6, 2773–2780. [Google Scholar]
- An, S.M.; Kim, M.J.; Seong, K.Y.; Jeong, J.S.; Kang, H.G.; Kim, S.Y.; Kim, D.S.; Kang, D.H.; Yang, S.Y.; An, B.S. Intracutaneous Delivery of Gelatins Reduces Fat Accumulation in Subcutaneous Adipose Tissue. Toxicol. Res. 2019, 35, 395–402. [Google Scholar] [CrossRef]
- Silva, R.A.B.; Sousa-Pereira, A.P.; Lucisano, M.P.; Romualdo, P.C.; Paula-Silva, F.W.G.; Consolaro, A.; Silva, L.A.B.; Nelson-Filho, P. Alendronate inhibits osteocyte apoptosis and inflammation via IL-6, inhibiting bone resorption in periapical lesions of ovariectomized rats. Int. Endod. J. 2020, 53, 84–96. [Google Scholar] [CrossRef]
- Hur, M.; Kim, Y.; Song, H.R.; Kim, J.M.; Choi, Y.I.; Yi, H. Effect of genetically modified poplars on soil microbial communities during the phytoremediation of waste mine tailings. Appl. Environ. Microbiol. 2011, 77, 7611–7619. [Google Scholar] [CrossRef] [Green Version]
- Park, O.J.; Yi, H.; Jeon, J.H.; Kang, S.S.; Koo, K.T.; Kum, K.Y.; Chun, J.; Yun, C.H.; Han, S.H. Pyrosequencing Analysis of Subgingival Microbiota in Distinct Periodontal Conditions. J. Dent. Res. 2015, 94, 921–927. [Google Scholar] [CrossRef]
- Yamasaki, M.; Kumazawa, M.; Kohsaka, T.; Nakamura, H.; Kameyama, Y. Pulpal and periapical tissue reactions after experimental pulpal exposure in rats. J. Endod. 1994, 20, 13–17. [Google Scholar] [CrossRef]
- Santa-Rosa, C.C.; Thebit, M.M.; Maciel, K.F.; Brito, L.C.N.; Vieira, L.Q.; Ribeiro-Sobrinho, A.P. Evaluation of chemokines and receptors in gnotobiotic root canal infection by F. nucleatum and E. faecalis. Braz. Oral Res. 2018, 32, e120. [Google Scholar] [CrossRef] [PubMed] [Green Version]
- Wu, Y.; Sun, H.; Yang, B.; Liu, X.; Wang, J. 5-Lipoxygenase Knockout Aggravated Apical Periodontitis in a Murine Model. J. Dent. Res. 2018, 97, 442–450. [Google Scholar] [CrossRef] [PubMed]
- Chen, S.; Lei, H.; Luo, Y.; Jiang, S.; Zhang, M.; Lv, H.; Cai, Z.; Huang, X. Micro-CT analysis of chronic apical periodontitis induced by several specific pathogens. Int. Endod. J. 2019, 52, 1028–1039. [Google Scholar] [CrossRef] [PubMed]
- Kakehashi, S.; Stanley, H.R.; Fitzgerald, R.J. The Effects of Surgical Exposures of Dental Pulps in Germ-Free and Conventional Laboratory Rats. Oral Surg. Oral Med. Oral Pathol. 1965, 20, 340–349. [Google Scholar] [CrossRef]
- Lin, S.K.; Hong, C.Y.; Chang, H.H.; Chiang, C.P.; Chen, C.S.; Jeng, J.H.; Kuo, M.Y. Immunolocalization of macrophages and transforming growth factor-beta 1 in induced rat periapical lesions. J. Endod. 2000, 26, 335–340. [Google Scholar] [CrossRef]
- Anan, H.; Akamine, A.; Hara, Y.; Maeda, K.; Hashiguchi, I.; Aono, M. A histochemical study of bone remodeling during experimental apical periodontitis in rats. J. Endod. 1991, 17, 332–337. [Google Scholar] [CrossRef]
- Akamine, A.; Anan, H.; Hamachi, T.; Maeda, K. A histochemical study of the behavior of macrophages during experimental apical periodontitis in rats. J. Endod. 1994, 20, 474–478. [Google Scholar] [CrossRef]
- Hyde, E.R.; Luk, B.; Cron, S.; Kusic, L.; McCue, T.; Bauch, T.; Kaplan, H.; Tribble, G.; Petrosino, J.F.; Bryan, N.S. Characterization of the rat oral microbiome and the effects of dietary nitrate. Free Radic. Biol. Med. 2014, 77, 249–257. [Google Scholar] [CrossRef]
- Keskin, C.; Demiryurek, E.O.; Onuk, E.E. Pyrosequencing Analysis of Cryogenically Ground Samples from Primary and Secondary/Persistent Endodontic Infections. J. Endod. 2017, 43, 1309–1316. [Google Scholar] [CrossRef]
- Siqueira, J.F., Jr.; Alves, F.R.; Rocas, I.N. Pyrosequencing analysis of the apical root canal microbiota. J. Endod. 2011, 37, 1499–1503. [Google Scholar] [CrossRef] [PubMed]
- Siqueira, J.F., Jr.; Antunes, H.S.; Rocas, I.N.; Rachid, C.T.; Alves, F.R. Microbiome in the Apical Root Canal System of Teeth with Post-Treatment Apical Periodontitis. PLoS ONE 2016, 11, e0162887. [Google Scholar] [CrossRef] [PubMed] [Green Version]
- Qian, W.; Ma, T.; Ye, M.; Li, Z.; Liu, Y.; Hao, P. Microbiota in the apical root canal system of tooth with apical periodontitis. BMC Genom. 2019, 20, 189. [Google Scholar] [CrossRef] [PubMed] [Green Version]
- Gomes, B.; Herrera, D.R. Etiologic role of root canal infection in apical periodontitis and its relationship with clinical symptomatology. Braz. Oral Res. 2018, 32, e69. [Google Scholar] [CrossRef] [Green Version]

| Total Valid Reads | Average Read Lengths | No. of OTUs | Shannon Diversity Index | No. of Phylum | No. of Genus | No. of Species | |
|---|---|---|---|---|---|---|---|
| 42-P1 | 65507 | 419.3 bp | 212 | 3.39 | 5 | 113 | 184 |
| 21-P1 | 72343 | 425.2 bp | 99 | 2.35 | 5 | 61 | 95 |
| 18-P1 | 70389 | 424.9 bp | 97 | 2.66 | 5 | 51 | 84 |
| 48-P2 | 65178 | 422.1 bp | 194 | 2.99 | 6 | 109 | 180 |
| 27-P2 | 71754 | 423.9 bp | 166 | 1.78 | 4 | 91 | 141 |
| 24-P2 | 66468 | 420.2 bp | 354 | 2.83 | 5 | 149 | 328 |
| 54-P3 | 64866 | 415.1 bp | 337 | 3.51 | 6 | 136 | 310 |
| 33-P3 | 67652 | 421.7 bp | 157 | 2.69 | 5 | 95 | 145 |
| 30-P3 | 89946 | 418.3 bp | 141 | 2.47 | 9 | 88 | 137 |
| 43-R1 | 74667 | 410.7 bp | 199 | 1.09 | 15 | 138 | 196 |
| 22-R1 | 76408 | 411.5 bp | 192 | 1.03 | 13 | 139 | 186 |
| 19-R1 | 67556 | 412.9 bp | 168 | 1.04 | 14 | 131 | 166 |
| 49-R2 | 64582 | 410.7 bp | 203 | 1.23 | 12 | 151 | 202 |
| 28-R2 | 84751 | 421.0 bp | 205 | 2.07 | 11 | 117 | 185 |
| 25-R2 | 79475 | 418.2 bp | 327 | 1.83 | 14 | 205 | 319 |
| 55-R3 | 76542 | 417.5 bp | 294 | 2.83 | 9 | 176 | 284 |
| 34-R3 | 68434 | 418.9 bp | 235 | 1.43 | 15 | 164 | 229 |
| 31-R3 | 80190 | 414.3 bp | 190 | 2.00 | 13 | 135 | 188 |
© 2020 by the authors. Licensee MDPI, Basel, Switzerland. This article is an open access article distributed under the terms and conditions of the Creative Commons Attribution (CC BY) license (http://creativecommons.org/licenses/by/4.0/).
Share and Cite
Park, O.-J.; Jeong, M.-H.; Lee, E.-H.; Cho, M.-R.; Hwang, J.; Cho, S.; Yun, C.-H.; Han, S.H.; Kim, S.-Y. A Pilot Study of Chronological Microbiota Changes in a Rat Apical Periodontitis Model. Microorganisms 2020, 8, 1174. https://doi.org/10.3390/microorganisms8081174
Park O-J, Jeong M-H, Lee E-H, Cho M-R, Hwang J, Cho S, Yun C-H, Han SH, Kim S-Y. A Pilot Study of Chronological Microbiota Changes in a Rat Apical Periodontitis Model. Microorganisms. 2020; 8(8):1174. https://doi.org/10.3390/microorganisms8081174
Chicago/Turabian StylePark, Ok-Jin, Moon-Hee Jeong, Eun-Hye Lee, Mi-Ran Cho, Jaehong Hwang, Seungryong Cho, Cheol-Heui Yun, Seung Hyun Han, and Sun-Young Kim. 2020. "A Pilot Study of Chronological Microbiota Changes in a Rat Apical Periodontitis Model" Microorganisms 8, no. 8: 1174. https://doi.org/10.3390/microorganisms8081174
APA StylePark, O.-J., Jeong, M.-H., Lee, E.-H., Cho, M.-R., Hwang, J., Cho, S., Yun, C.-H., Han, S. H., & Kim, S.-Y. (2020). A Pilot Study of Chronological Microbiota Changes in a Rat Apical Periodontitis Model. Microorganisms, 8(8), 1174. https://doi.org/10.3390/microorganisms8081174