Article

Evaluation of Osmotic Dehydration Process in Plant Tissue with Low-Field Magnetic Resonance Imaging Enhanced with Paramagnetic Ions

by
Mateusz Suchanek
1,* and
Zbigniew Olejniczak
2,3
1
Department of Soil Science and Agrophysics, University of Agriculture in Krakow, Mickiewicza 21, 31-120 Kraków, Poland
2
Institute of Nuclear Physics, Polish Academy of Sciences, Radzikowskiego 152, 31-342 Kraków, Poland
3
Faculty of Physics, Astronomy and Applied Computer Science, Jagiellonian University, Łojasiewicza 11, 30-348 Kraków, Poland
*
Author to whom correspondence should be addressed.
Processes 2020, 8(8), 887; https://doi.org/10.3390/pr8080887
Submission received: 3 July 2020 / Revised: 18 July 2020 / Accepted: 21 July 2020 / Published: 24 July 2020
(This article belongs to the Section Food Process Engineering)

Abstract

:
A novel, non-invasive low-field Magnetic Resonance Imaging (MRI) technique for studying the osmotic dehydration process in fruits and vegetables is proposed. A saturated solution of paramagnetic salt is used as both the osmotic substance and the contrast agent for MRI. Using courgette as an example, it is demonstrated that the results obtained by the new method are consistent with the standard mass transport analysis, but additional information about the spatial distribution of osmotic substance within the sample and its evolution in time is provided. The MRI method is much more efficient in terms of experiment time and the amount of biological material needed. Possible extensions of the technique to improve its accuracy are discussed.

Graphical Abstract

1. Introduction

Processes related to the osmotic drying of fruits and vegetables are currently being extensively investigated, as evidenced by recent review papers [1,2,3]. Osmosis leads to the transport of water from the interior of the sample to the hypertonic solution (dehydration), with simultaneous transport of the osmotic substance to the inside of the sample (impregnation). The leaching out of natural soluble substances from the sample can be also observed during this process. In general, osmosis occurs when osmotic pressure is generated on both sides of a semi-permeable membrane due to the difference in chemical potentials [4].
Courgette and pumpkin are relatively large vegetables, from which it is easy to extract homogeneous samples. Therefore, they are the subject of many investigations. For example, Kowalska et al. studied the effect of courgette blanching and freezing on osmotic dehydration [5], while Mayor et al. examined the microstructural changes during osmotic dehydration of the tissue [6]. Structural studies of courgette using the Magnetic Resonance Imaging (MRI) method were performed for the first time by Duce et al., who obtained high-resolution images of the tissue. They found that MRI was sensitive enough to monitor structural changes caused by freezing and thawing, which eventually led to the cell rupturing [7]. Similarly, Rossi et al. used an MRI technique to study the water distribution and morphology in zucchini, which was fertilized in various ways [8].
However, reports on the use of the MRI method in the context of osmotic dehydration appear sporadically, and so far, they only concern fruit. Evans et al. obtained profiles of the proton T2 relaxation time across a strawberry slice that was subjected to air-drying and osmotic dehydration in a sugar solution. Since the T2 parameter depends on water mobility, it becomes longer when the water in the medium is less bonded. As expected, a decrease in T2 was observed during both processes [9]. The effect was confirmed by Derossi et al., who examined the mass transfer during the osmotic dehydration of apples. The T2 maps created from the series of MRI images clearly showed a decrease in T2 during the osmotic dehydration process. Furthermore, by plotting T2 against the penetration depth, it was proved that all layers of the apple tissue were involved in the dehydration process at the same time [10].
Additional insight into the osmotic dehydration process can be obtained by studying the spatial distribution of the osmotic substance within the sample and its evolution in time. In order to observe this directly, in the present study we use a saturated solution of copper sulphate, which serves as both the osmotic agent and the negative contrast agent in the low-field MRI experiments [11]. We aim to evaluate the mass transfer after the osmotic dehydration of courgette and to calculate the diffusion coefficient of the osmotic substance from the MRI measurements.

2. Materials and Methods

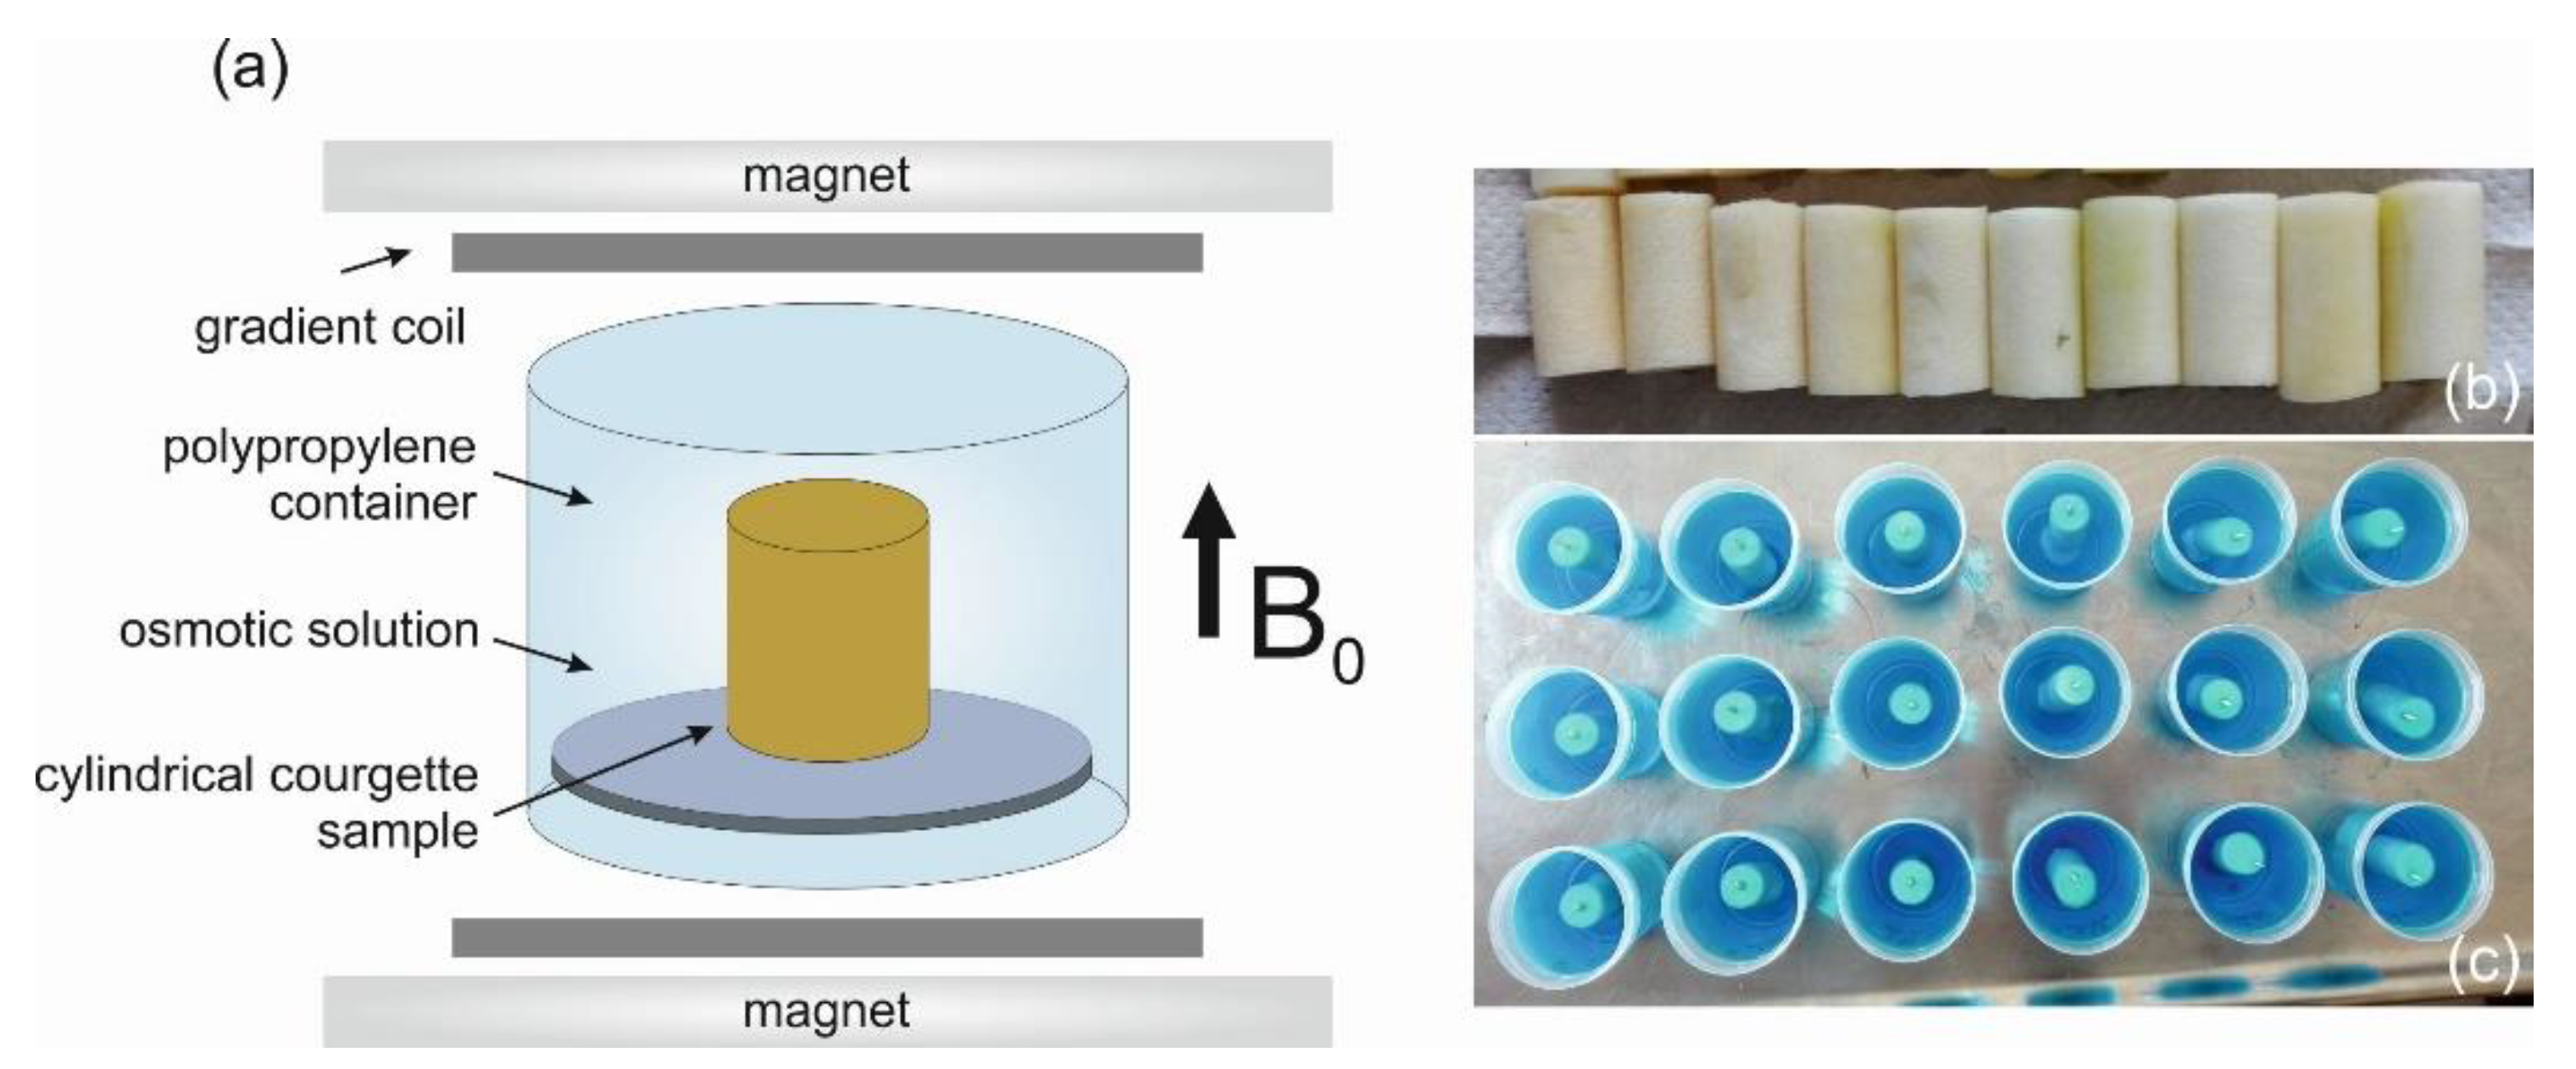
2.1. Sample Preparation

The ripe courgette (4 kg) of Astra Polka variety were purchased at the local market in Krakow, Poland and processed the same day. After washing and manual peeling, 28 cylindrical samples, 20 mm in diameter and 40 mm in height, were cut from the centres of the fruits using a stainless-steel cork borer. To ensure maximum structural homogeneity of the samples, the tissue from the fleshy mesocarp was taken, parallel to the main axis of the fruit. The average weight of fresh samples was 10.67 ± 0.50 g. Analytical-grade sulphate pentahydrate (CuSO4 × 5 H2O) was purchased from Sigma-Aldrich (Poznan, Poland) and used to prepare the osmotic solution.

2.2. Osmotic Solution Preparation

The osmotic solution was prepared by dissolving CuSO4 in distilled water at 37 °C. The final salt concentration was 21% (w/w), which was close to a saturated solution at room temperature. The solution to sample mass ratio of 11:1 (w/w) was maintained in all experiments.

2.3. Osmotic Dehydration

The osmotic solution was put into a 120 mL plastic vessel with the sample inside. A thin nonmagnetic needle was mounted inside the vessel and driven axially through the centre of the courgette sample so that it was attached to the base of the container and completely immersed. In order to ensure that the geometry of the sample did not change over time, that is, that there was no strong shrinkage effect, the maximum dipping time was limited to 8 h. The sample was held in the osmotic solution for predefined times of 1, 2, 3, 4, 5 and 8 h. For each dipping time, three samples were used, and the average results were calculated. Each sample was weighed before being subjected to the osmotic dehydration process. After the defined time, the sample was removed from the solution, gently dried with a paper towel to remove the excess solvent adhered to the sample surface and weighed. Afterwards, the courgette was dried in an oven for two days at a temperature of 50 °C, and the final weight of the product after the heat treatment was determined. The samples were dried until a constant weight was reached.
In order to determine the initial dry mass of a treated courgette sample, which was needed in further analysis, a separate experiment was carried out using 10 control samples. These were weighed, then dried in an oven for two days at 50 °C and weighed again. This allowed us to qualify what percentage of wet mass ( M o ) constitutes dry mass ( m o ) for a homogeneous courgette tissue. The average value for 10 samples was equal to (4.3 ± 0.1)%. Thereafter, the initial dry mass of each treated sample was calculated using the equation m 0 = m % M 0 100 % , where m % is the percentage of the initial wet mass of the fresh courgette, determined from the experiment described above.

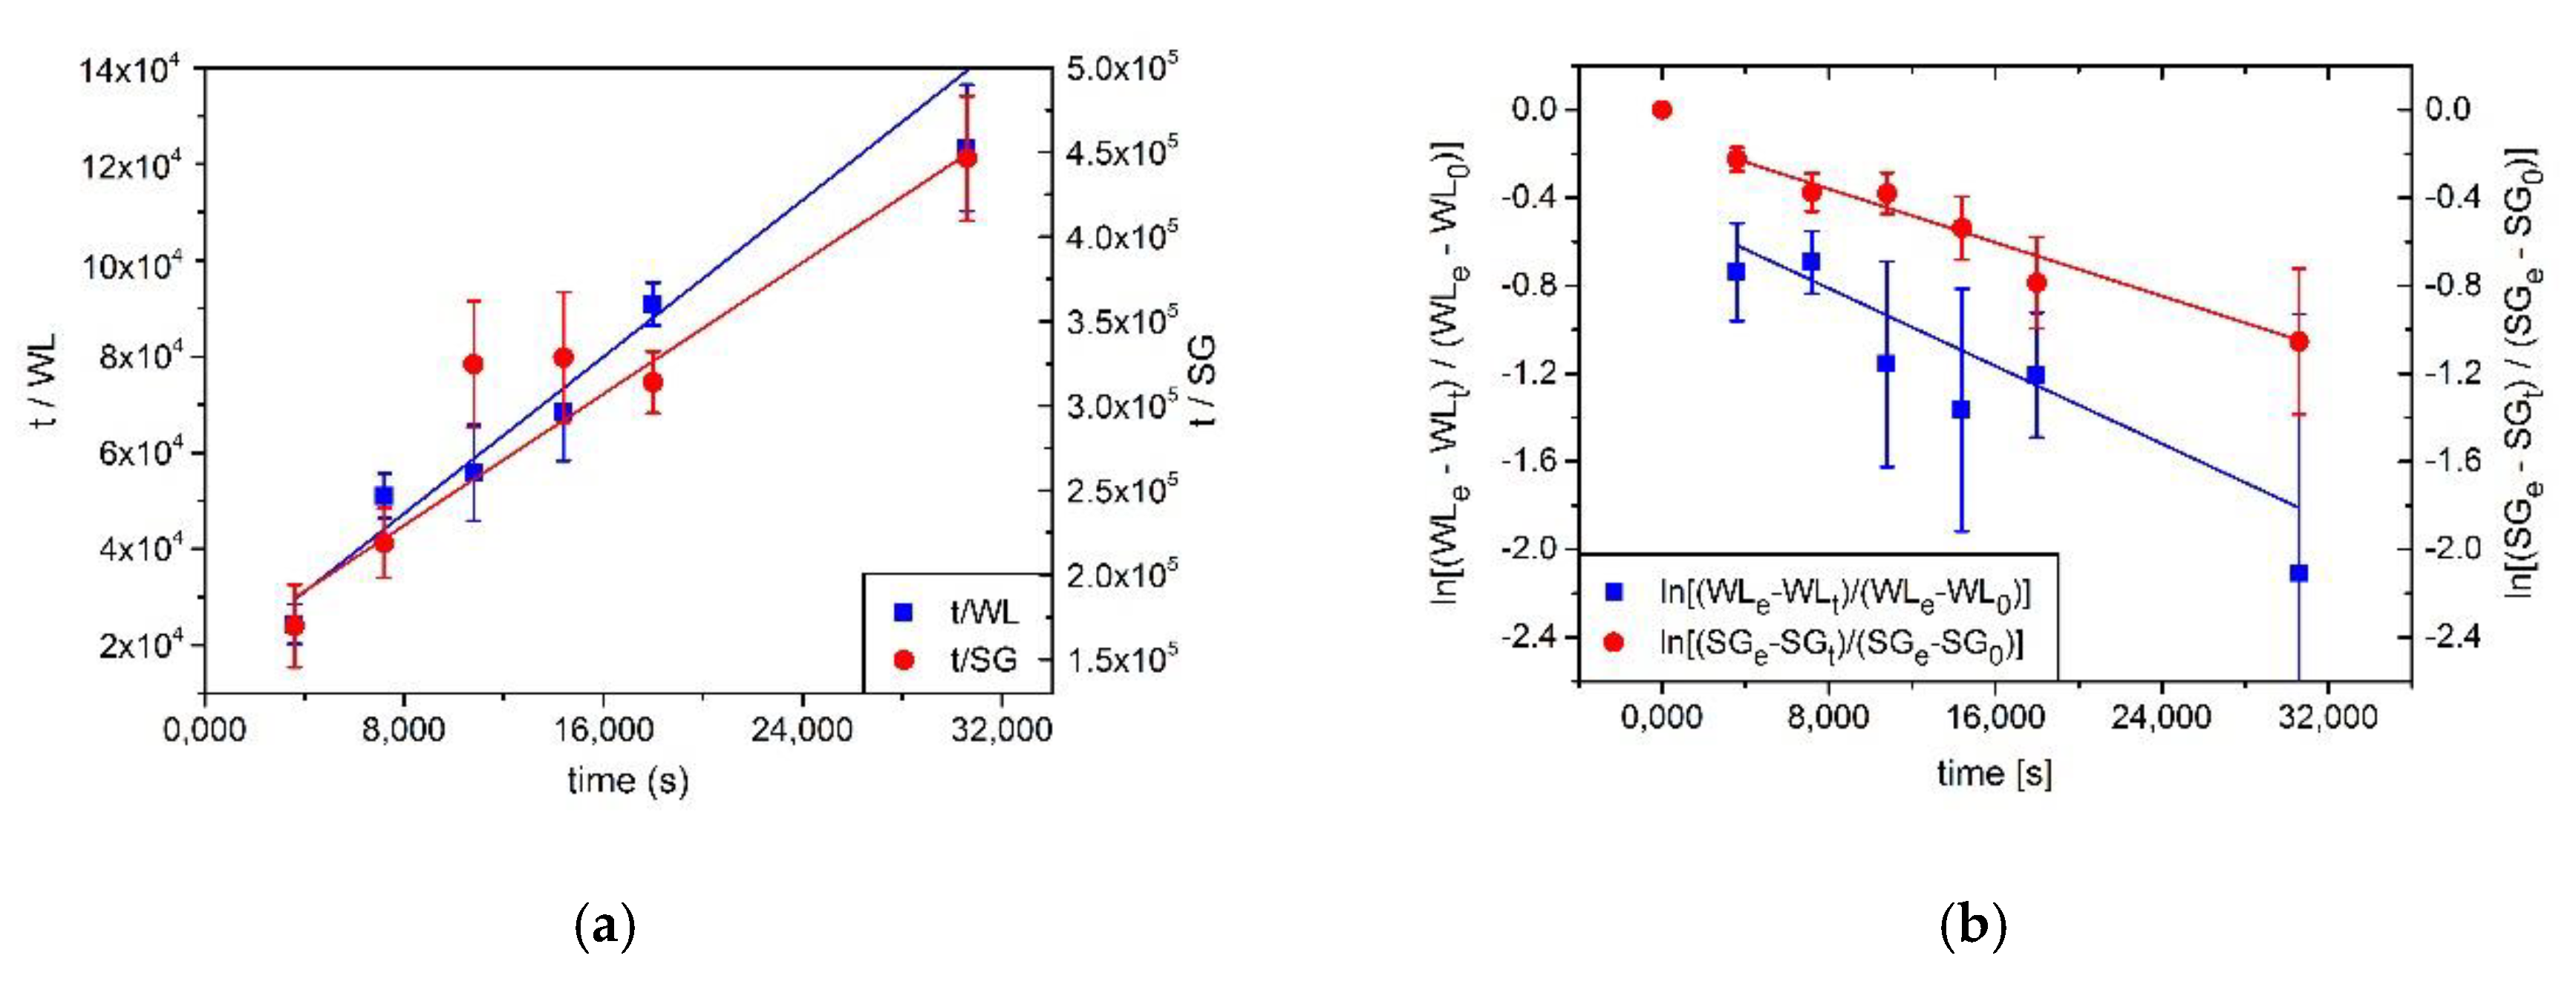
2.4. Mass Transfer Modelling

The mass transfer between the sample and the osmotic solution was evaluated using the following parameters: water loss ( W L , g/g wet basis) and solids gain ( S G , g/g wet basis) [12].
W L = ( M o m o ) ( M t m t ) M o ,
S G = m t m o M o ,
where M o denotes the initial mass of the fresh courgette sample, M t is the mass of the courgette sample after selected time t of osmotic dehydration (OD) treatment, m t is the dry mass of the courgette sample after selected time t of OD treatment and m o is the initial dry mass of the courgette sample. All values are expressed in grams. We used the kinetic model developed by Azuara et al. to determine the W L and S G values in the equilibrium state (i.e., W L e and S G e , respectively) [13]. The Azuara model can predict water loss and solid gain at equilibrium conditions on the basis of experimental data obtained during a short-duration of osmosis. W L e and S G e parameters are related to the fractions of water loss ( W L t ) and solid gain ( S G t ) at any time t , by the following equations:
t W L t = 1 S 1 ( W L e ) + t W L e ,
t S G t = 1 S 2 ( S G e ) + t S G e ,
where 1 / S 1 and 1 / S 2 are the intercept values obtained by fitting the above expressions to linear functions, while 1 / W L e and 1 / S G e are the corresponding slopes.
Next, a mathematical model based on Fick′s second law for an unsteady state mass transfer was used to determine the water and solute diffusivities during osmotic dehydration [14]. The following assumptions were made: (i) homogeneous structure and uniform initial water and solid distribution within the sample, (ii) constant salt concentration during the dehydration process, (iii) no shrinkage during osmotic dehydration, (iv) negligible leaching of solids from the sample to the solution and (v) negligible external resistance to mass transfer. For the above assumptions and for a finite cylinder geometry, a simple analytical solution of Fick′s equation was proposed by Hamedi et al. [15] and is given by the following equation:
k m ( W L S G ) = 0.56 e 8.25 d 2 D e ( W L S G ) t ,
where:
k m ( W L ) = W L e W L t W L e W L 0 ,
or
k m ( S G ) = S G e S G t S G e S G 0 ,
are mass transfer coefficients describing the water flow from the sample and solute accumulation within the sample, respectively, d is the diameter of the cylinder, D e ( W L ) and D e ( S G ) are the corresponding effective diffusion coefficients of water and solutes. W L 0 and S G 0 from Equations (1) and (2) are both equal to zero at the initial moment.

2.5. Magnetic Resonance Imaging

2.5.1. MRI Protocol

The mass transfer after osmotic dehydration of courgette was also evaluated using a low-field MRI method. The MRI experiments were carried out on a home-made low-field MRI scanner, using the protocol reported previously [16,17]. The central component of the system was a temperature-stabilized 88 mT permanent magnet (AMAG, Krakow, Poland), with a homogeneous spherical operating volume of 10 cm diameter. Magnetic field gradients were generated by bi-planar, actively shielded gradient coils (Institute for Biodiagnostics, NRC, Winnipeg, MB, Canada), with an efficiency of 30 mT/m in all three directions. The radio-frequency solenoidal coil had an 8 cm diameter and was tuned to the resonance frequency of 3.74 MHz. All components of the system were computer-controlled by an MR4200 console (Magnetic Resonance Research System, Surrey, UK). The magnetic field of the scanner was in the vertical direction and the rf coil used was a solenoid tube that was easily accessible from the side of the scanner. The internal diameter of the coil, at 8 cm, was large enough to incorporate the 120 mL plastic vessel containing the osmotic solution with the sample. The plastic vessel was centred inside the coil using a sponge. The size of the coil and the sample container enabled easy positioning and orientation of the object in the scanner. A fast spin echo (FSE) imaging sequence with eight consecutive echoes was applied with the following parameters: field of view (FOV), 100 mm × 100 mm; matrix size, 128 pixels × 128 pixels; slice thickness, 16 mm chosen from the centre of the cylindrical sample, perpendicular to the cylinder axis; echo time (TE), 19 ms; effective echo time (TEE), 38 ms; repetition time (TR), 300 ms; 16 acquisitions; and 11 min total acquisition time.

2.5.2. Contrast Agent

The copper sulphate pentahydrate solution (21% (w/w)) used for osmotic dehydration studies also served as a contrast agent (CA) in the MRI investigations. The presence of paramagnetic ions in the solution strongly affected the T1 and T2 relaxation times of the neighbouring water, providing the contrast mechanism in images obtained by properly tailored imaging protocol. However, the enhancement effect depends on the magnetic field strength and the concentration of CA within the studied tissues [18]. At a low CA concentration in the tissue, T1 becomes shorter, making the tissue appear bright in the Magnetic Resonance (MR) image. At a higher CA concentration, the T2 relaxation time is dramatically reduced due to susceptibility effects, which leads to smaller signal intensity in MR images. The latter is called T2-weighted MRI, and this negative contrast mechanism was used in the present low-field studies, allowing us to distinguish parts of the tissue containing low and high concentrations of CA, which appeared in the image as bright and dark segments, respectively.
Three cylindrical courgette samples were prepared for the MRI measurements, and the average results were used in the further numerical analysis. The experiment protocol started with placing the sample inside the plastic vessel containing the osmotic solution as shown in Figure 1. Next, the MR images of the central transverse slice were acquired for each sample. First, a pre-contrast image was measured immediately after placing the sample in the osmotic solution (t = 0), followed by the post-contrast images acquired after immersion in the CuSO4 osmotic solution for 1, 2, 3, 4, 5 and 8 h. During each experiment series, the sample was constantly immersed in the osmotic solution at a fixed position in the MRI scanner.

2.6. Image Analysis

All MRI data were exported to a PC workstation and analysed using the open source program ImageJ to process the images [19]. The volume determination was based on the planimetric technique, which is analogous to the one that is used in clinical trials [20,21]. We assumed that in the MR image there were two separate regions within the courgette sample, one with CA and another without CA, which appeared as dark and light areas, respectively. The signal in the former was attenuated due to the reduction of T2. As a result of the CA diffusion into the tissue, the light area decreased in time. The courgette boundaries in the cross-sectional MR image were traced manually and the ImageJ program calculated the number of pixels within the boundary automatically. This allowed us to estimate the area, and multiplication by the slice thickness yielded the volume of the tissue that was not affected by the CA agent. By averaging the data from three separate experiments, the time-dependent volume V ( t ) , t = 0, 1, 2, 3, 4, 5, 8 was determined. Finally, the fractional volume α t occupied by the CA can be obtained as α t = 1 ( V ( t ) / V ( 0 ) ) .
There should be a linear dependence between the S G t and α t parameters that were determined by the mass transport analysis and MRI, respectively. This can be checked by fitting the data to the following equation:
S G t = R 1 α t + R 2 ,
where R 1 and R 2 are linear regression coefficients, slope and intercept, respectively. This allowed us to determine the diffusion coefficient of the osmotic substance from the MRI results, using Equations (5) and (7).

3. Results

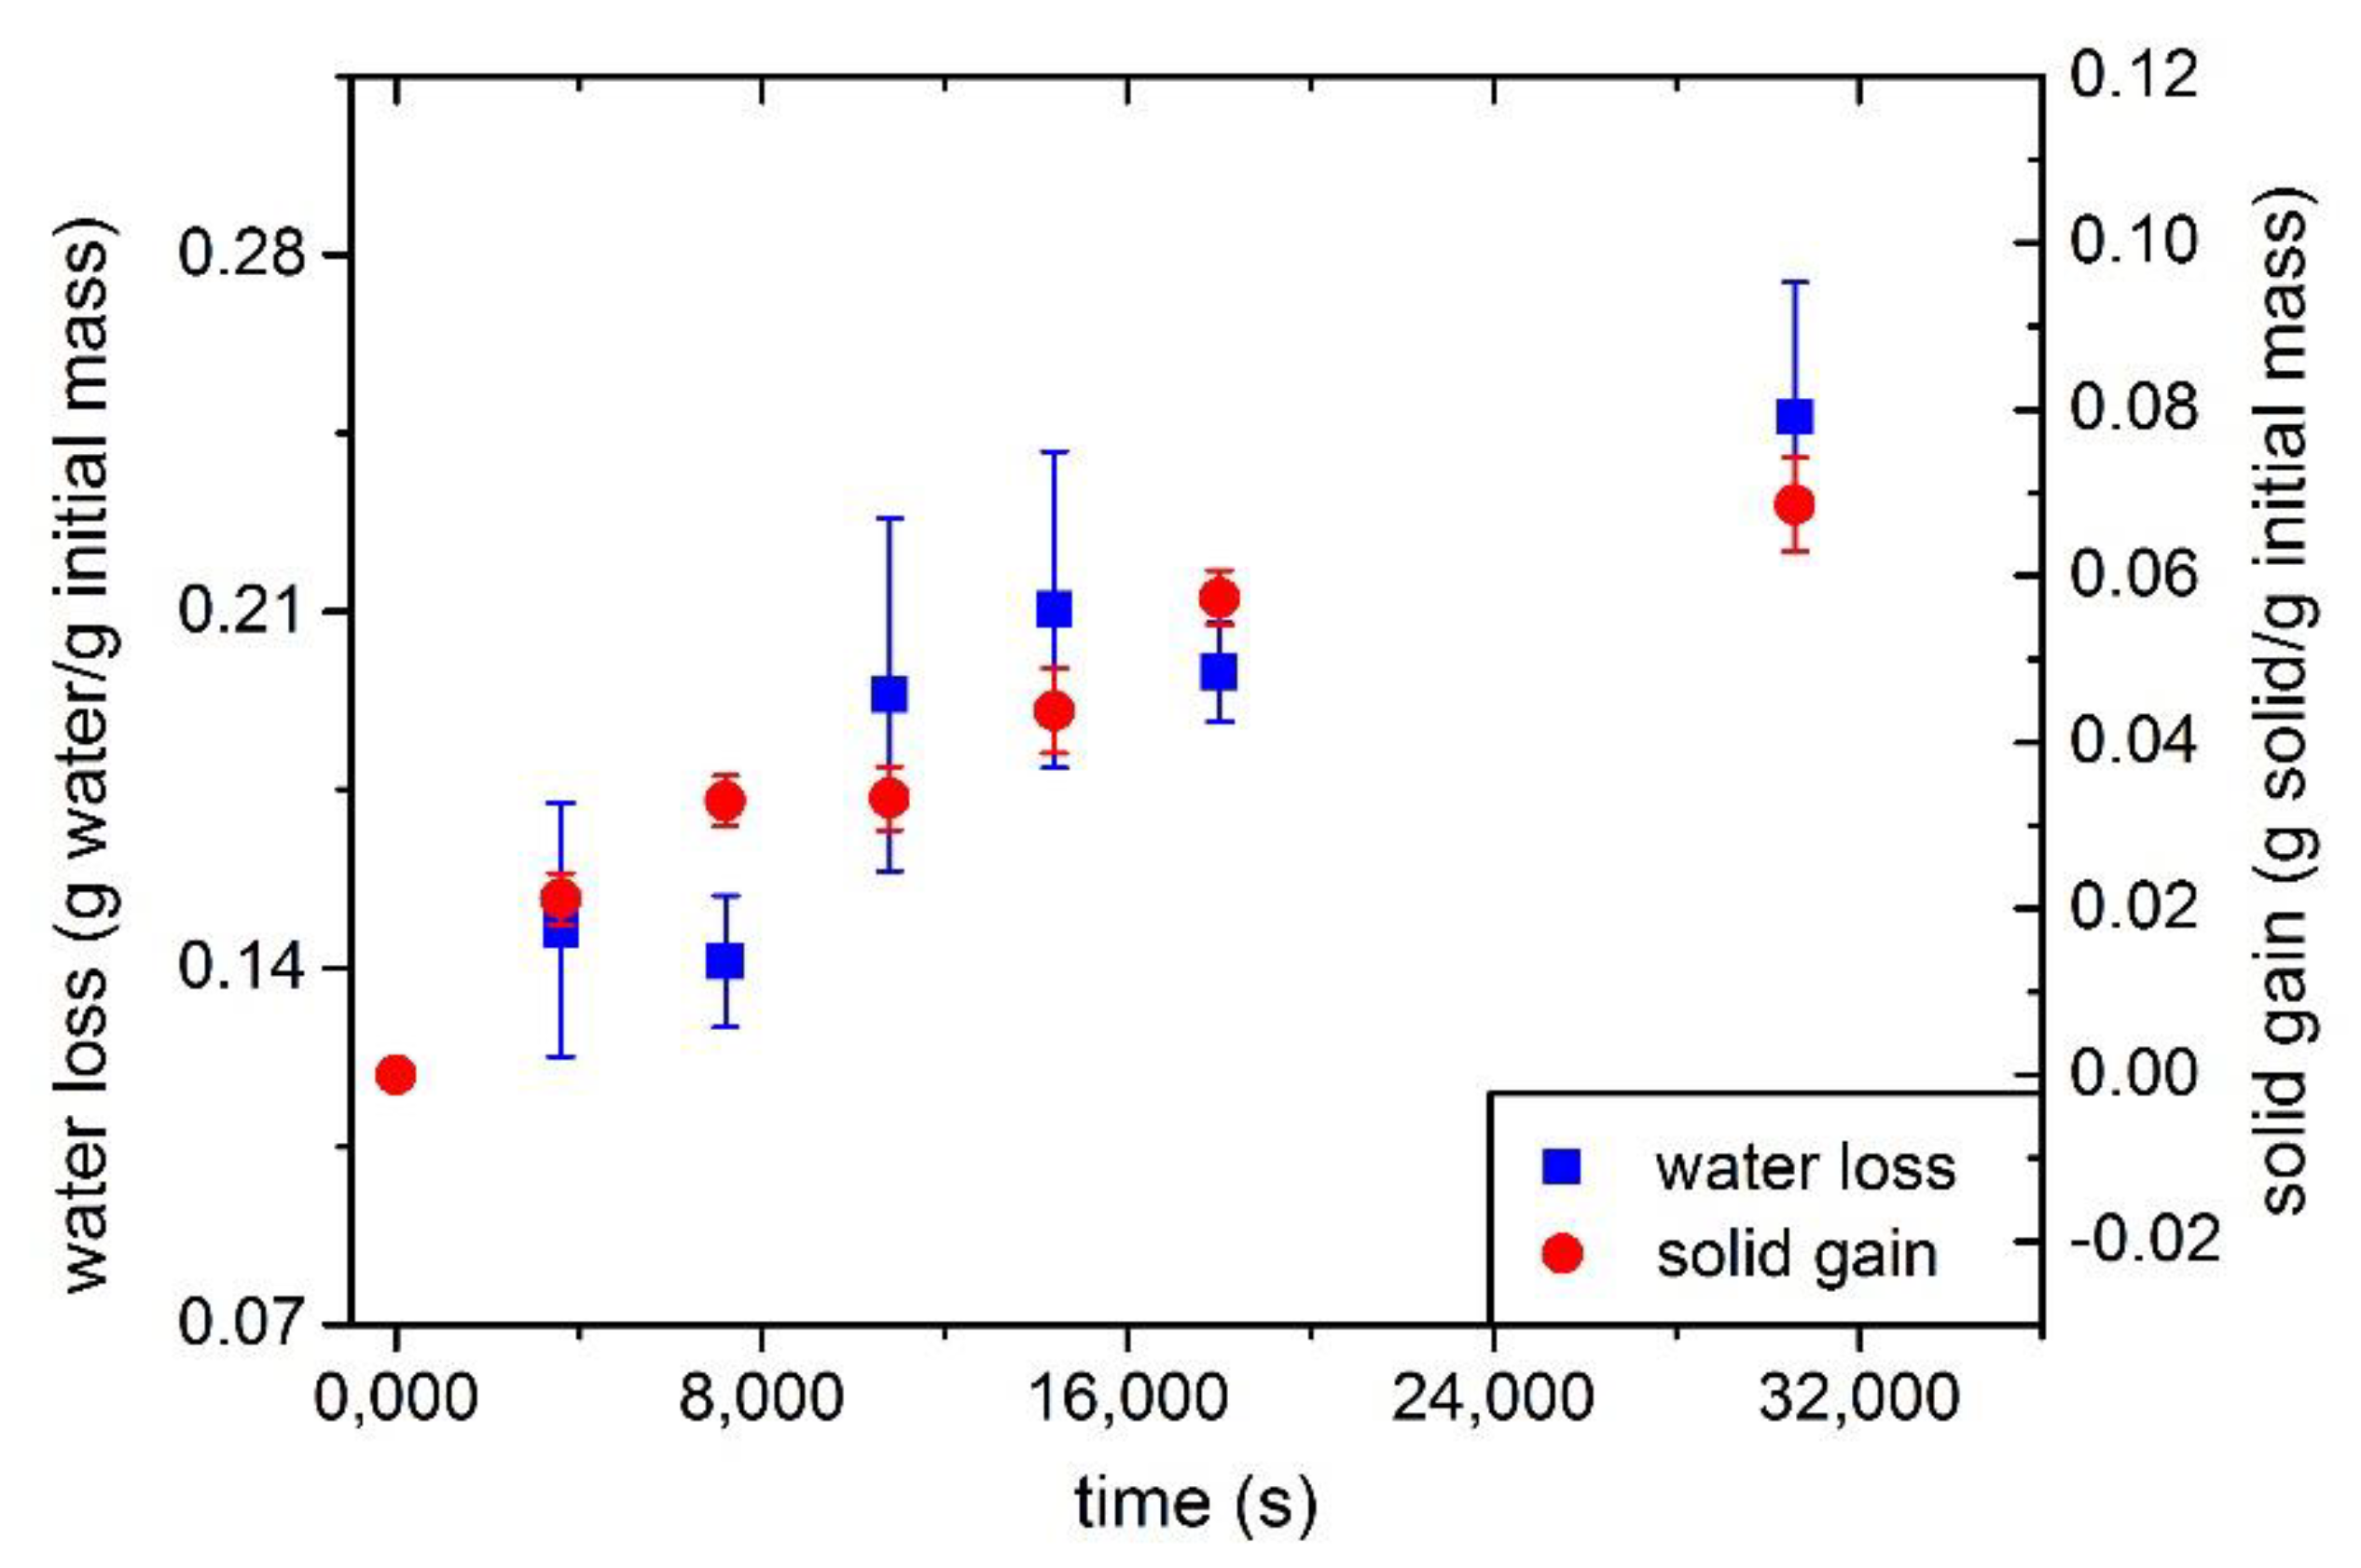
3.1. Determination of WL, SG and Diffusion Coefficient

The results of mass transport analysis are presented in Figure 2, where the time dependence of water loss W L and solid gain S G are shown. Both parameters demonstrate a quasi-exponential relationship, which is characterized by a rapid increase during the first 2 h of the osmotic dehydration process. Similar behaviour was observed by other authors studying the osmotic dehydration of vegetables. Physically, the effect can be explained by a large initial osmotic driving force between the tissue and the osmotic substance, which gradually decreases over time. Moreover, a high concentration of the CA at the interface closes up capillaries, forming a barrier to the water flow.
The W L and S G parameters did not reach their equilibrium values because the experiment was terminated after 8 h to avoid the sample shrinking effects. Presumably, for longer immersion times, the shrunken outer tissue forms a resistance to the water flow from courgette to the osmotic solution, slowing down the process even further.
The equilibrium values of these parameters, W L e and S G e , can be determined from the Azuara model given in Equations (3) and (4). The experimental plots of t / W L and t / S G as a function of time are shown in Figure 3a, and the results of weighted linear regression are presented in Table 1. High correlation coefficients confirm that the linear fits provide adequate models for the data. The calculated water loss and solid gain in equilibrium at the chosen initial salt concentration are 28% and 11%, respectively, with acceptable experimental errors. Qualitatively, they agree with the direct results that are shown in Figure 2, although the S G e value seems to be slightly overestimated. It was previously reported that the Azuara model is less able to predict S G e values than W L e values [22].
The calculated WLe and SGe values can be used to determine the effective diffusion coefficients of water loss and solid gain De(WL) and De(SG), respectively. By taking logarithms of both sides of Equations (6) and (7), a linear dependence of l n ( W L e W L t W L e W L 0 ) and l n ( S G e S G t S G e S G 0 ) as a function of processing time is obtained. The weighted linear fits to the experimental points are shown in Figure 3b, and the numerical results are presented in Table 2. Using Equation (5), the effective diffusivities were calculated from the slopes of corresponding lines, and were equal to (2.91 ± 0.47) × 10−9 m2/s and (1.64 ± 0.17) × 10−9 m2/s for the water loss and solid gain, respectively. These results agree well with the existing literature [23,24,25].

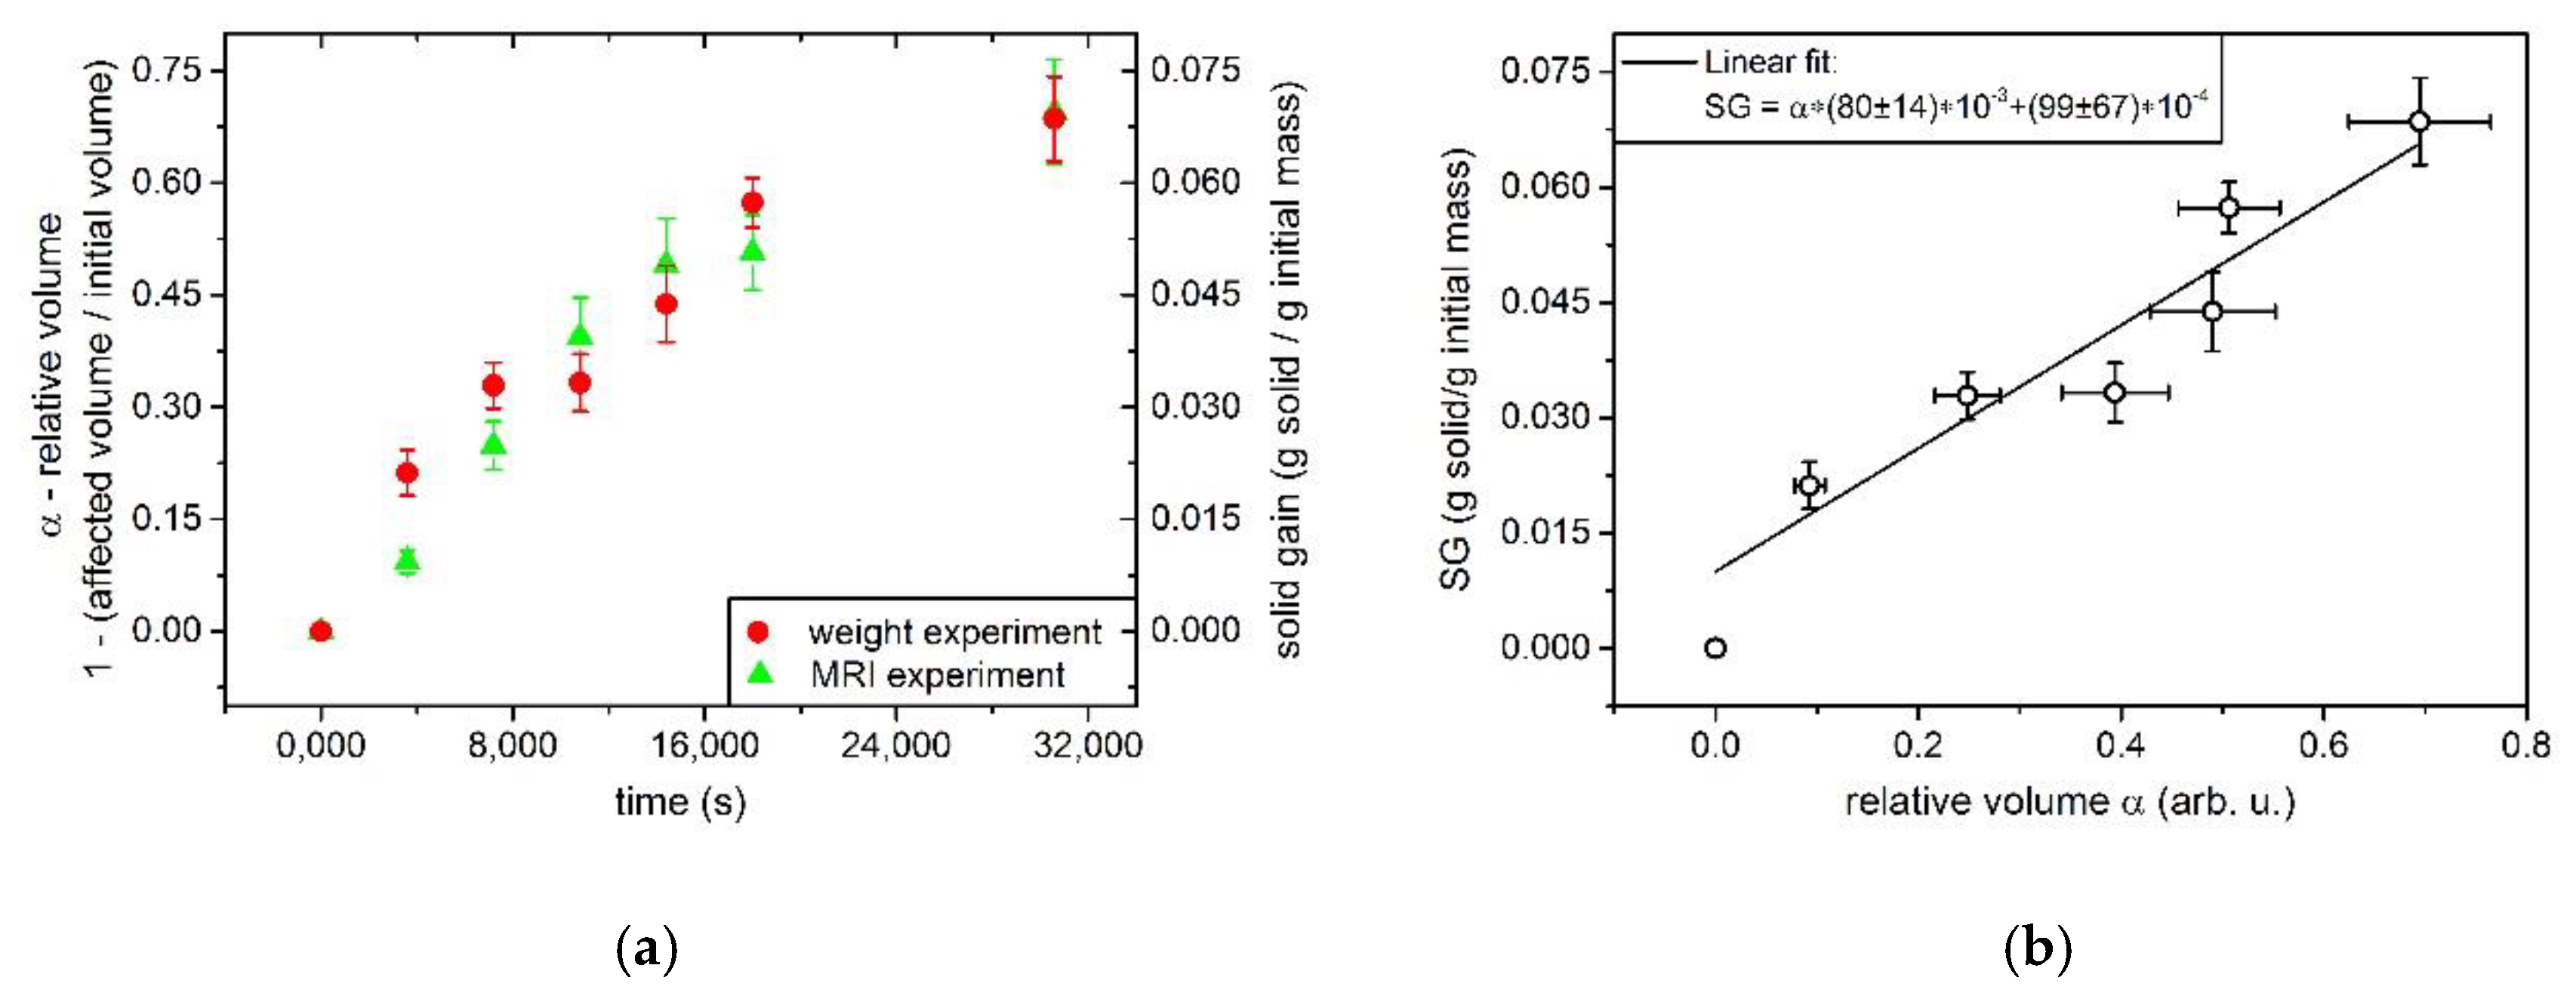
3.2. Determination MRI Data Analysis

Typical cross-sectional MR images of the courgette sample subjected to osmotic dehydration by the saturated solution of CuSO4 salt are shown in Figure 4 for consecutive processing times. The initial control image reflects the water content in the sample (Figure 4: control). During dehydration, the light region in the image decreases because the salt penetrating the tissue makes part of it invisible (Figure 4: 1–8 h). After 9.5 h, the salt covers the whole sample, making the detection of any MRI signal impossible (not shown).
Using the procedure described in the experiment section, the time-dependent volumes V(t) and fractional volumes αt for t = 0, 1, 2, 3, 4, 5, 8 were determined. The results of the MRI and mass transport analysis are compared in Figure 5a, illustrating the same time dependence of αt and SG. Finally, the SG data were plotted versus αt and fitted to Equation (8), as shown in Figure 5b. The Pearson coefficient, equal to 0.944, confirms the good quality of the weighted linear fit. Therefore, the MRI data can be used independently to calculate the effective diffusion coefficient of the osmotic substance using Equations (5) and (7). It is equal to (1.91 ± 0.11) × 10−9 m2/s, which agrees with the previously found value of De(SG) = (1.64 ± 0.17) × 10−9 m2/s within experimental error.

4. Discussion

We investigated the mass transfer kinetics and effective diffusivity during the osmotic dehydration of courgette in a copper sulphate salt solution. The use of copper sulphate made it possible to perform complementary measurements using the low-field MRI method, where CuSO4 is used as both the osmotic substance and the paramagnetic contrast agent. The experiment was planned so that the results could be subjected to a simple macroscopic analysis, which would verify the usefulness of the proposed MRI method. The samples were taken from the homogeneous tissue of one vegetable. The initial course of the experiment was analysed, where the shrinkage of the sample could be neglected. Our results showed that both the analysis of the mass transport and determination of the spatial distribution of the osmotic substance by MRI provided consistent numerical results for the diffusion coefficients of water and the osmotic substance within the sample tissue. Using the same salt during both trials allowed us to show that the paramagnetic agent in low-field MRI imaging is a great tool for studying the OD process. However, it should be noted that the molar mass of CuSO4 differs from NaCl mass (most often used during the OD process). Solute transfer is a complex phenomenon in which a number of factors should be taken into account, including the physicochemical properties of the osmotic agent and the properties of the structural material, as described in detail in the work of Muñiz-Becera et al. [1]. Dissolved substances with ionic properties such as CuSO4 or NaCl will diffuse inside the plant tissue, but the diffusion processes depend on the size of the particles, molecular weight and molar volume. Another situation occurs with polar osmotic agents such as sucrose, where the substances adhere mainly to the surface of materials. Surface adhesion, electrochemical interaction and electrostatic forces are involved in the transfer of solutes during OD [26], which means that the results obtained from the use of various osmotic agents should be considered separately.

5. Conclusions

Two experimental techniques were applied to provide complementary information on the osmotic dehydration process occurring in the courgette (Cucurbita pepo convar. giromontiina) that was submerged in the saturated solution of a paramagnetic salt. There are several advantages of the MRI method when compared to the direct mass transport analysis. First of all, in order to determine the time evolution of the dehydration process, several samples are needed for the mass transport method—namely, at least one sample for each experimental point. In addition, a separate experiment is needed to find the initial dry mass of the sample. This causes potential scatter of the results due to differences between the samples and their inhomogeneities. In contrast, in the MRI method, a single sample is sufficient to monitor the entire dehydration process, so experimental errors due to the diversity of samples are avoided. This is already observed in Figure 5a, where the scatter of SG data points is much larger. Experiment time is also reduced significantly in the MRI method. Moreover, the moment when the salt penetrates the entire interior of the sample can be precisely determined. All these advantages are important in practical applications, especially when examining biological objects such as fruits and vegetables. Therefore, the low-field MRI technique seems to be preferable for assessing the changes in fruit or vegetable tissue during osmotic dehydration, and further studies are needed in this direction. For example, the same paramagnetic salt can be used as a positive contrast agent in the T1-weighted MR images, thus providing direct quantitative information on the volume penetrated by the osmotic substance. This method can be easily incorporated into the currently proposed imaging protocol, without significant increase in experiment time. In practical applications, one can take advantage of the large operating volume of the permanent magnet in the low-field MRI system. A larger number of samples can be imaged simultaneously, improving the accuracy of the method even further.

Author Contributions

Conceptualization, M.S.; Methodology, M.S.; Validation, Z.O.; Formal Analysis, M.S.; Investigation, M.S.; Resources, M.S.; Writing—Original Draft Preparation, M.S. and Z.O; Writing—Review & Editing, M.S. and Z.O. All authors have read and agreed to the published version of the manuscript.

Funding

This research received no external funding.

Conflicts of Interest

The authors declare no conflicts of interest.

References

  1. Muñiz-Becera, S.; Mendez-Lagunas, L.L.; Rodriguez-Ramirez, J. Solute Transfer in Osmotic Dehydration of Vegetable Foods: A Review. J. Food Sci. 2017, 82, 2251–2259. [Google Scholar] [CrossRef] [PubMed] [Green Version]
  2. Ramya, V.; Jain, N.K. A Review on Osmotic Dehydration of Fruits and Vegetables: An Integrated Approach. J. Food Process Eng. 2017, 40, e12440. [Google Scholar] [CrossRef]
  3. Ciurzyńska, A.; Kowalska, H.; Czajkowska, K.; Lenart, A. Osmotic dehydration in production of sustainable and healthy food. Trends Food Sci. Technol. 2016, 50, 186–192. [Google Scholar] [CrossRef]
  4. Rastogi, N.K.; Raghavarao, K.S.M.S.; Niranjan, K.; Knorr, D. Recent developments in osmotic dehydration: Methods to enhance mass transfer. Trends Food Sci. Technol. 2002, 13, 48–59. [Google Scholar] [CrossRef]
  5. Kowalska, H.; Lenart, A.; Leszczyk, D. The effect of blanching and freezing on osmotic dehydration of pumpkin. J. Food Eng. 2008, 86, 30–38. [Google Scholar] [CrossRef]
  6. Mayor, L.; Pissarra, J.; Sereno, A.M. Microstructural changes during osmotic dehydration of parenchymatic pumpkin tissue. J. Food Eng. 2008, 85, 326–339. [Google Scholar] [CrossRef]
  7. Duce, S.L.; Carpenter, T.A.; Hall, L.D. Nuclear magnetic resonance imaging of fresh and frozen courgettes. J. Food Eng. 1992, 16, 165–172. [Google Scholar] [CrossRef]
  8. Rossi, G.; Socciarelli, S.; Aromolo, R.; Ciampa, A.; Beni, C. The effects of mineral and organic fertilizers on zucchini (Cucurbita pepo L.) investigated by the multiparameters analyses and magnetic resonance imaging (MRI). Agrochimica 2016, 60, 275–287. [Google Scholar]
  9. Evans, S.D.; Brambilla, A.; Lane, D.M.; Torreggiani, D.; Hall, L.D. Magnetic resonance imaging of strawberry (Fragaria vesca) slices during osmotic dehydration and air drying. LWT-Food Sci. Technol. 2002, 35, 177–184. [Google Scholar] [CrossRef]
  10. Derossi, A.; De Pilli, T.; Severini, C.; McCarthy, M.J. Mass transfer during osmotic dehydration of apples. J. Food Eng. 2008, 86, 519–528. [Google Scholar] [CrossRef]
  11. Brücher, E.; Tircsó, G.; Baranyai, Z.; Kovács, Z.; Sherry, A.D. Stability and Toxicity of Contrast Agents. In The Chemistry of Contrast Agents in Medical Magnetic Resonance Imaging, 2nd ed.; Merbach, A.E., Helm, L., Tóth, É., Eds.; Wiley: New York, NY, USA, 2013; pp. 157–208. [Google Scholar] [CrossRef] [Green Version]
  12. Falade, K.O.; Igbeka, J.C.; Ayanwuyi, F.A. Kinetics of mass transfer, and colour changes during osmotic dehydration of watermelon. J. Food Eng. 2007, 80, 979–985. [Google Scholar] [CrossRef]
  13. Azuara, E.; Beristain, C.I.; Gutierrez, G.F. A method for continuous kinetic evaluation of osmotic dehydration. LWT-Food Sci. Technol. 1998, 31, 317–321. [Google Scholar] [CrossRef]
  14. Crank, J. The Mathematics of Diffusion, 2nd ed.; Oxford University Press: London, UK, 1975; pp. 69–88. [Google Scholar]
  15. Hamedi, F.; Mohebbi, M.; Shahidi, F.; Azarpazhooh, E. Ultra-sound-assisted osmotic treatment of model food impregnated with pomegranate Peel phenolic compounds: Mass transfer, texture, and phenolic evaluations. Food Bioprocess Technol. 2018, 11, 1061–1074. [Google Scholar] [CrossRef]
  16. Suchanek, M.; Cieślar, K.; Pałasz, T.; Suchanek, K.; Dohnalik, T.; Olejniczak, Z. Magnetic resonance imaging at low magnetic field using hyperpolarized 3He gas. Acta Phys. Pol. A 2005, 107, 491–506. [Google Scholar] [CrossRef]
  17. Suchanek, M.; Olejniczak, Z. Visualization of fluid flow pathways in wood by low-field 1H and 3He contrast MRI. Int. J. Multiph. Flow 2015, 72, 83–87. [Google Scholar] [CrossRef]
  18. Koenig, S.H.; Baglin, C.R.; Brown, D., 3rd; Brewer, C.F. Magnetic field dependence of solvent proton relaxation induced by Gd3+ and Mn2+ complexes. Magn. Reson. Med. 1984, 1, 496–501. [Google Scholar] [CrossRef]
  19. Schneider, C.A.; Rasband, W.S.; Eliceiri, K.W. NIH Image to ImageJ: 25 years of image analysis. Nat. Methods 2012, 9, 671–675. [Google Scholar] [CrossRef]
  20. Mazonakis, M.; Damilakis, J.; Maris, T.; Prassopoulos, P.; Gourtsoyiannis, N. Comparison of Two Volumetric Techniques for Estimating Liver Volume Using Magnetic Resonance Imaging. J. Magn. Reson. Imaging 2002, 15, 557–563. [Google Scholar] [CrossRef]
  21. Chandra, R.; Rusinek, H. Tissue volume determinations from brain MRI images: A phantom study. In Medical Imaging V: Image Processing; International Society for Optics and Photonics: Bellingham, WA, USA, 1991; Volume 1445, pp. 133–144. [Google Scholar] [CrossRef]
  22. Zúñiga, R.N.; Pedreschi, F. Study of the Pseudo-equilibrium during Osmotic Dehydration of Apples and Its Effect on the Estimation of Water and Sucrose Effective Diffusivity Coefficients. Food Bioprocess Technol. 2012, 5, 2717–2727. [Google Scholar] [CrossRef]
  23. Mayor, L.; Moreira, R.; Chenlo, F.; Sereno, A.M. Water sorption isotherms of fresh and partially osmotic dehydrated pumpkin parenchyma and seeds at several temperatures. Eur. Food Res. Technol. 2005, 220, 163–167. [Google Scholar] [CrossRef]
  24. Mayor, L.; Delgado, J.M.P.Q.; Vázquez Da Silva, M.; Sereno, A.M.; Gonçalves, M.P. Effect of Temperature and Volume Changes on Effective Diffusivities of Sucrose and NaCl during Osmotic Dehydration of Vegetable Tissue. Defect Diffus. Forum 2008, 273, 138–143. [Google Scholar] [CrossRef]
  25. Lech, K.; Michalska, A.; Wojdylo, A.; Nowicka, P.; Figiel, A. The Influence of the Osmotic Dehydration Process on Physicochemical Properties of Osmotic Solution. Molecules 2017, 22, 2246. [Google Scholar] [CrossRef] [PubMed] [Green Version]
  26. Borde, A.; Bergstrand, A.; Gunnarsson, C.; Larsson, A. Osmotic-driven mass transport of water: Impact on the adhesiveness of hydrophilic polymers. J. Colloid Interface Sci. 2010, 3, 255–260. [Google Scholar] [CrossRef] [PubMed]
Figure 1. (a) Schematic diagram of the experimental setup for the osmotic dehydration of courgette. Photograph of the cylindrical samples of courgette (b) before and (c) after being placed into the osmotic solution.
Processes 08 00887 g001
Figure 2. Water loss (blue squares) and solid gain (red circles) versus time during the osmotic dehydration of courgette in the CuSO4 solution. Error bars represent standard uncertainty.
Processes 08 00887 g002
Figure 3. The experimental plots of (a) t/WL (blue squares) and t/SG (red circles), (b) l n ( W L e W L t W L e W L 0 ) (blue squares) and l n ( S G e S G t S G e S G 0 ) (red circles) as a function of processing time for osmotic dehydration of courgette in the CuSO4 solution. Error bars represent standard uncertainty.
Processes 08 00887 g003
Figure 4. Cross-sectional MR images of a cylindrical sample of courgette during osmotic dehydration in CuSO4 solution. Image (control) acquired before the contrast agent was administered and images (1–8 h) acquired at different times of the osmotic process. The dark spots in the centre of the images indicate the location of the sample holder. The scale bar represents 20 mm.
Processes 08 00887 g004
Figure 5. (a) Kinetics of solid gain (red circles) and relative volume (green triangles) during the osmotic dehydration of courgette in the CuSO4 solution. (b) Correlation between the solid gain (SG) determined from the mass transport analysis and the relative volume (αt) obtained from the MRI data. Error bars represent standard uncertainty.
Processes 08 00887 g005
Table 1. The correlation coefficients and equilibrium values for water loss and solid gain during the osmotic dehydration of courgette in CuSO4 solution estimated from the Azuara model.
Parameters from t / W L (Water Loss)Parameters from t / S G (Solid Gain)
Pearson′s correlation coefficient0.9800.952
Slope3.54 ± 0.329.5 ± 1.8
Intercept19,000 ± 5300167,000 ± 29,000
S1(1.9 ± 0.5) × 10−4-
WLe0.28 ± 0.03-
S2-(0.57 ± 0.14) × 10−4
SGe-0.11 ± 0.02
Table 2. The effective diffusivity coefficients for water loss and solid gain during the osmotic dehydration of courgette in CuSO4 solution estimated from the analytical solution of Fick′s equation.
Parameters from k m ( W L ) k m ( S G )
Pearson’s correlation coefficient−0.884−0.966
Slope(−6.09 ± 0.90) × 10−5(−3.38 ± 0.30) × 10−5
Intercept−0.30 ± 0.14−0.071 ± 0.045
De(WL) (m2/s)(2.91 ± 0.47) × 10−9-

