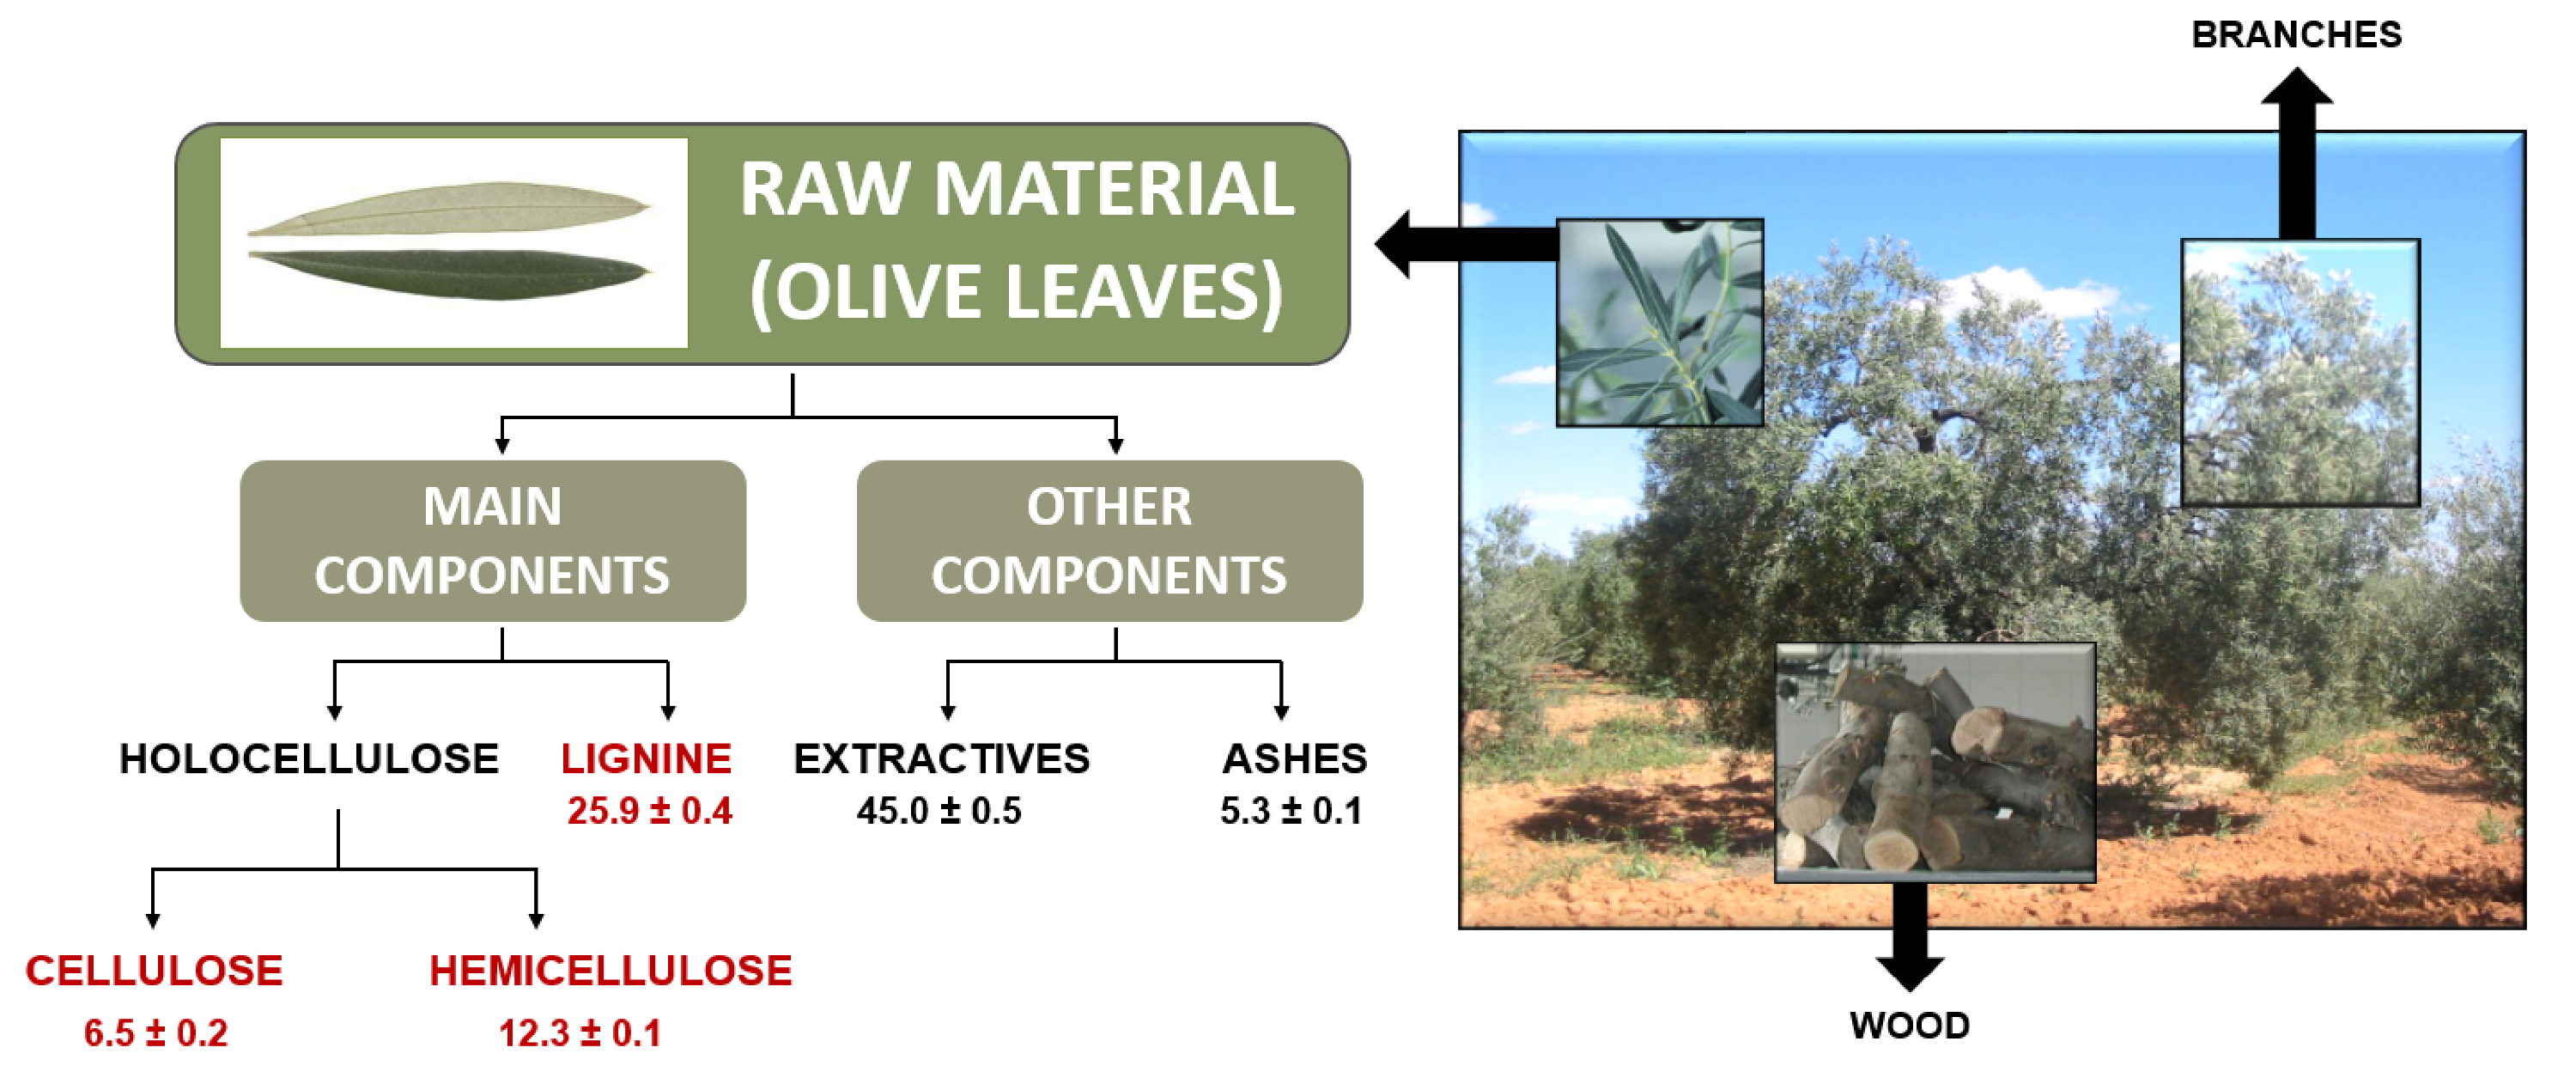
4.1. Raw Material Characterization
The results obtained for olive tree leaves characterization in this investigation do not differ much with the ones reported by Sánchez et al. [
19] and Alburquerque et al. [
20], and even less so when taking into account the heterogeneity of the product, as the determinations depend on the starting biomass in terms of type of olive grove, geo-environmental conditions, and so on.
The lignin content is quite similar to other lignocellulosic materials: barley straw [
21], rice straw [
22], or corn stover [
23], so this organic polymer, after its recovery, could be used in reinforcement materials, lignin-based porous carbon derivatives, composites, and aromatic chemical intermediaries. On the other hand, according to a previous research [
3], the main difference, regarding extractives content between olive tree pruning biomass and this same type of residue, but free of leaves, was much higher for the first type of residue. This is in accordance with the high content of these non-structural components noted in this study according to OTL characterization results. Although cellulose and hemicellulose composition for OTL (primary waste from oil mills) is lower compared to olive tree pruning biomass, the presence of
d-glucose and
d-xylose detected in the extractives fraction suggested the possibility of recovering these simple sugars, obtained under the best conditions, to be processed separately or together, as appropriate, with those obtained by acid hydrolysis of the original material.
4.2. Erlenmeyer Hydrolysis
It was observed that cellulose was fractionated to a lesser extent under the most mild conditions used (experiment 1), whereas the highest values of
is in line with the most severe conditions (experiment 8). The Pareto chart, shown in
Figure 2, for the fraction with greater granulometry, describes the calculated Student
t absolute values, also called standardized effects, providing lengths of the bars which in turn are arranged in decreasing order. All factors or interactions for which the length of the bars, representing the corresponding statistical significance, is positioned beyond the vertical line drawn to a confidence level of 95% (
) will be relevant in the mathematical expression. It is shown that temperature is the variable with the greater influence, followed by acid concentration and time. The mathematical model (by elimination of the terms not statistically significant for treatment, with p-value above the significance level
), was expressed according to Equation (
10), with an allowable correlation coefficient (
) involving only 2.2% of the response variability not able to be explained by the model.
All the independent model parameters evinced a favorable effect. In this way, the different response surfaces for
(
Figure 3) obtained by the model revealed that the lowest conversions were obtained for the shorter times tested (30 min). This behavior is the same for both particles sizes tested in this work.
On the other hand, the existence of oligomers in the hydrolyzates can be explained by comparing the values of the monosaccharides concentrations before and after the corresponding post-hydrolytic process, as set out in the oligosaccharides determination. Thus, in the experiments where hemicellulose was entirely depolymerized, no significant sugar concentration changes were observed. By contrast, in experiments 1, 3, and 5, conducted at the lowest temperature (100
C), the most obvious differences were detected (see
Figure 4), proving that temperature is an extremely influential parameter for biomass deconstruction towards monomeric sugars. Fermentable sugars from both extractives and structural fractions could be used for bioethanol production, as total sugars yield is in line with that reported in a recent literature for another residue [
24].
As the acid hydrolyzates obtained could be fermented with yeast to obtain bioproducts of interest, such as ethanol or xylitol, it would be desired that the amounts of these substances that could exert toxic or inhibitory effect is as low as possible. In this sense, the concentrations of acetic acid and hydroxymethyl-furfural (HMF) were evaluated in all the performed experiments, see
Table 4.
The highest concentrations of acetic acid were obtained in the experiments with the maximum values of the tested variables (M8 and m8), achieving values of 1.24 and 1.15 kg m
for large and small particle sizes, respectively. In the other experiments, except for the one carried out with the lowest values of the tested variables (experiment 1), very similar acetic acid concentrations were produced, with the average value being 0.89 ± 0.08 kg m
. Bellido et al. [
25] reports that an acetic acid concentration of 3.5 kg m
led to a reduction in ethanol productivity and complete inhibition of
Pichia stipitis.
Regarding the presence of HMF hydrolyzate, the maximum concentrations were obtained in experiments M4 and m4, performed at the highest temperature and time values but with the lowest acid concentration (0.56 and 0.40 kg m
for the greatest and smallest diameter, respectively). The concentrations of both acetic acid and HMF do not seem to be significantly important, in terms of the possibility of hindering the hydrolyzates fermentability, as higher concentrations would be required. In this respect, Fonseca et al. [
26] note that certain types of inhibitors can express a dual behavior as they can act as toxic compounds or an efficient source of carbon, depending on its concentration. Bellido et al. [
25] and Felipe et al. [
27] reveal that 0.50 and 0.42 kg m
of HMF for
Pichia stipitis and
Candida guilliermondii, respectively, are the stress concentrations for these specific microorganisms in fermentative processes intended for bioethanol and xylitol generation. Bearing this in mind, it would be desirable to apply experimental conditions that provide high total simple carbohydrate amounts but inhibitor levels under the marked tolerance limit, in order to avoid the detoxification step of the liquid fraction. This clearly limited situation makes more severe hydrolytic conditions undesirable. In this sense, in experiment M7 the concentrations of acetic acid and HMF were 1.0 and 0.25 kg m
, respectively.
It can be concluded from these results that acid hydrolysis may be a good option for developing subsequent studies as olive leaves appear in great quantity in oil mills and it is necessary to study simple methods for their use. Naturally, this study must be completed to improve the different stages that are carried out in a biorefinery, especially with the objective of the complete utilization of all the biomass fractions used in the process.
4.3. Reactor Hydrolysis
Data obtained at 90 min are compared with those corresponding to the M7 experiment, showing no significant differences between the two experimental systems; thus, the values of Y
, Y
, and Y
obtained at this time were 20.5, 11.3, and 2.5, respectively, whose differences are less than 8% with respect to the results of experiment M7, see
Table 3. Therefore, as far as sugar concentrations are concerned, the use of a larger reaction system (discontinuous reactor) would be feasible as a normalizing approach on a more industrial scale.
It is noteworthy that the values of the concentrations of
d-glucose, D-fructose, and D-mannose decrease slightly when the contact time is increased from 120 to 150 min, probably due to the fact that the total depolymerization of the hemicellulosic fraction has already been achieved and the degradation of the obtained monomeric sugars occurs [
28,
29,
30].
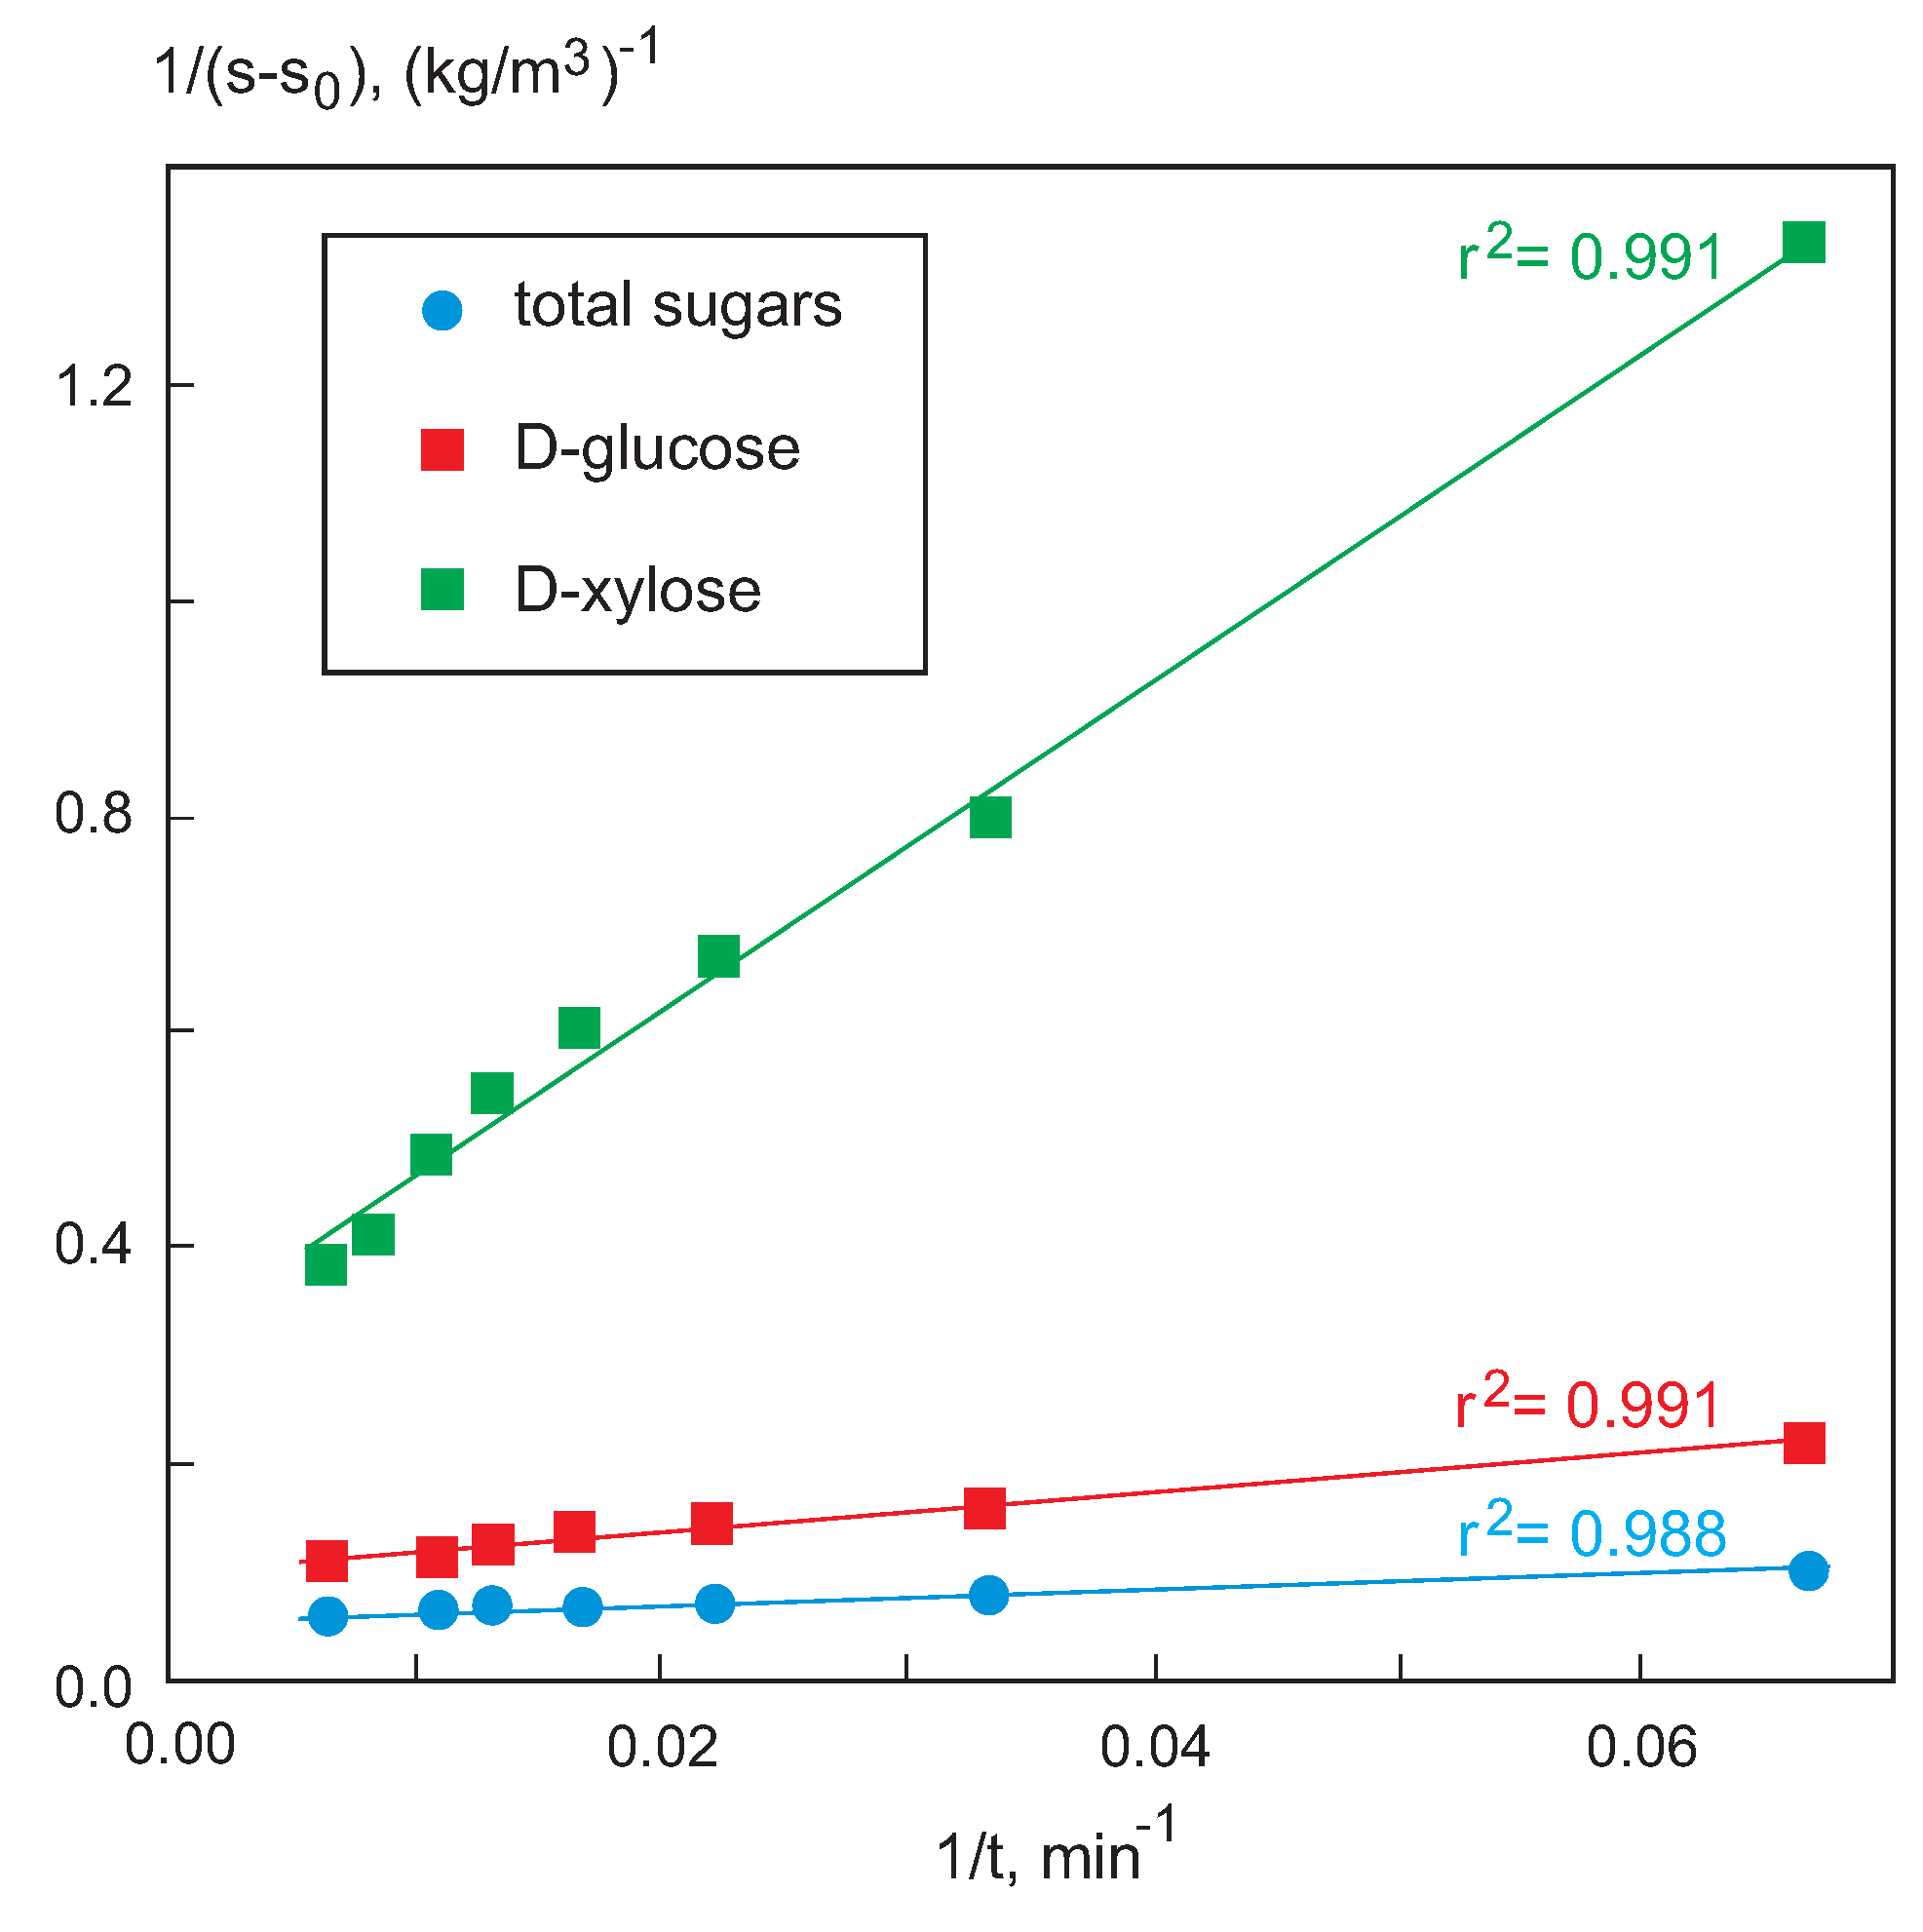
4.4. Kinetic Parameters
The corresponding values of the hydrolysis rate were determined with Equation (
9) by adjusting the total sugar concentrations. In addition, the generation rates of
d-glucose,
r, and
d-xylose,
r, were calculated using Equation (
8) (
Figure 5) and are shown in
Table 6.
In all cases the hydrolysis rate value decreases when time increases. On the other hand, the values of r are higher than those of r and the final value is higher than those of r for the same time. This is justified, taking into account the greater composition in d-glucose than in d-xylose obtained in the hydrolyzate.
On the other hand, accepting the model proposed by Saeman [
31] that considers a first-order irreversible reaction for sugar generation, it has been possible to calculate the apparent kinetic constant for total sugars: 0.0205 ± 0.0015 min
. This value is very similar to the reported for sugar cane bagasse hydrolysis at 100
C, 90 min, and 2% (
w/
w) sulfuric acid, 0.0246 min
[
32]. Burman et al. [
33] indicate that the apparent kinetic constant of South African grass hemicellulose hydrolysis with sulfuric acid is between 10
and 0.5 × 10
min
depending on acid concentration, and in this work, for xylose generation, the kinetic constant is 0.00081 ± 0.0002 min
.


