1. Introduction
Design evaluation is an essential phase in the product development process. This is particularly true when a company plans to develop and release a new product. In the conventional approach, physical prototypes are produced for the purpose of verifying the design functions and collecting user feedback. In different stages of the design process, the prototypes’ level of realism may vary depending on use. The lifecycle of current consumer products is relatively short. Using physical models to verify the product design may no longer be an effective solution, considering the cost, time, and effort required to produce physical prototypes [
1]. Advances in computer technologies allow for a more realistic simulation, i.e., developing virtual prototypes of the final product. Although a visual virtual prototype has various obvious limitations in terms of design evaluation, e.g., haptic or textile feedback is difficult to realize with current rendering technologies, it can still adequately simulate the visual aspects of a product [
2]. Design features, such as colors or textures, can be replaced and assessed visually, and require a short amount of rendering time. This may explain why most previous studies focused on the visual aspects of design evaluation by using virtual prototypes [
3].
Early researchers such as [
4] argued that a good product could fulfil the user’s needs at the functional, usability, and emotional levels. They suggested that more comprehensive approaches, such as those including emotional aspects, should be introduced in the design evaluation stage. Söderman [
5] investigated how sketches, physical models, and virtual media contribute to the evaluation of card designs. It was found that the familiarity of the product influenced the evaluation result, even though the physical models were still perceived to be more realistic. Ibrahim and Rahimian [
6] found that hand sketches could communicate the design concepts more intuitively. They reported that computer aided media impose somewhat of a constraint to the designer’s creativity. They compared 2D virtual prototypes with the actual products and found the former to be effective with regard to evaluation of simple design features.
Gibson et al. [
7] proposed two different experimental implementations for the real-time integration of virtual and physical prototyping based on computer aided design (CAD) techniques and rapid prototyping. A digital mock-up (DMU) was developed for use in an experiment that compared simulated assembly tasks in both real and virtual environments [
8]. The subjective evaluation results of the real (RE), virtual (VE), and virtual with force feedback (VEF) environments indicated a real sensory and difficulty gap between the RE and VEF, while a smaller difference was observed between the RE and the VE. Kim et al. [
9] analyzed user impressions of a product using virtual prototyping. They characterized the relationship between user impressions and design elements of automobile interior through experiments. Experimental data validated that virtual prototyping can help analyze user impressions of design alternatives at the early stage of the design process. Aromaa and Väänänen [
10] conducted an experimental study for comparing augmented reality (AR) and virtual environment (VE) prototypes of a rock crushing machine. The experimental result indicated that the VE system was more suitable to support the assessment of visibility, reach, and the use of tools than the AR system. The previous study [
11] emphasized the importance of working prototypes in product development and the importance of obtaining the users’ reactions upon interacting with such prototypes. They demonstrated how virtual reality (VR) prototypes do not only represent a valid alternative to physical prototypes, but also take a step forward owing to the possibility of simulating multisensory and real-time modifiable interactions between the user and the prototypes. Faust et al. [
12] conducted a preliminary experimental study of mixed reality prototyping for its ability to be used to evaluate usability and user experience aspects of a real projector. Both mixed reality prototype and real product showed a longer time of use and more errors in the use as the difficulty of the task increased. The result of user experience evaluation was comparable for both.
The form and type of virtual model representation will influence human assessment in various design disciplines such as product design [
13], interior design [
14], and landscape design [
15]. Bligård et al. [
16] compared two physical prototypes of different scales and a CAD model representing a ship bridge workstation. Participants were asked to assess the proposed design and to compare the models’ relative merits. The physical models received more positive feedback than the CAD model, both regarding content richness and quantity. In the experimental study of Voit et al. [
17], subjects compared five different methods (online, virtual reality, augmented reality, lab setup, and in situ) to evaluate early prototypes of smart artifacts using different standardized questionnaires. The experimental results revealed that evaluation methods significantly influence the assessment result. This implies that results may not be compared across studies that use different methods even using standardized questionnaires. Kuliga et al. [
18] compared the human–environment interaction between a real building and a virtual model of the same building in VR environment. Both quantitative (bipolar semantic differential questions) and qualitative (interview) measures were collected from experiments. They found few differences in the quantitative analysis result, but significant qualitative differences. Additionally, focused on simulated environments, Higuera-Trujillo et al. [
19] compared the psychological and physiological responses evoked by photographs, 360° panoramas, and virtual reality against a physical environment. They found that the 360° panorama is the most valid display format according to psychological responses and virtual reality is the most valid one in terms of physiological response.
This study is different than the existing research in the following regards. First, we proposed an experimental procedure that systematically compares the virtual prototype with a real product on design evaluation from a holistic view. The evaluation was carried out from three aspects: Functional, usability, and emotional response by the measure of single-answer questions, procedural correctness, and an emotional scale, respectively. Previous studies conducted a comparative experiment on virtual and physical prototypes either from single [
5,
7,
8,
10,
20] or two aspects [
12,
19]. Second, most of them [
16,
17,
18,
19] have treated the product itself as a golden standard and assessed the similarity between the product and its virtual counterpart. Although this approach may sound natural, we argue that the evaluation should aim beyond comparing the prototypes against an existing target object. In this study, we used external references instead of the product itself as the evaluation object. These references have definite values derived from the physical product. In addition, some studies on design evaluation with virtual prototypes focused on the development of prototyping technology for the assessment of specific product functions. For this purpose, multiple sensory simulation was incorporated to mimic the product behavior and to create a realistic interaction to the prototypes [
21,
22]. Few studies have analyzed whether or not virtual prototypes are comparable with the real product on evaluation of basic product attributes. Understanding the difference, if there is any, between different prototypes with regard to the human perception of the product they represent is also valuable.
In this study, we conducted a holistic comparative study on the effectiveness of virtual prototypes versus the actual product they aim to represent for design evaluation purposes. At the first stage, experiments were carried out to understand the human subjects’ perception of the physical and appearance features of the product, and the usability of operating the product’s functions by using both media. The emotional responses to the performance of the evaluation tasks were also analyzed and compared on the basis of the experimental results. At the second stage, additional tests were conducted to demonstrate that incorporating an instant sensory feedback in visual virtual prototypes improves the subjects’ emotional responses to the evaluation tasks. These findings may provide useful information to the refinement of virtual prototyping technology for design evaluation purposes and can also improve the user experience design of interactive functions for emerging virtual and augmented reality (VR/AR) applications.
2. Methodology
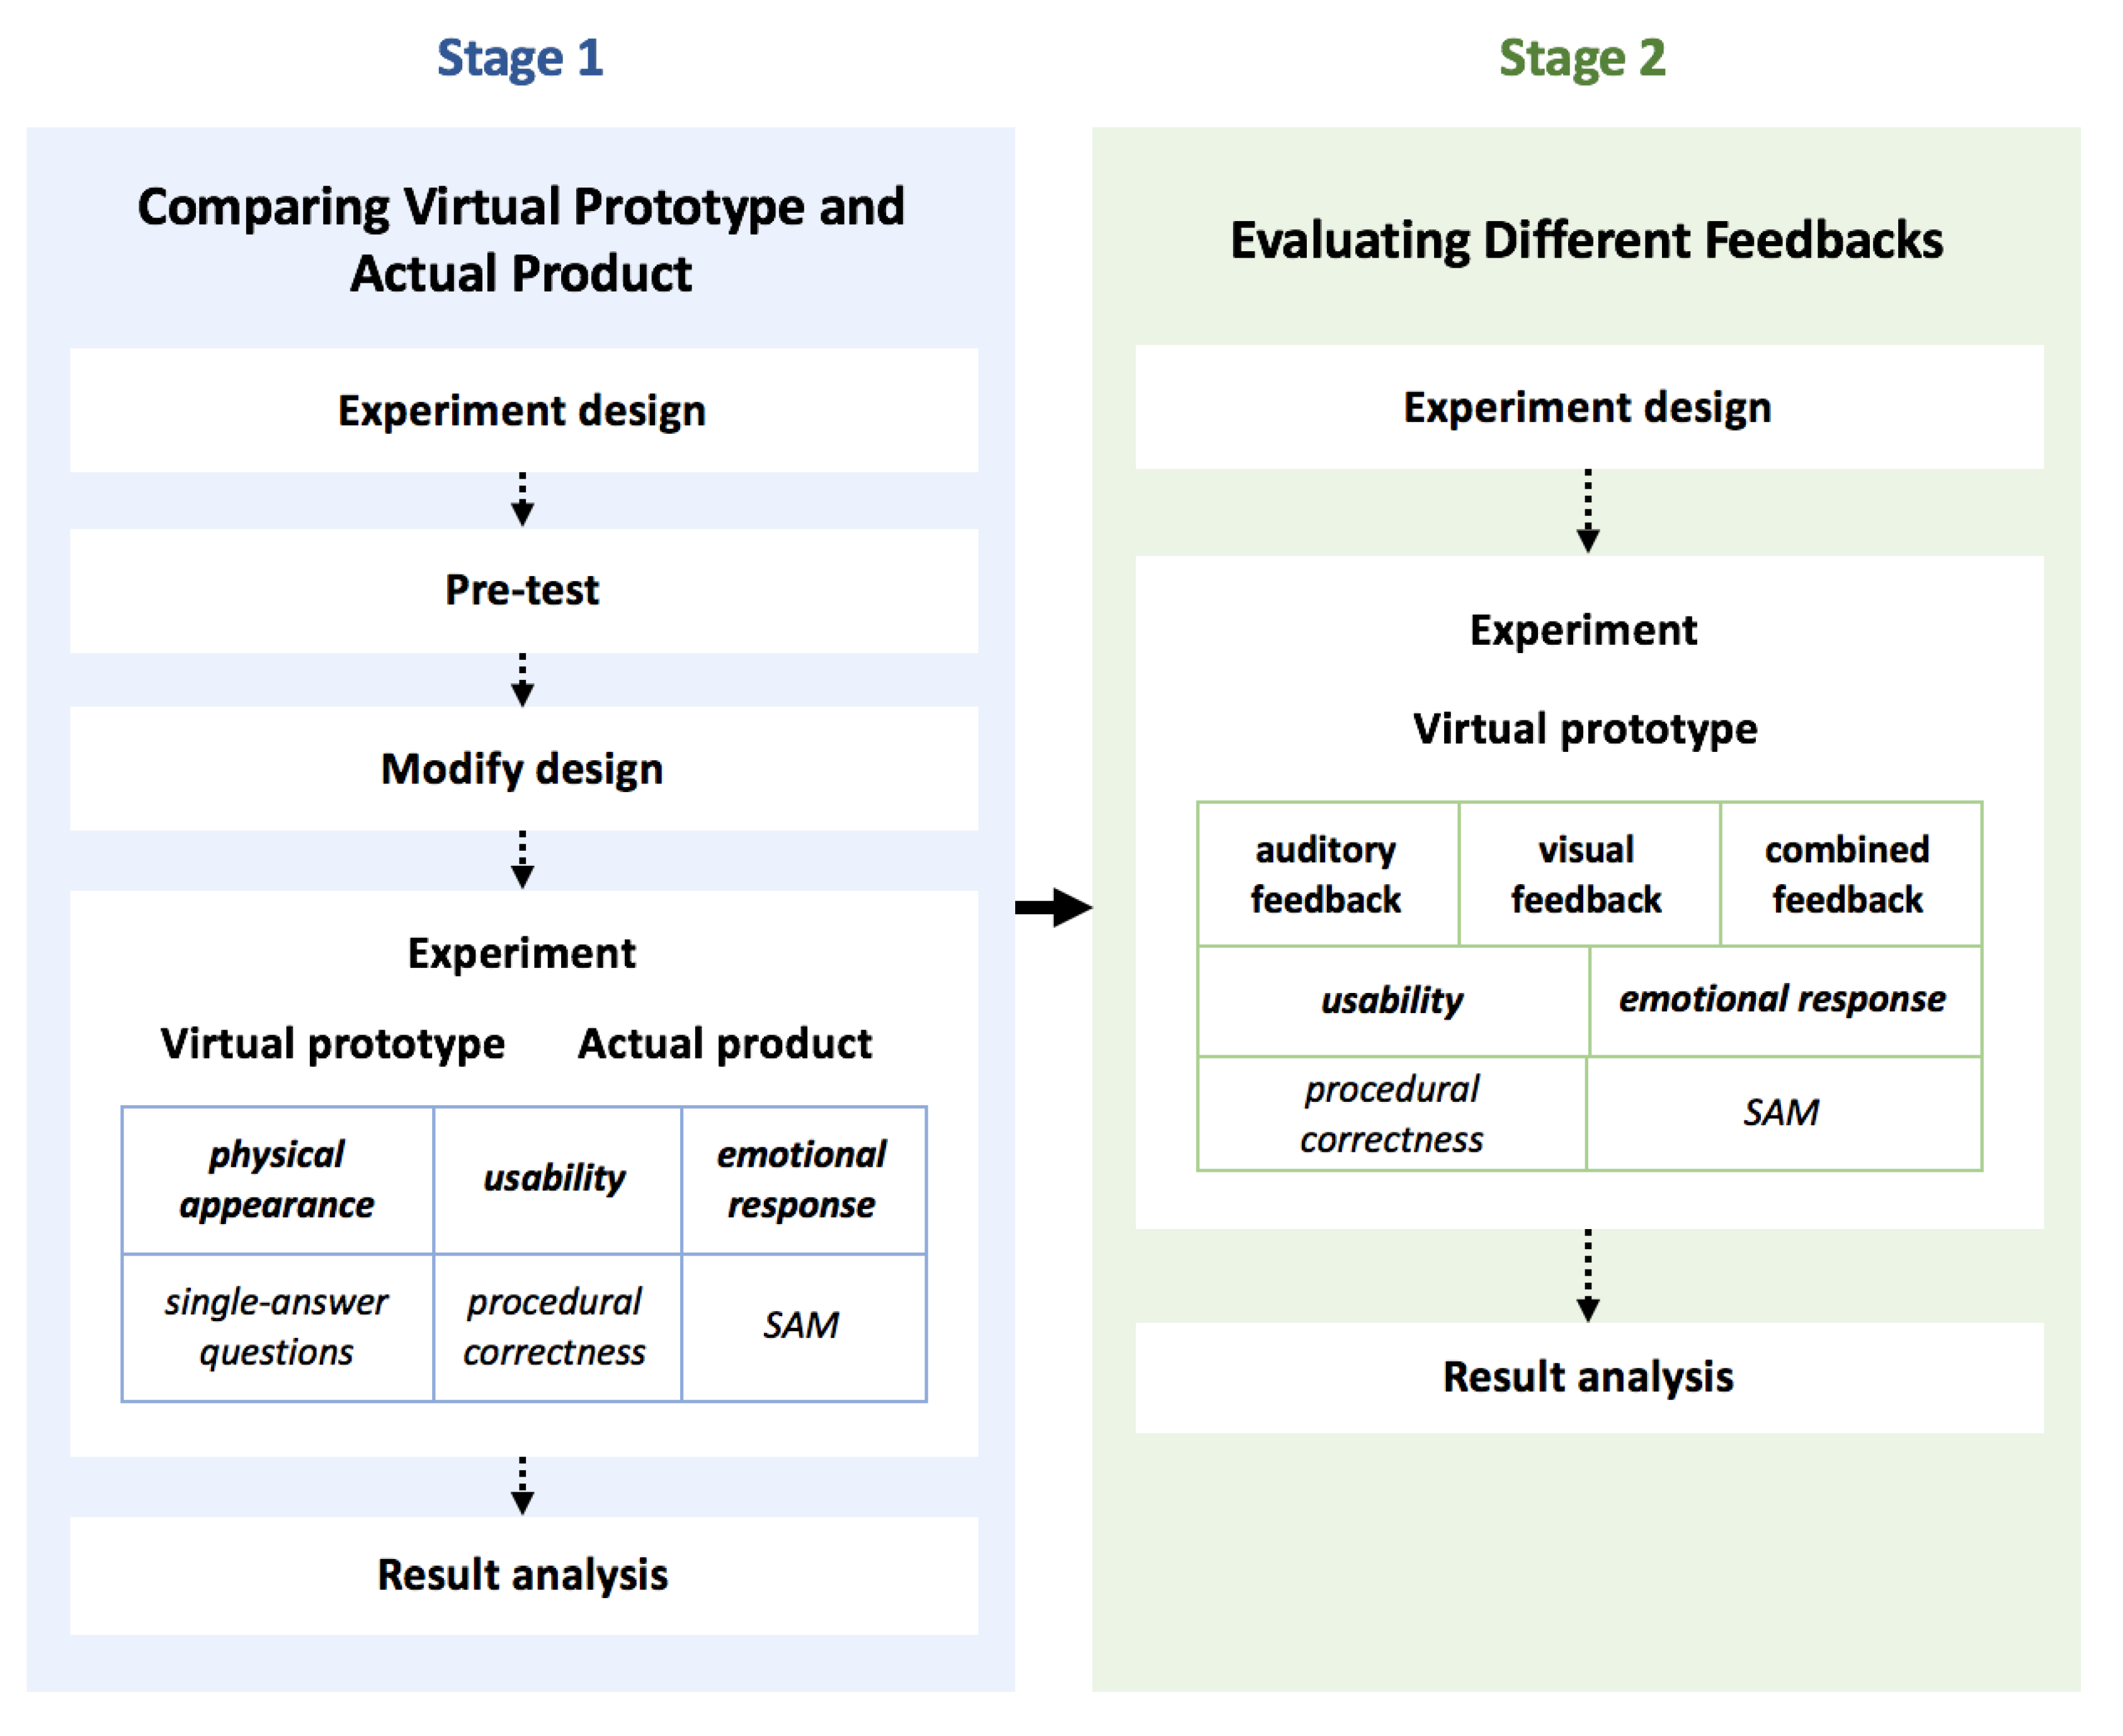
We conducted two-stage experiments to comprehensively investigate the users’ responses to various design attributes of the virtual prototypes and the product they aimed to represent. The experimental procedure is shown in
Figure 1. The first stage aims to identify potential differences between the effectiveness of design evaluation with a virtual prototype and actual product. A pretest was carried out to improve the original design of the experiments. Subjects evaluated both the virtual prototype and actual product from three aspects: Physical/appearance, usability, and emotional response by the measure of single-answer questions, procedural correctness, and an emotional scale, respectively. A statistical analysis of the experimental results helps identify significant differences existing in the two evaluation forms. Specific product functions showing the differences were also recognized from the analysis. The design of the questions (single answer with five options) was not justified compared to other alternatives. This is a limitation of the methodology used by this study.
The second stage is to compare the performance of a virtual prototype on those product functions integrated with different feedbacks. The comparison was focused on the aspects of usability and emotional response. Similar to the previous stage, they were measured by procedural correctness and the emotional scale, respectively. The experimental results were then analyzed to determine whether or not including the feedbacks improves the two measures.
The relative order of obtaining the SAM scale in the experimental procedure influences the effectiveness of evaluating emotional responses. As shown in
Figure 1, subjects gave a score on the SAM scale right after they had determined a design attribute or operated a product function. Under such circumstance, the time lag between experiencing an activity and subjectively assessing the experience is minimized. This justifies the use of the SAM scale.
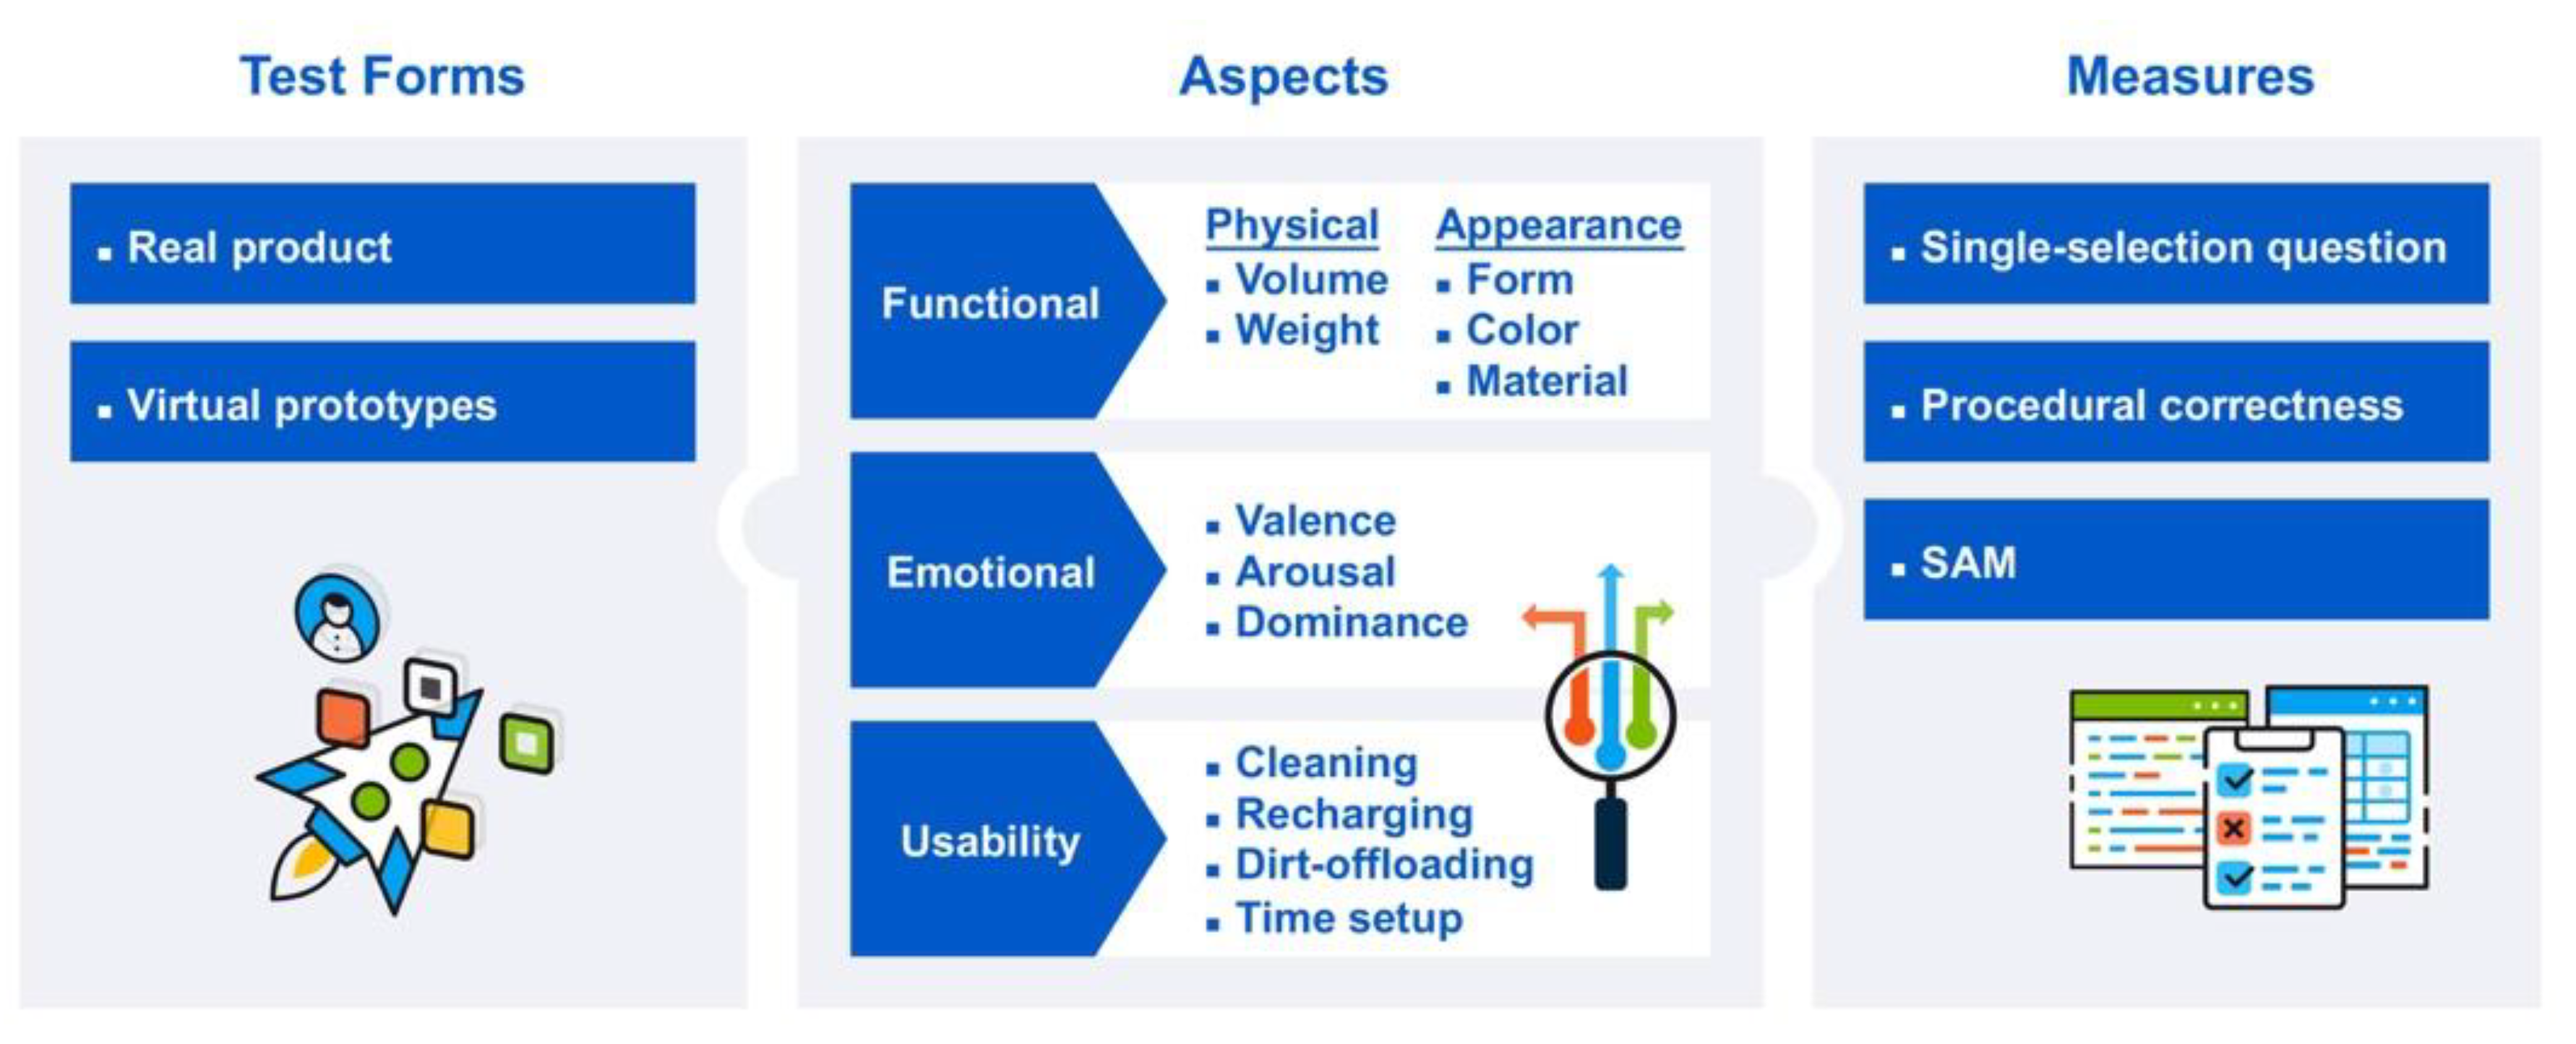
In this study, we compared two product forms (real and virtual) from three aspects (functional, usability, emotional) using both quantitative (single-selection questions, procedure correctness) and qualitative measures (SAM), respectively. As shown in
Figure 2, experiments were systematically carried out to understand the advantages of using an actual representative product over using visual virtual prototypes. The analysis of experimental data can reveal the potential means of improving the virtual prototypes in the evaluation of product design.
The users’ perception of the product’s dimensions, shape, and weight is critical with regard to influencing the user’s experience and purchase decision of the product [
23]. It is important to understand whether or not product users can correctly recognize the product’s physical attributes such as volume and weight. Design evaluation is also highly related to the human’s perception of the product shape, color, and material. In the experiments, subjects evaluated those physical and appearance attributes by answering a single selection question for each attribute (see
Appendix A). They operated specific product functions with both the virtual prototype and actual product in the usability assessment. The operation of each function follows a well-defined procedure. The product usability was measured by the procedural correctness. In addition, we assessed the subjects’ emotional responses during the attribute evaluation processes and the operation procedures mentioned above.
2.1. Aspects of Design Evaluation in the Experiment
2.1.1. Evaluation Attributes in Physical Aspect
A design evaluation method should allow people to easily estimate a product from various physical aspects. Each subject has to determine three quantitative values for the given prototypes considered in the experiments:
Unreferenced volume: Estimating a product’s volume without a reference object.
Referenced volume: Estimating a product’s volume with a reference object. A 150-mm ruler is used as a reference in the experiments.
Weight: Estimating a product’s weight.
2.1.2. Evaluation Attributes in Appearance Aspect
Form, color, and material are three commonly known elements constituting the appearance of a product. These elements are prominent factors signifying the perceptual responses of a user to a product [
23]. In this study, the test product was relatively simple with regard to changing the three elements.
Form: How are the form features or shapes perceived?
Color: How are the colors perceived?
Material: How are the materials perceived?
2.1.3. Evaluation Attributes in Usability Aspect
Usability is related to the performance of a specific task or product function. From this viewpoint, we devised the following user tasks to allow the participants to operate the prototype of an automatic cleaning device.
Cleaning: Activating the cleaning process.
Recharging: Sending the device back to the charging base and recharging it.
Time setup: Setting up the cleaning time.
Dirt offloading: Removing the collected dirt from within the container of the device.
2.1.4. Evaluation Attributes in Emotional Aspect
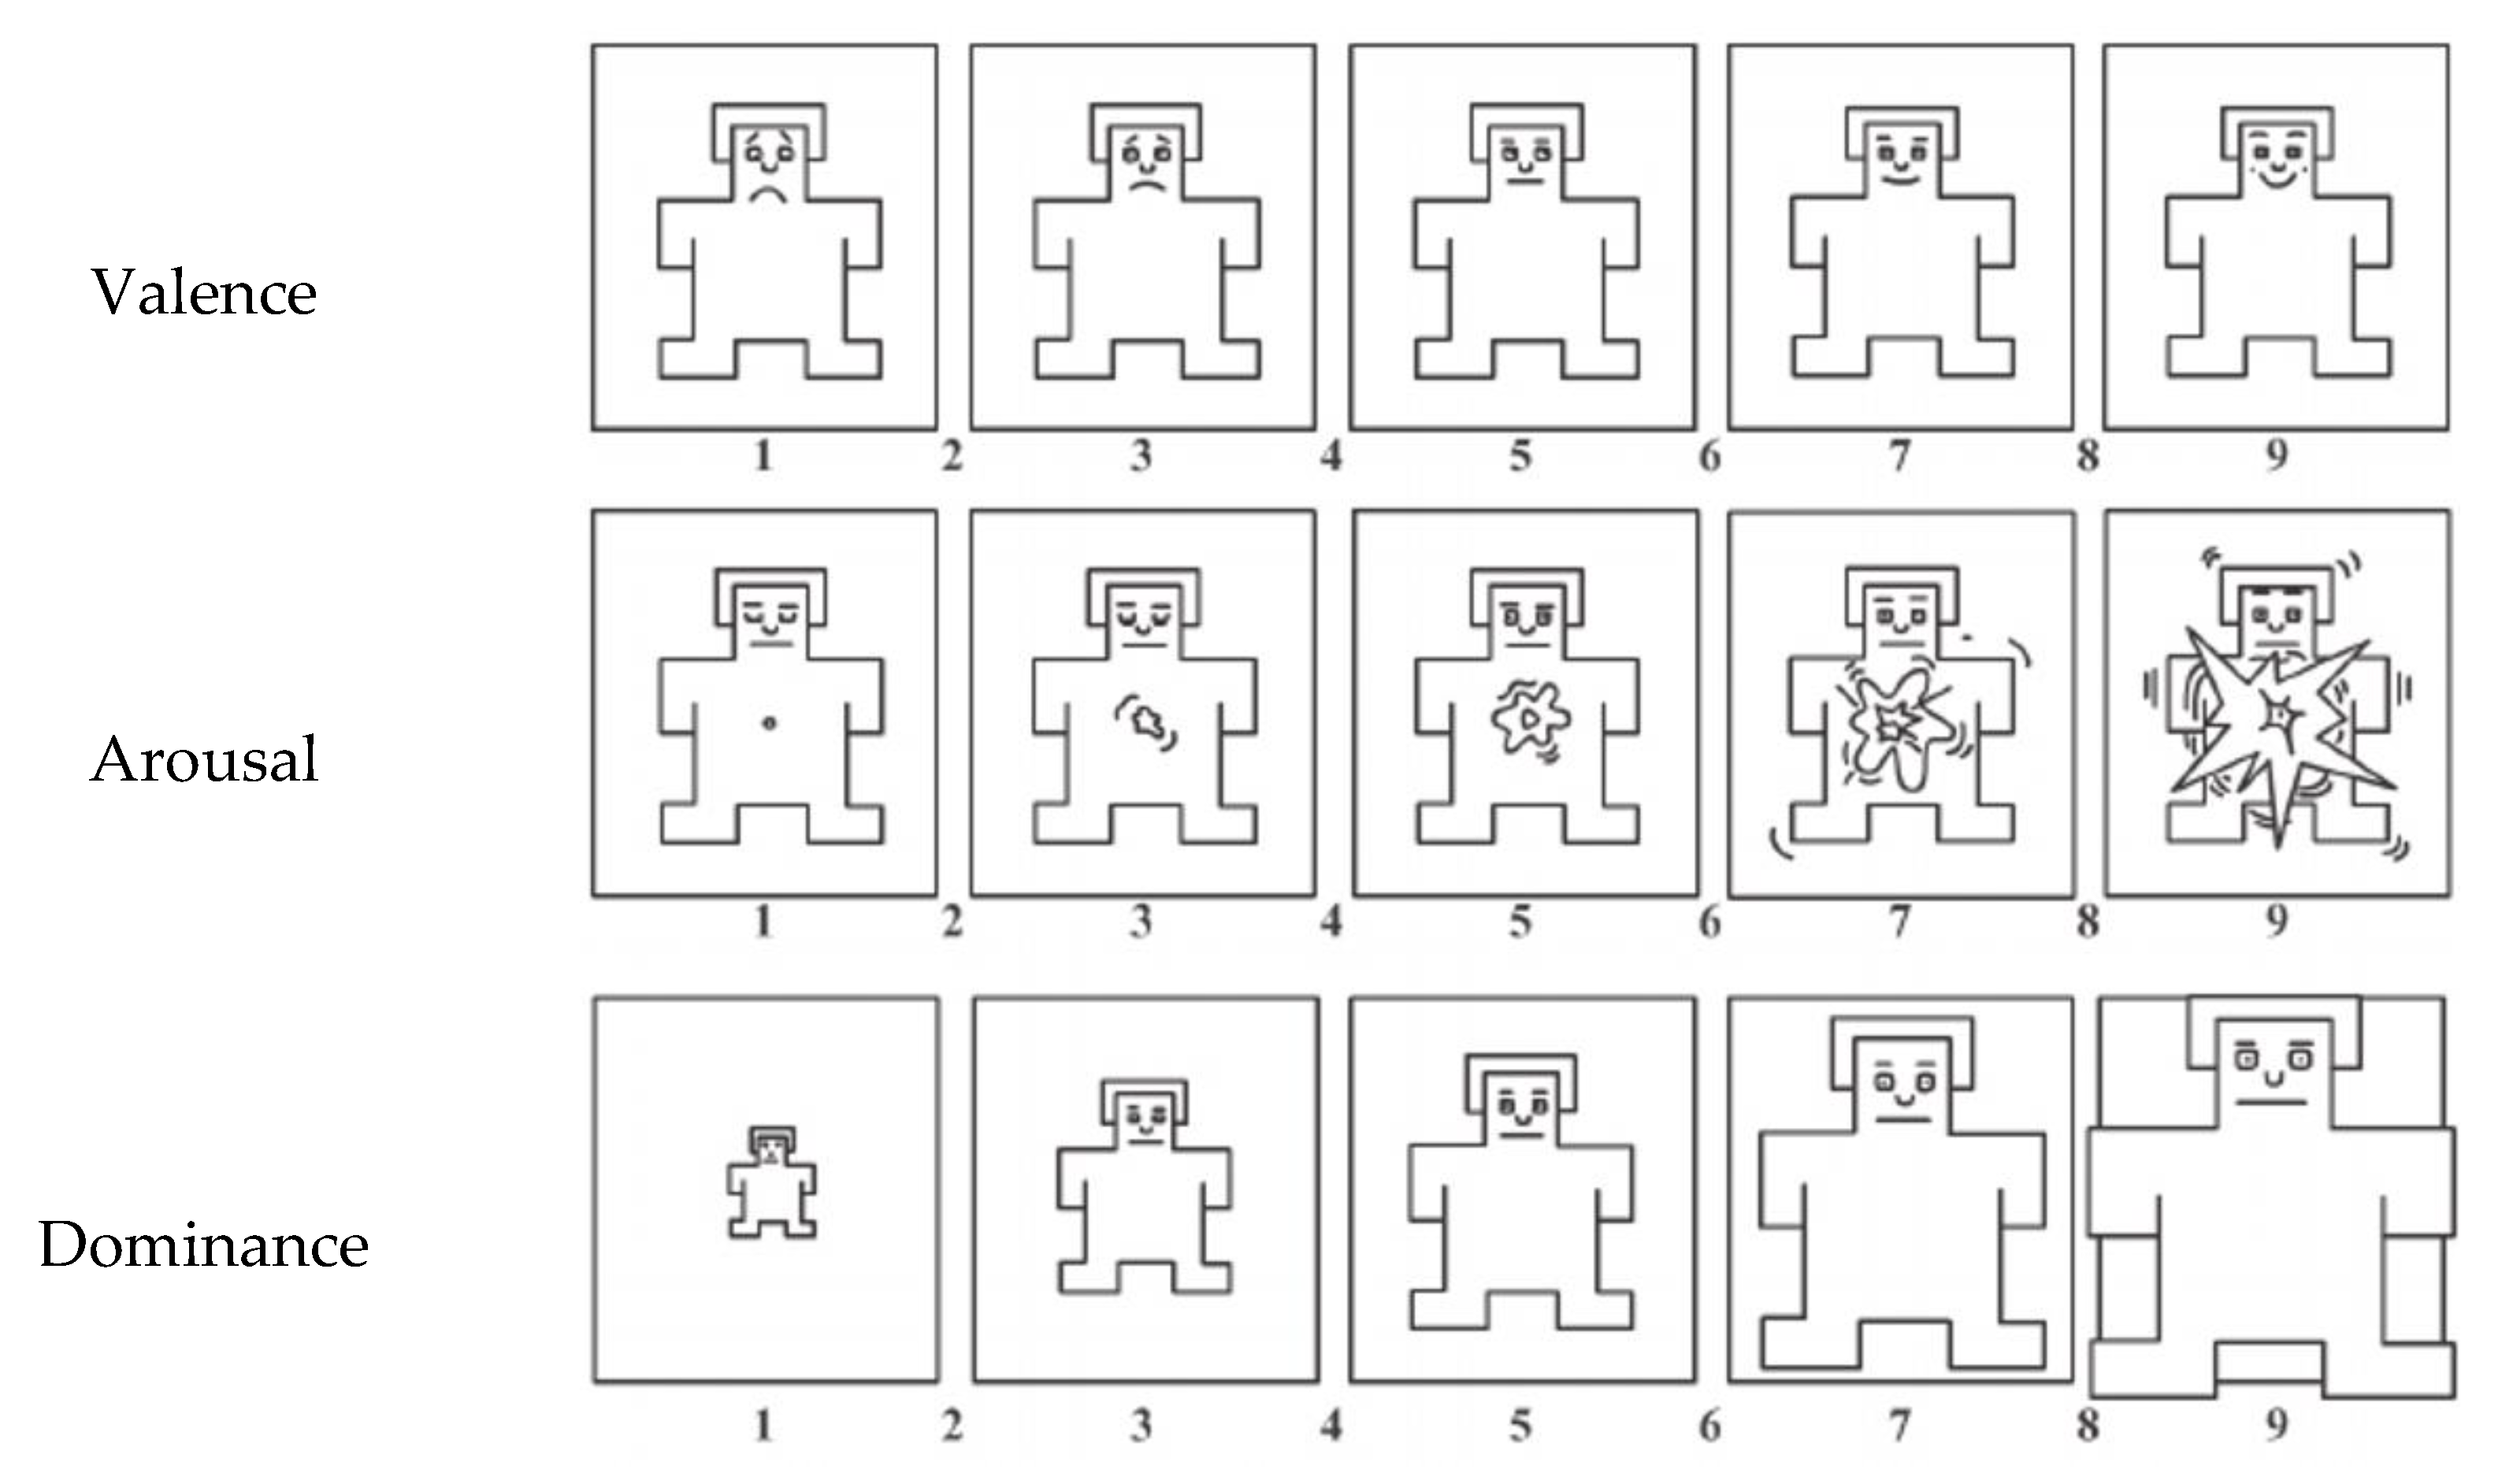
It would be interesting to recognize the emotional responses of a subject when conducting individual evaluation tasks. We employed the self-assessment manikin (SAM) scale, which was developed by Bradley and Liang [
24]. This is a visually-based emotional scale developed according to the three emotional constructs proposed by Russell and Mehrabian [
25]. For each construct, there exists five pictorial manikins, each of which is accompanied by a nine-level scale. As shown in
Figure 3, the three constructs are:
Valence (negative-positive),
Arousal (passive-active), and
Dominance (dominated-dominant).
SAM has been used in several design-related studies to evaluate the users’ emotional responses to products [
26]. Its visual approach can facilitate cross-cultural studies of product evaluation without the need of dealing with different languages [
27]. Moreover, SAM is freely available and straightforward to use.
2.2. Experiment Design
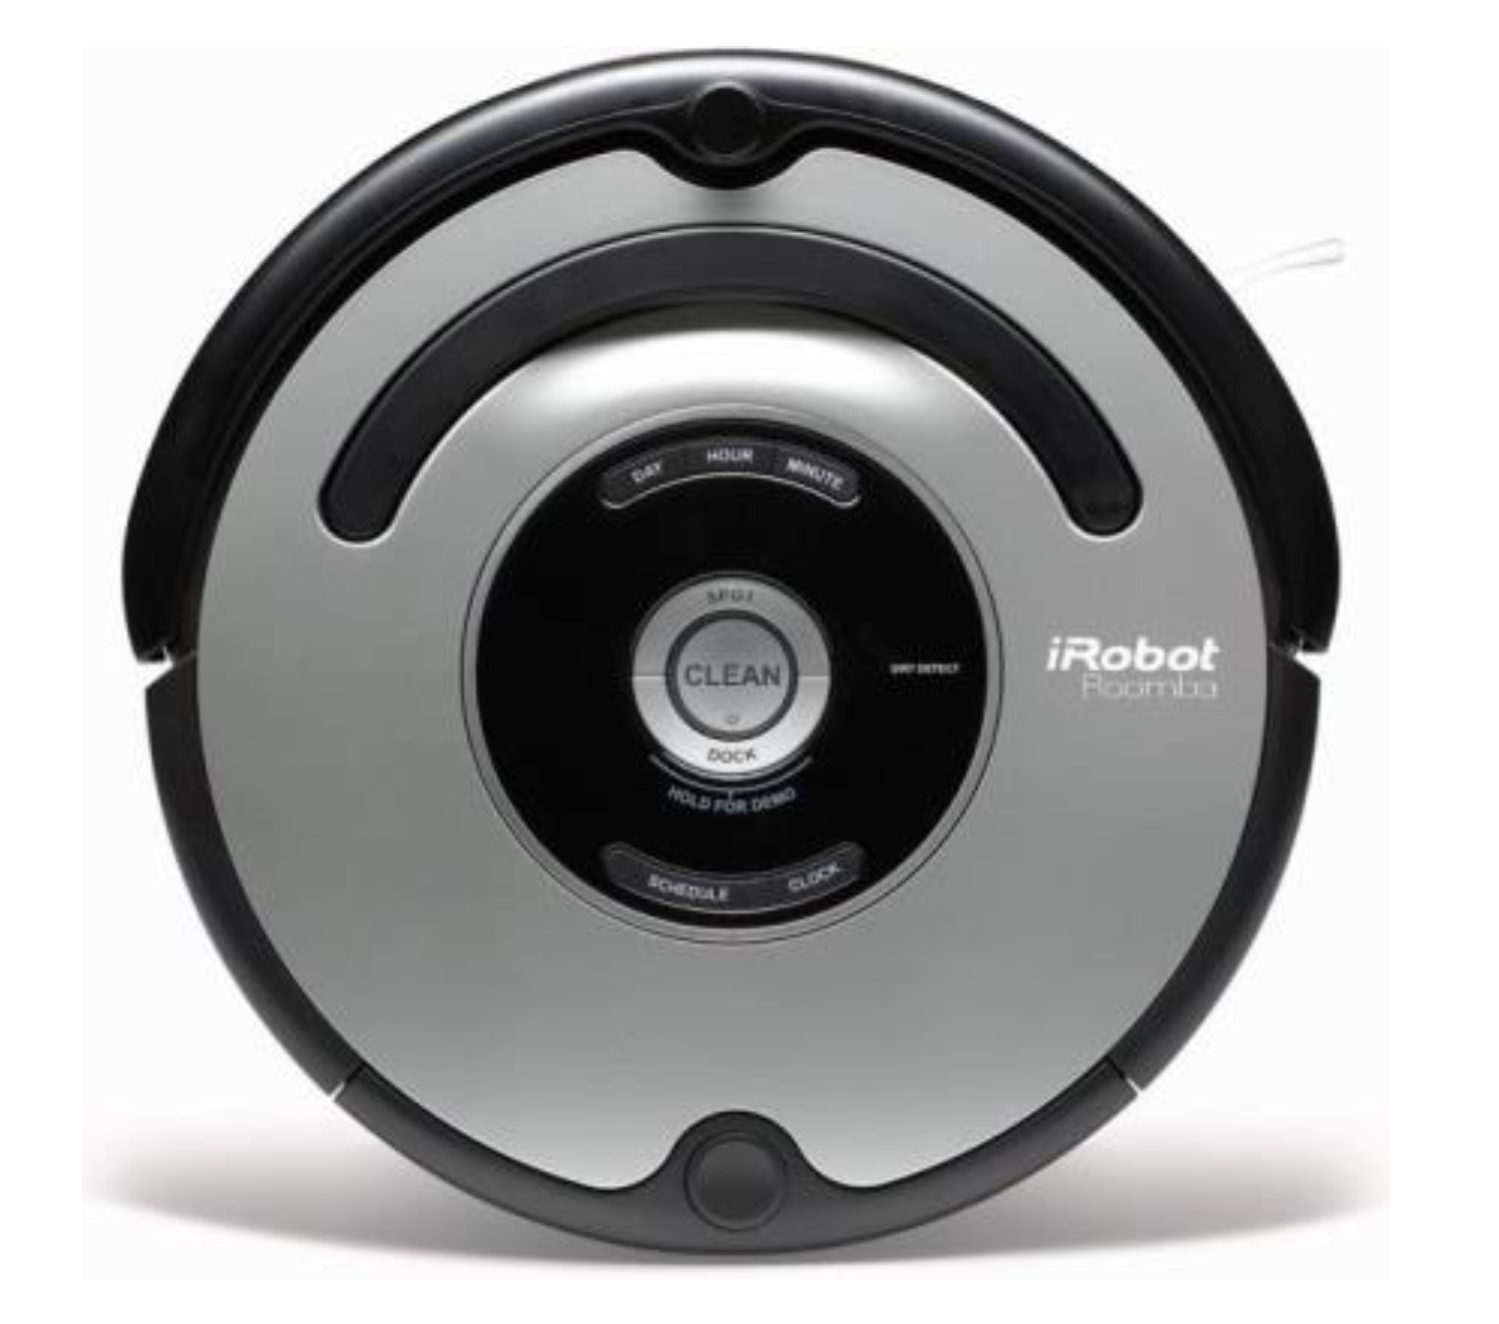
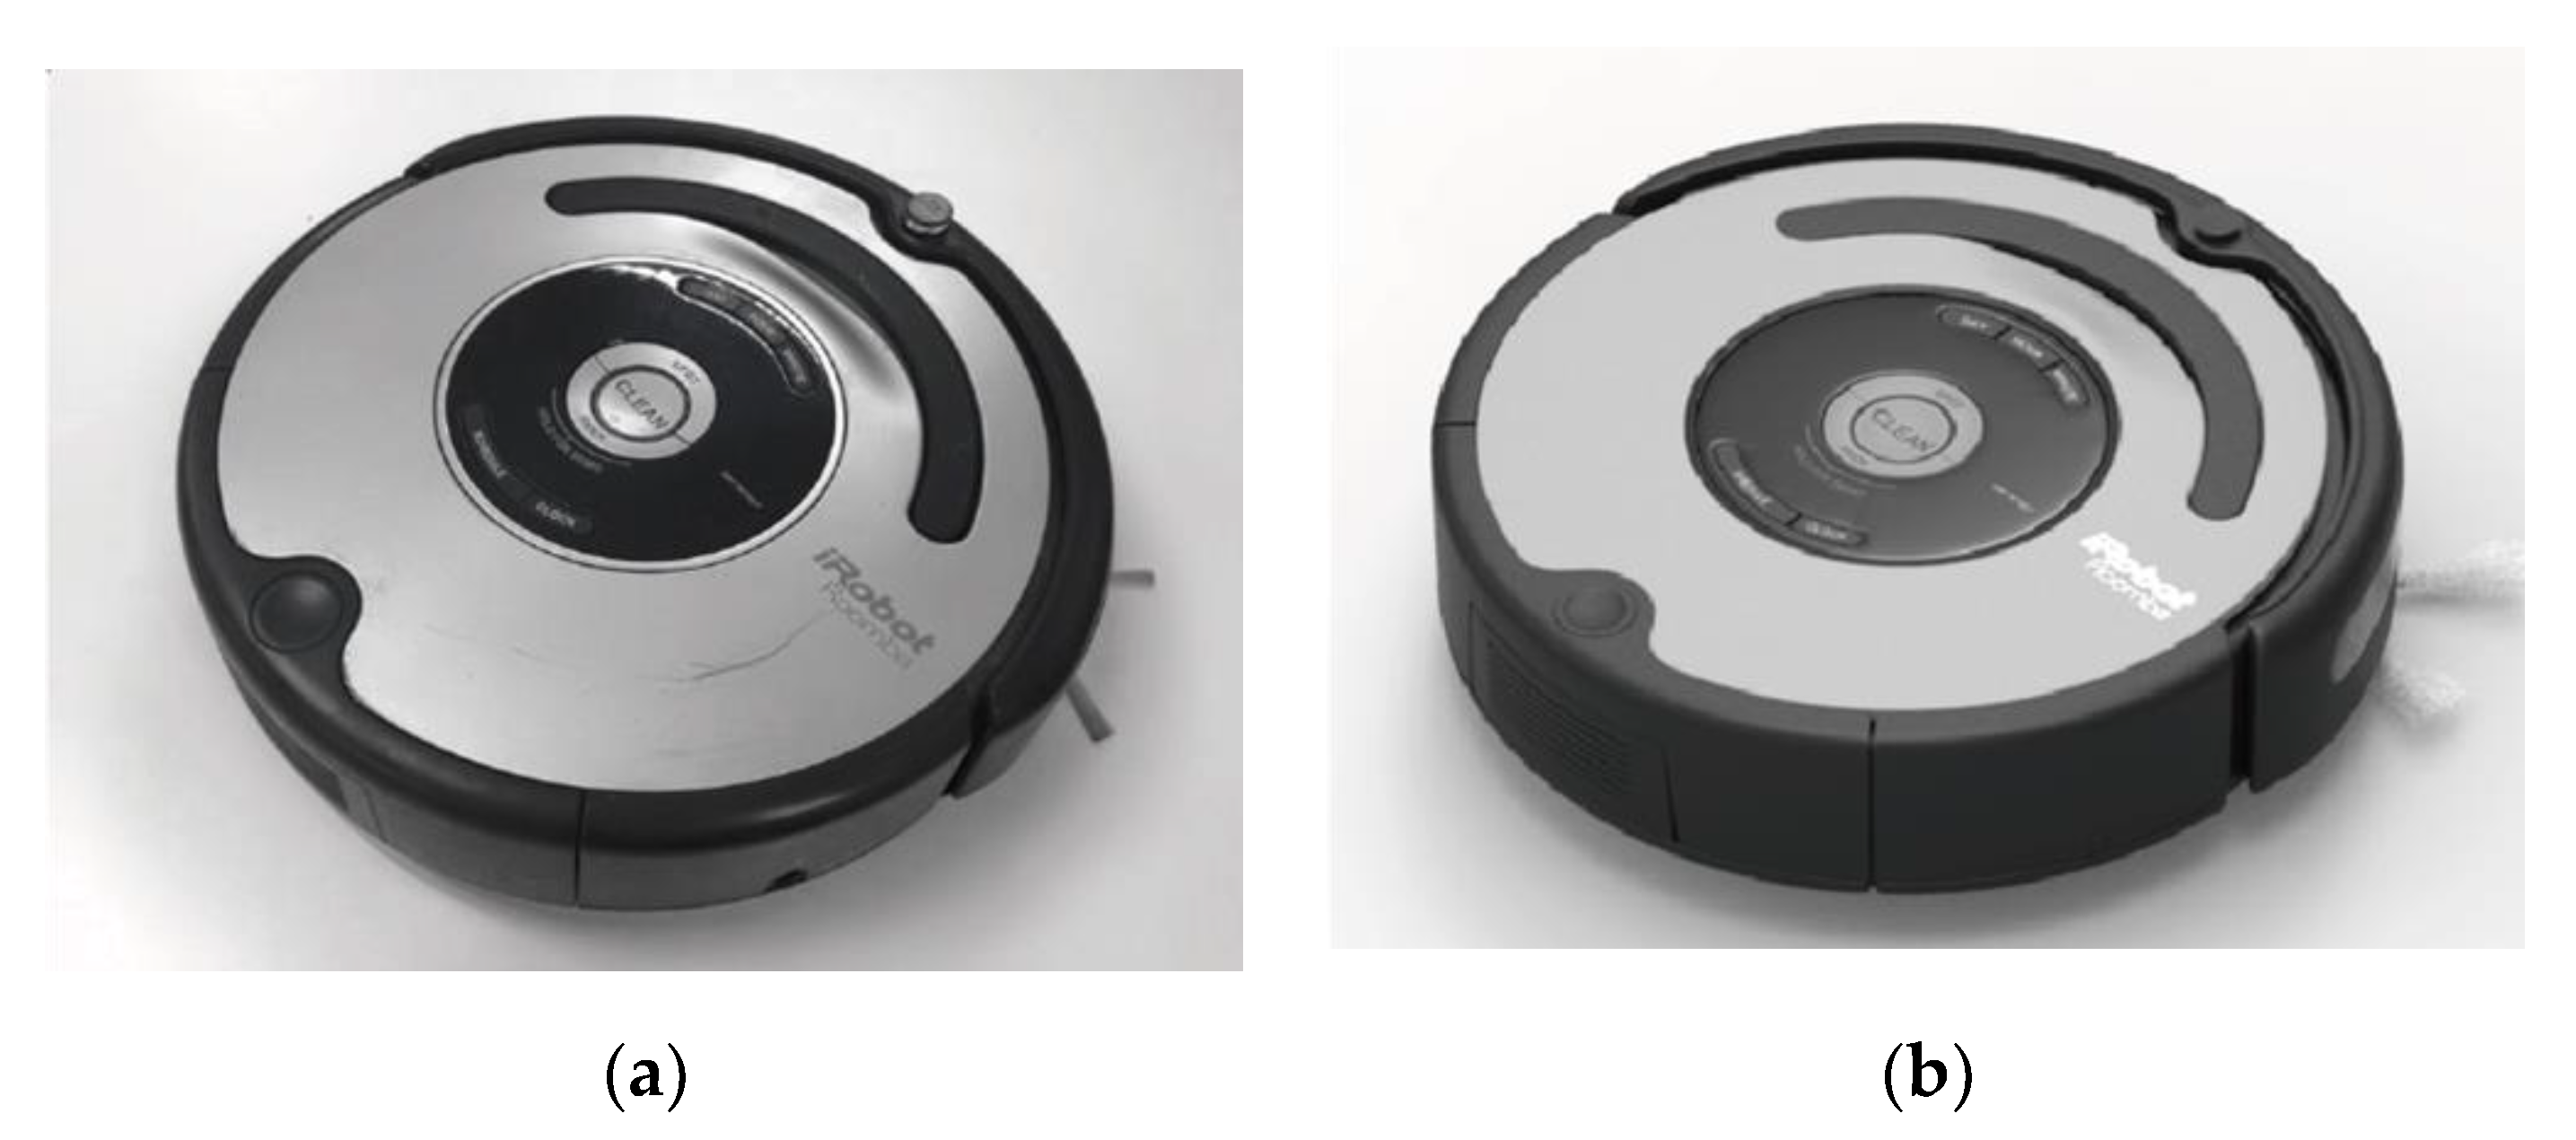
As shown in
Figure 4, the representative product used in this study was a smart vacuum cleaner (Roomba5815, produced by iRobot). When activated, this smart device collects dirt from the floor by travelling around the house while avoiding obstacles. We selected this product because the participants were expected to have limited knowledge and experience of using this type of product. Therefore, the confounding effect of prior experience was reduced.
We recruited a group of 50 different Taiwanese people in operating the test product and a virtual prototype, respectively. There were 100 participants involved at the first stage of the experiments with an equal female-to-male ratio. Those participants were aged from 20 to 29. Among them 82 people were college students and the others were engineers with one to four-year work experience. This group of people were not professional cleaners nor mainly responsible for house cleaning work in their households. They were less likely to have used the test product. The confounding effect of prior experience was thus reduced. However, they did have substantial experience in using electronic devices and were familiar with the icons and symbols commonly used on such devices. At the second stage of the experiments, a group of 30 different people conducted the design evaluation with auditory, visual, and combined feedback, respectively. Those 90 participants have the same profile as the first stage. In summary, there were two groups of 50 people in the first test and three groups of 30 people in the second one.
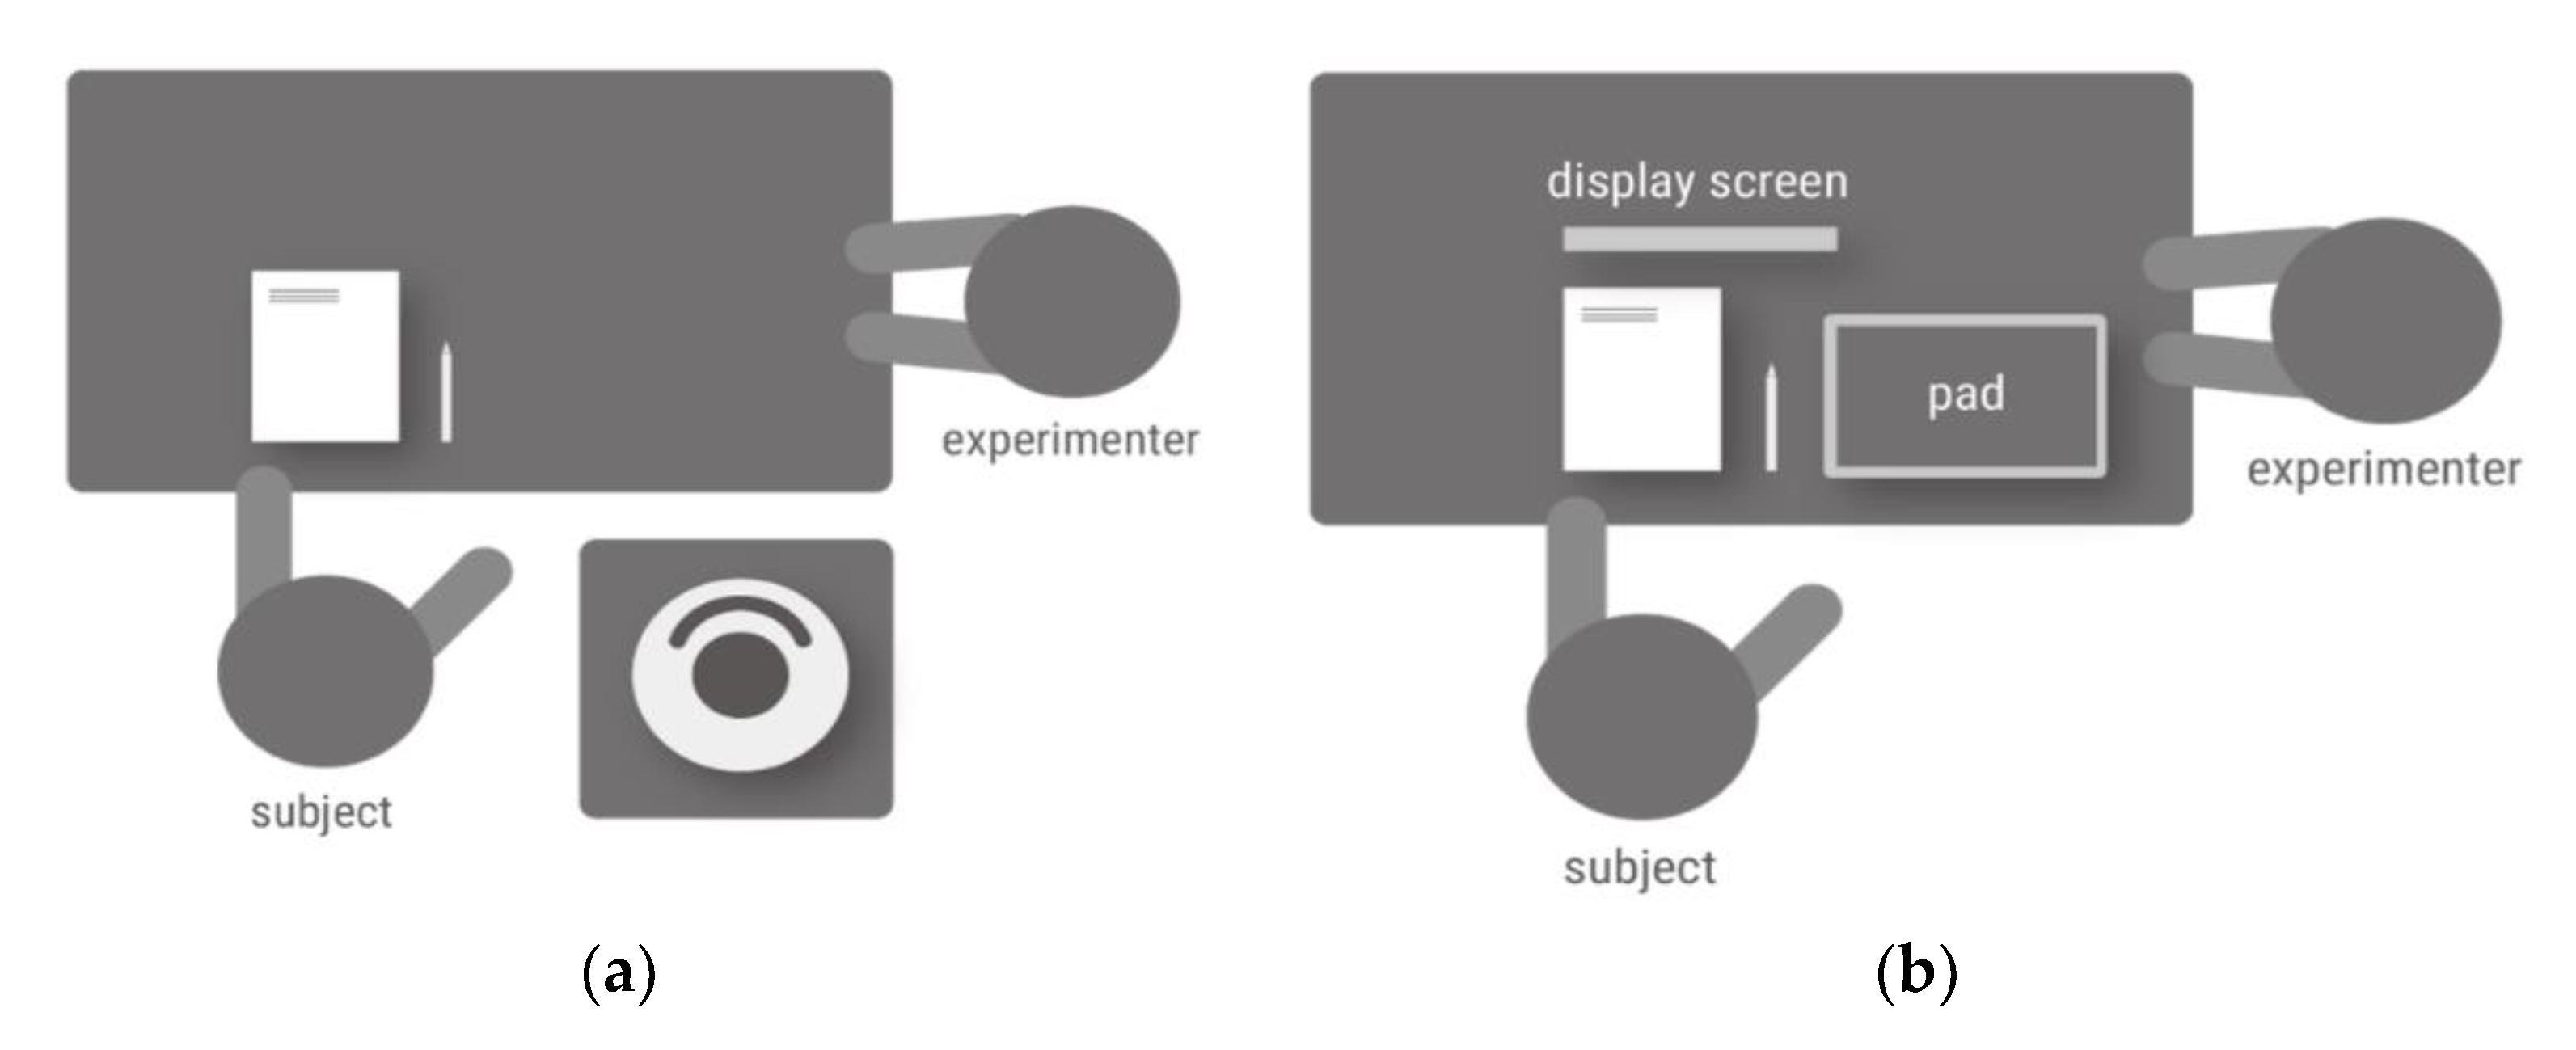
The experiments were carried out in a quiet room with sufficient lighting and space for the participants to comfortably perform the experimental tasks. In an orientation session prior to the experiment, the experimenter explained the procedure and testing rules, and the participants were free to ask questions during the session. Talking was not allowed during the actual experiment. The experimental setup for the physical and virtual groups, respectively, will now be described. As shown in
Figure 5a, the smart vacuum cleaner was placed in a low platform close to the ground. The participants inspected the device and performed the required tasks. They could freely lift the product with hands during the experiment for the weight estimation. Then, they responded to the questionnaire, including the SAM, by filling in the answer sheets that were placed on the desk.
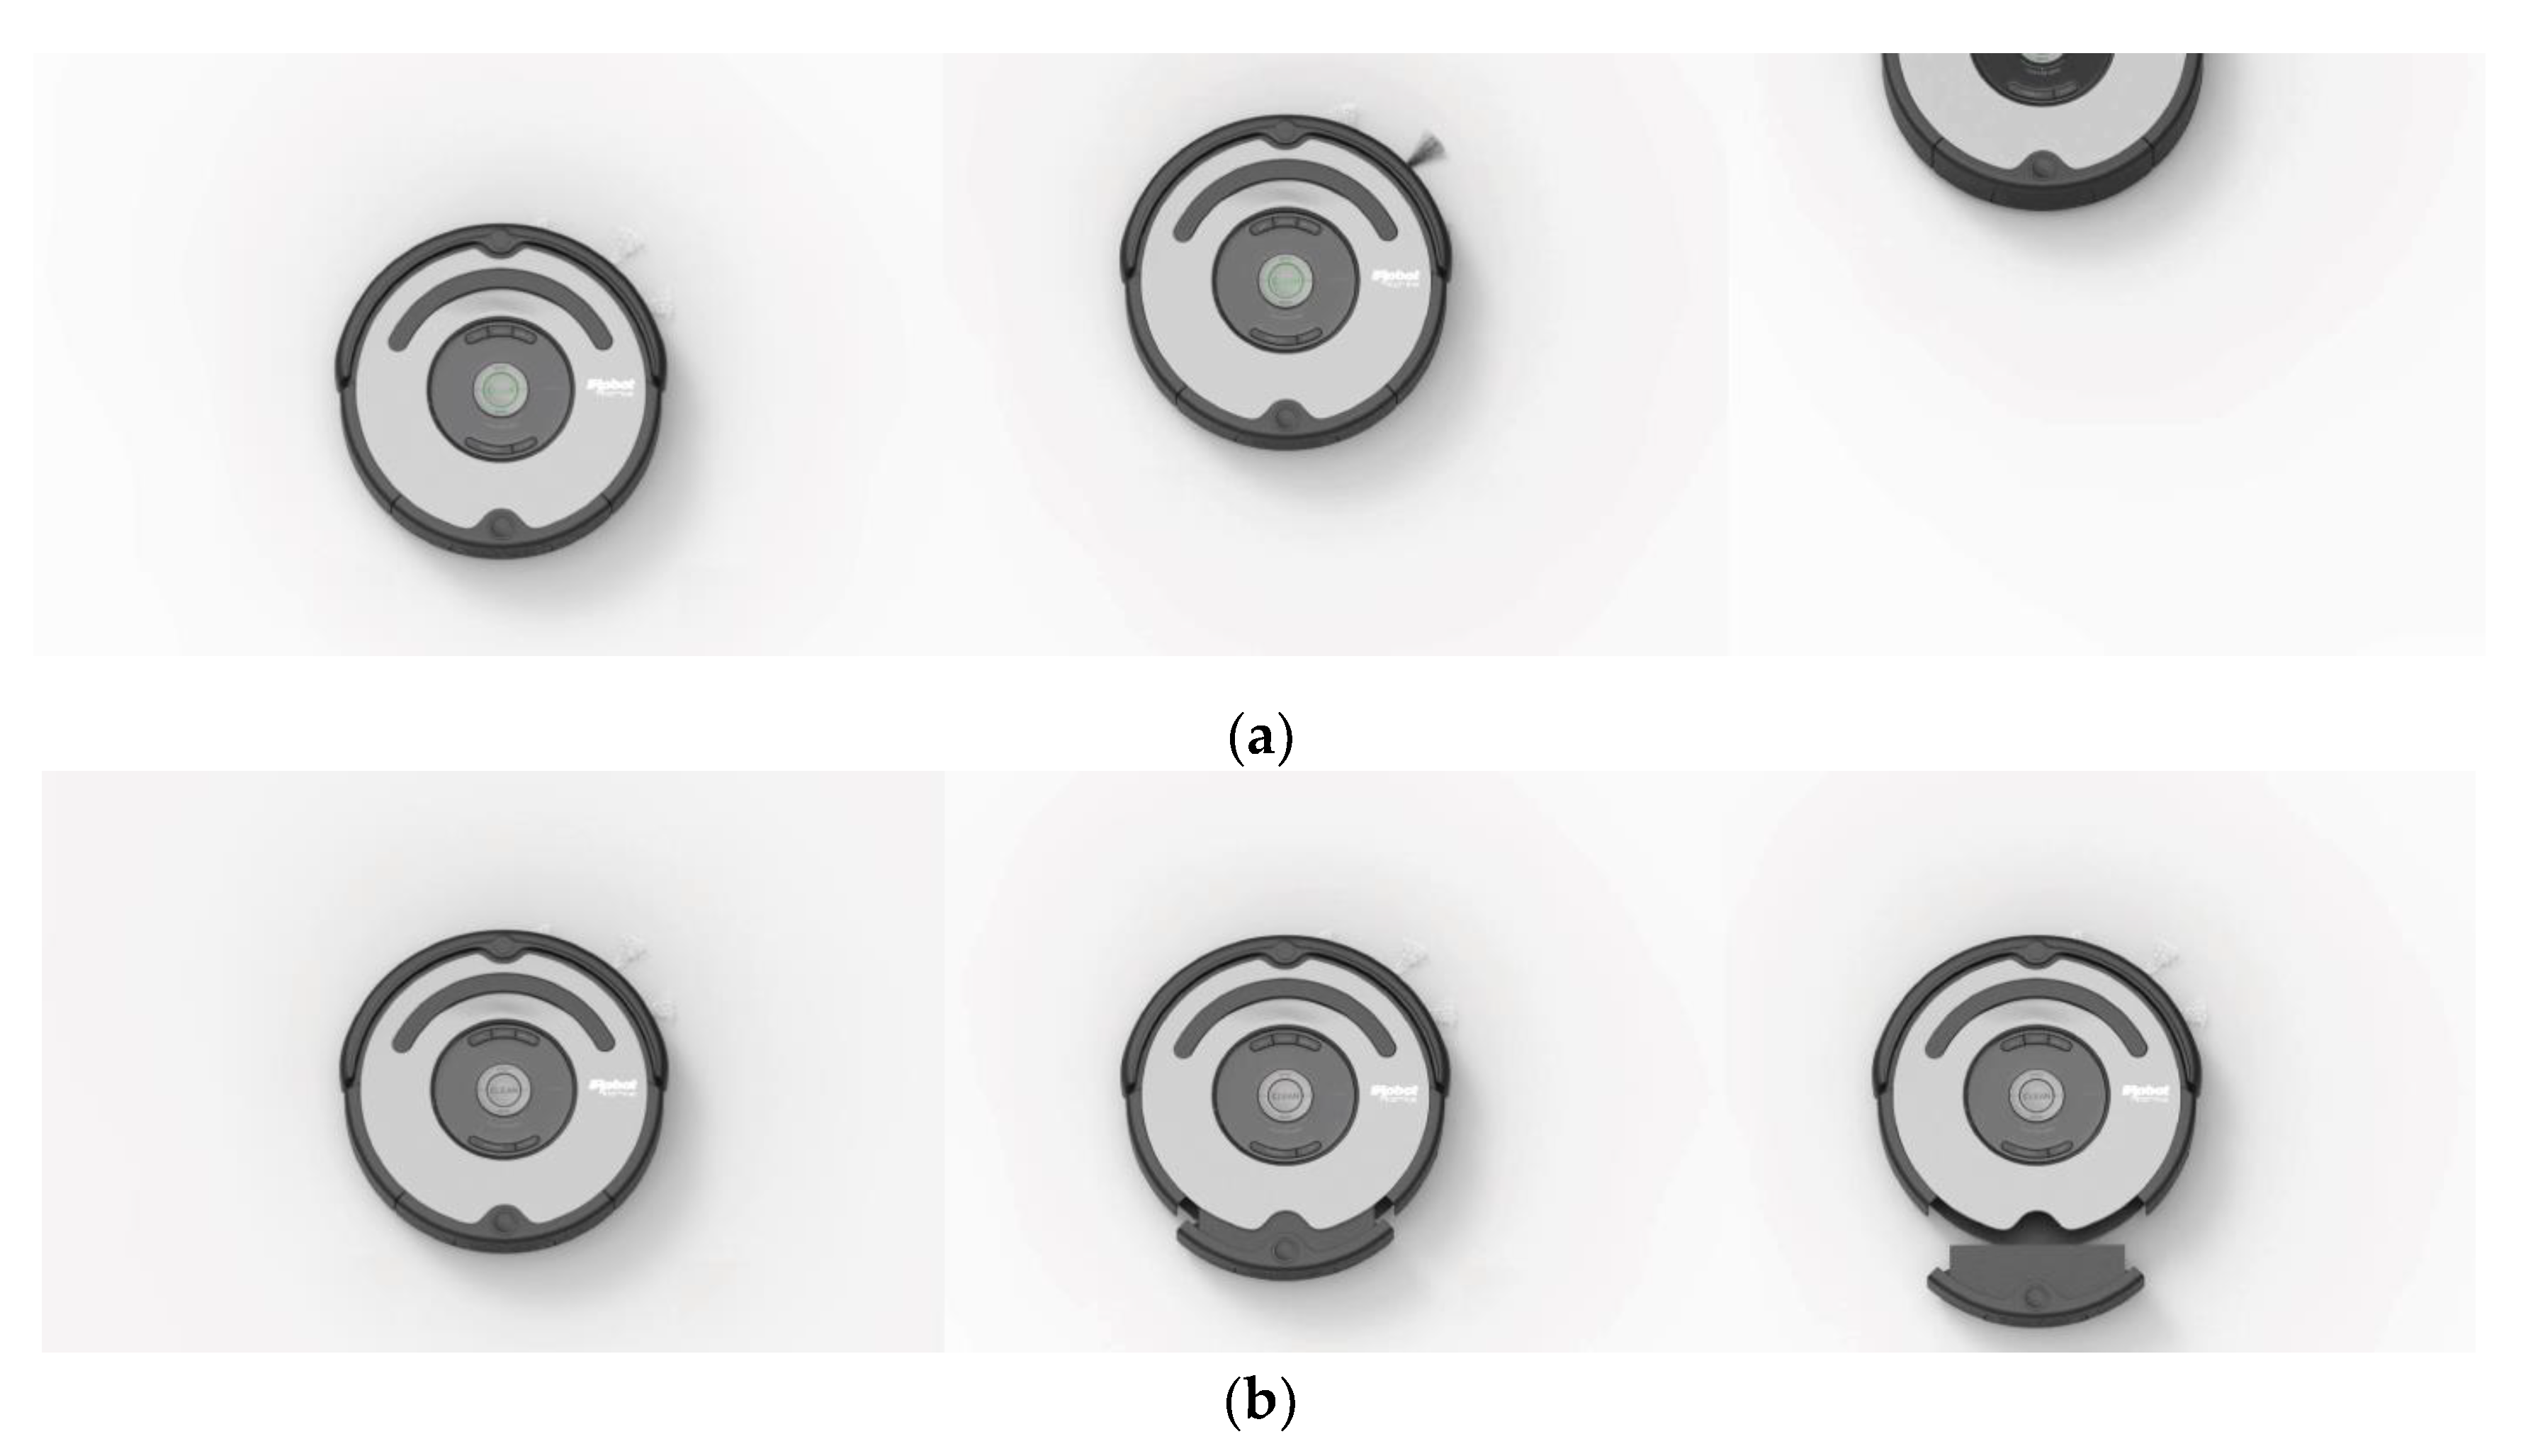
A highly realistic 3D model was developed as the visual virtual prototype of the smart device (
Figure 6). We used the 3D rendering software Keyshot 5 to render and display the model. The browsing mode in the software allowed the participants to freely rotate the prototypes in 3D space. Several interactive functions were implemented by using Axure RP (
https://www.axure.com/) to provide the user feedback that will be described in the next section. The software ran on a tablet device. When performing the usability tasks, the participants touched the pad’s screen to operate the prototype’s interface. The participants were then requested to respond according to the SAM scale.
2.3. Experimental Procedure
The first part of the experiments aimed to determine to which extent the visual virtual prototypes were different from the physical product. We asked the participants to estimate the physical dimensions and appearance of the two media and used them to carry out the usability tasks. They needed to fill out the SAM sheet after completing each task.
At the second stage, the tasks with significant differences were selected as the user tasks for which additional feedback would be provided. They include auditory, visual, and combined feedback, and are described as follows:
Combined Feedback: After the same operations had been carried out by the participants, both the auditory and visual feedback was activated during the execution of the tasks. Before conducting the actual experiments, we conducted a pilot study to test the experimental environment and the tasks assigned to the users. Four participants were recruited to attend the pilot study; that is, two participants for each group. The actual experiments were improved based on their suggestion. For example, the platform was adjusted to a lower position. Prior to the experiments, a verbal explanation was provided by the conductor, who also suggested to include a sample question and its answer in order to demonstrate the response process. The task instructions were re-written in a clear and concise manner.
In the experiments regarding the physical and appearance aspects, the participants were requested to fill in two questionnaires: The answer sheet for the evaluated product features and the SAM scale. In the usability tests, the accuracy with which the participants performed the tasks was determined directly from the test results. The SAM was also used to monitor the emotional responses. Instead of asking the participants to fill in the names of product attributes, we used single-choice questions. The main questions were listed with five optional answers. The participants selected the answer they believed to be the correct one.
3. Results and Discussion
3.1. Physical Aspects
Accuracy: The physical group achieved a higher accuracy of 62% in comparison to the virtual group’s accuracy of 53% with regard to volume estimation. However, the results obtained with the chi-square test revealed that this difference was not statistically significant.
Emotional responses: Only the valence result was statistically significant. The physical group was in a relatively more positive state.
Accuracy: Both groups achieved a higher level of accuracy (physical: 72%, virtual: 64%), as shown in
Table 1a,b. The accuracy of the virtual group increased to a level similar to that of the physical group without the reference. This may indicate that adding a reference object could enhance the prediction capability of the virtual prototypes. The chi-square test result revealed that the performance of both groups was significantly different (see
Table 1c). The physical group tended to underestimate the volume, while the virtual group tended to overestimate it.
Emotional responses: The two groups had no significant differences.
Accuracy: Both groups achieved a relatively low accuracy. The chi-square test result revealed that the performances were not significantly different, and the physical and virtual features did not seem to provide a good hint for weight estimation.
Emotional responses: Only the valence construct was significantly different between the two groups. Using the physical product seemed to invoke a more positive emotional response in comparison with using the visual virtual prototype.
3.2. Appearance Aspect
Accuracy: Both groups performed very well by achieving over 90% accuracy. The chi-square test result indicated no significant difference between the two groups.
Emotional responses: Only the valence construct was significantly different between the two groups. The physical group was in a more positive emotional state.
Accuracy: The physical group achieved higher accuracy (62%) in comparison to the virtual group (48%). This result may be natural because the real product should, by all means, have the “right” color. The chi-square test result revealed that the difference was not statistically significant.
Emotional responses: The two groups reacted differently in terms of the valence construct and arousal construct. The physical group was in a more positive state when evaluating the colors of the physical product, while the virtual group was in a more aroused state when evaluating the colors of the virtual prototype.
Accuracy: The physical group performed rather well, with an accuracy of 96%, while the virtual group achieved an accuracy of 76% (see
Table 2a,b). The chi-square test result shows that this difference is statistically significant (
Table 2c).
Emotional responses: As shown in
Table 2d, the two groups had a difference with regard to the valence construct. The physical group was in a more positive state.
3.3. Usability Aspects
Accuracy: The correct-hit rates of the physical and virtual groups were 80% and 86%, respectively (see
Table 3a,b). Interestingly, the virtual group performed better in this task.
Emotional responses: The two groups were significantly different in the valence and arousal constructs (
Table 3c). The physical group was in a more positive and aroused state, while the virtual group was in a more negative and passive state.
Accuracy: Both groups achieved high correct-hit rates (physical: 98%, virtual: 96%) as shown in
Table 4a,b, respectively. Recharging appeared to be a well-designed operating feature and easy for the participants to execute.
Emotional responses: The physical group was in a more positive and aroused state. The virtual group was in a more negative and passive state. The two groups had significant differences with regard to the valence and arousal constructs (see
Table 4c).
Accuracy: The participants were requested to set the time to Wednesday, 4:05 AM. The correct-hit rate of the physical and virtual groups was 96% and 86%, respectively.
Emotional responses: The two groups had no significant differences in their emotional states.
Accuracy: The virtual group achieved a higher correct-hit rate of 62% than the physical group’s rate of 58% (see
Table 5a,b). This could have been caused by the mechanism of the physical product requiring more manual work. However, for the virtual prototypes, a simple clicking action could accomplish the same task.
Emotional responses: The two groups reacted differently with regard to the valence and arousal constructs (see
Table 5c). The physical group was in a more positive and aroused state, while the virtual group was in a more negative and passive state.
Table 6 summarizes all the evaluation tasks in which the actual product and visual virtual prototypes exhibited a statistically significant difference. The estimation results for the product volume, color, and material of the virtual prototype produced lower accuracy results in comparison with the estimation results for the same aspects of the actual product. However, the latter failed to give a satisfactory degree of correctness (
Section 3.1 and
Section 3.2). One possible reason is that, regardless of whether the product was physical or virtual, to estimate the product dimensions and to recognize its color and material, practice and/or specialized training is required, which the participants did not have. Additionally, the actual product caused a more positive and aroused emotional state, when performing the evaluation tasks. The virtual product produced a more negative and passive state. Although the visual quality of the virtual prototype was highly realistic (
Figure 4), the participants might have expected additional sensory stimulus that matched their previous experience of interacting with actual products.
3.4. Providing Feedback
The results from the evaluation of usability revealed that the visual virtual prototypes invoked more negative and passive emotional responses, particularly with regard to the operations related to the cleaning and dirt-offloading tasks. It was advantageous to investigate whether adding an instant sensory feedback to these tasks could enhance the user experience. Thus, we incorporated auditory, visual, and combined feedback during the operations. The same usability tests (
Section 3.3) were conducted again. The objective was to determine whether various types of feedback could exert a different influence on the emotional responses and task performance. Not all feedback had a significant influence on the emotional responses or task performance with regard to the cleaning task.
Table 7 indicates a significantly different arousal state for the three feedback groups with regard to their dirt-offloading task responses. The combined feedback caused the highest level of arousal.
Subsequently, we gathered the data obtained by the first experiment for the same two tasks and analyzed the responses of the three feedback groups by using hypothesis testing. To facilitate the analysis, we encoded the groups with the following values: Physical group: +1; visual virtual group: −1; auditory feedback: −2; visual feedback: −3; combined feedback: −4. When conducting the following multiple comparisons, we used the combined group (−4) as the base reference.
Accuracy: There was no significant difference in the performance of the five groups.
Emotional responses (valence): According to
Table 8a, there was a significant difference among the five groups with regard to the valence construct. From the multiple comparisons listed in
Table 8(b), we could observe that differences existed between the combined feedback group and the visual virtual group without any feedback (−1). The addition of multiple sensory feedback improved the valence construct when the two tasks were carried out by using the virtual prototype. The combined group had the most positive emotional response.
Emotional responses (arousal):
Table 9a indicates that there was a significant difference in the arousal construct among the groups.
Table 9b shows that differences existed between the reference group and the auditory feedback group. The physical group had the highest level of arousal, while the combined feedback group had the second highest level of arousal, which was still higher than that of the visual virtual group. This indicates that the addition of combined feedback increased the arousal state to a level closer to that of the physical group.
Emotional responses (dominance): There was no significant difference in the groups with regard to the dominance construct.
Accuracy: In terms of accuracy, there was no significant difference in the performances of the five groups.
Emotional responses (valence):
Table 10a indicates that there were significant differences in the responses of the five groups with regard to the valence construct. According to the multiple comparisons shown in
Table 10), the responses of the combined feedback group were different than those of the visual virtual (−1) and auditory feedback (−2) groups. The combined feedback group produced a valence level that was higher than that of the physical group. All the feedback groups were in a more positive state in comparison to the visual virtual group.
Emotional responses (arousal): From
Table 11a, it can be seen that there was a significant difference in the responses of the five groups with regard to the arousal construct. Specifically, the difference existed between the combined feedback group and the visual feedback group (
Table 11b). The combined group had the highest level of arousal.
Emotional responses (dominance): A significant difference was not observed in the responses of the five groups with regard to the dominance construct.
In summary, the addition of combined feedback (visual and auditory) produced a statistically significant improvement with regard to the valence and arousal constructs, when performing the cleaning and dirt-offloading tasks with the virtual prototypes. The emotional states created in this manner could match those induced by using the actual product in the test results. In the experiments, an interesting observation was that most participants appeared to be positively surprised when they received feedback. Therefore, sensory feedback may have helped the virtual prototypes mimic the behavior of the actual product to a larger degree. A similar observation was reported in the previous study of product use experience with an integrated with sensory feedback [
28].
To test the reliability of the questionnaires, we analyzed the questionnaires collected from the physical and virtual groups with Cronbach’s Alpha test. The results revealed that the alpha value of the physical group’s questionnaires was 0.709, while that of the virtual group was 0.759. The value of all the questionnaires as a whole was 0.718. These numbers indicate the high reliability of the questionnaires and imply good consistency for the responses collected from different participants.
4. Conclusions and Future Work
The effectiveness of using virtual prototypes in design evaluation remains an active research topic. In this study, we conducted a comprehensive and systematic investigation to understand how effective visual virtual prototypes work in design evaluation in comparison with using a smart vacuum cleaner as a representative product. A series of experiments were devised to understand how well each product form (real and virtual) performs on design evaluation from three aspects (functional, usability, emotional) using both objective (single-selection questions, procedure correctness) and subjective measures (SAM), respectively. The motivation was to derive useful findings from the statistical analysis of the experimental data. They may benefit the development of product prototyping methods from the perspective of user-centric design evaluation. First, physical means still have some advantage in estimating the product volume, color, and material, in comparison to virtual means. This conclusion confirms the previous results [
7,
16]. Secondly, regardless of physical or virtual, to estimate the product dimensions and to recognize its color and material, practice and/or specialized training is required, which the participants did not have. The experimental result that both groups did not perform well in estimating the weight of the product may seem counter intuitive. We speculate that people have difficulty estimating a quantitative measure for weight. This issue was rarely mentioned by the related studies, though. In the usability tests, the visual virtual prototypes worked almost as well as the actual product in terms of using the product functions correctly. However, the two groups had different emotional responses when carrying out the same tasks. The visual virtual group without any sensory feedback generally tended to exhibit a more negative and passive emotional state. By adding user feedback, such as auditory and motion cues, the emotional responses towards the virtual prototypes changed to a level similar or higher to that of the physical product. The participants appeared to be positively surprised when they received feedback, which might have assisted the virtual prototypes in closely mimicking the behavior of the actual product. The past studies [
26,
28] suggested a similar effect of multimodal feedback in the product affective design.
Those findings may help improve the practicality of virtual prototyping in product development by adding useful features. They can also contribute to the design of interactive functions that will be suitable to emerging VR/AR applications, where user experience may be enhanced by integrating additional sensory feedback. To understand the effectiveness of product evaluation in VR /AR would be an interesting research topic. There are potential problems to be overcome in the research, though. The immersive experience created by a VR/AR environment may be too intense for subjects to focus on assessment measures related to design evaluation. The mental and physical workloads induced by the current devices can also bias the experimental result. Future work may also include a qualitative analysis to understand why users have certain emotional responses. Physiological measurements, such as eye tracking and the heart rate, can also be integrated to provide a more objective means of determining the users’ mental state during the evaluation. Emotion analysis using the facial expression recognition software may also help characterize their emotional responses with objective measures during the experiment.


