Two-Day Cardiopulmonary Exercise Testing in Females with a Severe Grade of Myalgic Encephalomyelitis/Chronic Fatigue Syndrome: Comparison with Patients with Mild and Moderate Disease


Abstract
:1. Introduction
2. Materials and Methods
2.1. Cardiopulmonary Exercise Testing (CPET)
2.2. Disability Metric
2.3. Statistical Analysis
3. Results
3.1. Baseline Characteristics
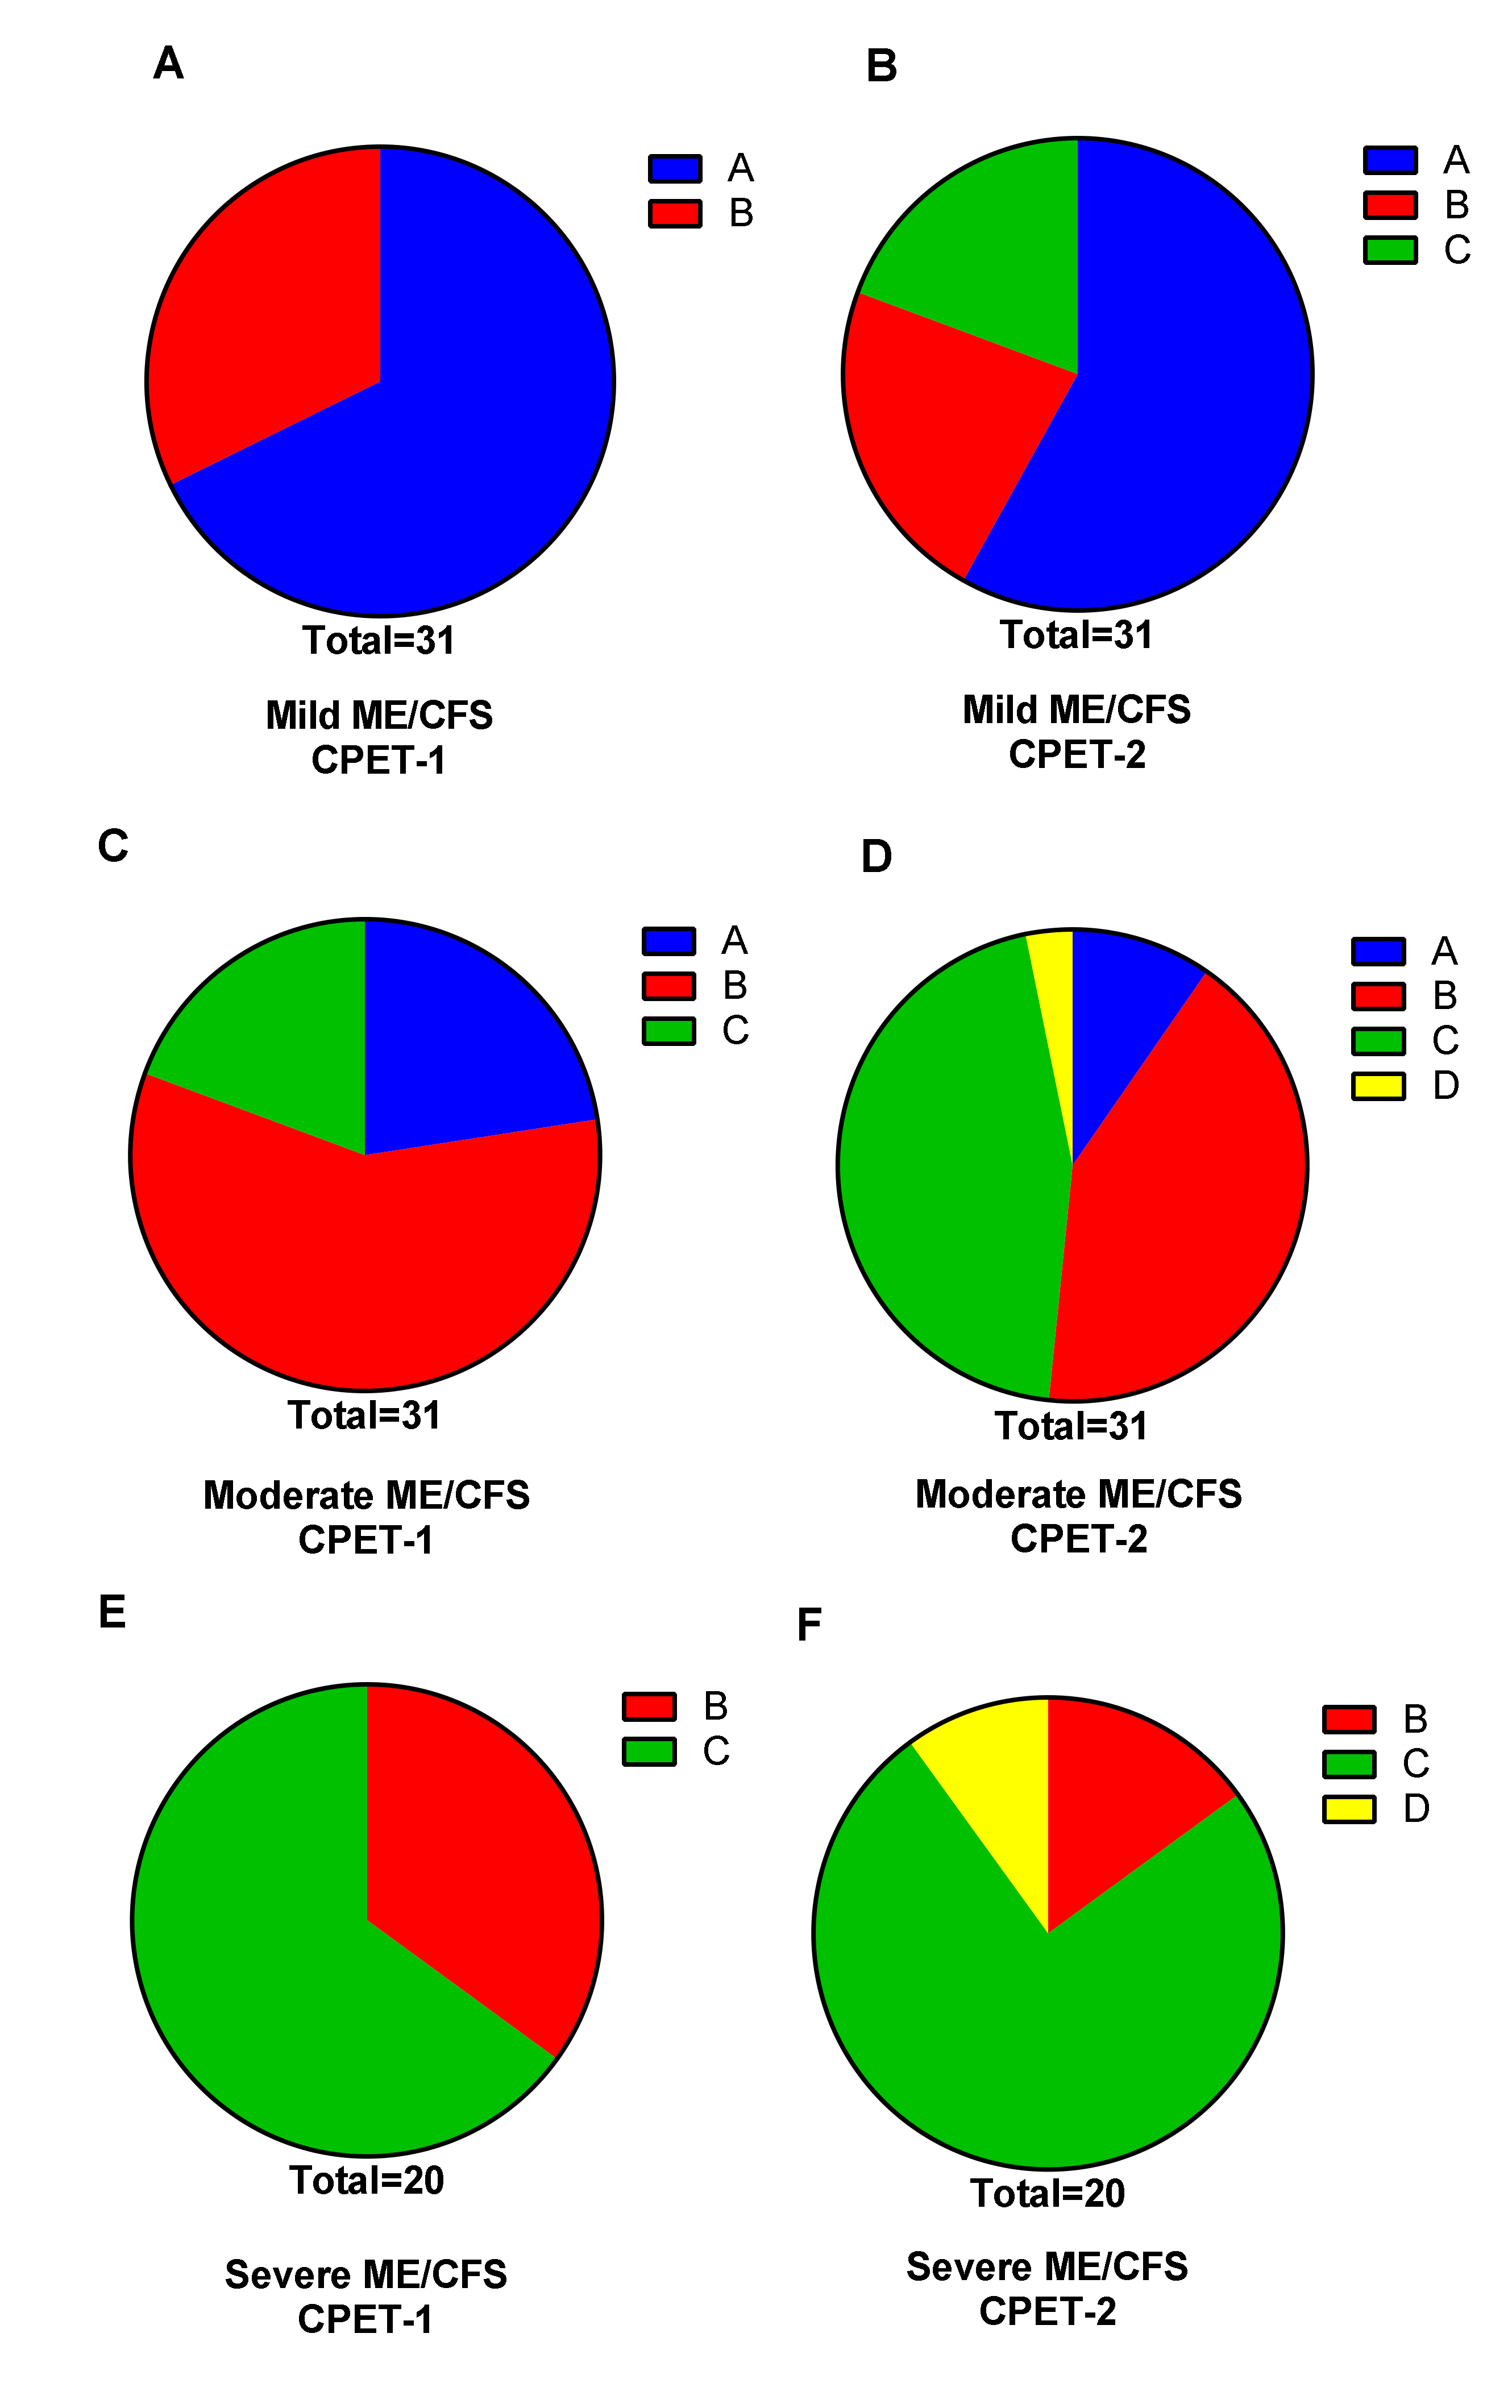
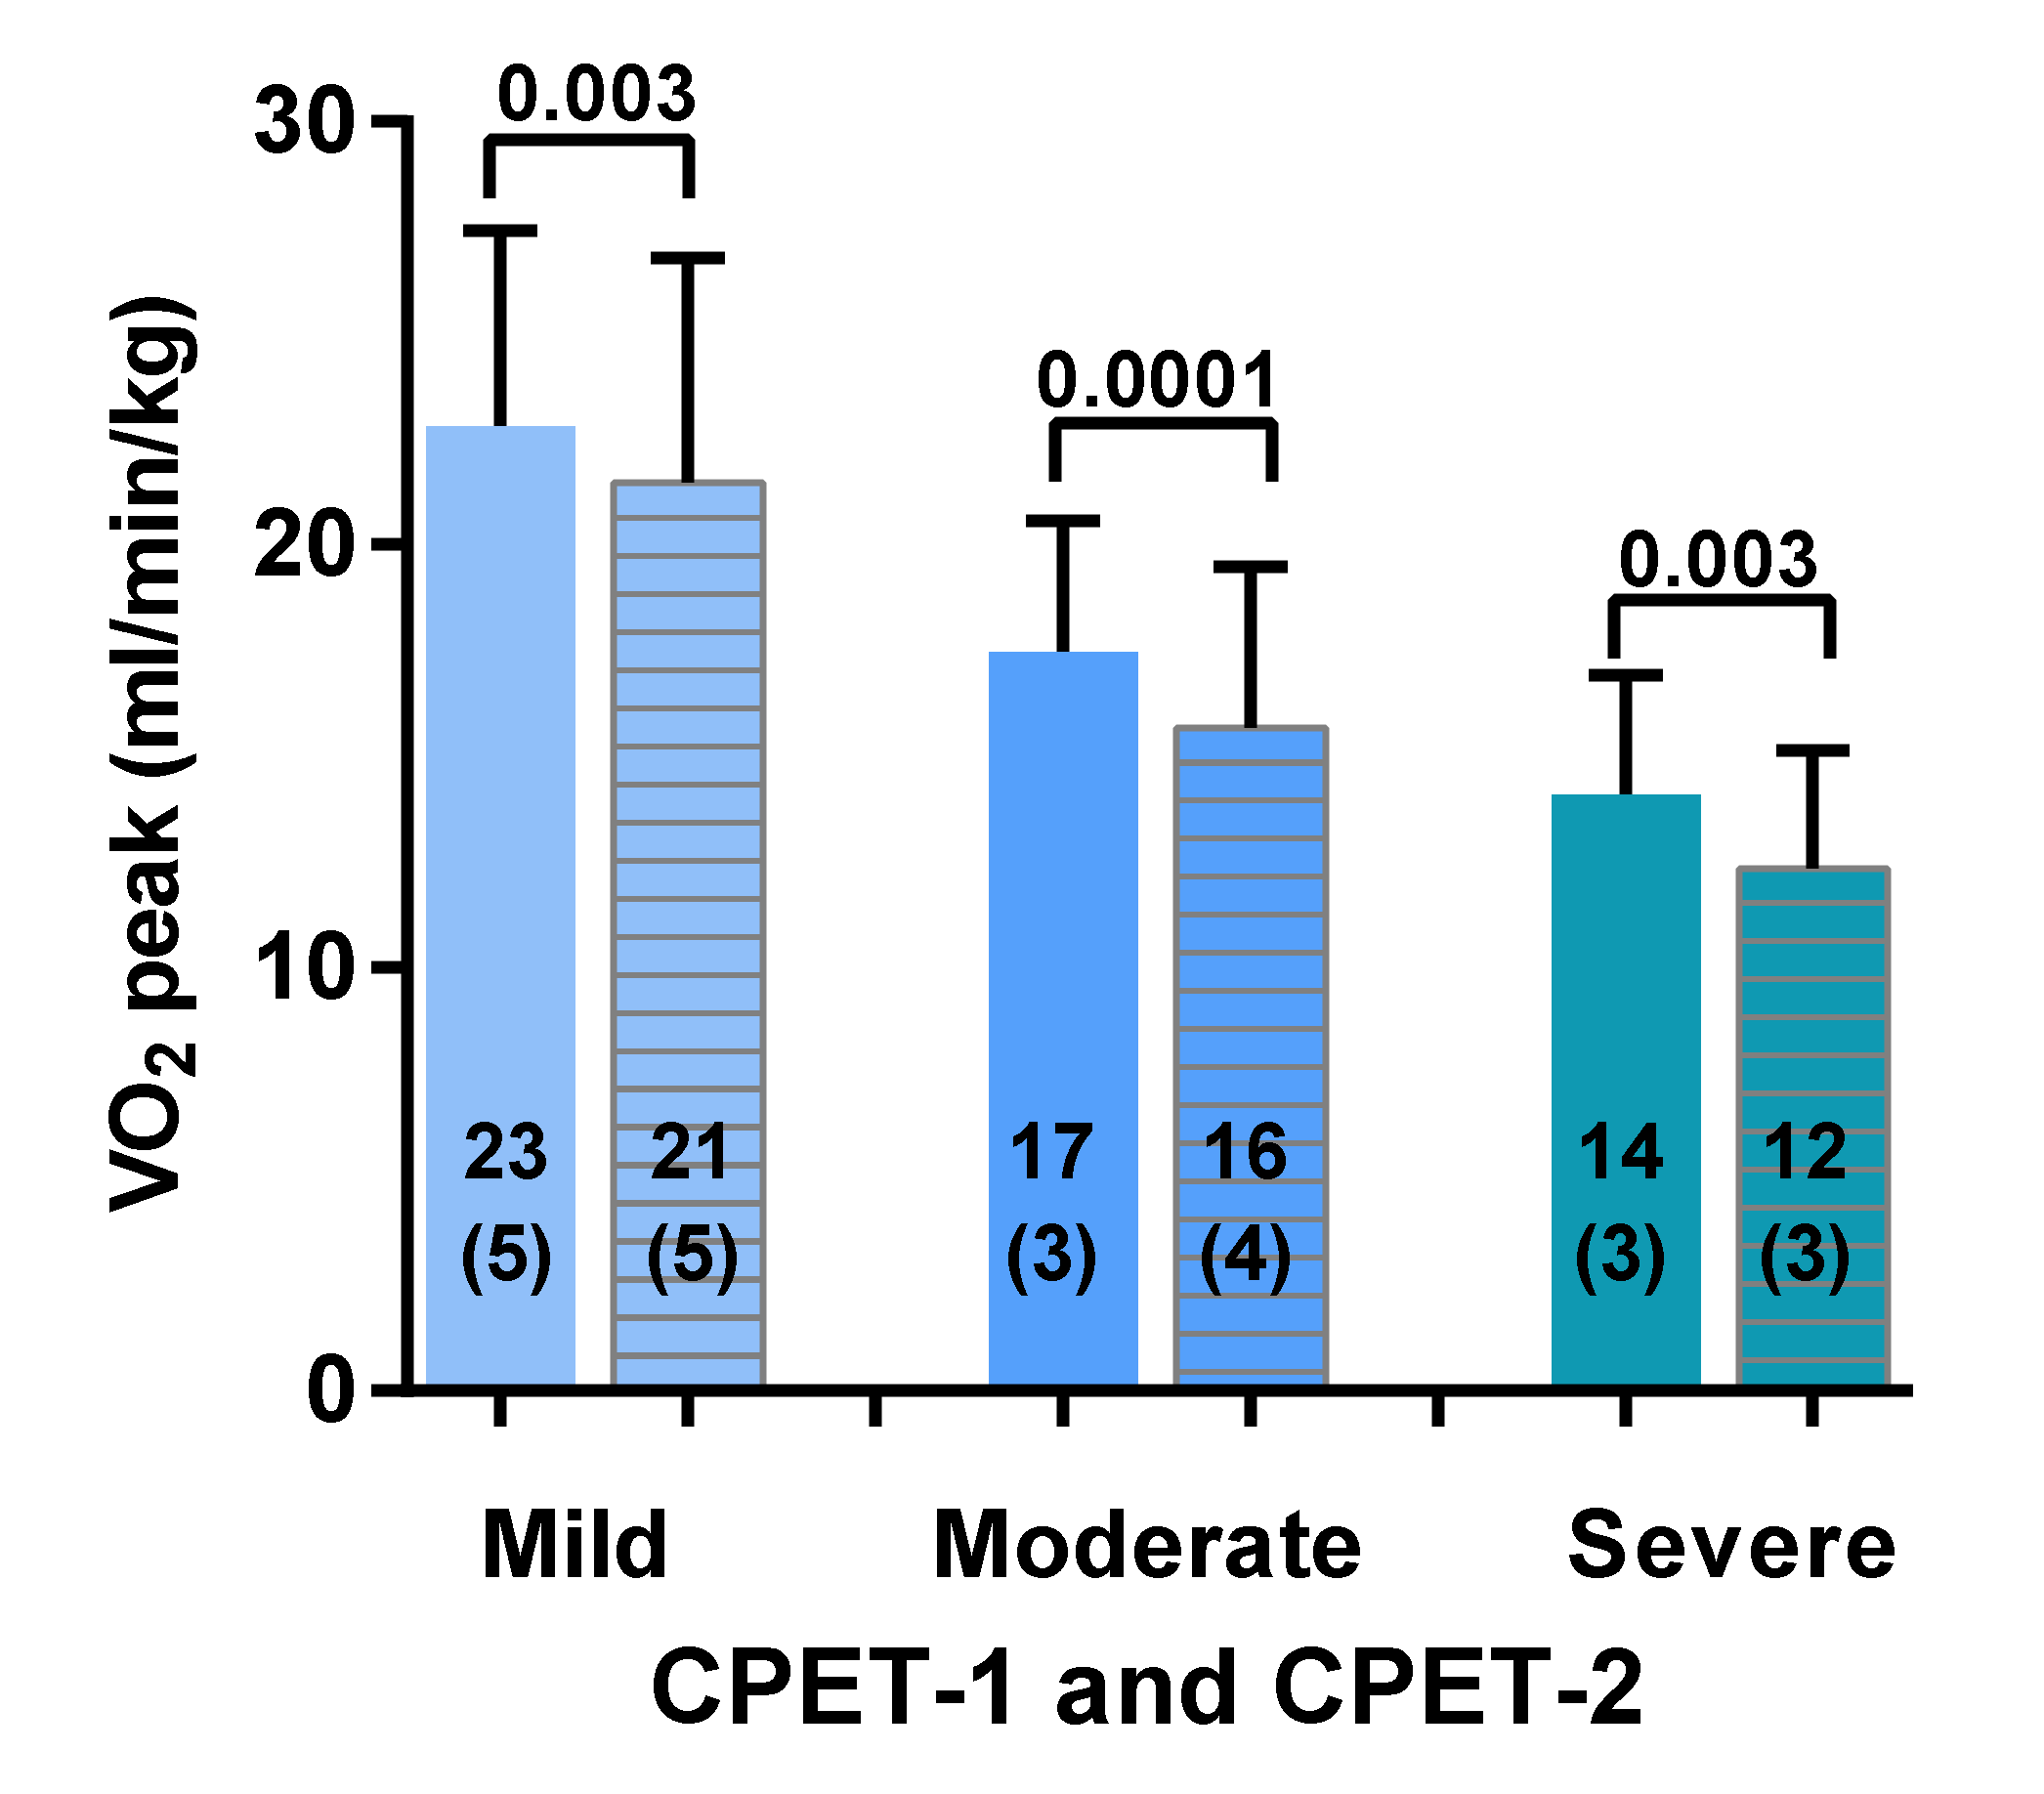
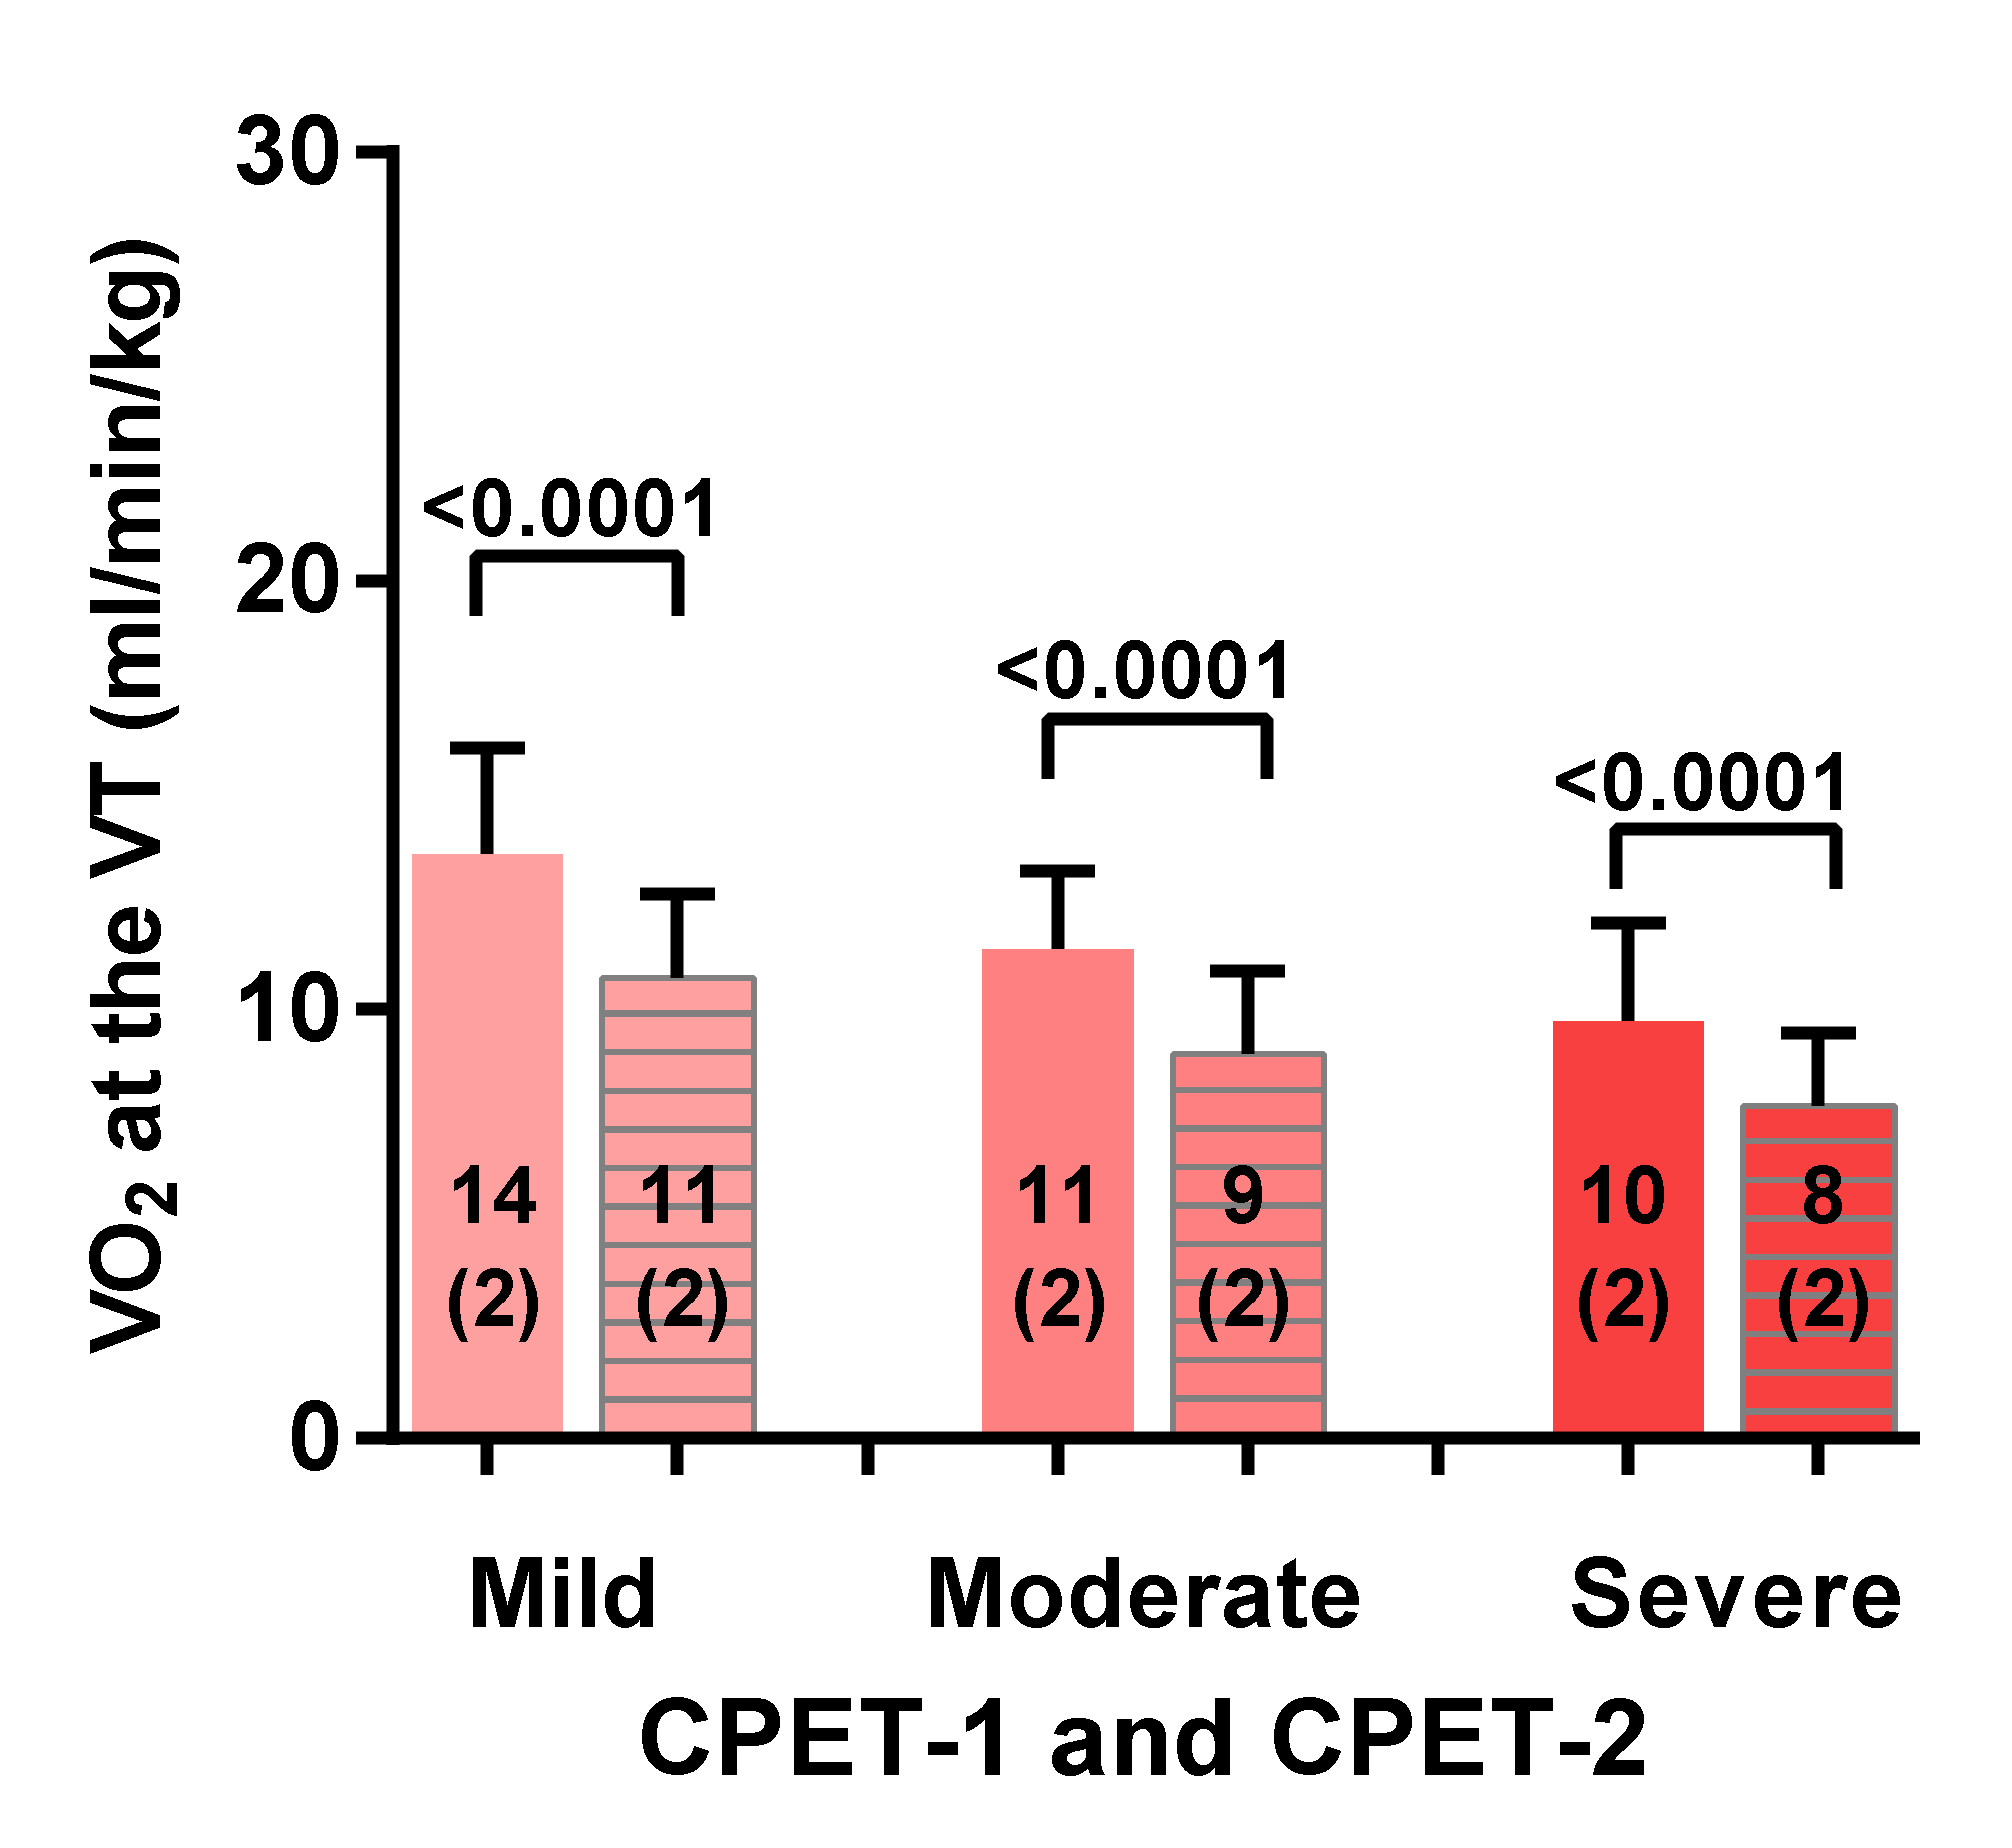
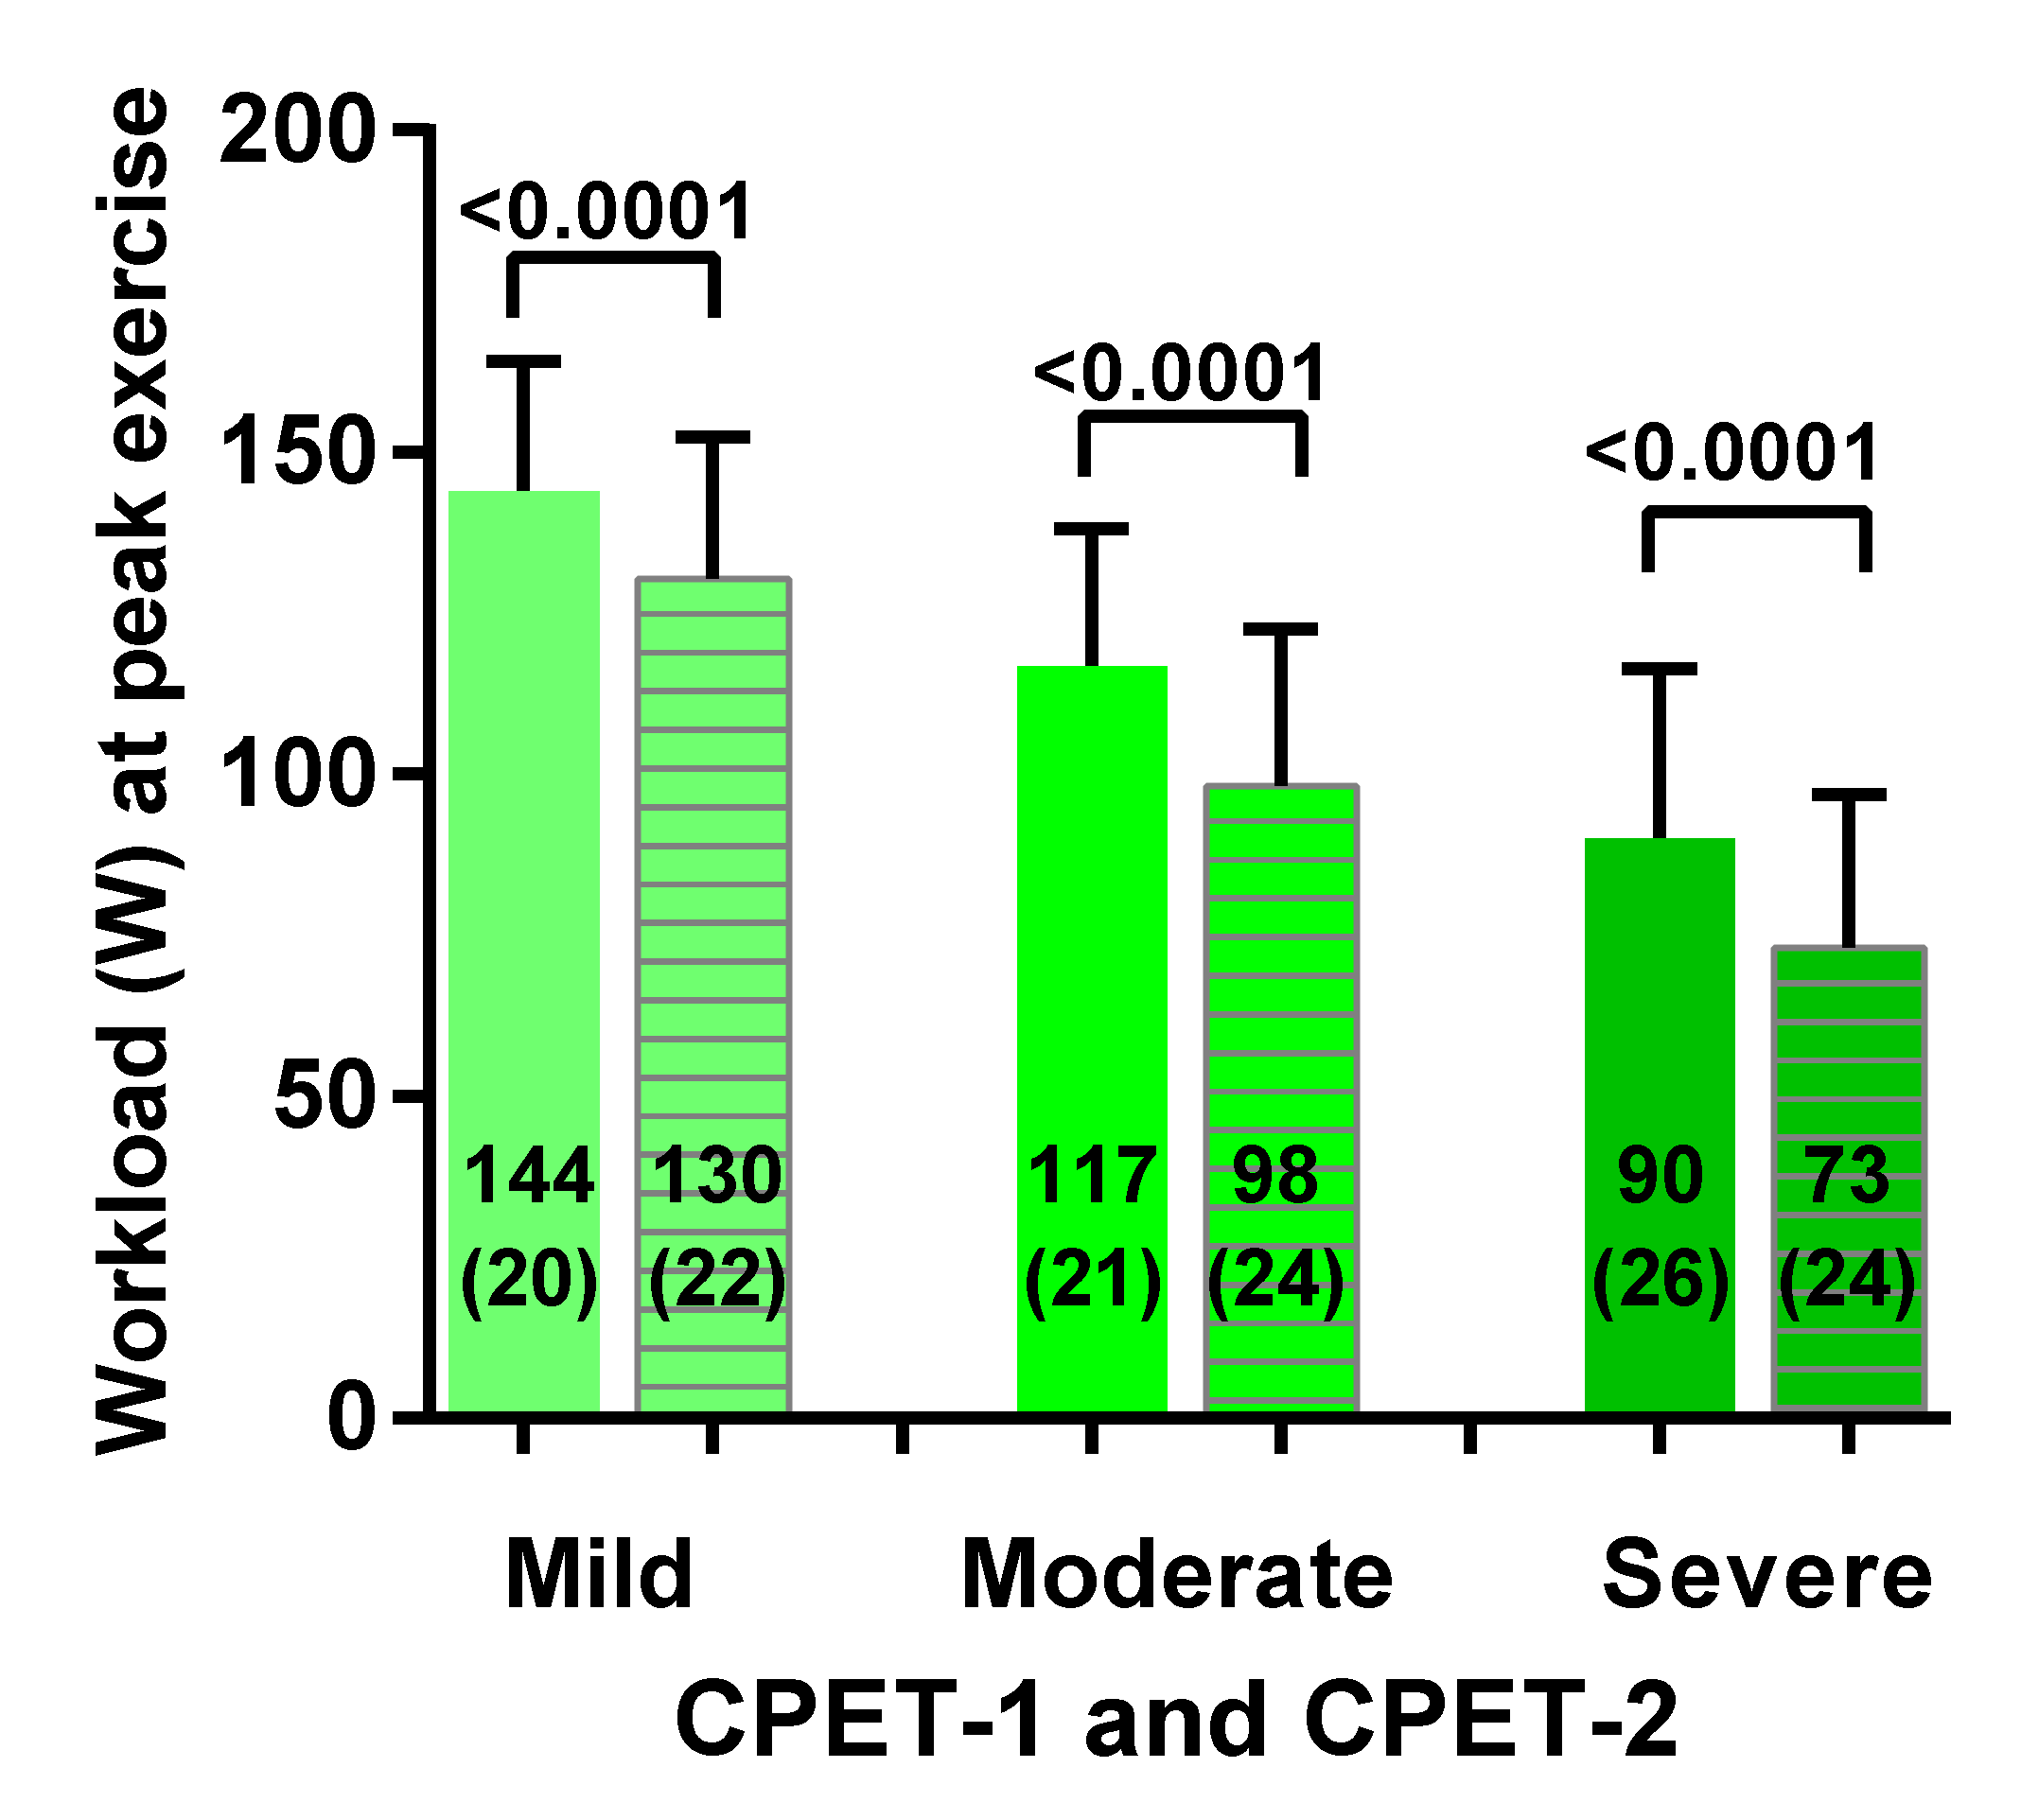
3.2. Two-Day CPET Data for ME/CFS Female Patients with Severe, Moderate and Mild Disease
3.3. Comparison of ME/CFS Patients with Severe, Moderate and Mild Disease for CPET Day-1 and Day-2 Variables
4. Discussion
4.1. Two-Day Cardiopulmonary Exercise Test Studies Reported in Literature
4.2. Limitations
5. Conclusions
Author Contributions
Funding
Acknowledgments
Conflicts of Interest
References
- Fukuda, K. The Chronic Fatigue Syndrome: A Comprehensive Approach to Its Definition and Study. Ann. Intern. Med. 1994, 121, 953–959. [Google Scholar] [CrossRef] [PubMed]
- Carruthers, B.M.; van de Sande, M.I.; de Meirleir, K.L.; Klimas, N.G.; Broderick, G.; Mitchell, T.; Staines, D.; Powles, A.C.P.; Speight, N.; Vallings, R.; et al. Myalgic encephalomyelitis: International consensus criteria. J. Intern. Med. 2011, 270, 327–338. [Google Scholar] [CrossRef] [PubMed] [Green Version]
- Clayton, E.W. Beyond Myalgic Encephalomyelitis/Chronic Fatigue Syndrome. JAMA 2015, 313, 1101. [Google Scholar] [CrossRef] [PubMed]
- Institute of Medicine (IOM). Beyond Mayalgic Encephalomyelitis/Chronic Fatigue Syndrome: Redefining an Illness; The National Academies Press: Washington, DC, USA, 2015. [Google Scholar]
- Paul, L.; Wood, L.; Behan, W.M.; MacLaren, W.M. Demonstration of delayed recovery from fatiguing exercise in chronic fatigue syndrome. Eur. J. Neurol. 1999, 6, 63–69. [Google Scholar] [CrossRef]
- Jones, D.E.J.; Hollingsworth, K.G.; Taylor, R.; Blamire, A.; Newton, J.L. Abnormalities in PH handling by peripheral muscle and potential regulation by the autonomic nervous system in chronic fatigue syndrome. J. Intern. Med. 2010, 267, 394–401. [Google Scholar] [CrossRef]
- Mitchell, J.H.; Sproule, B.J.; Chapman, C.B. The physiological meaning of the maximal oxygen intake test. J. Clin. Investig. 1958, 37, 538–547. [Google Scholar] [CrossRef] [Green Version]
- Saltin, B.; Astrand, P.O. Maximal oxygen uptake in athletes. J. Appl. Physiol. 1967, 23, 353–358. [Google Scholar] [CrossRef]
- Mezzani, A.; Agostoni, P.; Cohen-Solal, A.; Corrà, U.; Jegier, A.; Kouidi, E.; Mazic, S.; Meurin, P.; Piepoli, M.; Simon, A.; et al. Standards for the use of cardiopulmonary exercise testing for the functional evaluation of cardiac patients: A report from the Exercise Physiology Section of the European Association for Cardiovascular Prevention and Rehabilitation. Eur. J. Cardiovasc. Prev. Rehab. 2009, 16, 249–267. [Google Scholar] [CrossRef]
- Guazzi, M.; Adams, V.; Conraads, V.; Halle, M.; Mezzani, A.; Vanhees, L.; Arena, R.; Fletcher, G.F.; Forman, D.E.; Kitzman, D.W.; et al. EACPR/AHA Scientific Statement. Clinical recommendations for cardiopulmonary exercise testing data assessment in specific patient populations. Circulation 2012, 126, 2261–2274. [Google Scholar] [CrossRef]
- De Becker, P.; Roeykens, J.; Reynders, M.; McGregor, N.; De Meirleir, K. Exercise capacity in chronic fatigue syndrome. Arch. Intern. Med. 2000, 160, 3270–3277. [Google Scholar] [CrossRef]
- Fulcher, K.Y.; White, P.D. Strength and physiological response to exercise in patients with chronic fatigue syndrome. J. Neurol. Neurosurg. Psychiatry 2000, 69, 302–307. [Google Scholar] [CrossRef] [PubMed] [Green Version]
- Hodges, L.; Nielsen, T.; Baken, D. Physiological measures in participants with chronic fatigue syndrome, multiple sclerosis and healthy controls following repeated exercise: A pilot study. Clin. Physiol. Funct. Imaging 2017, 38, 639–644. [Google Scholar] [CrossRef] [PubMed]
- Jammes, Y.; Steinberg, J.G.; Mambrini, O.; Bregeon, F.; Delliaux, S. Chronic fatigue syndrome: Assessment of increased oxidative stress and altered muscle excitability in response to incremental exercise. J. Intern. Med. 2005, 257, 299–310. [Google Scholar] [CrossRef] [PubMed]
- Keller, B.A.; Pryor, J.L.; Giloteaux, L. Inability of myalgic encephalomyelitis/chronic fatigue syndrome patients to reproduce VO2peak indicates functional impairment. J. Transl. Med. 2014, 12, 104. [Google Scholar] [CrossRef] [PubMed] [Green Version]
- Sargent, C.; Scroop, G.C.; Nemeth, P.M.; Burnet, R.B.; Buckley, J.D. Maximal oxygen uptake and lactate metabolism are normal in chronic fatigue syndrome. Med. Sci. Sports Exerc. 2002, 34, 51–56. [Google Scholar] [CrossRef] [PubMed]
- Sisto, S.A.; LaManca, J.; Cordero, D.L.; Bergen, M.T.; Ellis, S.P.; Drastal, S.; Boda, W.L.; Tapp, W.N.; Natelson, B.H. Metabolic and cardiovascular effects of a progressive exercise test in patients with chronic fatigue syndrome. Am. J. Med. 1996, 100, 634–640. [Google Scholar] [CrossRef]
- Snell, C.R.; Stevens, S.R.; Davenport, T.E.; Van Ness, J.M. Discriminative validity of metabolic and workload measurements for identifying people with chronic fatigue syndrome. Phys. Ther. 2013, 93, 1484–1492. [Google Scholar] [CrossRef] [Green Version]
- Vanness, J.M.; Snell, C.R.; Stevens, S.R. Diminished cardiopulmonary capacity during post-exertional malaise. J. Chronic Fatigue Syndr. 2007, 14, 77–85. [Google Scholar] [CrossRef]
- Vermeulen, R.C.W.; Kurk, R.M.; Visser, F.C.; Sluiter, W.; Scholte, H.R. Patients with chronic fatigue syndrome performed worse than controls in a controlled repeated exercise study despite a normal oxidative phosphorylation capacity. J. Transl. Med. 2010, 8, 93. [Google Scholar] [CrossRef] [Green Version]
- Vermeulen, R.C.W.; van Eck, I.W.V. Decreased oxygen extraction during cardiopulmonary exercise test in patients with chronic fatigue syndrome. J. Transl. Med. 2014, 12, 20. [Google Scholar] [CrossRef] [Green Version]
- Wallman, K.; Morton, A.R.; Goodman, C.; Grove, J.R. Physiological responses during a submaximal cycle test in chronic fatigue syndrome. Med. Sci. Sports Exerc. 2004, 36, 1682–1688. [Google Scholar] [CrossRef] [PubMed]
- Lien, K.; Johansen, B.; Veierød, M.B.; Haslestad, A.S.; Bøhn, S.K.; Melsom, M.N.; Kardel, K.R.; Iversen, P.O. Abnormal blood lactate accumulation during repeated exercise testing in myalgic encephalomyelitis/chronic fatigue syndrome. Physiol. Rep. 2019, 7, e14138. [Google Scholar] [CrossRef] [PubMed]
- Nelson, M.J.; Buckley, J.D.; Thomson, R.L.; Clark, D.; Kwiatek, R.; Davison, K. Diagnostic sensitivity of 2-day cardiopulmonary exercise testing in Myalgic Encephalomyelitis/Chronic Fatigue Syndrome. J. Transl. Med. 2019, 17, 80. [Google Scholar] [CrossRef] [PubMed]
- Van Campen, C.L.M.; Visser, F.C. Validity of 2-day cardiopulmonary exercise testing in female patients with myalgic encephalomyelitis/chronic fatigue syndrome. Int. J. Curr. Res. 2020, 12, 10436–10442. [Google Scholar]
- Van Campen, C.L.M.; Rowe, P.C.; Visser, F.C. Validity of 2-day cardiopulmonary exercise testing in male patients with myalgic encephalomyelitis/Chronic fatigue syndrome. Adv. Phys. Educ. 2020, 10, 68–80. [Google Scholar] [CrossRef] [Green Version]
- Glaser, S.; Koch, B.; Ittermann, T.; Schaper, C.; Dorr, M.; Felix, S.B.; Henry, V.; Ewert, R.; Hansen, J.E. Influence of age, sex, body size, smoking, and beta blockade on key gas exchange exercise parameters in an adult population. Eur. J. Cardiovasc. Prev. Rehabil. 2010, 17, 469–476. [Google Scholar]
- Cureton, K.; Bishop, P.; Hutchinson, P.; Newland, H.; Vickery, S.; Zwiren, L. Sex difference in maximal oxygen uptake. Effect of equating haemoglobin concentration. Eur. J. Appl. Physiol. Occup. Physiol. 1986, 54, 656–660. [Google Scholar] [CrossRef]
- Fletcher, G.F.; Balady, G.J.; Amsterdam, E.A.; Chaitman, B.; Eckel, R.; Fleg, J.; Froelicher, V.F.; Leon, A.S.; Piña, I.L.; Rodney, R.; et al. Exercise standards for testing and training: A statement for healthcare professionals from the American Heart Association. Circulation 2001, 104, 1694–1740. [Google Scholar] [CrossRef] [Green Version]
- Weber, K.T.; Janicki, J.S. Cardiopulmonary exercise testing for evaluation of chronic cardiac failure. Am. J. Cardiol. 1985, 55, A22–A31. [Google Scholar] [CrossRef]
- Martina, J.R.; Westerhof, B.E.; Van Goudoever, J.; De Beaumont, E.M.F.H.; Truijen, J.; Kim, Y.-S.; Immink, R.V.; Jöbsis, D.A.; Hollmann, M.W.; Lahpor, J.R.; et al. Noninvasive continuous arterial blood pressure monitoring with Nexfin®. Anesthesiology 2012, 116, 1092–1103. [Google Scholar] [CrossRef] [Green Version]
- Beaver, W.L.; Wasserman, K.; Whipp, B.J. A new method for detecting anaerobic threshold by gas exchange. J. Appl. Physiol. 1986, 60, 2020–2027. [Google Scholar] [CrossRef] [PubMed]
- Williams, C.G.; Wyndham, C.H.; Kok, R.; Rahden, M.J.E. Effect of training on maximum oxygen intake and on anaerobic metabolism in man. Graefe’s Arch. Clin. Exp. Ophthalmol. 1967, 24, 18–23. [Google Scholar] [CrossRef]
- Wasserman, K.; McIlroy, M.B. Detecting the threshold of anaerobic metabolism in cardiac patients during exercise. Am. J. Cardiol. 1964, 14, 844–852. [Google Scholar] [CrossRef]
- Coen, B.; Urhausen, A.; Kindermann, W. Individual anaerobic threshold: Methodological aspects of its assessment in running. Int. J. Sports Med. 2001, 22, 8–16. [Google Scholar] [CrossRef] [PubMed]
- Katz, S.D.; Berkowitz, R.; LeJemtel, T.H. Anaerobic threshold detection in patients with congestive heart failure. Am. J. Cardiol. 1992, 69, 1565–1569. [Google Scholar] [CrossRef]
- Yeh, M.P.; Gardner, R.M.; Adams, T.D.; Yanowitz, F.G.; Crapo, R.O. “Anaerobic threshold”: Problems of determination and validation. J. Appl. Physiol. 1983, 55, 1178–1186. [Google Scholar] [CrossRef]
- Myers, J.; Ashley, E. Dangerous curves. A perspective on exercise, lactate, and the anaerobic threshold. Chest 1997, 111, 787–795. [Google Scholar] [CrossRef] [Green Version]
- Solberg, G.; Robstad, B.; Skjønsberg, O.H.; Borchsenius, F. Respiratory gas exchange indices for estimating the anaerobic threshold. J. Sports Sci. Med. 2005, 4, 29–36. [Google Scholar]
- Mezzani, A. Cardiopulmonary exercise testing: Basics of methodology and measurements. Ann. Am. Thorac. Soc. 2017, 14, S3–S11. [Google Scholar] [CrossRef]
- Brown, A.; Jones, D.E.; Walker, M.; Newton, J.L. Abnormalities of AMPK activation and glucose uptake in cultured skeletal muscle cells from individuals with chronic fatigue syndrome. PLoS ONE 2015, 10, e0122982. [Google Scholar] [CrossRef]
- Jones, D.E.J.; Hollingsworth, K.G.; Jakovljevic, D.G.; Fattakhova, G.; Pairman, J.; Blamire, A.; Trenell, M.; Newton, J.L. Loss of capacity to recover from acidosis on repeat exercise in chronic fatigue syndrome: A case-control study. Eur. J. Clin. Investig. 2011, 42, 186–194. [Google Scholar] [CrossRef] [PubMed]
- Van Campen, C.M.C.; Rowe, P.C.; Verheugt, F.W.A.; Visser, F.C. Physical activity measures in patients with myalgic encephalomyalitis/chronic fatigue syndrome: Correlations between peak oxygen consumption, the physical functioning scale of the SF-36 scale, and the number of steps from an activity meter. J. Transl. Med. 2020, 18, 228–238. [Google Scholar] [CrossRef] [PubMed]


| Weber Class | Oxygen Consumption | Aerobic Capacity |
|---|---|---|
| Class A | >20 mL/min/kg | No impairment |
| Class B | 16–20 mL/min/kg | Mild to moderate impairment |
| Class C | 10–15 mL/min/kg | Moderate to severe impairment |
| Class D | <10 mL/min/kg | Severe impairment |
| Group 1 Severe (n = 20) | Group 2 Moderate (n = 31) | Group 3 Mild (n = 31) | ANOVA/Kruskal-Wallis Test | |
|---|---|---|---|---|
| Age (years) | 39 (10) | 41 (10) | 42 (9) | F (2, 79) = 0.46; p = 0.63 |
| Height (cm) | 171 (7) | 171 (7) | 169 (6) | F (2, 79) = 1.56; p = 0.22 |
| Weight (kg) | 70 (61–77) | 69 (63–80) | 65 (60–72) | X2(2) = 1.144; p = 0.56 |
| BSA (m2) | 1.4 (1.2–1.8) | 1.4 (1.3–1.5) | 1.3 (1.2–1.4) | X2(2) = 1.690; p = 0.43 |
| BMI (kg/m2) | 22.7 (21.8–27.6) | 23.9 (20.7–27.6) | 23.4 (21.4–26.7) | X2(2) = 0.032; p = 0.98 |
| Disease duration (years) | 15.9 (9.3) | 13.3 (8.9) | 13.5 (9.3) | F (2, 79) = 0.56; p = 0.57 |
| Percent Difference CPET-2 Minus CPET-1 | Group 1 Severe (n = 20) | Group 2 Moderate (n = 31) | Group 3 Mild (n = 31) | ANOVA and Post-Hoc Tukey’s Test |
|---|---|---|---|---|
| VO2 peak (mL/min/kg) | −12 (14) | −11 (14) | −6 (11) | F (2, 79) = 1.28; p = 0.28 |
| HR peak (bpm) | −7 (6) | −6 (7) | −3 (6) | F (2, 79) = 2.08; p = 0.13 |
| Workload peak (Watts) | −19 (11) | −16 (15) | −10 (8) | F (2, 79) = 4.37; p = 0.016. Post-hoc tests: 1 vs. 2 p = 0.083; 1 vs. 3 p = 0.019 and 2 vs. 3 p = 0.68 |
| VO2 VT (mL/min/kg) | −19 (11) | −21 (12) | −21 (11) | F (2, 79) = 0.26; p = 0.77 |
| HR VT (bpm) | −7 (5) | −9 (6) | −8 (7) | F (2, 79) = 0.78; p = 0.46 |
| Workload VT (Watts) | −33 (20) | −31 (18) | −26 (18) | F (2, 79) = 0.54; p = 0.58 |
| RER | −5 (7) | −2 (9) | −3 (7) | F (2, 79) = 0.83; p = 0.44 |
| Group 1 Severe (n = 20) | Group 2 Moderate (n = 31) | Group 3 Mild (n = 31) | ANOVA |
|---|---|---|---|
| CPET day-1 | |||
| 1.08 (0.09) | 1.09 (0.09) | 1.13 (0.11) | F(2.79) = 2.02; p = 0.14 |
| CPET day-2 | |||
| 1.02 (0.11) | 1.07 (0.11) | 1.10 (0.11 | F(2.79) = 2.77; p = 0.07 |
| Literature Day-1 | Literature Day-2 | Present Study Day-1 | Present Study Day-2 | |
|---|---|---|---|---|
| Peak VO2 (mL/min/kg) | 19–26 | 17–21 | 14–23 | 12–21 |
| VT VO2 (mL/min/kg) | 12–15 | 9–12 | 10–14 | 8–11 |
| Peak Workload (Watt) | 110–132 | 102–125 | 90–144 | 73–130 |
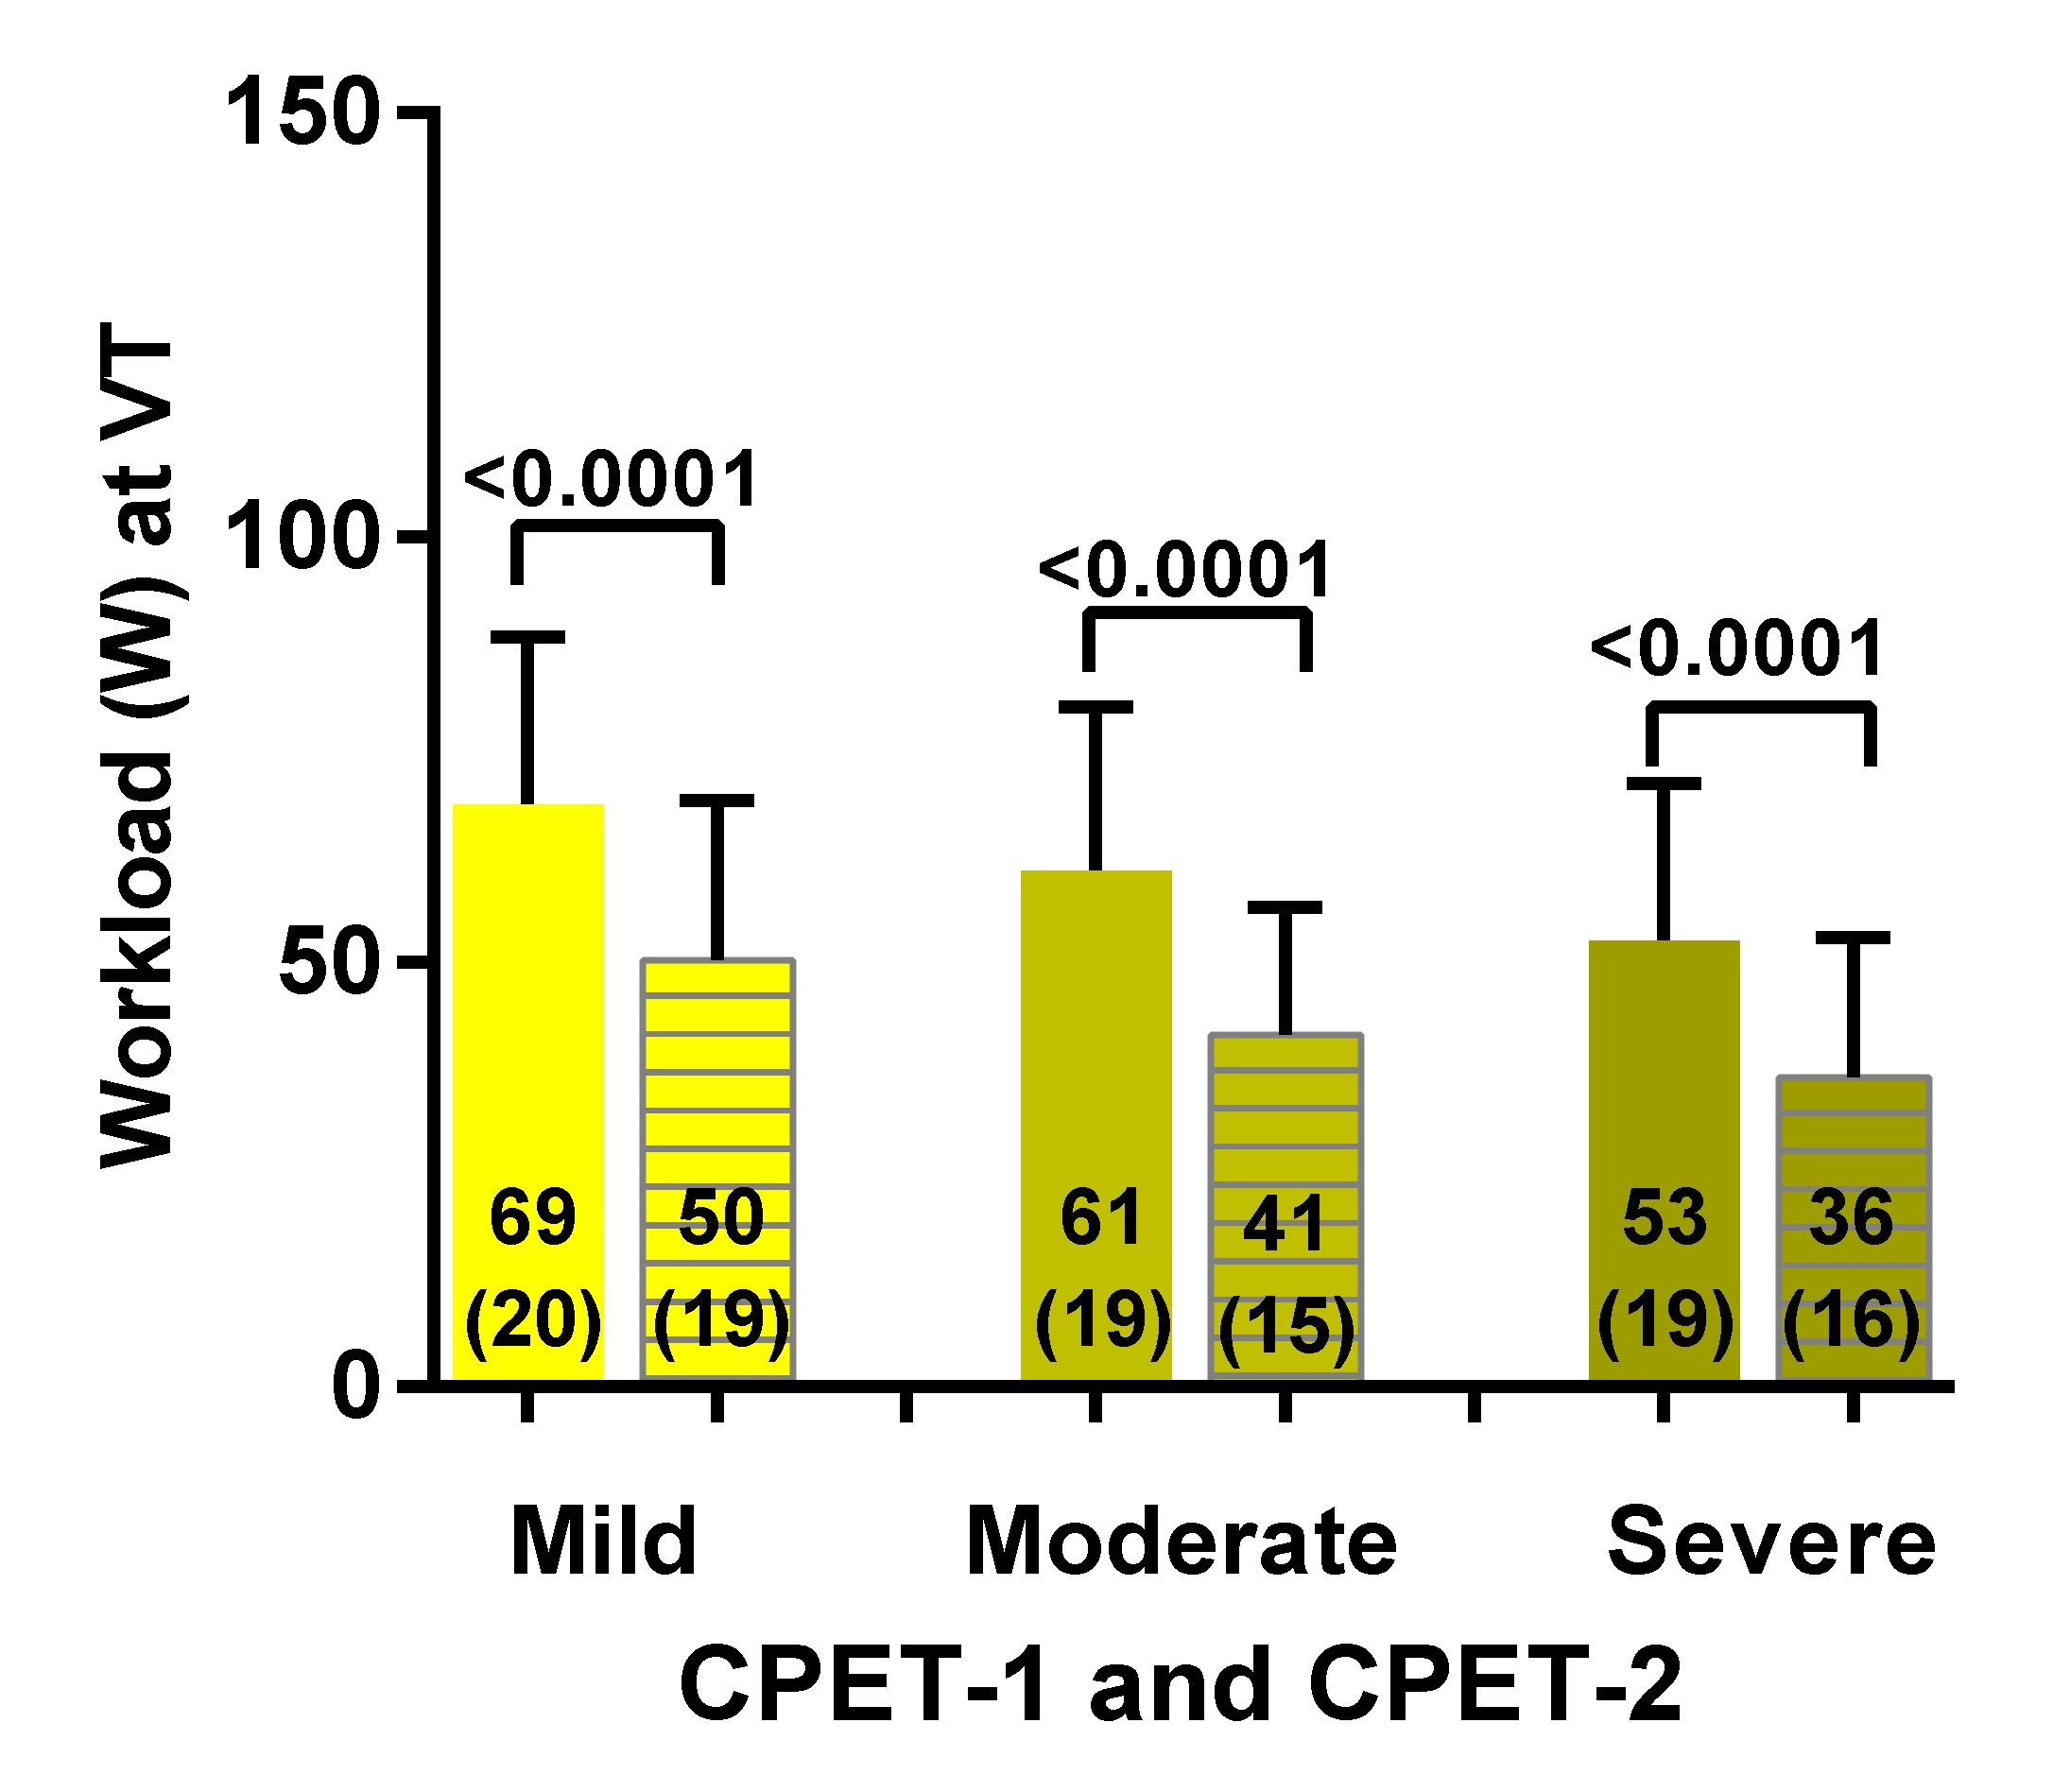
| VT Workload (Watt) | 50–62 | 22–54 | 53–69 | 36–50 |
© 2020 by the authors. Licensee MDPI, Basel, Switzerland. This article is an open access article distributed under the terms and conditions of the Creative Commons Attribution (CC BY) license (http://creativecommons.org/licenses/by/4.0/).
Share and Cite
van Campen, C.M.C.; Rowe, P.C.; Visser, F.C. Two-Day Cardiopulmonary Exercise Testing in Females with a Severe Grade of Myalgic Encephalomyelitis/Chronic Fatigue Syndrome: Comparison with Patients with Mild and Moderate Disease. Healthcare 2020, 8, 192. https://doi.org/10.3390/healthcare8030192
van Campen CMC, Rowe PC, Visser FC. Two-Day Cardiopulmonary Exercise Testing in Females with a Severe Grade of Myalgic Encephalomyelitis/Chronic Fatigue Syndrome: Comparison with Patients with Mild and Moderate Disease. Healthcare. 2020; 8(3):192. https://doi.org/10.3390/healthcare8030192
Chicago/Turabian Stylevan Campen, C (Linda) M. C., Peter C. Rowe, and Frans C. Visser. 2020. "Two-Day Cardiopulmonary Exercise Testing in Females with a Severe Grade of Myalgic Encephalomyelitis/Chronic Fatigue Syndrome: Comparison with Patients with Mild and Moderate Disease" Healthcare 8, no. 3: 192. https://doi.org/10.3390/healthcare8030192
APA Stylevan Campen, C. M. C., Rowe, P. C., & Visser, F. C. (2020). Two-Day Cardiopulmonary Exercise Testing in Females with a Severe Grade of Myalgic Encephalomyelitis/Chronic Fatigue Syndrome: Comparison with Patients with Mild and Moderate Disease. Healthcare, 8(3), 192. https://doi.org/10.3390/healthcare8030192