Proceeding Paper

Hardness Safety Testing of Artificial Turf †

1
Sports Technology Institute, Loughborough University, Loughborough LE11 3QF, UK
2
Technical Surfaces Ltd., Leicester LE19 1WZ, UK
*
Author to whom correspondence should be addressed.
Presented at the 13th conference of the International Sports Engineering Association, Online, 22–26 June 2020.
Proceedings 2020, 49(1), 130; https://doi.org/10.3390/proceedings2020049130
Published: 15 June 2020

Abstract

:
This paper compares four sport surface hardness impact test devices, for use on artificial turf (AT) surfaces to control safety. Sports governing bodies require sport surfaces to be assessed with the “Advanced Artificial Athlete” (AAA) mechanical test. The AAA data presented here demonstrate that this high energy test causes compaction of the particulate rubber infill during testing, such that the derived “field test value” is less relevant to the initial state of the surface and arguably also to player comfort. This paper reports on alternative impact test methods and their correlation to the AAA, including a novel comparison to the more portable Fieldtester. The potential use of a lightweight 0.5 kg Clegg Hammer for assessing the change in state of the infill and monitoring the effectiveness of field maintenance is also reported. These results expand our understanding of factors influencing surface hardness and safety, with useful implications for practitioners.

1. Introduction

The two most important player-performance properties of a sports field are recognized as the surface hardness, linked to comfort and injury, and surface traction, linked to change of direction and injury [1]. Sports governing bodies stipulate acceptable limits for these parameters across a large range of field sports, with specified mechanical tests and measurement, e.g., [2].
Sports governing bodies require surfaces for sport to meet requirements for “force reduction” and “vertical deformation”, typically using the “Advanced Artificial Athlete” (AAA) mechanical test [2]. However, the AAA is a costly and heavy device requiring two operators for routine field use. Furthermore, the AAA is a high-energy test and is observed to cause a change of state of the artificial turf infill, i.e., compaction, during its three repeat drops methodology. The AAA-derived “field test value”, based on the average response under the second and third impacts, is perhaps less relevant to the initial state of the surface and arguably also to player comfort. Other impact test devices have been described for testing the hardness of both artificial and natural turf sports fields, such as the Clegg Hammer [3] and, more recently, the Fieldtester [4].
This paper reports on several impact test methods and correlations. The use of a lightweight 0.5 kg Clegg for monitoring the effectiveness of field maintenance is also reported. The results expand our understanding of factors influencing sport surface hardness, with implications for practitioners.

2. Hardness Testing Methods

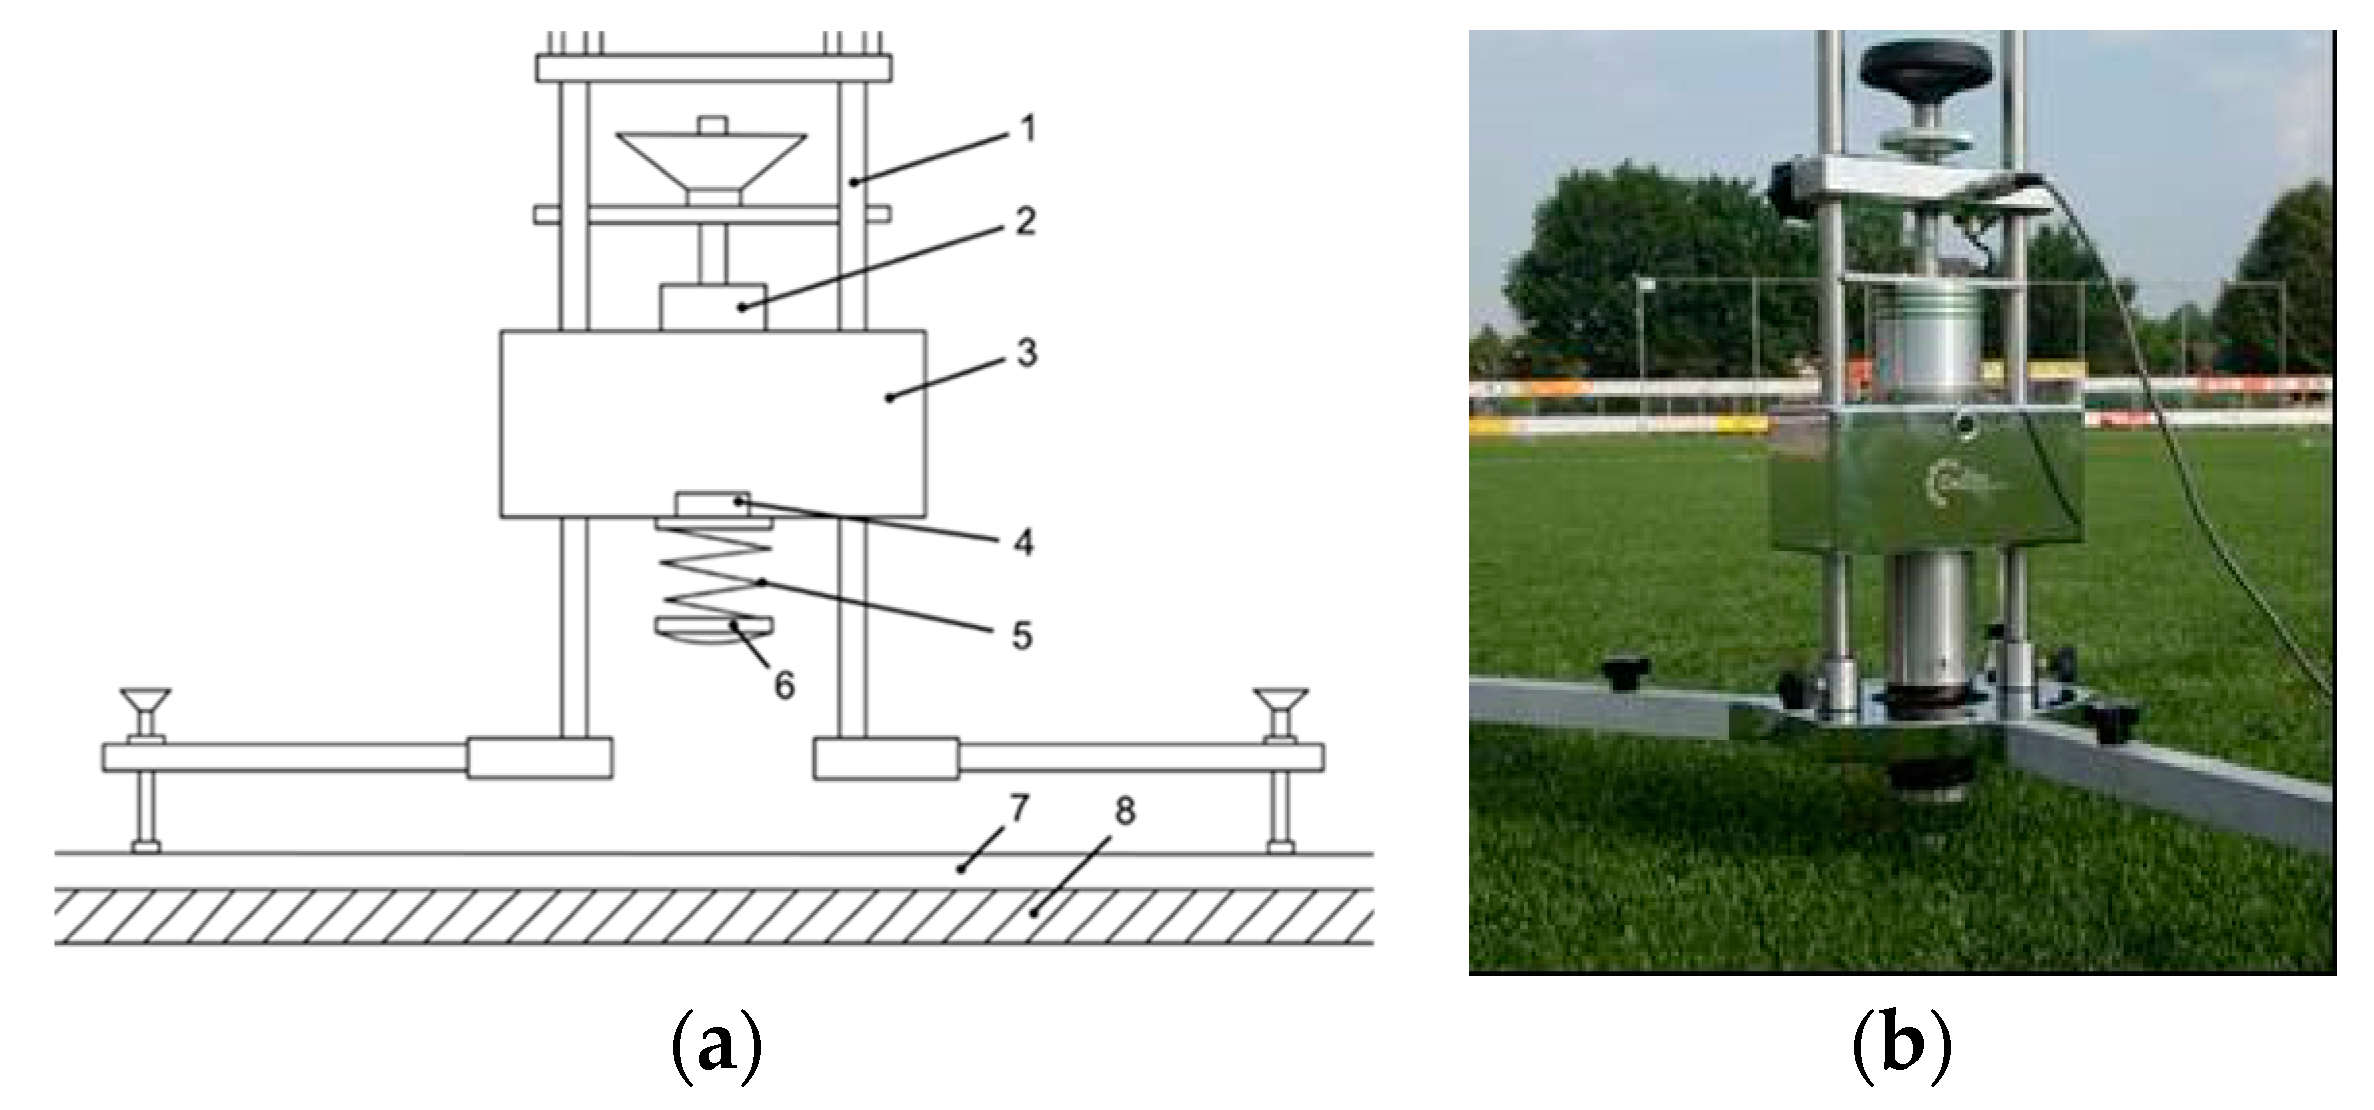
2.1. The Advanced Artificial Athlete

The “Advanced” Artificial Athlete (AAA, previously termed the AA) is a mechanical device used in the FIFA Quality Concept to measure and assess the hardness response of a surface (Figure 1) [2]. It was designed to replicate the vertical force and contact time of a heel strike during heel-toe running. The basic principle of the test is to produce a controlled vertical impact on a surface and output two impact properties, termed “force reduction” and “vertical deformation”. It also records the “energy restitution” based on the rebound velocity—outside the scope of this paper. The AAA device comprises a 20 kg mass, instrumented with an accelerometer, which free falls a set distance of 55 mm and impacts the surface through a 70 mm diameter (curved) test foot attached to the mass via a helical steel spring, rated at 2 kN/m. The peak force on impact is recorded (inferred from the peak deceleration) and then interpreted relative to a known peak force for a rigid (concrete) surface to produce the “force reduction” value expressed as a percentage. The vertical deformation is the peak compression of the surface under test, evaluated through the double integration of the accelerometer signal and incorporating an estimate of the spring compression under peak load.

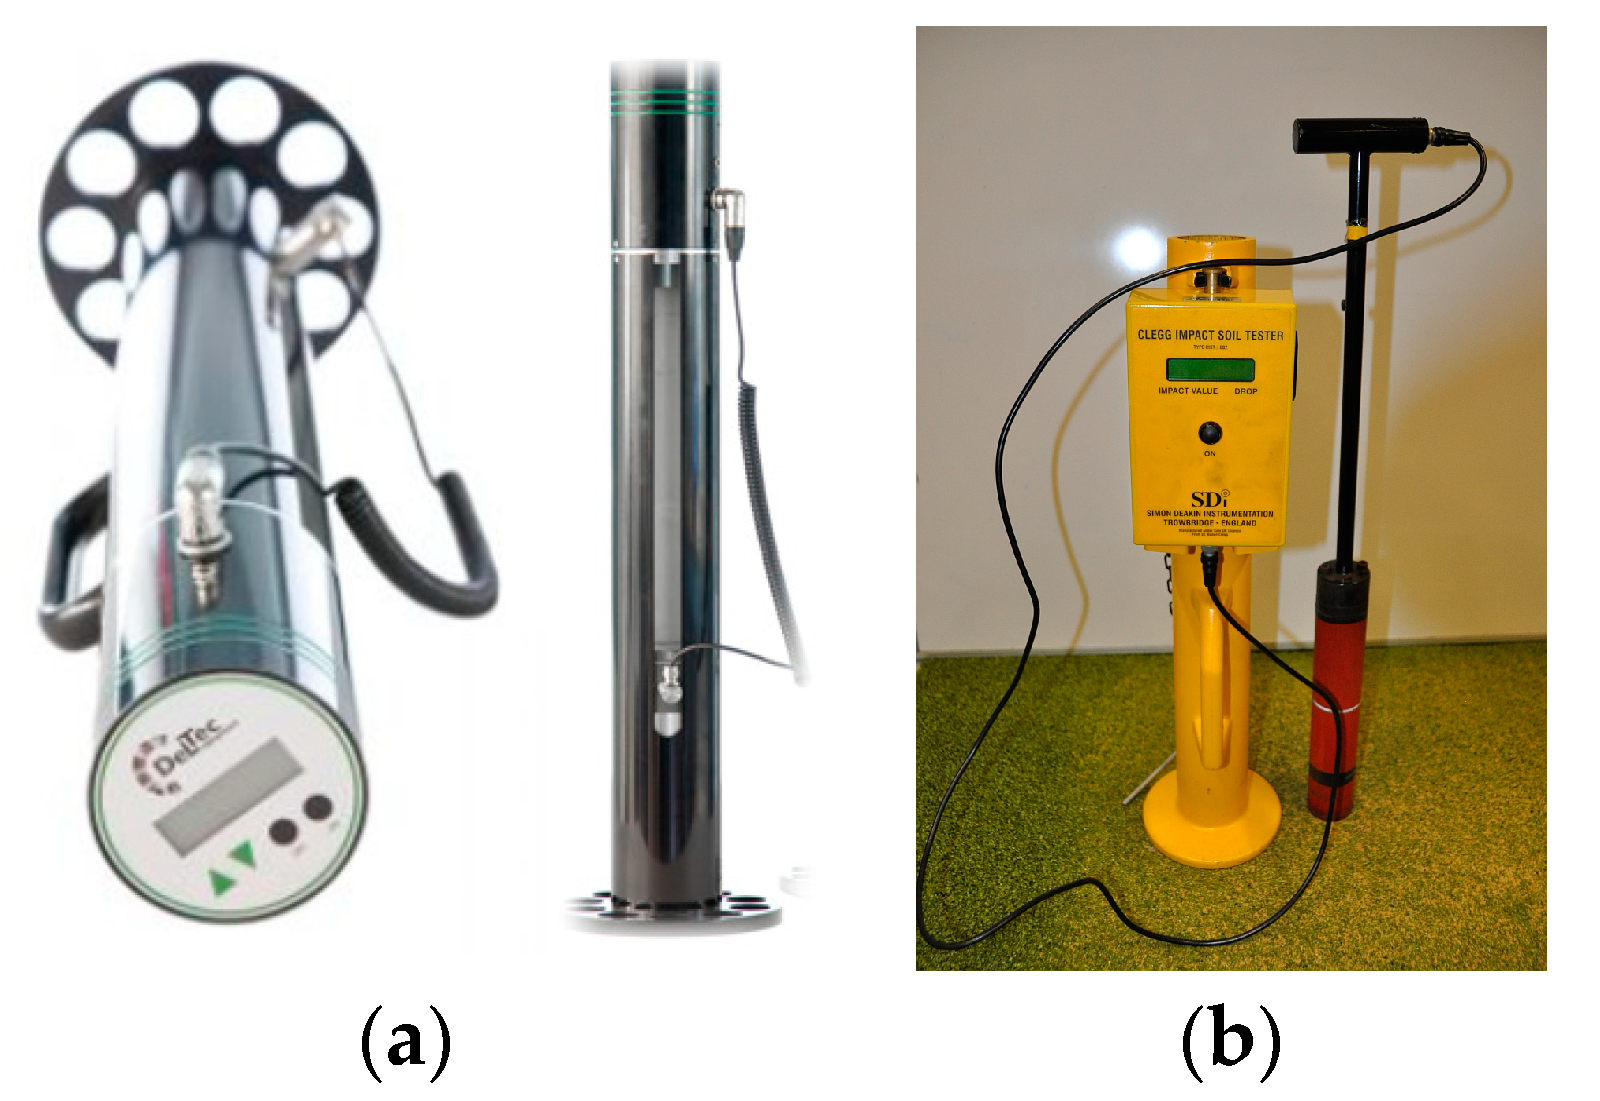
2.2. The Fieldtester

According to the manufacturer [4], the Fieldtester is a lightweight (~10 kg in total), easy-to-use and budget-friendly test device (Figure 2a). It monitors the force reduction, vertical deformation and energy restitution of artificial turf football pitches. The test results are claimed to compare directly with AAA-based FIFA requirements; however, no correlation or adjustment factor(s) is provided. The Fieldtester is not yet specified in any testing standard, although it has been used by this paper’s authors for several years for monitoring field maintenance.

2.3. The Clegg Impact Soil Tester

The “Clegg Impact Soil Tester” (CIST) test device was originally developed for evaluating road materials [2] (Figure 2b), comprising a 4.5 kg mass instrumented with an accelerometer. Lighter versions were then developed for evaluating cricket pitches, with a mass of 0.5 kg, and subsequently a 2.25 kg mass for testing sports turf—all hammer masses are 50 mm in diameter and dropped from a height of 45 cm. The 2.25 kg Clegg is specified in the ASTM standard F1702 for natural turf [5]. The CIST is usually dropped repeatedly up to 5 times, and a variety of interpretations exist that utilize the peak deceleration readout for the first, last or average drop [6]. The CIST produces a very rapid “undamped” impact. Peak decelerations commonly encountered suggest very high peak forces (Table 1), considered to be well beyond those applied by an athlete [7].
The lighter 0.5 kg CIST was introduced for monitoring the hardness of natural cricket surfaces and linked to ball bounce. More recently, the 0.5 kg Clegg was also specified for natural turf playing hardness in rugby union natural turf testing guidelines. Multiple drops of the CIST devices usually cause an increase in the Clegg Impact Value (CIV) demonstrating an increased “hardness” [8], observed to be caused by compaction and some shearing of the material under test (Section 3.3).

2.4. Impact Energy

The four mechanical impact devices are contrasted in Table 1. The potential energy of each highlights a large contrast, although the AAA and 2.25 kg CIST are similar. The AAA and Fieldtester incorporate a spring system to dampen the impact, reducing the peak force and extending the impact load pulse. Therefore, not all the impact energy is delivered into the surface under test; some is stored in the spring’s compression. The spring in the Fieldtester device is assumed to be softer than that of the AAA, to achieve similar peak forces from its drop height. The CIST diameter is smaller, leading to higher contact stresses. Moreover, the test foot of the AAA and the Fieldtester is slightly curved [2], to reduce the issue of high-edge contact stresses for a rigid body contacting a deformable surface.

3. Device Correlations and Behavior

Three separate research studies are presented to demonstrate the differences in the “hardness” response of a range of sport surface components and systems for the different impact devices.

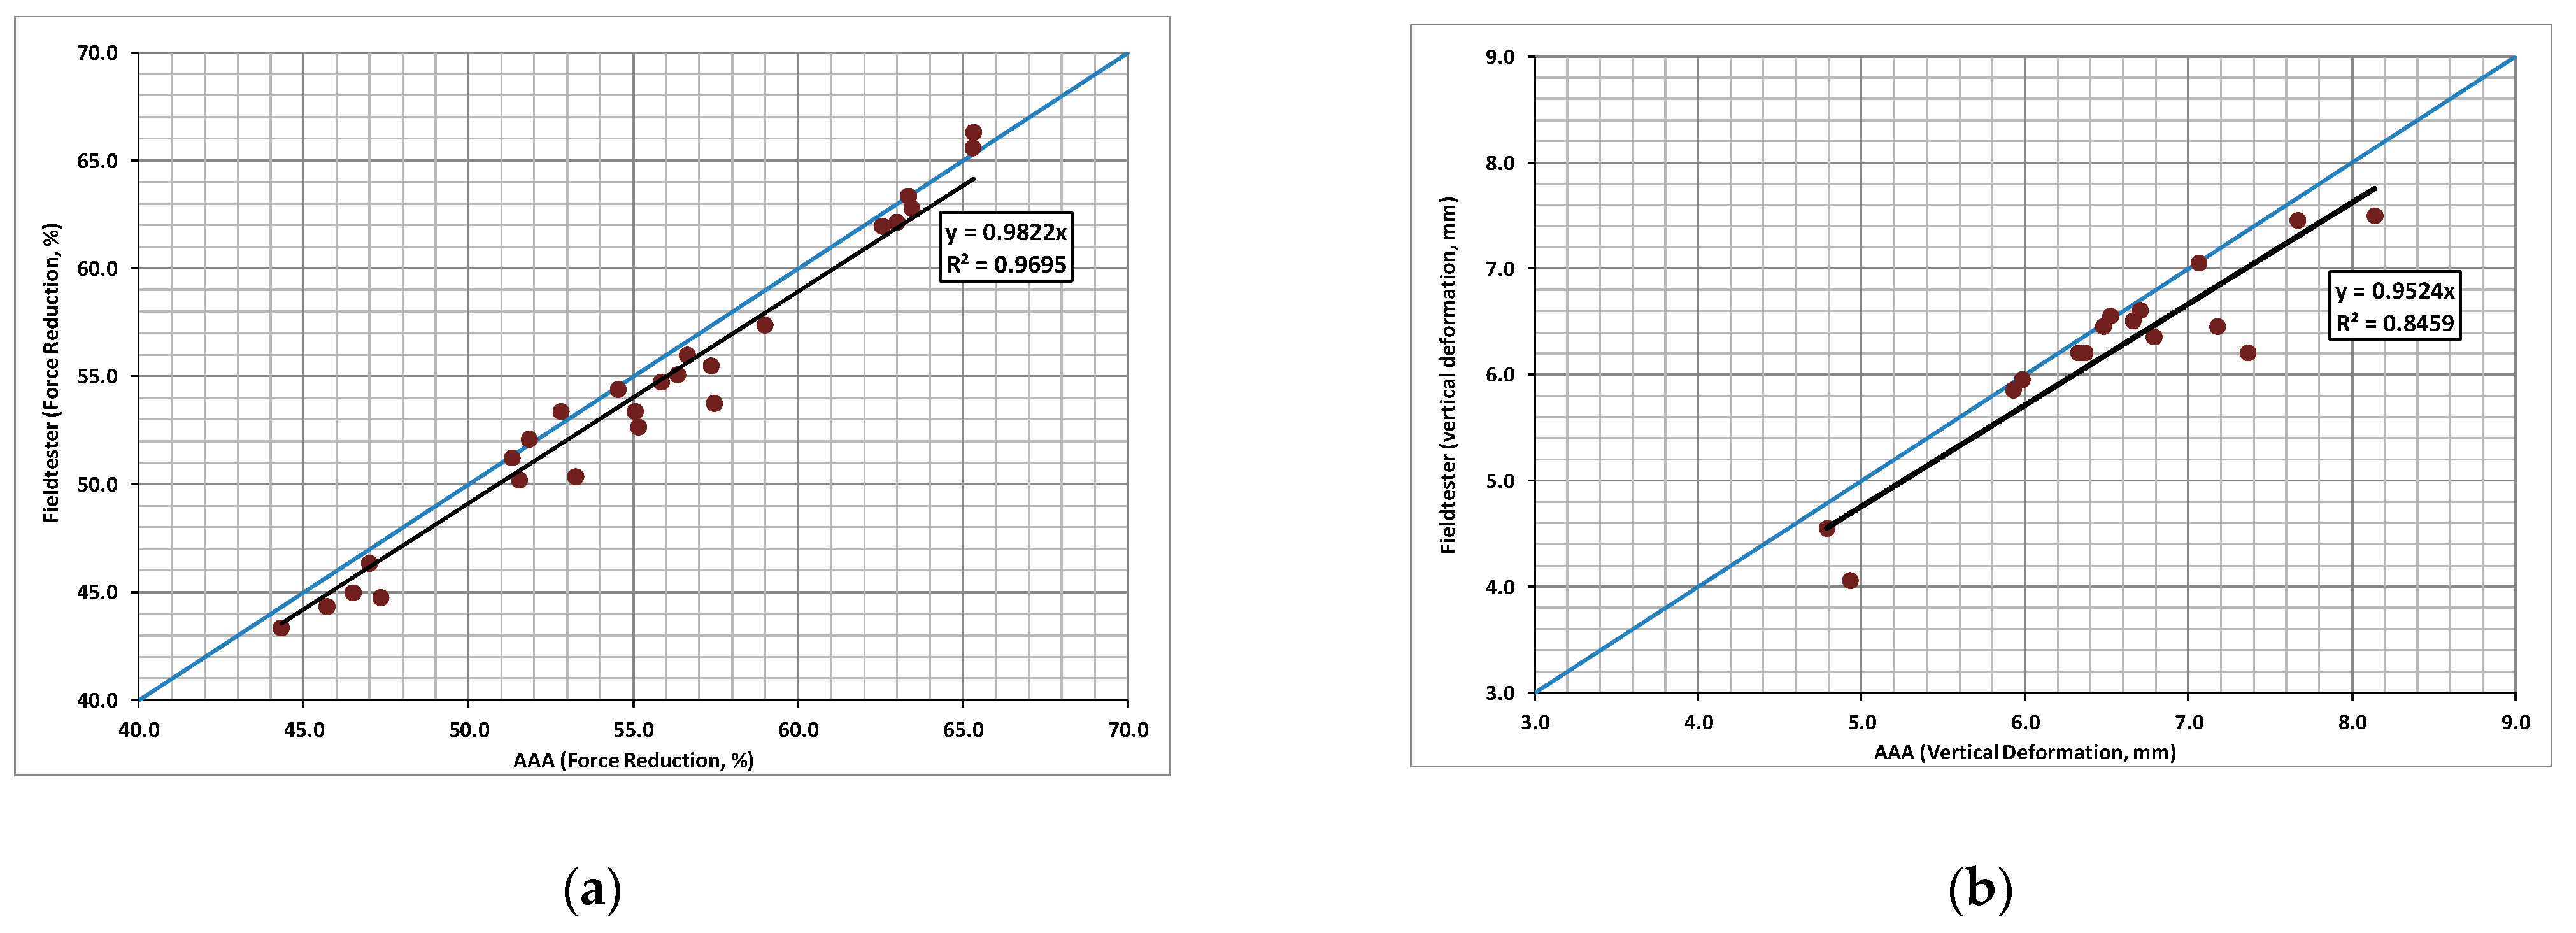
3.1. AAA and 2.25 kg CIST

In a study of elite-level water-based (w/b) hockey fields, three different pitch types were investigated to demonstrate the differences in the “hardness” response of components and systems [9]. Six w/b pitches were visited during the playing season [10]. These hockey surfaces comprise short fibers (10–12 mm) with no infill and a thin shockpad (6–12 mm). A sand-filled hockey pitch was included for comparison. A strong correlation was observed for the non-infilled surfaces but not for the sand-filled surface (Figure 3). When extended to include a range of “3G” artificial turf fields, a strong correlation was observed between the 2.25 kg CIST and the AAA [1].
The stronger correlations were observed on the more elastic systems (rubber and foam). For the sand-based system, the CIST was observed to cause permanent displacement of the sand, thought to be due to its higher impact velocity and contact stresses. The AA result of 50% corresponds to a peak stress estimated as 219 kPa, equating to a CIST impact value of 135 g and peak stress of 380 kPa. The flatness of the correlation suggests the CIST was less sensitive to the shockpads detected by the AA.
A further laboratory study [9] tested three hockey samples (49, 58 and 68% force reduction) sited on a force plate. Force plate readings for the 2.25 kg CIST were 4635 N, 3133 N and 2516 N, which compared well to the AA, 4669 N, 3102 N and 2818 N, respectively. The impact duration was measured: for the 2.25 kg CIST the durations were 5, 6 and 9 ms, compared to those of the AAA, which were 25, 29 and 33 ms, respectively.

3.2. AAA and Fieldtester

The AAA and the Fieldtester were compared across field and laboratory data sets. Field testing was carried out at two separate 3G football fields, and at five locations per pitch. A period of 30 s was allowed between each of the standard three drops to allow the test surface to recover from the compression of the previous drop. The average of the second and third drops were used to calculate the Force Reduction (FR, %) and Vertical Deformation (VD, mm) in accordance with the FIFA method [2]. A greater range of “hardness” measurements was achieved by supplementing the field data with laboratory testing for a range of 17 shockpad samples of different thickness, with three repeat tests on each sample also with a 30 s period of rest between impacts. The data from the two sessions were combined to produce a unified data set, which represented close to the full range permitted in practice by FIFA of FR 55–70% and VD 4–11 mm (Figure 4). The best fit line gradients are close to, but below, 1, demonstrating that the Fieldtester under-reads in comparison to the AAA, and the goodness of fit for VD is poorer than for FR.

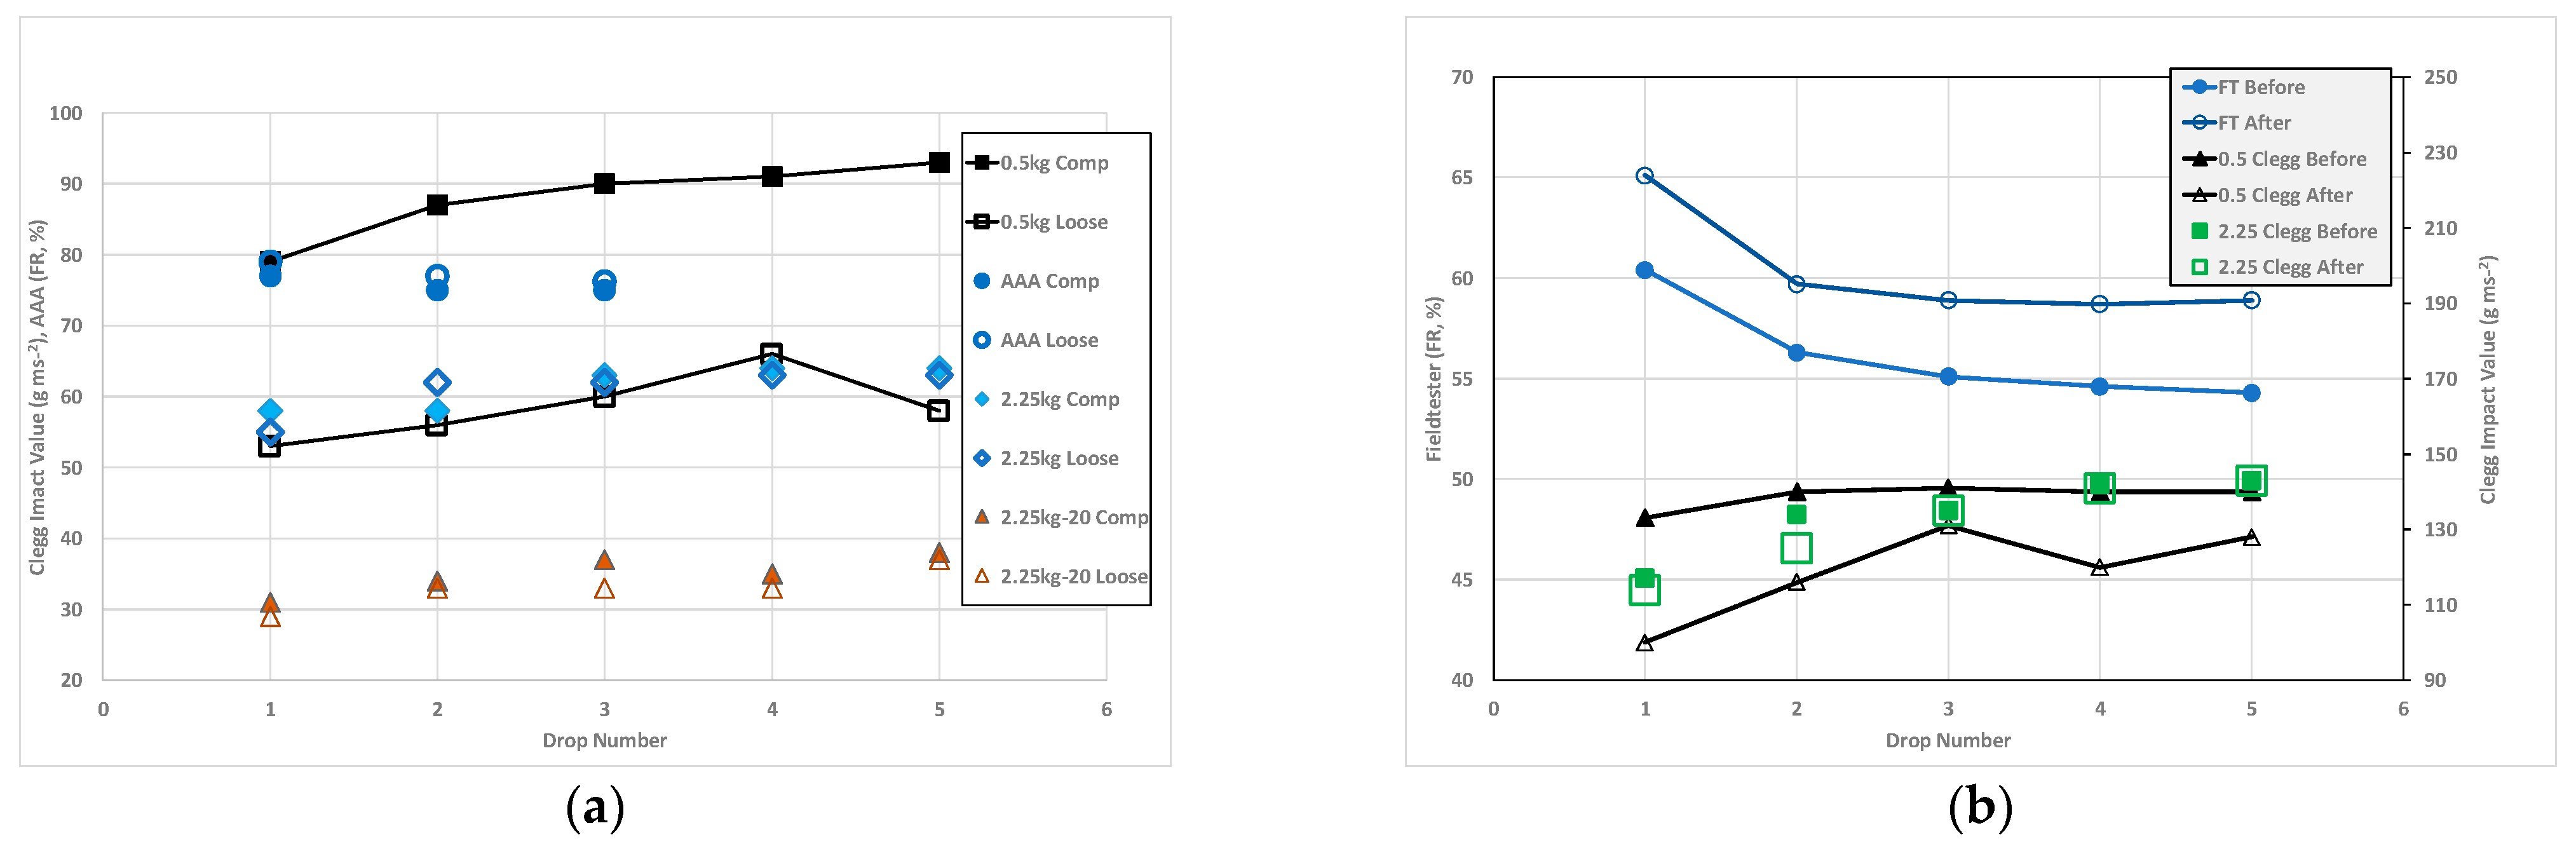
3.3. Surface Hardness and Maintenance Monitoring

3G artificial turf (AT) pitches are observed to get harder over time, caused by compaction of the rubber infill [11]. “Decompaction” maintenance is intended to slow or reverse this degradation. Laboratory work demonstrated that a large range of densities were achievable for a typical rubber infill in a long pile carpet [11]. The AAA and Fieldtester were shown to be less sensitive to density changes than a ball rebound, the former causing compaction during the repeated drops. The field trials reporting before and after full-scale decompaction maintenance showed only small magnitude changes in FR [11].
To investigate the potential of the 0.5 kg CIST with its lower impact energy (more like a football), a series of laboratory tests utilized the AAA and the 2.25 kg and 0.5 kg CISTs. The sample was a 1 m × 1 m 60 mm pile carpet with 40 mm crumb rubber infill depth installed above a 20 mm thick rubber shockpad. The infill was compacted using a studded roller for 50 rolls [2], tested (five repeat drops) in five locations across the sample, raked to loosen and re-tested. The infill net bulk density [11] was estimated as loose = 0.35 g/cm3 and compacted = 0.46 g/cm3. Hardness increased with each repeated drop (Figure 5a). Further, the 0.5 kg CIST showed a larger relative change in impact value (around 30 g) from the change in surface infill state than either the AAA or 2.25 kg CIST (the latter from the full 45 cm and reduced 20 cm drop height to investigate a lower energy impact).
To extend the evaluation, a field trial was undertaken on a full-size in-service pitch (60 mm pile carpet, 35 mm infill depth without a shockpad) where a “deep” decompaction was performed on an infill that had become very compacted. Results from one of the six field test positions are given in Figure 5b. Based on the average of the second and third drop with the AAA (Fieldtester here), the “before” decompaction results suggest an FR of approximately 55.5% (the acceptable FR range is 55% to 70% [2]). Contrasting the difference FR values between Figure 5a,b suggests the lab sample is “soft”. The field density of rubber is not measurable, and previous research [11] trialed the change in “hardness” for repeated drops to assess the relative density. The 0.5 kg CIST showed little change in the impact value for the “before” condition for repeated drops. The Fieldtester (FT) and 2.25 kg CIST showed an increase in hardness with repeated drops (on the same spot), suggesting further compaction was occurring.
The 0.5 kg, in the first impacts (Figure 5b), showed a reduction of around 30 g (~25%), whilst the 2.25 kg CIST and FT showed a much smaller change. Across all testing positions, the average before-after change for the 0.5 kg CIST was around 30 g (22%). The 2.25 kg CIST average change was ~5 g (4%), whilst the FT absolute FR average change was ~5%. The 0.5 kg CIST showed a relatively large change after the deep decompaction and after impact values of the three drops approached the magnitude of those observed before maintenance, suggesting a re-compaction of the infill. In contrast, the 2.25 kg CIST and FT showed similar patterns for repeated impacts for the before and after conditions.
In summary (from six locations, and three repeat tests), the average change in the Fieldtester FR was 4%, in the 2.25 kg CIST 0 g and in the 0.5 kg CIST 27 g. As a % of the pre-maintenance values, the average change observed was 7% for the FT, 3% for the 2.25 kg CIST and 22% for the 0.5 kg CIST.
The combined results show that the 0.5 kg CIST is much more sensitive to the changes in the infill state than the higher impact energy devices, due to its lower impact energy. It is also demonstrated that the first impact from the devices is more relevant to assess the initial state of the surface and may be more akin to what the player “feels”. The size of the “change” for repeated 0.5 kg CIST is considered useful to indicate relative infill density, a flatter response suggesting a denser state.

4. Discussion

The unique data set presented shows a very strong correlation between the non-standard FT device to the gold standard AAA device. FR correlates very closely to a conversion factor of 1, and for VD the fit was less close to 1. Despite differences in the test setup (Table 1), such as drop mass and drop height, the similarity is encouraging for the routine use of the FT. The 2.25 kg CIST is used in monitoring natural turf hardness, and standards [6,12] suggest an “ideal” safety range of 60–100 g [6,12]. The relationships presented here on elastic surfaces suggest that further work could produce useful guidance for artificial turf systems (excluding sand-filled systems) to include the 2.25 kg and/or the 0.5 kg CIST to monitor hardness for safety.
Monitoring the changing state of the rubber infills in 3G fields and measuring maintenance effects is challenging. For looser infills, the standard impact tests cause irrecoverable deformation. Under dynamic compressive loading from free falling impact devices, it is helpful to assess and compare the impact energy and contact area. For polymeric sport surface materials, i.e., rubber shockpads and particulate infills, the stiffness response under compression will increase with increasing strain, i.e., strain hardening. The mechanism of hardening may be from increased resistance, as the porous material compression provides more particle to particle contact as air is squeezed out, but it may be fully recoverable, i.e., elastic for a shockpad. Alternatively, for the particulate infill materials, compressive strain is not fully recoverable, as particles can be rearranged and packed, i.e., compacted, and high initial porosity [11] leads to permanent compression. The 0.5 kg CIST offers useful insights into the infill state, to monitor maintenance effectiveness.
With a wealth of experience behind industry guidance [2], the standard AAA device is not considered redundant; it serves the useful purpose of comparing between surface systems and for site quality assurance. However, the FR % derived from the second and third drops for the AAA (and FT) represents a changed density and hence hardness state of AT infill. These findings support the view [7] that the first drop is the most relevant to evaluating surface performance and maintenance benefits.

5. Conclusions

Hardness is an important sport surface characteristic, although it is important to consider how it is measured. A range of hardness-related devices exist, which vary in test method and analysis. The correlations presented for the 2.25 kg and 0.5 kg CIST, AAA and Fieldtester suggest that the use of non-standard (and more portable) devices for routine monitoring of surface hardness is appropriate. The 0.5 kg CIST is considered suited to monitoring the relative density and hardness of artificial turf infill and demonstrating the benefits of “decompaction” maintenance.

Acknowledgments

Data in 3.2 and 3.3 were generated from an Innovate UK award (Technical Surfaces KTP009920).

References

  1. Fleming, P.R. Artificial turf systems for sport surfaces: Current knowledge and research needs. Proc. Inst. Mech. Eng. Part P J. Sports Eng. Technol. 2011, 225, 43–64. [Google Scholar] [CrossRef]
  2. Fédération Internationale de Football Association. FIFA Quality Concept for Football Turf: Handbook of Test Methods. 2015. Available online: www.FIFA.com (accessed on 23 September 2019).
  3. Clegg, B. An impact testing device for in situ base course evaluation. Aust. Road Res. Bur. Proc. 1976, 8, 1–6. [Google Scholar]
  4. Deltec, Equipment for Testing Fields. Available online: https://www.deltecequipment.com/testing-equipment/ (accessed on 12 October 2019).
  5. ASTM. F1702 (2018): Standard Test Method for Measuring Impact-Attenuation Characteristics of Natural Playing Surface Systems Using a Lightweight Portable Apparatus; ASTM: West Conshohocken, PA, USA.
  6. Thanheiser, S.Y.; Grashey-Jansen, S.; Armbruster, G. Hardness measurement of natural and hybrid turf soccer fields. Sports Eng. 2018, 21, 367–37. [Google Scholar] [CrossRef]
  7. Saunders, N.; Twomey, D.; Otago, L. Clegg hammer measures and human external landing forces: Is there a relationship? Int. J. Sports Sci. Eng. 2011, 5, 231–236. [Google Scholar]
  8. Twomey, D.M.; Ullah, S.; Petrass, L.A. One, two, three or four: Does the number of Clegg hammer drops alter ground hardness readings on natural grass? Proc. Inst. Mech. Eng. Part P J. Sports Eng. Technol. 2013, 228, 33–39. [Google Scholar] [CrossRef]
  9. Fleming, P.; Young, C.; Dixon, N. Performance Measurements on Synthetic Turf Hockey Pitches. In The Engineering of Sport 5; SEA: Aachen, Germany, 2004; Volume 2, pp. 524–531. ISBN 0-9547861-1-4. [Google Scholar]
  10. Young, C.; Fleming, P.R.; Dixon, N.; Jones, R.; Roberts, J.R. Correlating Playing Performance Tests with Human perceptions for Synthetic Field Hockey Pitches. In The Engineering of Sport 5; ISEA: Aachen, Germany, 2004; Volume 2, pp. 517–523. ISBN 0-9547861-1-4. [Google Scholar]
  11. Fleming, P.R.; Forrester, S.E.; McLaren, N.J. Understanding the effects of decompaction maintenance on the infill state and play performance of third-generation artificial grass pitches. Proc. Inst. Mech. Eng. Part P J. Sports Eng. Technol. 2015, 229, 169–182. [Google Scholar] [CrossRef] [PubMed]
  12. UEFA Pitch Quality Guidelines, Natural Turf Pitch Management. 2018. Available online: https://www.uefa.com/ (accessed on 12 October 2019).
Figure 1. (a) schematic of the Advanced Artificial Athlete (AAA) [1]: 1. Support frame; 2. Electric magnet; 3. Falling mass; 4. Accelerometer; 5. Spring; 6. Test foot; 7. Test surface; 8. rigid floor; (b) photograph of the AAA setup.
Proceedings 49 00130 g001
Figure 2. (a) the Fieldtester showing the readout unit (left) and in profile (right) (reproduced from [3]); (b) the Clegg Impact Soil Tester (2.25 kg unit) and guide tube with the readout unit attached.
Proceedings 49 00130 g002
Figure 3. The relationship between the industry standard AAA and the 2.25 kg Clegg Hammer for three different generic types sport surface systems (modified from [1]).
Proceedings 49 00130 g003
Figure 4. Correlations for the Fieldtester and AAA on a range of laboratory samples and field data, for force reduction (FR) (a) and vertical deformation (VD) (b). The line of equality is shown, and the best fit lines forced through the origin.
Proceedings 49 00130 g004
Figure 5. (a) Laboratory impact test data on a rubber infilled carpet for “loose” and “compacted” (Comp) states. (b) Field data (for a specific position, and typical of all positions) for 5 repeated impacts with the Fieldtester (FT) and CIST devices, showing results for “before” and “after” a deep decompaction of the infill.
Proceedings 49 00130 g005
Table 1. A comparison of the “hardness” test methods, their impact energy and impact velocity.
Device Drop Weight (kg)Drop Ht. (cm)Diameter (cm)Load Pulse (ms)Potential Energy (J) Impact Vel. (m/s)
AAA 1205.57~20111.04
Fieldtester 1~5~357Unknown172.6
2.25 kg CIST2.254552–5103.0
0.5 kg CIST0.54552–52.23.0
1 Note that both the AAA and Fieldtester incorporate a spring to dampen the impact and extend the load pulse.
Publisher’s Note: MDPI stays neutral with regard to jurisdictional claims in published maps and institutional affiliations.

