Article

Precipitation Dominates Long-Term Water Storage Changes in Nam Co Lake (Tibetan Plateau) Accompanied by Intensified Cryosphere Melts Revealed by a Basin-Wide Hydrological Modelling

1
Key Laboratory of Tibetan Environment Changes and Land Surface Processes, Institute of Tibetan Plateau Research, Chinese Academy of Sciences, Beijing 100101, China
2
University of Chinese Academy of Sciences, Beijing 100049, China
3
CAS Center for Excellence in Tibetan Plateau Earth Sciences, Beijing 100101, China
*
Author to whom correspondence should be addressed.
Remote Sens. 2020, 12(12), 1926; https://doi.org/10.3390/rs12121926
Submission received: 13 April 2020 / Revised: 6 June 2020 / Accepted: 11 June 2020 / Published: 14 June 2020

Abstract

:
Lakes on the Tibetan Plateau (TP) have changed dramatically as a result of climate change during recent decades. Studying the changes in long-term lake water storage (LWS) is of great importance for regional water security and ecosystems. Nam Co Lake is the second largest lake in the central TP. To investigate the long-term changes in LWS, a distributed cryosphere-hydrology model (WEB-DHM) driven by multi-source data was evaluated and then applied to simulate hydrological processes across the whole Nam Co Lake basin from 1980 to 2016. Firstly, a comparison of runoff (lake inflow), land surface temperature, and snow depth between the model simulations and observations or remote sensing products showed that WEB-DHM could accurately simulate hydrological processes in the basin. Meanwhile, the simulated daily LWS was in good agreement with satellite-derived data during 2000–2016. Secondly, long-term simulations showed that LWS increased by 9.26 km3 during 1980–2016, reaching a maximum in 2010 that was 10.25 km3 greater than that in 1980. During this period, LWS firstly decreased (1980–1987), then increased (1988–2008), and decreased again (2009–2016). Thirdly, the contributions of precipitation runoff, melt-water runoff, lake surface precipitation, and lake evaporation to Nam Co LWS were 71%, 33%, 24%, and -28%, respectively. Snow and glacier melting have significantly intensified during recent decades (2.96 m3 s−1/decade on average), contributing a mean proportion of 22% of lake inflows. These findings are consistent with the significant increasing trends of annual precipitation and temperature in the lake basin (25 mm/decade and 0.4 K/decade, respectively). We conclude that long-term variations in Nam Co LWS during 1980–2016 were largely controlled by precipitation; however, the contribution of precipitation runoff to total lake inflow has decreased while the contribution from warming-induced snow and glacier melting has significantly increased.

Graphical Abstract

1. Introduction

The Tibetan Plateau (TP) is known as the “water tower of Asia” [1,2], and holds the world’s highest density, highest number, and largest area of lakes; these account for about 50% of the total area of lakes in China [3,4]. In the past few decades, climate change (characterized by increasing temperatures) has changed the precipitation pattern and evapotranspiration characteristics of the TP, with significant impacts on the water storage of inland lakes [5]. In particular, increasing temperature has accelerated the retreat of glaciers and the degradation of permafrost; consequently, these have become important water sources for many expanding lakes [6]. Many studies have found that most lakes in the TP showed a significant upward tendency in water level [7,8,9,10]. Therefore, accurate estimates of water storage in these lakes are not only important for gaining a better understanding of the response of lakes to climate change, but are also crucial for hydrological and ecological simulations of the TP.
Nam Co is the second largest lake in the central TP [11], and its changes and controlling factors have been widely studied. However, due to the severe environment of the TP, process-based observations are difficult to collect, and in-situ data are sparse. In recent decades, many studies of lakes across the TP have been based on the remote sensing images [12]. Wu et al. [13] studied the response of lake-glacier variations in Nam Co from 1970 to 2000 using an aero-photo topographic map and TM/ETM satellite images and found that Lake expansion is mainly induced by the increase of the glacier melting water, increase of precipitation, and obvious decrease of potential evapotranspiration. Kropáček et al. [14] derived the lake level trend of Nam Co as a climate change indicator for the TP using multi-source remote sensing data. Liu et al. [15] studied the long-term change of Nam Co and its hydrological response using satellite data and in-situ observations of the Lhasa River. Lei et al. [16] studied the water balance of the TP and found that increasing precipitation and runoff, and decreasing evaporation, were the major factors causing lake growth on the TP. Zhang et al. [17] studied the long-term lake water storage (LWS) changes of Nam Co using multiple remote sensing datasets, and revealed that the increased precipitation and runoff, particularly the contribution from glacier melt, has led to the expansion of Nam Co. Zhu et al. [18] quantified the water balance of Nam Co from 1971 to 2004 using remote sensing imagines, GIS, and statistical analysis; they found that the increasing LWS was mainly due to increasing glacier melt. Ma et al. [19] suggested that changing precipitation is the primary factor causing lake expansion. Zhou et al. [20] found an imbalance between rates of inflow and outflow, based on observed lake levels and discharge; the imbalance was associated with groundwater flow. Du et al. [21] found that increasing temperature was an important factor causing a decrease in groundwater volume in Nam Co basin. These studies were based on remote sensing data, water balance analysis, or other empirical methods.
More recently, many researchers have applied hydrological models to study changes in Nam Co. Wu H et al. [22] studied the water level of Nam Co and regional glacier mass balance with ICESat data and the EGM2008 model from 2003 to 2009. They suggested that glacier melt contributed 20.75% to the rising water level, assuming that the glacier runoff coefficient is 0.6. The J2000 model coupled with a degree-day model was employed by Gao et al. [23] to simulate the water balance of Nam Co. Krasuse et al. [24] simulated Nam Co hydrological processes with ECHAM5 data and also suggested that glacier melt water has an important impact on the rising lake level. Adnan et al. [25] used the SWAT model coupled with a degree-day model to quantify the water budget of Nam Co during 2007–2013, finding mean annual relative contributions of precipitation and glacier melt to the lake of 57% and 43%, respectively. Other studies have focused on glaciers in the Nam Co catchment, suggesting that glacier melt is the major component of runoff from the basin [26,27,28]. Although many studies have modelled Nam Co basin, most of the corresponding study periods were limited by the available forcing data or discharge data, and cryospheric processes in most of these models were empirical. The controlling factors of lake change are still under discussion. Few long-term studies were conducted in Nam Co. Wu Y et al. [29] simulated the long-term (1980–2010) water level change using a monthly water balance model based on the Budyko hypothesis, and analyzed the contribution of different factors to the net level change. They suggested that Nam Co would continue to rise but at a slower rate. Li et al. [30] detected changes of Nam Co with multiple satellite datasets and simulated lake watershed hydrological processes with a monthly lake-watershed model coupled to a degree-day model. They concluded that precipitation was the dominant controlling factor for the rising lake level and Nam Co still got a slight expansion trend from 2009 to 2015 with a rate of 0.06 m/yr. However, Song et al. [31] found that Nam Co has a slightly decreasing trend during 2009–2013.
The major objective of this study is to examine LWS changes of Nam Co during 1980–2016 on a daily scale, by applying a process-based cryosphere-hydrology model. A longer study period and finer temporal resolution could improve our understanding of the long-term changes in LWS and its driving forces. The water and energy budget-based distributed hydrological model (WEB-DHM) [32,33,34,35,36,37] was adopted to simulate the lake inflows of Nam Co. This model comprehensively simulates hydrosphere–biosphere–atmosphere interactions. The simulation results were verified by the measured runoff, MODIS land surface temperature (LST) products, and Special Sensor Microwave/Image (SSM/I) derived snow depth. The Penman formula and a simplified sublimation estimation method were used to calculate lake surface evaporation. By combining these results with the simulated runoff, lake surface precipitation, and estimated lake surface evaporation, the LWS changes of Nam Co during 1980–2016 were calculated. These were verified by satellite-derived LWS changes. Uncertainties in the simulation results were also discussed, and finally the water balance components of Nam Co and their contributions to the long-term LWS were quantified.

2. Datasets and Study Area
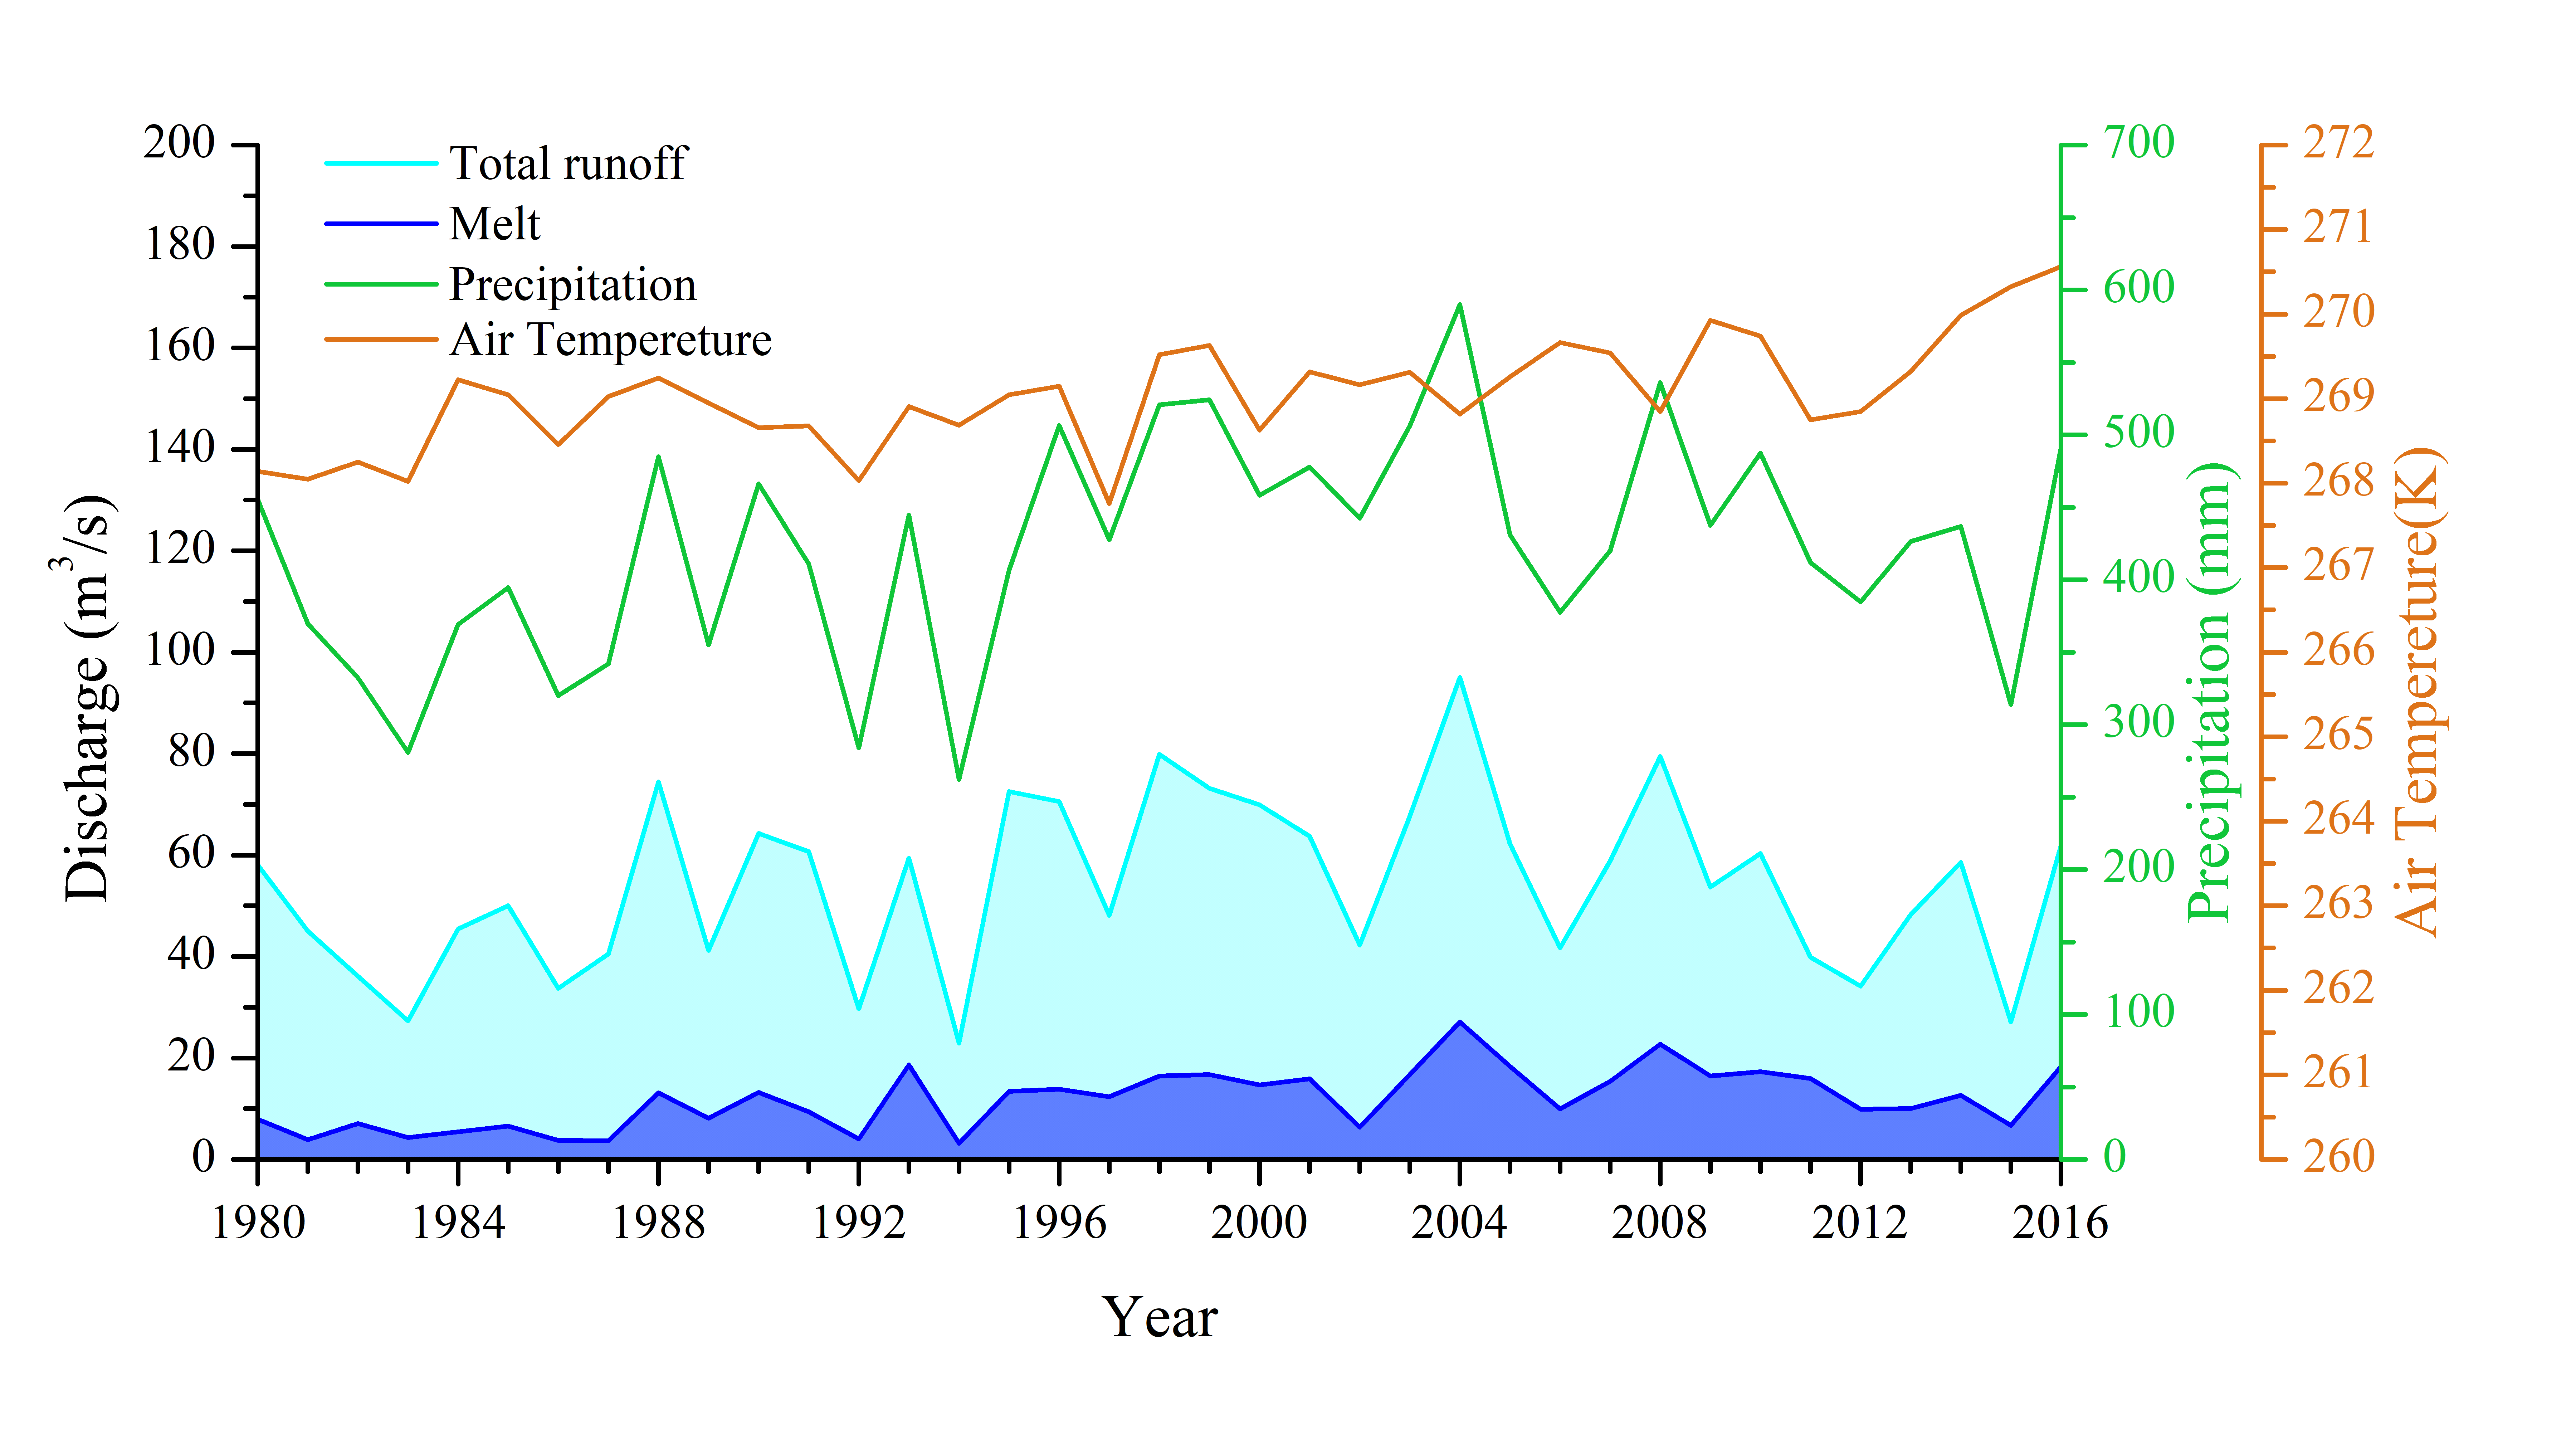
2.1. Study Area

Nam Co is the second largest inland lake in the central TP, with a catchment area of 10,610 km2 [11] (Figure 1). Nam Co basin (89°13′~91°29′ E, 29°51′~31°13′ N) is located in the north-west of the Nyainqentanglha Mountains. Surface elevations range from 4720 to 6740 m, with an average of 5500 m [38]. Nam Co basin is a semi-arid region, with a climate that is mainly affected by the westerlies and Indian monsoon. The mean annual precipitation of ≈414 mm mainly falls in the monsoon period (from June to September), and the mean annual temperature is about 0 °C [18]. There are many glaciers in the basin covered a total area of about 157 km2 in 2015 [30], and the glacier area in this region is decreasing [39]. Glacier melt water is of great importance to the water balance and hydrological process of Nam Co and the surrounding basin [26,27,29]. Glacier melt contributes to the runoff increasing but the melt will decrease as the glacier area reduced [40,41]. The Nam Co Monitoring and Research Station for Multisphere Interactions (30°46′ N, 90°59′ E) was established by the Institute of Tibetan Plateau Research, Chinese Academy of Sciences (ITP-CAS) in 2005. Before that, no in-situ observations were available in this basin. Many rivers flow into Nam Co; six of these were simulated in this study (Figure 1).

2.2. Datasets

Multi-source datasets were used in this study including spatial data, remote sensing data, meteorological forcing data, and in-situ observations.

2.2.1. Spatial Data

The spatial data used in the study include a digital elevation model (DEM), and data on land use, soil type, soil organic carbon content (SOC), and glacier extent.
The DEM was obtained from the Shuttle Radar Topographic Mission (SRTM) (NASA and NIMA), with a spatial resolution of 90 m. To increase the efficiency and accuracy of calculations, the data were resampled to 1 km resolution in our model. Land use data were obtained from the USGS global land cover based on the land surface model (SiB2) classification with a spatial resolution of 1 km. Of the four types of land use in Nam Co basin, agriculture or C3 grassland accounted for 63% of the total area. Soil type was retrieved from the United Nations Food and Agriculture Organization global dataset with a spatial resolution of 5 km, and was resampled to 1 km to fit the model resolution. There are five soil types in the basin, with the I-X-2C type lithosols accounting for 55.5% of the total area. SOC data were obtained from the ISRIC world soil information database with a resolution of 1 km, and comprised soil organic matter data in seven layers (0, 5, 15, 30, 60, 100, and 200 cm). Glacier cover was generated from the 1 km grid WESTDC Land Cover Products 2.0 [42].

2.2.2. Remote Sensing Data

Remote sensing data used in this study included dynamic vegetation parameters, LST, snow depth, and LWS.
Leaf area index (LAI) and fraction of photosynthetically active radiation (FPAR) absorbed by the green vegetation canopy were the dynamic vegetation parameters used in WEB-DHM; these were obtained from the Global Land Surface Satellite (GLASS) datasets [43] with a resolution of 0.05 degrees and 8 days. The Moderate Resolution Imaging Spectroradiometer (MODIS)/Terra products MOD11A1 V6 [44] with a resolution of 1 km and 1 day were used to obtain the LST data, which were then used to calculate dates when the lake surface was frozen and to evaluate the performance of the model’s basin-scale energy budget. Snow depth was derived from a passive-microwave daily snow depth product in China with a spatial resolution of 25 km [45]. Snow depth data derived from the Special Sensor Microwave Imager (SSM/I) from 1987 to 2008 were used to evaluate the model performance and water budget at the basin scale. LWS was obtained from a dataset compiled from Landsat, Envisat, ICESat, CryoSat, and Jason satellite data by Li et al. [46]; this contains water storage changes of 53 lakes from 2000 to 2018, but for consistency, only those data derived from Landsat were used here.

2.2.3. Meteorological Forcing Data

The China Meteorological Forcing Data (CMFD) [47,48] were selected as the meteorological forcing data for model inputs; these include air temperature, wind speed, specific humidity, air pressure, downward shortwave and longwave radiation, and precipitation, with a resolution of 0.1 degrees and 3 h. The meteorological forcing data were interpolated to the 1 km model grids using the Inverse Distance Weighting method. The Global Land Data Assimilation System (GLDAS) [49], Tropical Rainfall Measuring Mission (TRMM) [50], and The Modern-Era Retrospective analysis for Research and Applications version 2 (MERRA-2) [51] precipitation products were also used in this study to evaluate the precipitation.

2.2.4. In-Situ Observations

Meteorological data (2005–2015) [52] from the Nam Co Monitoring and Research Station for Multisphere Interactions and daily discharge data (2008–2010) from Niyaqu station were used in this study. The meteorological data include air temperature, air pressure, precipitation, wind speed, relative humidity, and total radiation. The data cover the period 1 October 2005 to 31 December 2015, but data from 1 July 2009 to 31 December 2009 were missing in all variables, and in the other time periods, data for some variables were missing on some dates. The discharge data from Niyaqu station recorded the daily discharge in the warm season (usually from early-May to early-October) from 2008 to 2010.

3. Method

3.1. WEB-DHM Model

The WEB-DHM [32,33,34,35,36,37] model is a multi-sphere distributed hydrological model developed by coupling the Geomorphology-Based Hydrological Model (GBHM) [53,54] with the Simple Biosphere Model 2 (SiB2) [55,56], allowing detailed simulation of hydrosphere–biosphere–atmosphere interactions. In recent years, with the development of the model and its application in cold regions, the model has also been coupled with a three-layer snow module, frozen soil module, simplified glacier module, and others, and is still under development. The ultimate goal is to realize the comprehensive simulation of interactions among the cryosphere, hydrosphere, biosphere, and atmosphere on the TP [57]. WEB-DHM considers the balance of water and energy, and includes much more detailed descriptions of physical processes than some of the conceptual and empirical models. The model also allows multi-variable outputs, allowing separate analysis of individual variables and improved insights into the associated underlying physical mechanisms of hydrological processes.
In this study, the data and model were resampled and run at 1 km resolution, and the model was run with hourly time steps.

3.2. Lake Surface Evaporation

3.2.1. Evaporation Calculation

In the unfrozen period, the lake surface evaporation was calculated according to the Penman equation [58] with CMFD data. The equation is:
E w = Δ Δ + γ R n λ + γ Δ + γ   E a
where E w is the daily lake surface evaporation (mm day−1); Δ is the slope of the saturated vapor pressure (kPa °C−1); γ is the psychrometric constant (kPa °C−1); λ is the latent heat of vaporization (2.45 MJ Kg−1); and R n is the daily net radiation balance of the lake surface (MJ m−2 day−1). R n is calculated as
R n = ( 1 α )   R s R nl
where the α is the albedo of the surface (typically 0.08 for an open water surface); R s is the incoming solar radiation (MJ m−2 day−1); and R nl is the net longwave radiation (MJ m−2 day−1).
E a (mm day−1) is the contribution of eddy diffusion to evaporation, and is calculated as follows:
E a = f ( u )   ( e s e a )
where f ( u ) is a function of wind speed u (ms−1), with the general form f ( u ) = a + bu ; and e s e a is the vapor pressure deficit (kPa). Further details of the calculations are provided in [58,59,60].
In the frozen period, water is lost from the lake surface by sublimation. Due to the lack of measurements, a simplified equation was selected to calculate sublimation [61]. This equation was the same as Equation (3), where E a represents sublimation.

3.2.2. Frozen Period Estimation

Many lake water surface temperatures on the TP obtained from MODIS LST products show strong negative correlation with the duration of lake ice cover [62], indicating that the MODIS LST products can be used to determine the lake ice cover duration. We selected a method used by Zhou et al. [61] at Selin Co to estimate the frozen period.
In the first half of a year, if the daytime LST was greater than 0 °C on one date, and if there were no LSTs less than 0 °C after that date, then that date was assumed to be the transition date. If the night-time LST was greater than 0 °C on one date, and if there were no LSTs less than 0 °C after that date, then that date was assumed as the start of completely ice-free conditions. In the second half of a year, if the daytime LST was less than 0 °C on one date, and if there were no LSTs less than 0 °C before that date, then that date was assumed to be the ice-cover start date.
During the period of lake ice cover (from the ice-cover start date to the date of completely ice-free conditions), the lake surface evaporation was calculated by combining the open water evaporation and the ice sublimation. From the ice-cover start date to the transition date, the fraction of sublimation gradually increased from 0% to 100%; while from the transition date to the ice-free date, the fraction decreased.
Since complete years of MODIS LST data were only available after 2001, the lake ice cover duration was determined by MODIS LST during 2001–2016, while the mean dates for the period 2001–2016 were used for 1980–2000. Based on these assumptions, the ice-cover duration of each year was calculated as shown in Table 1.
Table 1 shows that the completely ice-free dates obtained from MODIS LST are close to mid-May, while the transition dates are close to mid-March. Qu et al. [63] found that Nam Co was usually completely frozen at the end of January, and completely ice free in mid-May, during 2006–2011. Gou et al. [64] studied the freeze-up and break-up dates of lake ice in the middle of Nam Co using multiple MODIS data products from 2000–2014, and found that the average dates of ice freeze-up start and break-up end were 20 January and 27 April, respectively. The ice-free dates in this study are similar to those of Qu et al. [63] and Gou et al. [64], indicating that the dates in Table 1 can describe the lake ice cover duration of Nam Co reasonably accurately.

3.3. Evaluation Criteria

Several statistical criteria, including the Nash–Sutcliffe efficiency (NSE), BIAS, RBE, RMSE, and R2, were used to evaluate the performance of forcing data, the model outputs and LWS of Nam Co. These criteria are defined as follows:
NSE = 1 i = 1 n ( X si X oi ) 2 / i = 1 n ( X oi X oi ¯ ) 2
RMSE = i = 1 n ( X si X oi ) 2 / n
BIAS = i = 1 n ( X si X oi ) / n
R 2 = [ i = 1 n ( X si X ¯ s ) ( X oi X ¯ o ) ] / [ i = 1 n ( X si X ¯ s ) 2 i = 1 n ( X si X ¯ o ) 2 ]

4. Results

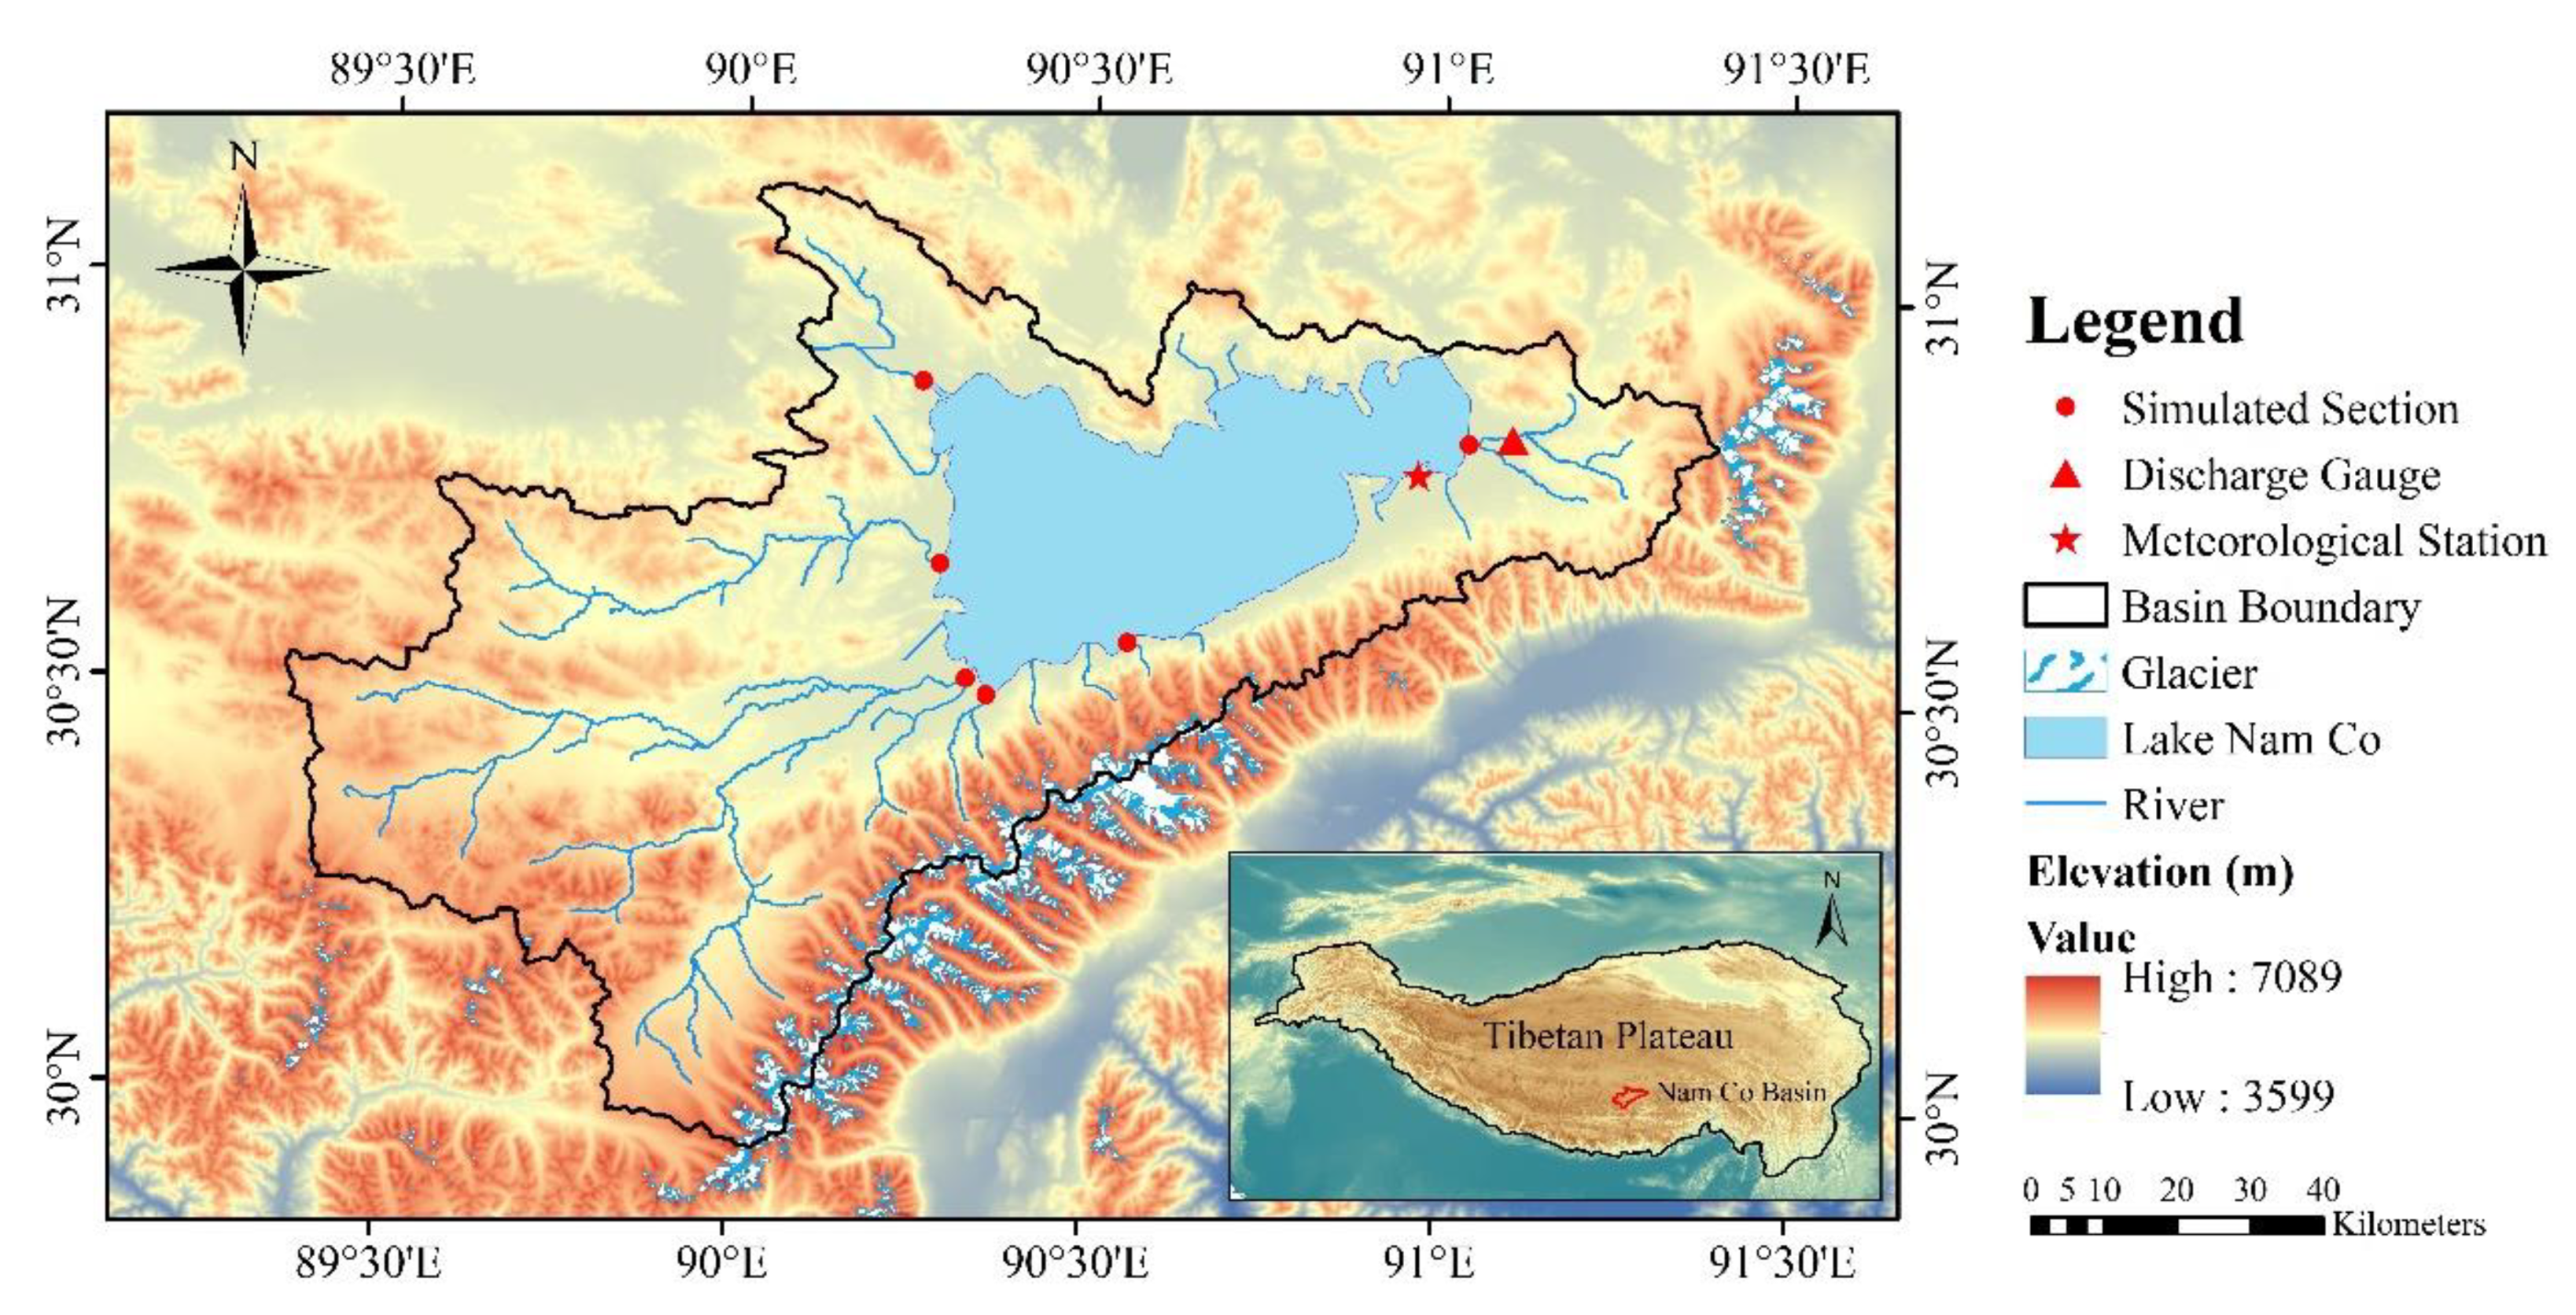
4.1. Precipitation Correction

The precipitation data has an important influence on the simulated runoff. Comparing the precipitation products of CMFD, MERRA2, GLDAS, and TRMM with the observed precipitation data at the point scale from October 2005 to December 2015, the correlation coefficients R2 were 0.662, 0.656, 0.610, and 0.622, respectively, and the relative deviations were 8.19%, 2.19%, 7.21%, and 35.80%, respectively, as shown in Figure 2. Therefore, precipitation data from CMFD and MERRA2 yielded better statistical indicators than those of the other datasets. Taking into account the resolution of both sources (0.1° × 0.1° for CMFD and 0.5 °× 0.625 ° for MERRA2), CMFD data were used for the following precipitation correction.
Differences were noted between the monthly distributions of observations and precipitation products. According to the observed data, precipitation from May to October accounted for 93% of the total precipitation, so a linear correction was applied to the precipitation from May to October as follows:
  • CMFD_corr_May = 0.73 * CMFD_May
  • CMFD_corr_Jun = 0.54 * CMFD_Jun
  • CMFD_corr_Jul = 0.65 * CMFD_Jul
  • CMFD_corr_Aug = 1.15 * CMFD_Aug
  • CMFD_corr_Sep = 1.35 * CMFD_Sep
  • CMFD_corr_Oct = 2.46 * CMFD_Oct
After correction, the R2 and relative deviations were 0.795 and 0.95%, respectively (Figure 3). CMFD precipitation was corrected according to the mean monthly precipitation at the Nam Co Monitoring and Research Station for Multisphere Interactions from 2005 to 2015; therefore, there may be lower accuracy in the precipitation data for specific years during that period. Prior to 2005, the correction may increase uncertainty of the precipitation data due to the lack of observations.

4.2. Evaluation of WEB-DHM

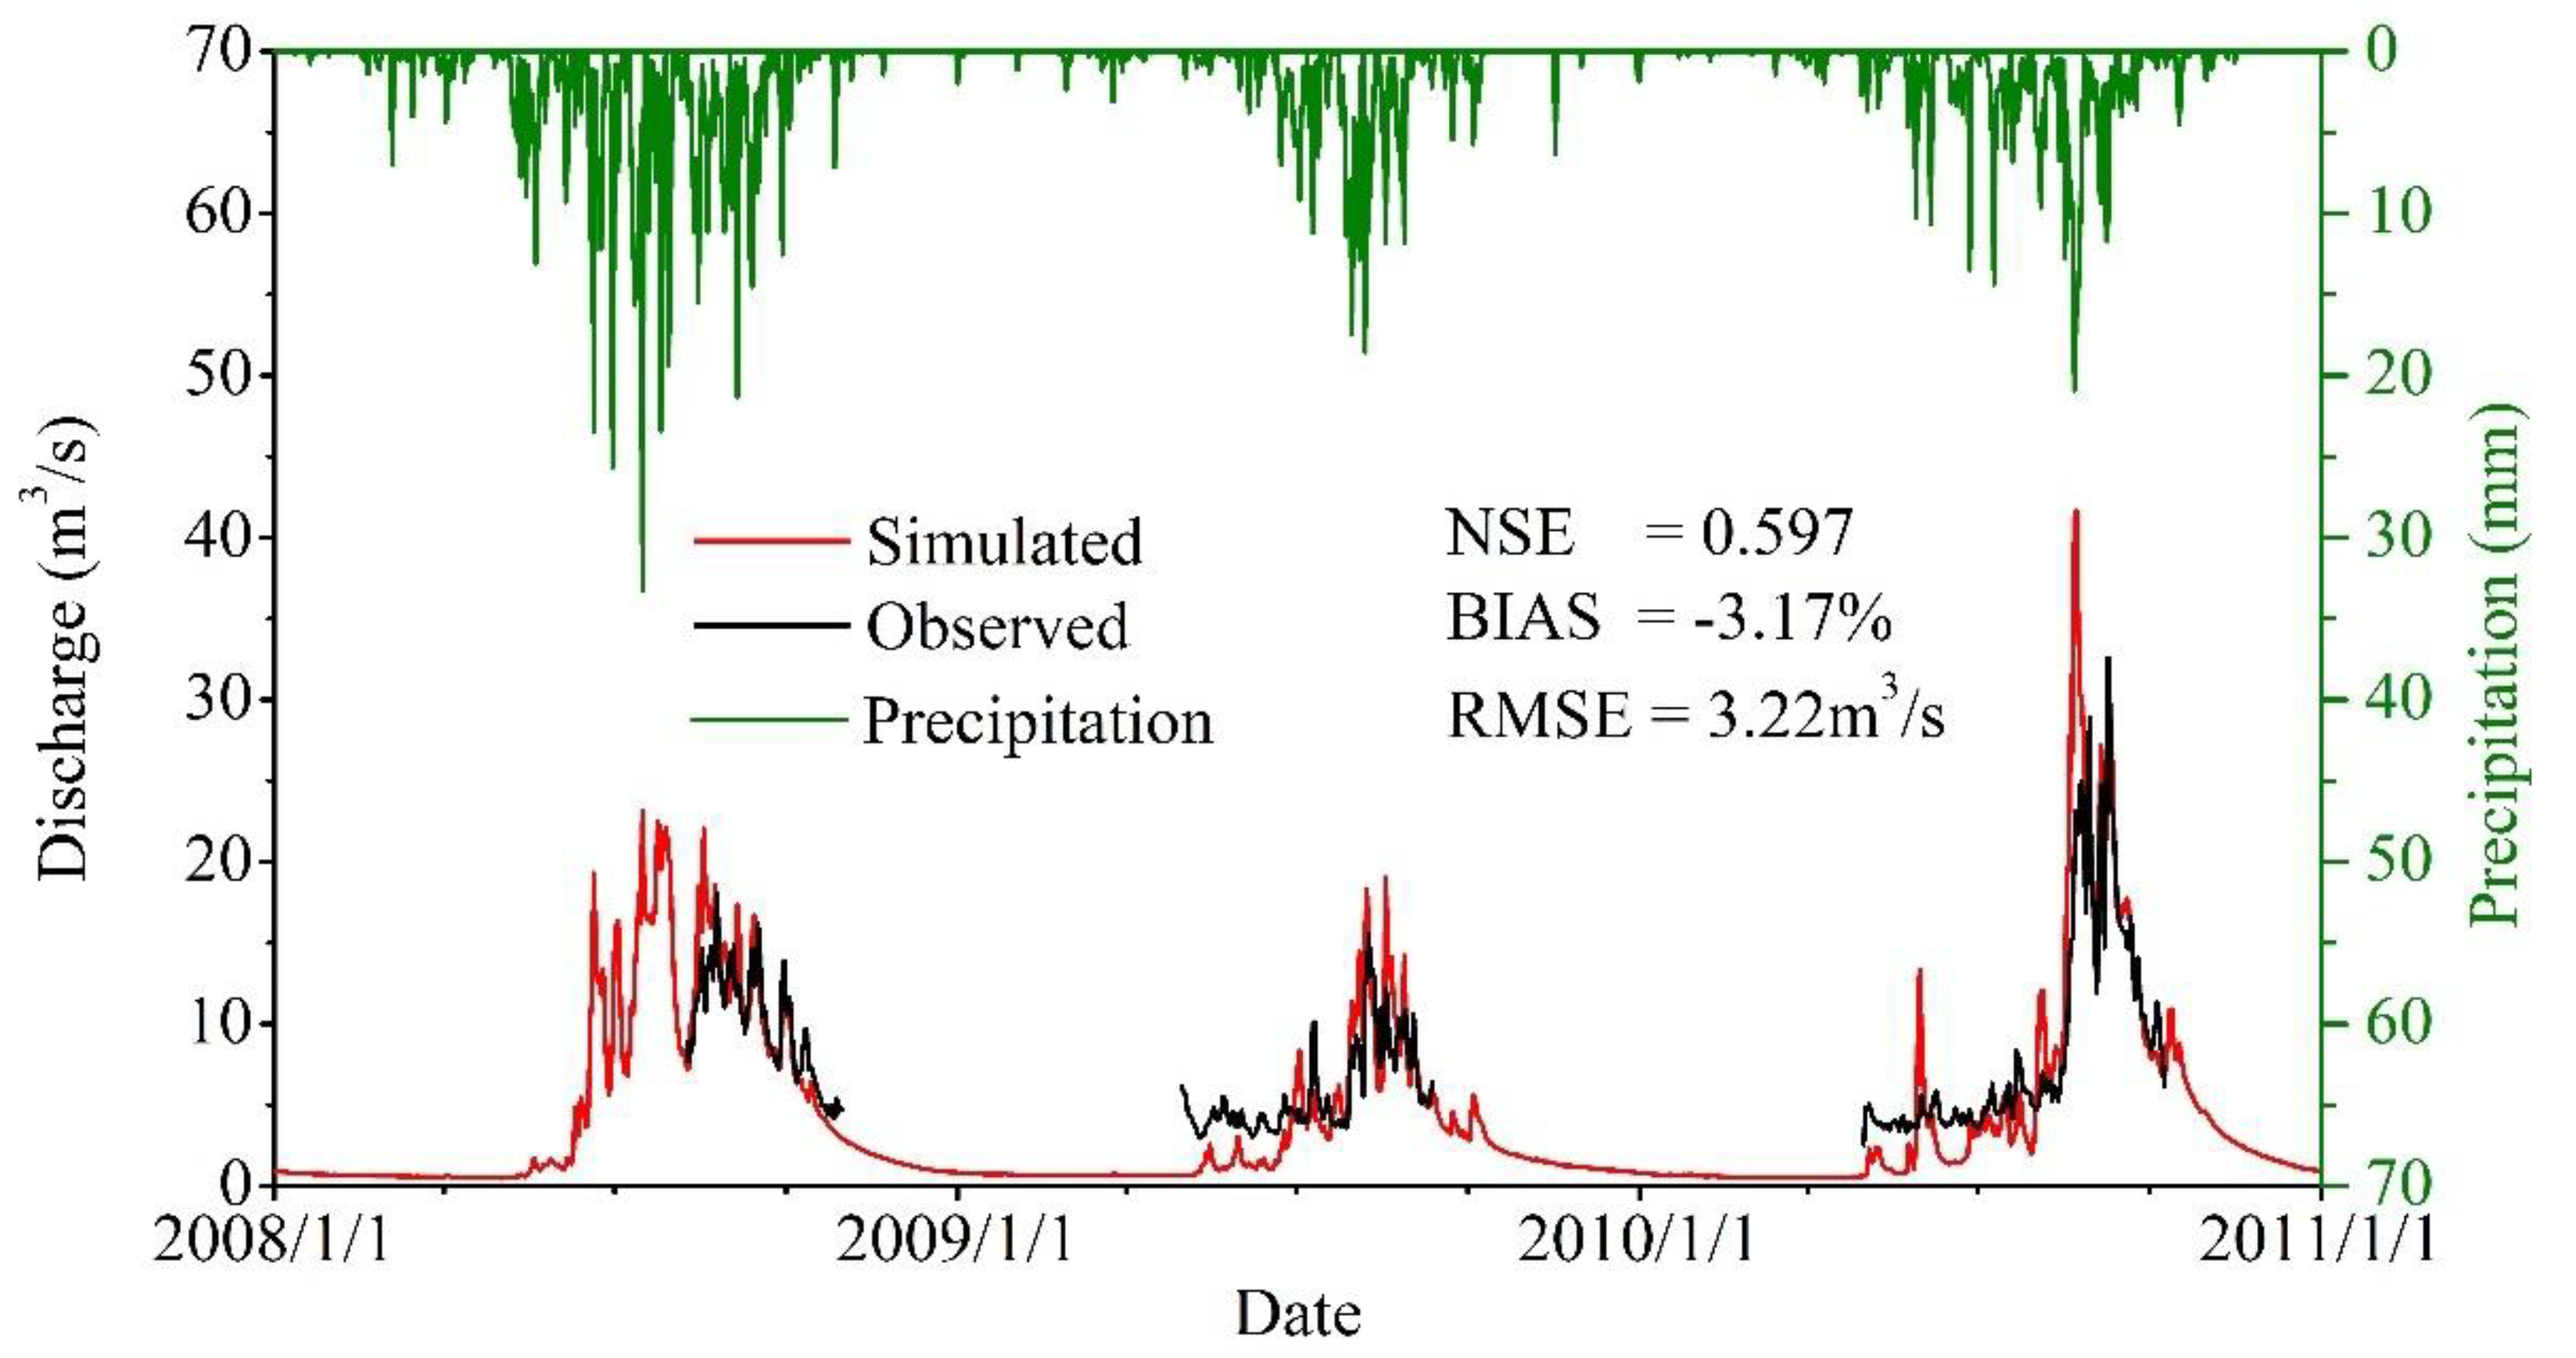
4.2.1. Evaluation with Discharge

After the precipitation correction, WEB-DHM was driven using the corrected CMFD data. The observed discharge of Niyaqu River was used to calibrate the hydraulic parameters in the model (saturated hydraulic conductivity of the soil surface, soil anisotropy coefficient, etc.). Then, the calibrated model was used to simulate the lake inflow of Nam Co from 1980 to 2016.
Figure 4 shows the simulated and observed runoff of Niyaqu River from 2008 to 2010, and the corresponding precipitation, indicating that the model could accurately reproduce the discharge: NSE, BIAS, and R2 were 0.597, −3.17%, and 3.22 m3/s, respectively.
The model slightly underestimated the discharge in Niyaqu station, especially during April to June. This may be due to uncertainty in the SOC data, which could influence modeled frozen soil processes in cold the season and subsequent runoff in early summer. Moreover, vertical heterogeneity in the soil could cause an underestimation of soil water content, which would also lead to an underestimation of the base flow [65].

4.2.2. Basin-Scale Evaluation with MODIS LST

We evaluated the model with MOSDIS LST at the basin scale from 2001 to 2016. The simulated LST and MODIS LST were compared both in daytime (10:30, local time) and night-time (22:30, local time), using both the basin average value and spatial pattern. A strict comparison approach was applied in this study: if a MODIS LST grid point was missing, the corresponding simulated LST for that grid point was removed from the calculation. Figure 5 compares the basin-averages and Figure 6 compares the spatial patterns. This comparison yielded respective daytime R2, BIAS, and RMSE values of 0.714, −1.39K, and 5.44K, and respective night-time values of 0.923, 3.26K, and 3.99K. Therefore, the average simulated daytime LST was closer to the MODIS LST than the average night-time simulated LST. R2 was smaller in the daytime but the RMSE was larger, indicating that the uncertainty in simulated daytime LST was larger than that at night-time. At night, solar radiation can be ignored, and the LST is mainly affected by the downward long wave radiation; consequently, both MODIS LST and simulated LST were close to the observed air temperature [61]. During the daytime, LST is controlled by solar radiation absorbed by the surface canopy and the ground, and these factors lead to greater uncertainty in the simulated daytime LST [65].
Figure 6 shows that the spatial pattern of simulated LST was very close to that of the MODIS LST. In the glacier-covered southeast region of the basin, the simulated LST was much lower than the MODIS LST, indicating that the simulation of ice and snow surface temperature still needs to be improved in the model. In other regions, the simulated LST was overestimated in the daytime in spring and summer, underestimated in winter, and overestimated in all four seasons at night-time. In general, WEB-DHM was able to accurately simulate the spatial pattern of LST.

4.2.3. Basin-Scale Evaluation with Snow Depth

We next compared the simulated snow depth with the SSM/I-derived snow depth from January 1988 to December 2007 as shown in Figure 7. The multi-year average simulated snow depth was 1.78 cm, which was greater than the corresponding 1.61 cm average SSM/I snow depth. In the time series, the simulated snow depth roughly reflected the interannual changes in the basin. No observed data were available for the evaluation or correction of precipitation data before 2005, which may lead to differences between the simulated snow depth and observations. In addition, the spatial resolution of the SSM/I snow depth was 25 km, which presents difficulties in reflecting the spatial heterogeneity of the snow distribution; this is particularly the case when the basin area is small, and the number of effective grid points in the basin is also small, thus contributing to the difference between simulation results and SSM/I snow depth.

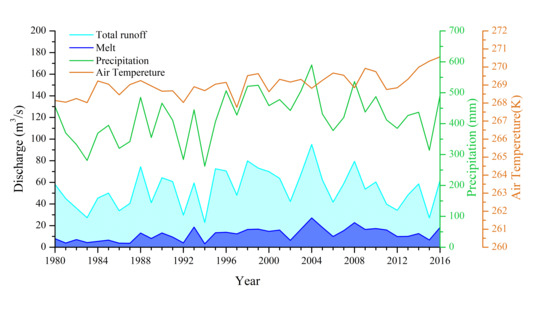
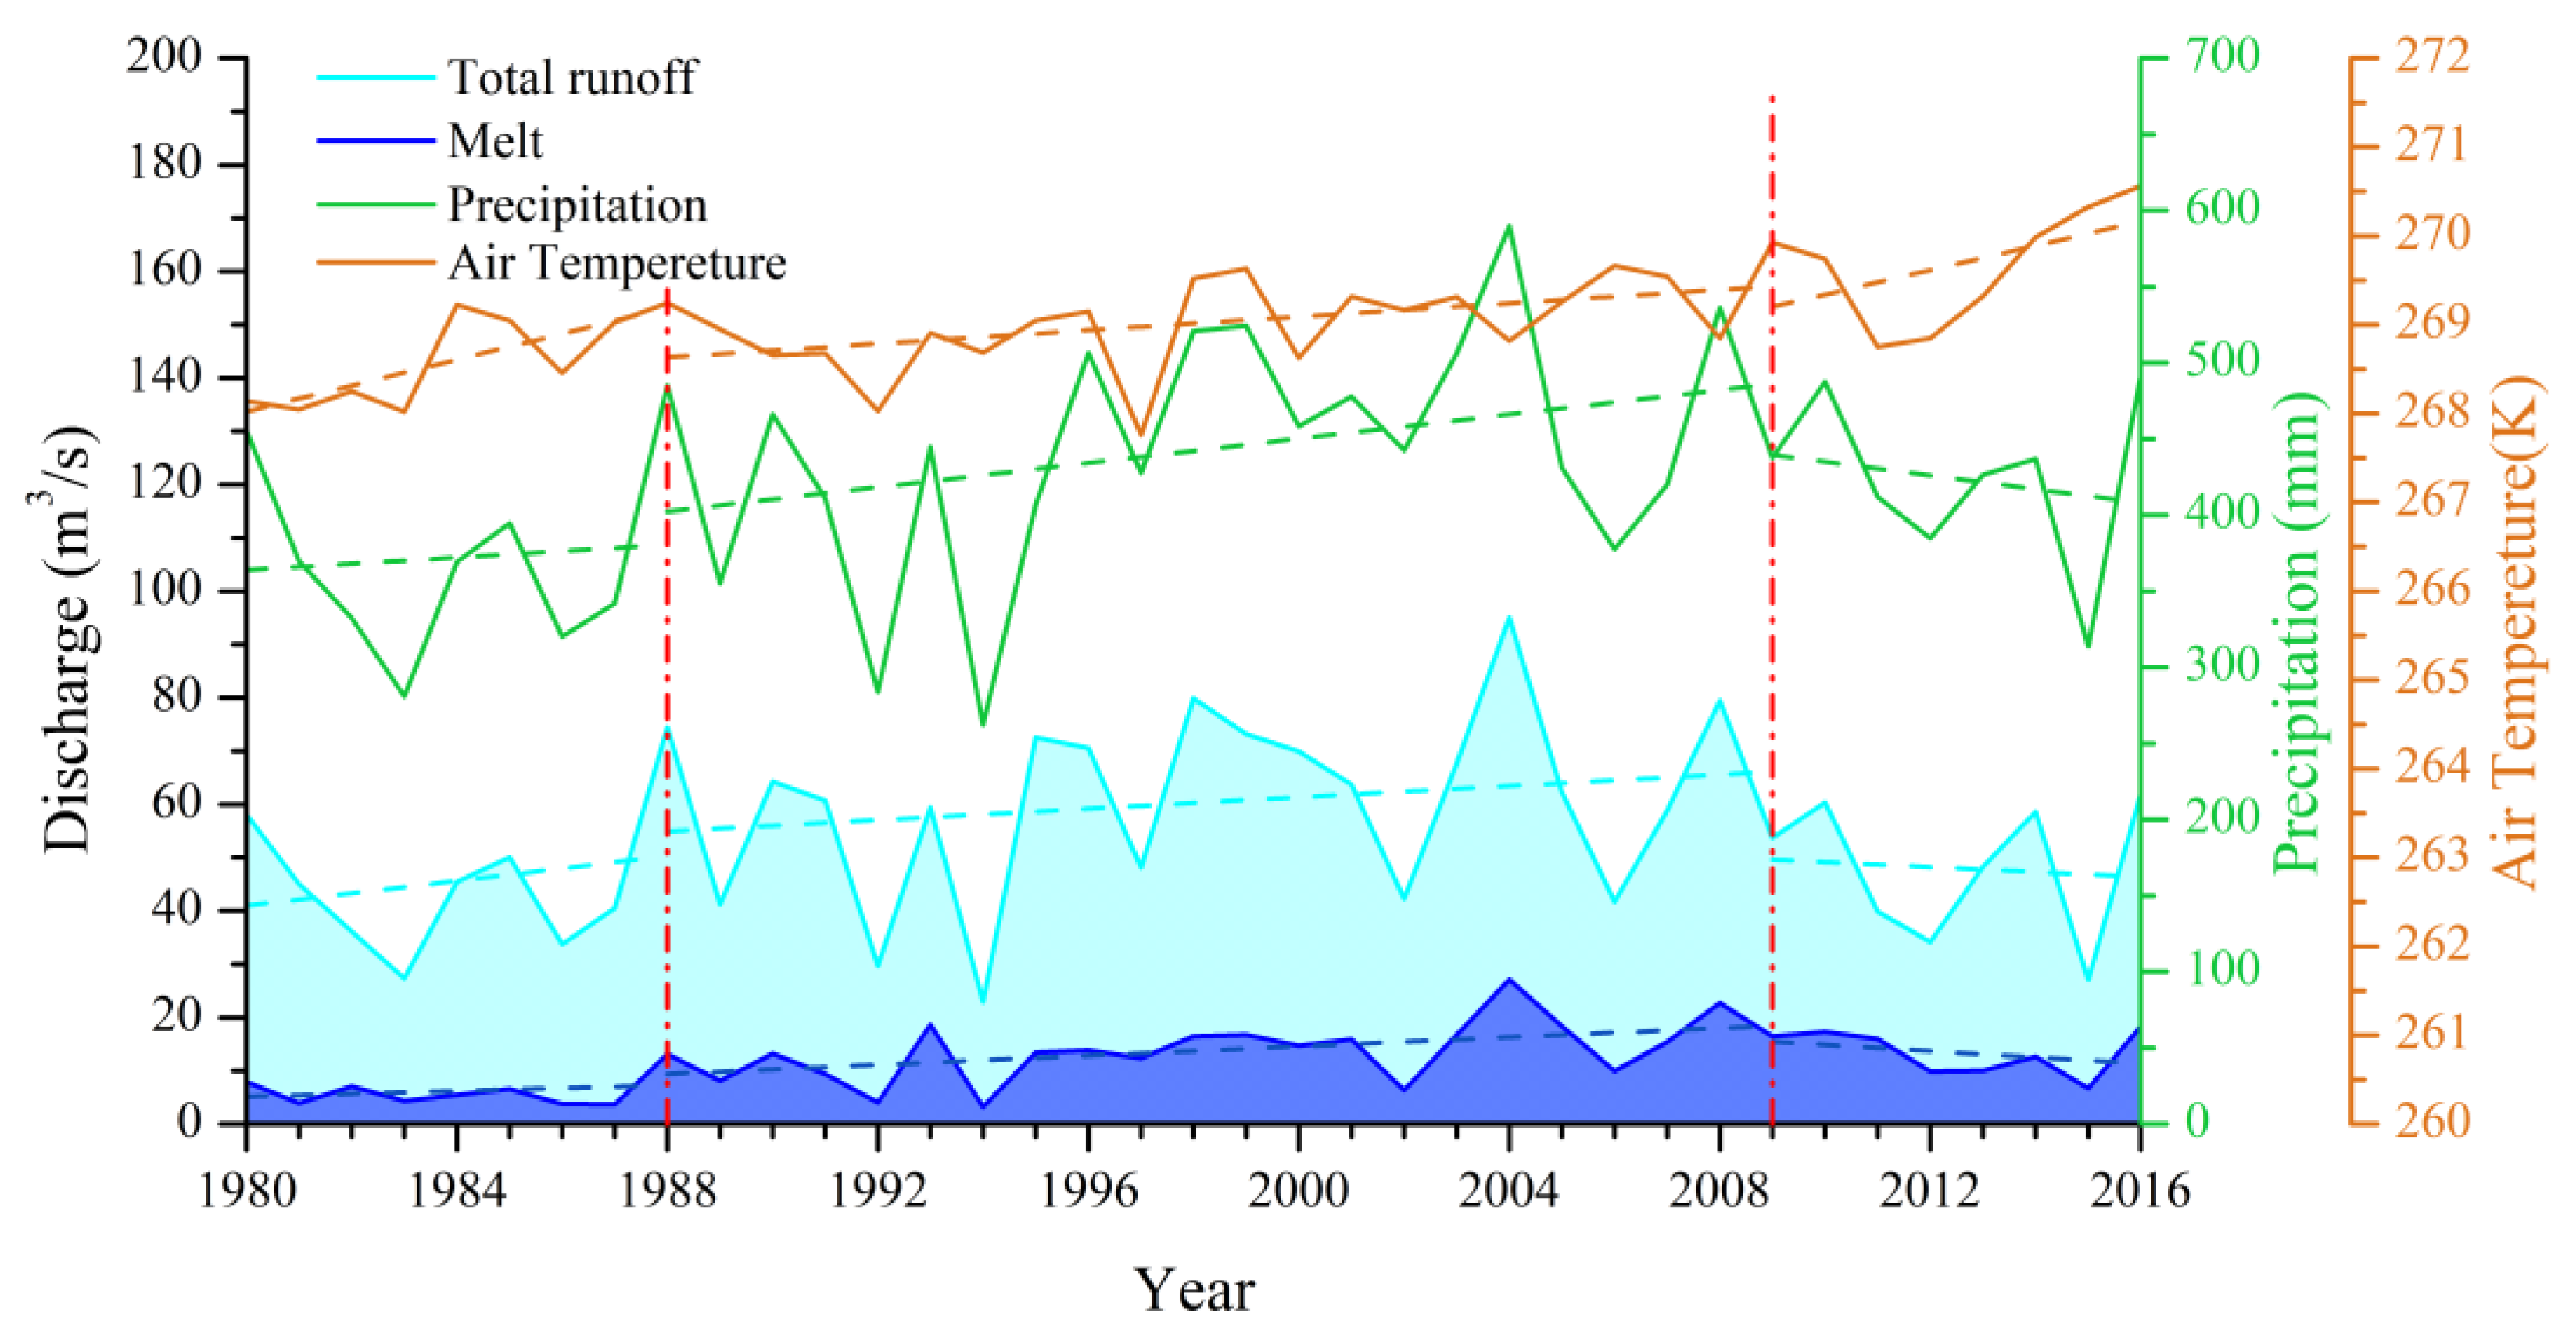
4.3. Variations of Major Water Balance Components

The change in LWS is calculated as:
Δ S = R in + P lake E lake
where Δ S represents the change in LWS; R in is the total lake inflow; P lake is precipitation over the lake surface and E lake is evaporation from the lake surface. The total area of the six simulated sub-basins accounts for 80.68% of the total basin area, so the total lake inflow is calculated as:
R in = i = 1 6 Q i / 80.68 %
where Q i is the simulated runoff in each sub-basin, and R in is the total lake inflow.
Figure 8 shows variations in the annual precipitation and evaporation across both the lake and land surfaces, along with total runoff and LWS, from 1980 to 2016. Figure 8a shows that the annual P land (421 ± 76 mm) in the basin significantly increased (p < 0.05), with a growth rate of 2.5 mm/year, while the annual P lake (415 ± 68 mm) decreased non-significantly by 0.684 mm/year. Figure 8b shows that annual E lake (1149 ± 71 mm) in the basin was significantly greater than E land (255 ± 21 mm); E lake increased non-significantly by 2.0 mm/year, and E land significantly increased by 1.2 mm/year. The R in (1.71 ± 0.54 km3) and Δ S (0.25 ± 0.66 km3) increased at rates of 0.0087 and 0.0018 km3/year, respectively, but neither was statistically significant.

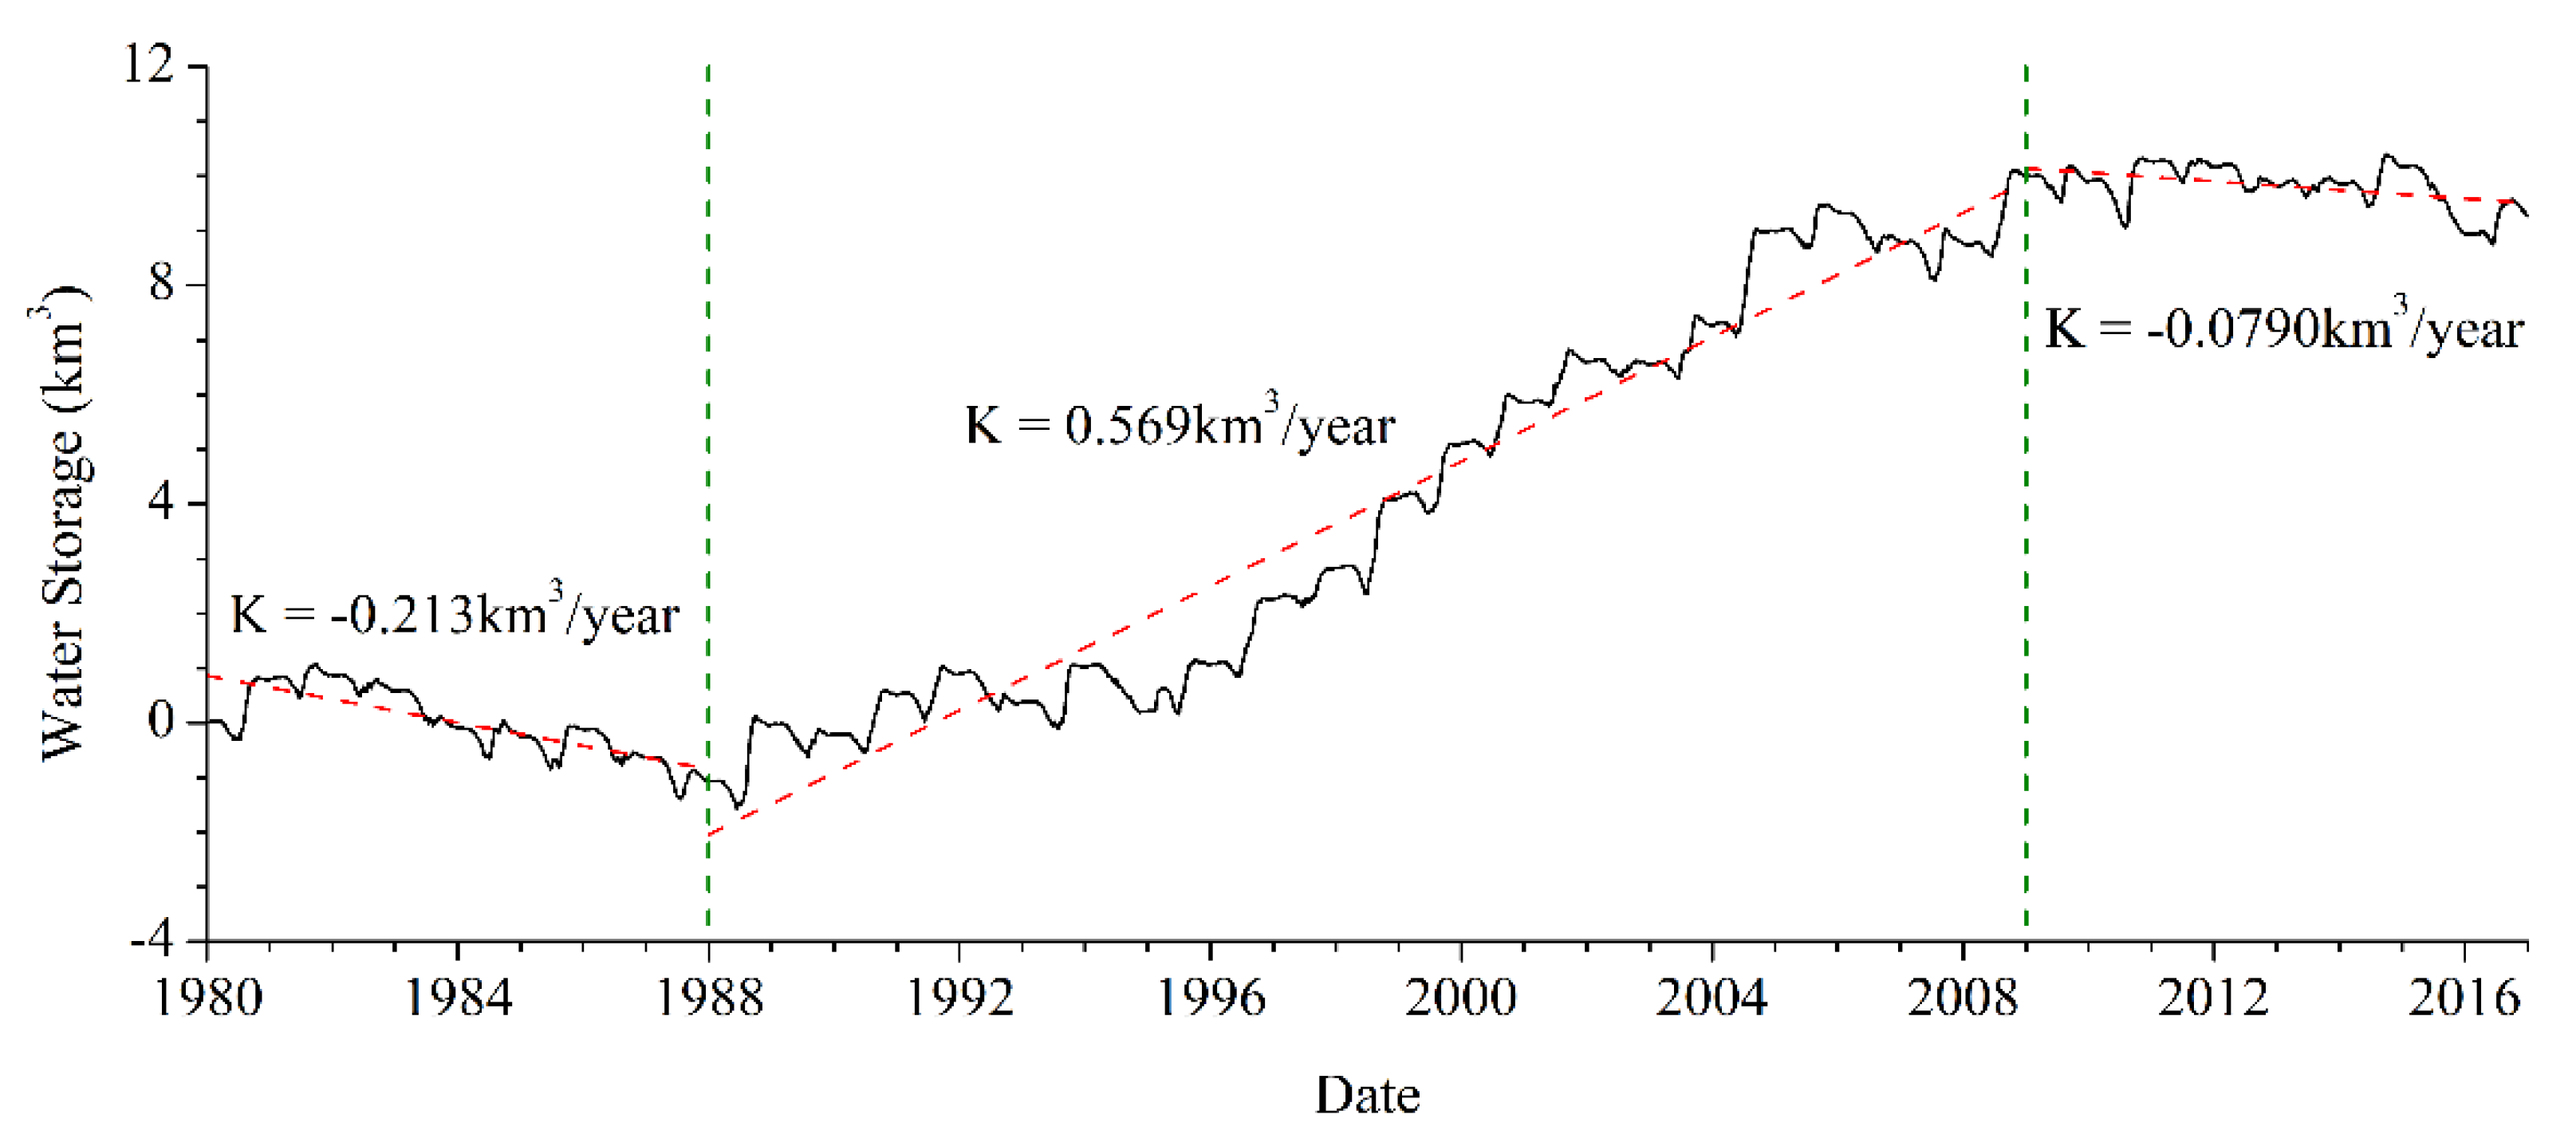
4.4. Long-Term Changes of Nam Co Lake Water Storage

Using Equation (8), we calculated the daily LWS of Nam Co from 1980 to 2016. We evaluated the calculated LWS for 2000–2016 by comparison with LWS data derived by Li et al. [46], in which changes are quoted relative to the LWS on 16 October 2000; this level was also used as a baseline for the simulated LWS in this study. Figure 9 shows that R2, BIAS, and RMSE were 0.878, −0.087 km3, and 0.459 km3, respectively, suggesting that the simulated results are in good agreement with the previous datasets, and that the simulated LWS was reliable.
Figure 10 shows the simulated long-term daily LWS from 1980 to 2016, in which the relative LWS was defined as zero on 1 January 1980. The results show that, from 1980 to 2016, the LWS of Nam Co increased by 9.26 km3 and reached a maximum of 10.25 km3 in 2010; these changes are very close to those found by Wu et al. [29], in which the water storage of Nam Co increased by 10.33 km3 from 1980 to 2010. In more detail: from 1980 to 2016, the LWS of Nam Co decreased at first (1980–1987: −0.21 km3/year), then increased (1988–2008: +0.57 km3/year) and has recently dropped again (2009–2016: −0.079 km3/year). Song et al. [31] detected that Nam Co has a rapid water-level rise during 2003–2008 and then a slightly decreasing trend during 2009–2013, which was in good agreement with the results of this study.
Attribution analysis was conducted in the three periods to study the contribution of precipitation runoff, melt water runoff, lake surface precipitation, and lake evaporation to the change of LWS. Table 2 shows the analysis results. Results shows that the precipitation runoff contributes most to LWS changes in all three periods among the four components, indicating that the water storage change in Nam Co was controlled by changes in precipitation.

5. Discussion

5.1. Uncertainty of Lake Surface Evaporation

Due to the lack of evaporation field observations, the Penman formula and CMFD were used to calculate the evaporation. Table 3 shows the results of some previous studies which calculated evaporation of Nam Co.
In this study, the lake surface evaporation (1149 ± 71 mm) in the basin showed an insignificant increasing trend of 1.985 mm/year, which is higher than the simulation results of Li et al. [30], Lazhu et al. [66], and Ma et al. [38]; lower than the results calculated by Zhu et al. [18] using the Penman formula; and very close to the results of Zhang et al. [17]. In this study, the average annual lake surface evaporation from May to January was 1028 ± 60 mm, which is close to the results of Wang et al. [67]; the evaporation from May to October was 883 ± 49 mm, which is higher than the results of Zhou et al. [20].
These differences may arise from uncertainties in the input forcing data, and (perhaps most importantly) from errors in the interpolation method associated with the resolution of the dataset. In addition, uncertainty in the estimated lake ice cover could influence the estimated lake evaporation in the unfrozen period. In this study, evaporation in the frozen period was estimated by combining open water evaporation and sublimation. Qu et al. [63] found that a small lake near Nam Co underwent both freeze-thaw and refreeze in 2008, which may have resulted in the estimated evaporation for the frozen period being greater than the actual evaporation. In addition, the heat storage changes can be a significant component of the energy balance in lakes, and it is important to account for heat storage changes for reasonable estimation of lake evaporation [68], but it was neglected because due to lack of water temperature data. In the future, additional lake ice and meteorological observations, as well as an improved method, are needed to achieve a more accurate estimate of lake evaporation.

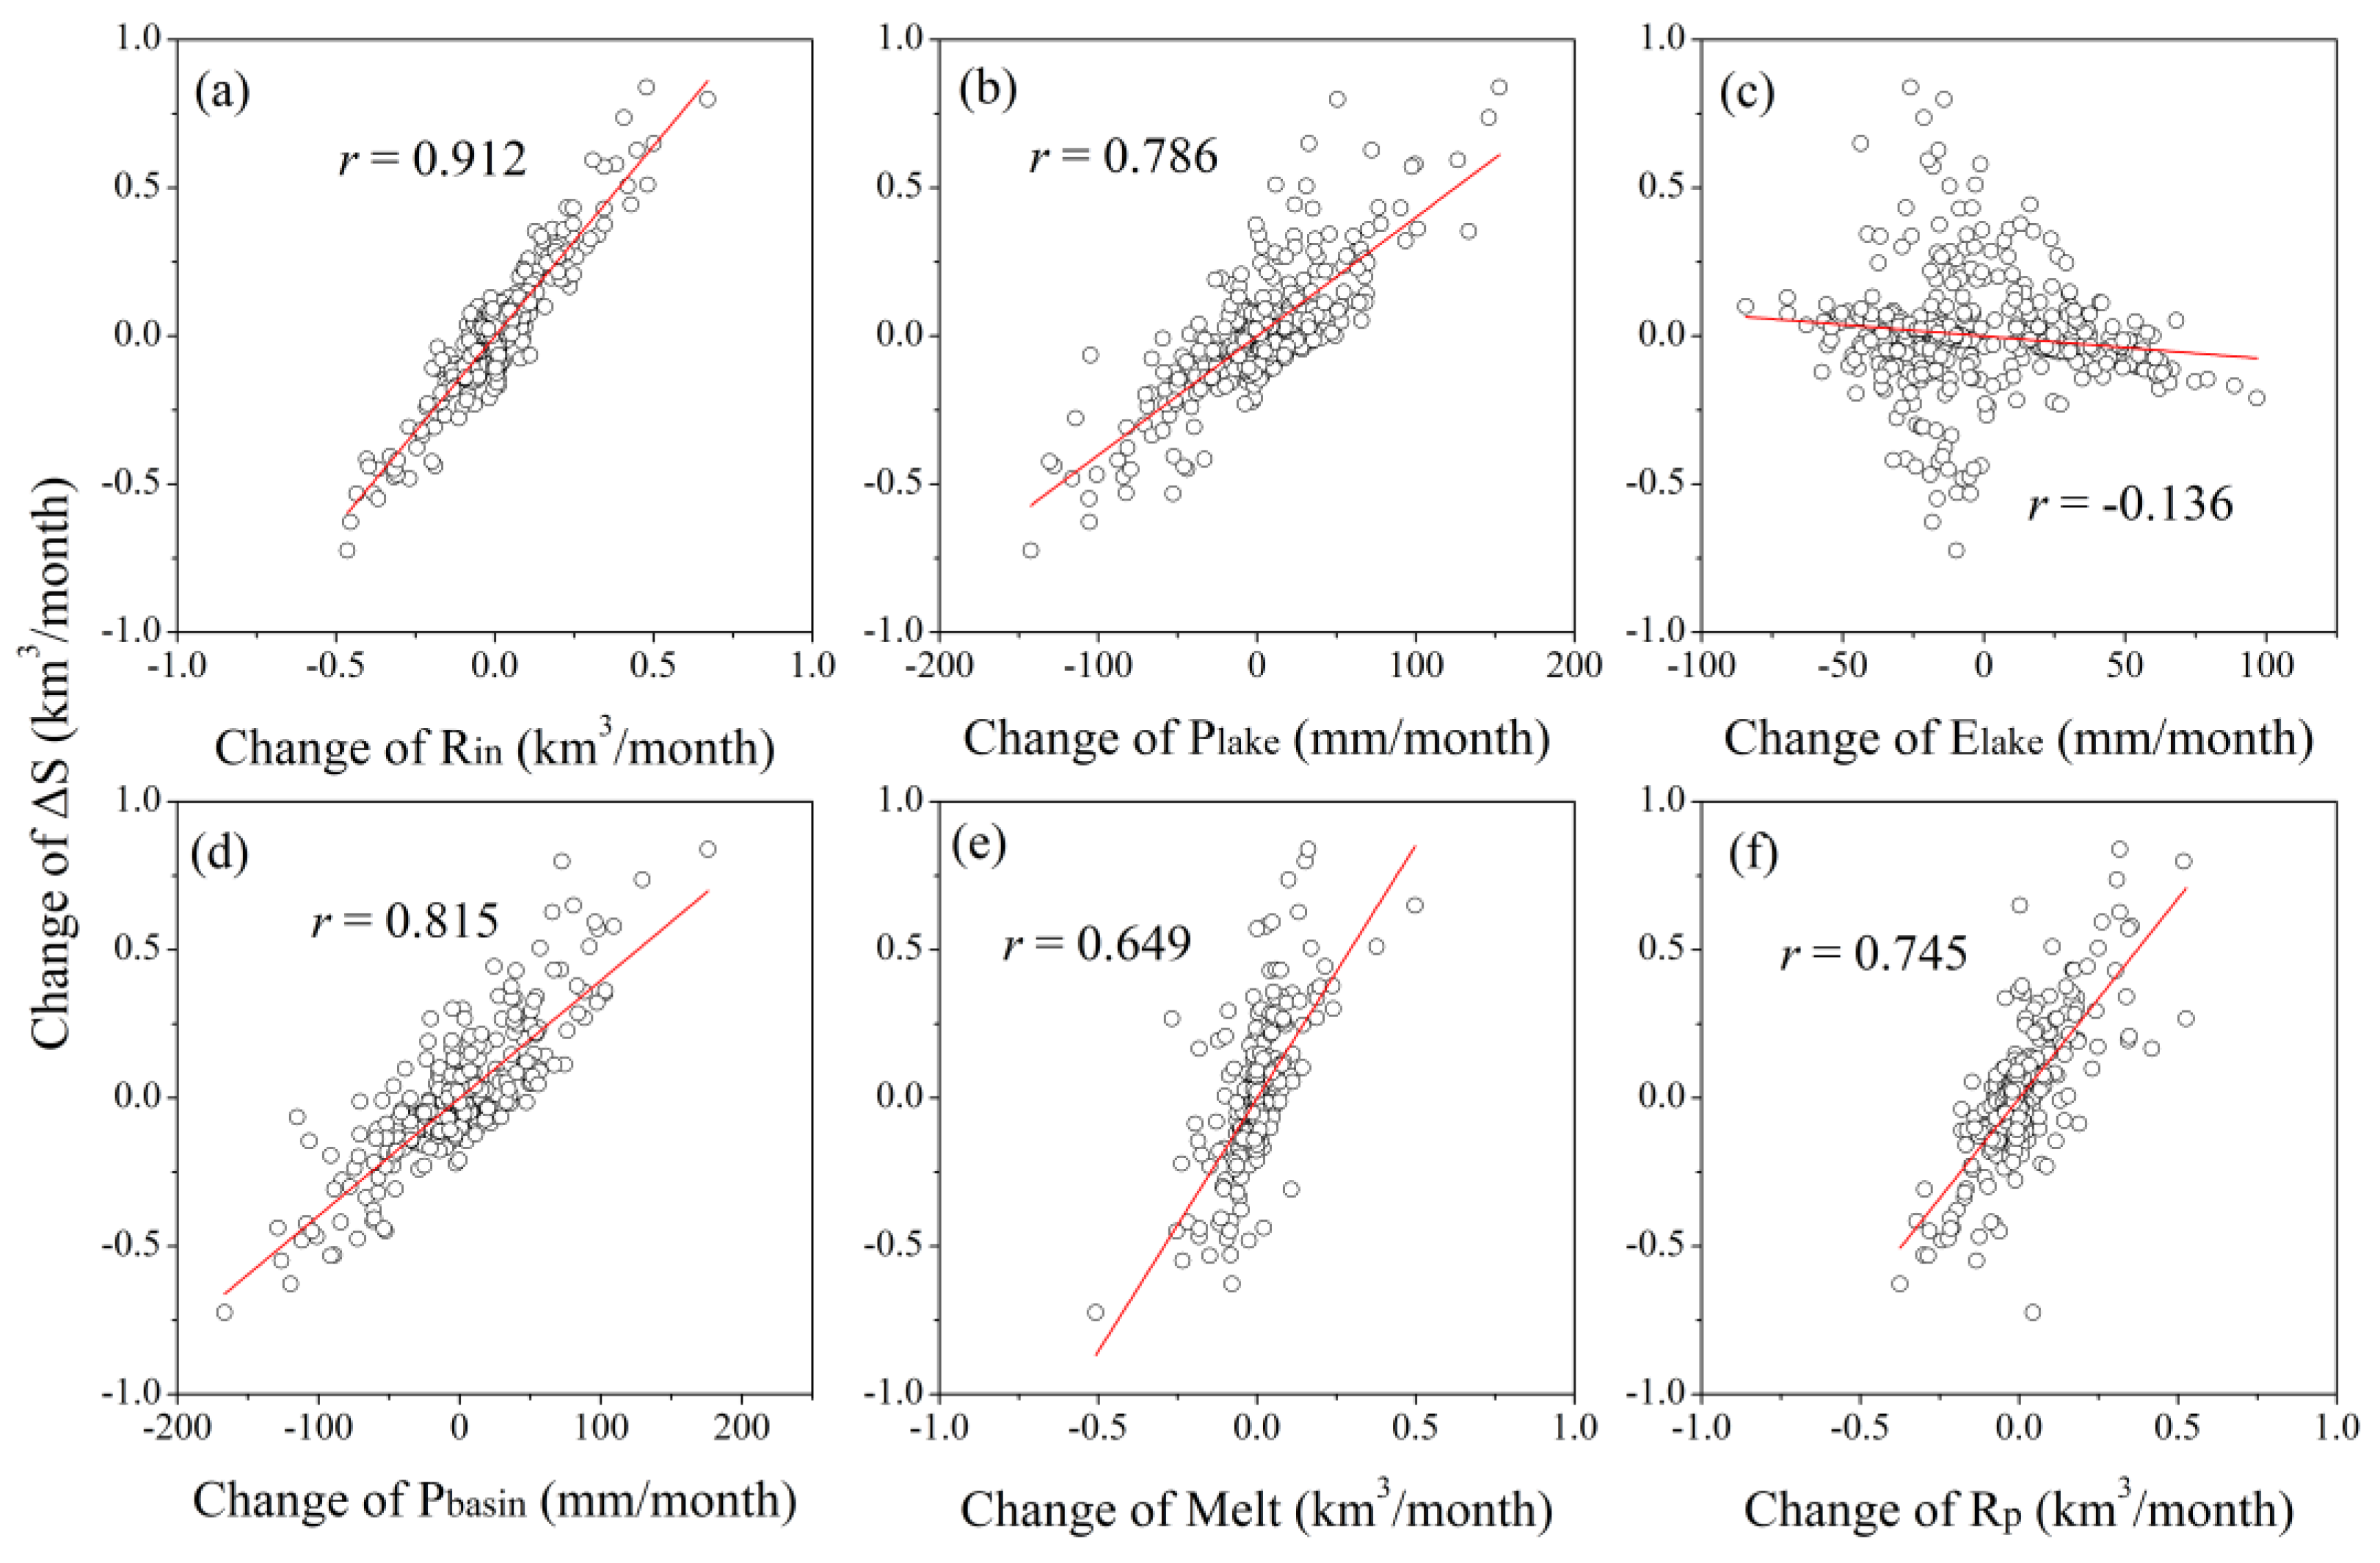
5.2. Uncertainty of Total Lake Inflows

Wu et al. [29] calculated an average annual runoff into the lake of 1.36 km3/year from 1980 to 2010, by applying a monthly water balance model based on the Budyko hypothesis. This is consistent with the average runoff into the lake from 1961 to 2015 obtained by Li et al. [30]. In this study, the average annual runoff into the lake from 1980 to 2016 was 1.71 km3/year, which is quite different. We note that Wu et al. [29] used the observed lake water level and simulated water level for verification, while in this study, we used the observed runoff directly for verification, which allowed a more reliable comparison. In addition, Table 2 shows that the evaporation rates simulated by Wu et al. and Li et al. are smaller than the evaporation estimated in this study, so the lake inflow was also smaller given a steady water storage. Zhu et al. [18] estimated the surface runoff of Nam Co from 1971 to 1991 as 1.064 km3/year, and from 1992 to 2004 as 1.122 km3/year. Besides surface runoff and lake surface precipitation, Zhu et al. [18] reported groundwater inputs and other sources of water input of 0.845 and 0.846 km3/year respectively. The differences in results between this study and that of Zhu et al. [18] may be attributed to the different calculation methods. Zhu et al. [18] used an empirical method based on runoff depth; meanwhile, in this study, we used a calibrated hydrological model for the simulation.
Uncertainties in the runoff simulation may be associated with the following factors. First, the precipitation forcing data were corrected by meteorological data observed in 2005–2015. For earlier historical periods, uncertainty in the forcing data will introduce uncertainty in the runoff simulation. Secondly, the glaciers on Tibetan Plateau play an important role in the catchment hydrology of this region [69]. In the current WEB-DHM version, glaciers are treated as thick snow (greater than 100 m) to simulate glacial melting; here, the energy balance is considered but the spatial distributions of some physical attributes such as ice thickness are not considered, which will lead to uncertainties in the glacier melt simulation that propagate through to the basin runoff simulation. In addition, aspect distribution is of great importance for modelling the hydrological response in glacier catchment [70]. In the future, WEB-DHM needs to be coupled with a more detailed physical glacier model. Finally, the total lake inflow was calculated by Equation (9). According to the simulation results, the annual average runoff depths from each sub-basin were 168, 193, 191, 176, 204, 188, and 306 mm, respectively, indicating that although the runoff depths in most areas of the basin were similar, some spatial differences are present. The calculation of total lake inflow with Equation (9) will also introduce uncertainty into the total lake inflow.

5.3. The Contributions of Precipitation, Snow and Glacier Melt to the Discharge

Previous studies have suggested that ice and snow melt water has had an important impact on the expansion of Nam Co. Zhu et al. [18] reported that the increasing LWS in Nam Co Lake was mainly caused by the increase of melt water input from the retreating of glaciers. Wu et al. [29] found that the contribution of glacial melt water to the rising lake level was 20.75%, equivalent to +5.93 m of lake level rise. The contributions of runoff, glacial melt, lake surface precipitation, leakage, and lake evaporation were 104.7%, 56.6%, 41.7%, −22.2%, and −80.9%, respectively.
With the help of the WEB-DHM model, we separated the glacier and snow melt water components in the total lake inflow. The total melt water was also calculated according to Equation (9), that is to say, the proportions of the melt water components in the total lake inflow were the same as those in the total runoff from the six sub-basins. Figure 11 shows the simulated annual total lake inflow, melt water runoff, average precipitation, and average temperature in the basin in three periods that LWS changes. Table 4 shows the changing rates in different periods. Results indicate that the total lake inflow, snow and glacier melt, precipitation, and air temperature has increased during 1980–2009, but insignificantly decreased in 2009–2016 except air temperature, indicating that the peak of melt might have occurred.
Figure 12 shows the annual fraction of snow and glacier melt in lake inflow. Results shows that the annual mean contribution of melt water runoff to the total lake inflow was 22% and the contribution has a significant increasing trend (0.5%/year) overall. It should be noticed that the contribution shows an insignificant decreasing trend after 2009. These results show that the runoff generated by the precipitation plays a major role in the lake inflow, and while the contribution of precipitation runoff to the total lake inflow has decreased, the contribution of ice and snow melt to the lake inflow has increased.

5.4. Impact of Climate Change

Long-term changes in Nam Co LWS have been significantly affected by climate change in the basin. During 1980–2016, the annual average precipitation and annual average temperature in the basin (Figure 11) showed significant increasing trends, at rates of 25 mm/decade and 0.4 K/decade, respectively. As the temperature increased, Figure 8b shows that the lake evaporation and land evaporation in the basin also increased. There is a significant positive correlation between lake evaporation and annual average temperature of the basin (R2 = 0.57), indicating that the increasing temperature could cause more water loss from the lake.
Precipitation falls directly on the lake surface, but also affects LWS via surface runoff. Li et al. [30] reported that the lake surface precipitation and total runoff accounted for 34% and 66% of the water supply of Nam Co, respectively. In the present study, the annual average runoff, precipitation, and evaporation of Nam Co during the study period were 1.71, 0.83, and 2.29 km3/year, respectively. The precipitation runoff, ice and snow melt, and lake precipitation accounted for 53%, 15%, and 33% of the total supply of the lake, respectively. The contribution of lake precipitation to the total water input was very close to that calculated by Li et al. [30]. There was a strong positive correlation between the annual average precipitation and the annual total runoff or annual water reserves (R2 values of 0.842 and 0.806, respectively), and the precipitation runoff accounted for 53% of the total water input. We analyzed the relationship between the change of Δs and other variables changes as shown in Figure 13. The change of total lake inflow has strongest correlation with the change of Δs (with r = 0.912). Runoff generated by the precipitation plays a major role in the lake inflow (fraction of ice and snow melt is 22%), and precipitation runoff shows a stronger correlation than ice and snow melt, the change of precipitation also shows a strong correlation with the change of Δs. These results indicate that the LWS change of Nam Co was largely controlled by precipitation change.
Attribution analysis revealed that from 1980 to 2016, the contributions of precipitation runoff, melt water runoff, lake surface precipitation, and lake evaporation to the changes in Nam Co LWS were 71%, 33%, 24%, and −28%, respectively. Wu et al. [22] suggested that the contribution of glacier melt to the rising water level was 20.75%, which is smaller than the contribution calculated in this study. Therefore, precipitation is the main contributor of water to Nam Co, and changes in lake water inputs are primarily controlled by changes in precipitation.

6. Conclusions

In this study we simulated the long-term (1980–2016) changes in Nam Co LWS using WEB-DHM, a process-based cryosphere-hydrology model. WEB-DHM was calibrated and validated by the observed discharge, MODIS LST and snow depth, demonstrating its good performance in reproducing the land surface water and energy cycles in the lake basin. Lake evaporation was calculated by the Penman formula and estimated sublimation, and by considering the unfrozen and frozen periods of the lake surface. The simulated daily LWS was in good agreement with the datasets derived from remote sensing images. This method for simulated the daily LWS change could be extrapolated to other lake basins in the world as long as discharge data and reliable meteorological forcing data were available.
The lake surface evaporation (1149 ± 71 mm) showed an insignificant increasing trend of 1.99 mm/year. The LWS of Nam Co increased by 9.26 km3 from 1980 to 2016, with the maximum LWS recorded in 2010 (an increase of 10.25 km3 relative to the LWS in 1980). The annual average contribution of melt water runoff to the total lake input was 22%, and showed a significant increasing trend (0.5%/year). The melt and its contribution to the total lake inflow both show an insignificant decline after 2009 indicating that the peak of melt might have occurred. These results reveal that the runoff generated by precipitation was the primary contributor to total runoff into the lake; however, this contribution has decreased, while the contribution from ice and snow melt has increased. Precipitation runoff, ice and snow melt, and lake precipitation accounted for 53%, 15%, and 33% of the total water supply to the lake, respectively. The contributions of precipitation runoff, melt water runoff, lake surface precipitation, and lake evaporation to the changes in Nam Co LWS were 71%, 33%, 24%, and −28%, respectively. Therefore, precipitation is still the dominant source of water for Nam Co Lake. It can be concluded that the long-term LWS variations of Nam Co during 1980–2016 were largely controlled by changes in precipitation, accompanied by warming-induced intensified melting of snow and glaciers.

Author Contributions

Conceptualization, L.W. and X.Z.; Data curation, X.Z., J.Z., X.L., J.Q., L.S., and Y.W.; Formal analysis, X.Z.; Funding acquisition, L.W. and J.Z.; Methodology, X.Z., L.W., and J.Z.; Project administration, L.W.; Resources, L.W.; Software, X.Z., J.Z., X.L., J.Q., L.S., and Y.W.; Supervision, L.W.; Validation, X.Z.; Visualization, X.Z.; Writing—original draft, X.Z.; Writing—review and editing, L.W., J.Z., and X.L. All authors have read and agreed to the published version of the manuscript.

Funding

This research was financially supported by the “Strategic Priority Research Program” of the Chinese Academy of Sciences (XDA19070301 and XDA20060202) and the Second Tibetan Plateau Scientific Expedition and Research Program (STEP) (2019QZKK020604). Jing Zhou was supported by the National Natural Science Foundation of China (41771089)

Acknowledgments

We would like to thank the Nam Co Monitoring and Research Station for Multisphere Interactions for the Niyaqu Station discharge data. The observed meteorological data and CMFD data were provided by National Tibetan Plateau Data Center (https://data.tpdc.ac.cn). The other data used in this study were obtained from the following sources: SRTM DEM (http://srtm.csi.cgiar.org), land use data (USGS, http://edc2.usgs.gov/glcc/glcc.php), soil data (FAO, http://www.fao.org/geonetwork/srv/en/main.home), SOC data (http://soilgrids.org), glacier and snow depth data (Cold and Arid Regions Science Data Center at Lanzhou, http://westdc.westgis.ac.cn), GLDAS, TRMM, MERRA2, and MODIS LST (NASA, https://search.earthdata.nasa.gov/search).

Conflicts of Interest

The authors declare no conflict of interest.

References

  1. Molden, D.; Shrestha, A.B.; Nepal, S.; Immerzeel, W. Downstream Implications of Climate Change in the Himalayas. In Water Resources Development and Management; Springer Science and Business Media LLC: Berlin, Germany, 2015; pp. 65–82. [Google Scholar]
  2. Immerzeel, W.; Van Beek, L.P.H.; Bierkens, M.F.P. Climate Change Will Affect the Asian Water Towers. Science 2010, 328, 1382–1385. [Google Scholar] [CrossRef] [PubMed]
  3. Zhang, H. Remote Sensing Based Hydrological Dynamic Analysis of Lake in Tibetan Plateau and its Response to Climate Change. Master’s Thesis, Liaocheng University, Liaocheng, China, 2018. (In Chinese). [Google Scholar]
  4. Song, C.; Huang, B.; Ke, L.; Richards, K.S. Seasonal and abrupt changes in the water level of closed lakes on the Tibetan Plateau and implications for climate impacts. J. Hydrol. 2014, 514, 131–144. [Google Scholar] [CrossRef]
  5. Yang, K.; Ye, B.; Zhou, D.; Wu, B.; Foken, T.; Qin, J.; Zhou, Z. Response of hydrological cycle to recent climate changes in the Tibetan Plateau. Clim. Chang. 2011, 109, 517–534. [Google Scholar] [CrossRef]
  6. Yao, T.; Pu, J.; Lu, A.; Wang, Y.; Yu, W. Recent Glacial Retreat and Its Impact on Hydrological Processes on the Tibetan Plateau, China, and Surrounding Regions. Arct. Antarct. Alp. Res. 2007, 39, 642–650. [Google Scholar] [CrossRef] [Green Version]
  7. Song, C.; Huang, B.; Ke, L. Modeling and analysis of lake water storage changes on the Tibetan Plateau using multi-mission satellite data. Remote Sens. Environ. 2013, 135, 25–35. [Google Scholar] [CrossRef]
  8. Lei, Y.; Yang, K.; Wang, B.; Sheng, Y.; Bird, B.W.; Zhang, G.; Tian, L. Response of inland lake dynamics over the Tibetan Plateau to climate change. Clim. Chang. 2014, 125, 281–290. [Google Scholar] [CrossRef]
  9. Song, C.; Huang, B.; Ke, L. Heterogeneous change patterns of water level for inland lakes in High Mountain Asia derived from multi-mission satellite altimetry. Hydrol. Process. 2014, 29, 2769–2781. [Google Scholar] [CrossRef]
  10. Phan, V.; Lindenbergh, R.C.; Menenti, M. ICESat derived elevation changes of Tibetan lakes between 2003 and 2009. Int. J. Appl. Earth Obs. Geoinf. 2012, 17, 12–22. [Google Scholar] [CrossRef]
  11. Zhang, G.; Xie, H.; Yao, T.; Kang, S. Water balance estimates of ten greatest lakes in China using ICESat and Landsat data. Chin. Sci. Bull. 2013, 58, 3815–3829. [Google Scholar] [CrossRef] [Green Version]
  12. Zhang, G. Changes in lakes on the Tibetan Plateau observed from satellite data and their responses to climate variations. Adv. Earth Sci. 2018, 37, 214–223. (In Chinese) [Google Scholar]
  13. Wu, Y.; Zhu, L. The response of lake-glacier variations to climate change in Nam Co Catchment, central Tibetan Plateau, during 1970–2000. J. Geogr. Sci. 2008, 18, 177–189. [Google Scholar] [CrossRef]
  14. Kropacek, J.; Braun, A.; Kang, S.; Feng, C.; Ye, Q.; Hochschild, V. Analysis of lake level changes in Nam Co in central Tibet utilizing synergistic satellite altimetry and optical imagery. Int. J. Appl. Earth Obs. Geoinf. 2012, 17, 3–11. [Google Scholar] [CrossRef]
  15. Liu, J.; Kang, S.; Gong, T.; Lu, A. Growth of a high-elevation large inland lake, associated with climate change and permafrost degradation in Tibet. Hydrol. Earth Syst. Sci. 2010, 14, 481–489. [Google Scholar] [CrossRef] [Green Version]
  16. Lei, Y.; Yao, T.; Bird, B.W.; Yang, K.; Zhai, J.; Sheng, Y. Coherent lake growth on the central Tibetan Plateau since the 1970s: Characterization and attribution. J. Hydrol. 2013, 483, 61–67. [Google Scholar] [CrossRef]
  17. Zhang, B.; Wu, Y.; Zhu, L.; Wang, J.; Li, J.; Chen, N. Estimation and trend detection of water storage at Nam Co Lake, central Tibetan Plateau. J. Hydrol. 2011, 405, 161–170. [Google Scholar] [CrossRef]
  18. Zhu, L.; Xie, M.; Wu, Y. Quantitative analysis of lake area variations and the influence factors from 1971 tom 2004 in the Nam Co basin of the Tibetan Plateau. Chin. Sci. Bull. 2010, 55, 1294–1303. (In Chinese) [Google Scholar] [CrossRef]
  19. Ma, Y.; Yi, C.; Wu, J. Lake Surface Expansion of Nam Co during 19702009: Evidence of Satellite Remote Sensing and Cause Analysis. J. Glaciol. Geocryol. 2012, 34, 81–88. (In Chinese) [Google Scholar]
  20. Zhou, S.; Kang, S.; Chen, F.; Joswiak, D.R. Water balance observations reveal significant subsurface water seepage from Lake Nam Co, south-central Tibetan Plateau. J. Hydrol. 2013, 491, 89–99. [Google Scholar] [CrossRef]
  21. Du, Y.; Huang, Z.; Xie, M.; Farooq, A.; Chen, C. Temporal Variations in the Quantity of Groundwater Flow in Nam Co Lake. Water 2018, 10, 941. [Google Scholar] [CrossRef] [Green Version]
  22. Wu, H.; Wang, N.; Jiang, X.; Guo, Z. Variations in water level and glacier mass balance in Nam Co lake, Nyainqentanglha range, Tibetan Plateau, based on ICESat data for 2003-09. Ann. Glaciol. 2014, 55, 239–247. [Google Scholar] [CrossRef] [Green Version]
  23. Gao, T.; Kang, S.; Krause, P.; Cuo, L.; Nepal, S. A test of J2000 model in a glacierized catchment in the central Tibetan Plateau. Environ. Earth Sci. 2011, 65, 1651–1659. [Google Scholar] [CrossRef]
  24. Krause, P.; Biskop, S.; Helmschrot, J.; Flügel, W.-A.; Kang, S.; Gao, T. Hydrological system analysis and modelling of the Nam Co basin in Tibet. Adv. Geosci. 2010, 27, 29–36. [Google Scholar] [CrossRef] [Green Version]
  25. Adnan, M.; Kang, S.; Zhang, G.; Saifullah, M.; Anjum, M.N.; Ali, A.F. Simulation and Analysis of the Water Balance of the Nam Co Lake Using SWAT Model. Water 2019, 11, 1383. [Google Scholar] [CrossRef] [Green Version]
  26. Tanguang, G.; Shichang, K.; Cuo, L.; Tingjun, Z.; Guoshuai, Z.; Yulan, Z.; Sillanpää, M. Simulation and analysis of glacier runoff and mass balance in the Nam Co basin, southern Tibetan Plateau. J. Glaciol. 2015, 61, 447–460. [Google Scholar] [CrossRef]
  27. Gao, T.; Kang, S.; Zhang, T.; Zhou, S.; Cuo, L.; Sillanpää, M.; Zhang, Y. Summer hydrological characteristics in glacier and non-glacier catchments in the Nam Co Basin, southern Tibetan Plateau. Environ. Earth Sci. 2015, 74, 2019–2028. [Google Scholar] [CrossRef]
  28. Zhang, G.; Kang, S.; Cuo, L.; Qu, B. Modeling hydrological process in a glacier basin on the central Tibetan Plateau with a distributed hydrology soil vegetation model. J. Geophys. Res. Atmos. 2016, 121, 9521–9539. [Google Scholar] [CrossRef] [Green Version]
  29. Wu, Y.; Zheng, H.; Zhang, B.; Chen, D.; Lei, L. Long-Term Changes of Lake Level and Water Budget in the Nam Co Lake Basin, Central Tibetan Plateau. J. Hydrometeorol. 2014, 15, 1312–1322. [Google Scholar] [CrossRef]
  30. Li, B.; Zhang, J.; Yu, Z.; Liang, Z.; Chen, L.; Acharya, K. Climate change driven water budget dynamics of a Tibetan inland lake. Glob. Planet. Chang. 2017, 150, 70–80. [Google Scholar] [CrossRef]
  31. Song, C.; Ye, Q.; Cheng, X. Shifts in water-level variation of Namco in the central Tibetan Plateau from ICESat and CryoSat-2 altimetry and station observations. Sci. Bull. 2015, 60, 1287–1297. [Google Scholar] [CrossRef] [Green Version]
  32. Wang, L.; Koike, T.; Yang, K.; Jackson, T.J.; Bindlish, R.; Yang, D. Development of a distributed biosphere hydrological model and its evaluation with the Southern Great Plains Experiments (SGP97 and SGP99). J. Geophys. Res. Space Phys. 2009, 114, 08107. [Google Scholar] [CrossRef] [Green Version]
  33. Wang, L.; Koike, T.; Yang, K.; Yeh, P.J.-F. Assessment of a distributed biosphere hydrological model against streamflow and MODIS land surface temperature in the upper Tone River Basin. J. Hydrol. 2009, 377, 21–34. [Google Scholar] [CrossRef]
  34. Wang, L.; Koike, T.; Yang, D.; Yang, K. Improving the hydrology of the Simple Biosphere Model 2 and its evaluation within the framework of a distributed hydrological model. Hydrol. Sci. J. 2009, 54, 989–1006. [Google Scholar] [CrossRef] [Green Version]
  35. Shrestha, M.; Wang, L.; Koike, T.; Xue, Y.; Hirabayashi, Y. Improving the snow physics of WEB-DHM and its point evaluation at the SnowMIP sites. Hydrol. Earth Syst. Sci. 2010, 14, 2577–2594. [Google Scholar] [CrossRef] [Green Version]
  36. Wang, L.; Zhou, J.; Qi, J.; Sun, L.; Yang, K.; Tian, L.; Lin, Y.; Liu, W.; Shrestha, M.; Xue, Y.; et al. Development of a land surface model with coupled snow and frozen soil physics. Water Resour. Res. 2017, 53, 5085–5103. [Google Scholar] [CrossRef]
  37. Qi, J.; Wang, L.; Zhou, J.; Song, L.; Li, X.; Zeng, T. Coupled Snow and Frozen Ground Physics Improves Cold Region Hydrological Simulations: An Evaluation at the upper Yangtze River Basin (Tibetan Plateau). J. Geophys. Res. Atmos. 2019, 124, 12985–13004. [Google Scholar] [CrossRef]
  38. Ma, N.; Szilagyi, J.; Niu, G.-Y.; Zhang, Y.; Zhang, T.; Wang, B.; Wu, Y. Evaporation variability of Nam Co Lake in the Tibetan Plateau and its role in recent rapid lake expansion. J. Hydrol. 2016, 537, 27–35. [Google Scholar] [CrossRef]
  39. Junfeng, W.; Shiyin, L.; Wanqin, G.; Xiaojun, Y.; Junli, X.; Weijia, B.; Zongli, J. Surface-area changes of glaciers in the Tibetan Plateau interior area since the 1970s using recent Landsat images and historical maps. Ann. Glaciol. 2014, 55, 213–222. [Google Scholar] [CrossRef] [Green Version]
  40. Bliss, A.; Hock, R.; Radic, V. Global response of glacier runoff to twenty-first century climate change. J. Geophys. Res. Earth Surf. 2014, 119, 717–730. [Google Scholar] [CrossRef]
  41. Rashid, I.; Majeed, U.; Aneaus, S.; Pelto, M. Linking the Recent Glacier Retreat and Depleting Streamflow Patterns with Land System Changes in Kashmir Himalaya, India. Water 2020, 12, 1168. [Google Scholar] [CrossRef] [Green Version]
  42. Ran, Y.; Li, X.; Lu, L. Evaluation of four remote sensing based land cover products over China. Int. J. Remote Sens. 2010, 31, 391–401. [Google Scholar] [CrossRef]
  43. Xiao, Z.; Liang, S.; Wang, J.; Chen, P.; Yin, X.; Zhang, L.; Song, J. Use of General Regression Neural Networks for Generating the GLASS Leaf Area Index Product From Time-Series MODIS Surface Reflectance. IEEE Trans. Geosci. Remote. Sens. 2013, 52, 209–223. [Google Scholar] [CrossRef]
  44. MOD11A1 MODIS/Terra Land Surface Temperature/Emissivity Daily L3 Global 1km SIN Grid V006. Available online: https://doi.org/10.5067/MODIS/MOD11A1.006 (accessed on 9 February 2020).
  45. Che, T.; Li, X.; Jin, R.; Armstrong, R.; Zhang, T. Snow depth derived from passive microwave remote-sensing data in China. Ann. Glaciol. 2008, 49, 145–154. [Google Scholar] [CrossRef] [Green Version]
  46. Li, X.; Long, D.; Huang, Q.; Han, P.; Zhao, F.; Wada, Y. High-temporal-resolution water level and storage change data sets for lakes on the Tibetan Plateau during 2000–2017 using multiple altimetric missions and Landsat-derived lake shoreline positions. Earth Syst. Sci. Data 2019, 11, 1603–1627. [Google Scholar] [CrossRef] [Green Version]
  47. Yang, K.; He, J.; Tang, W.; Qin, J.; Cheng, C.C. On downward shortwave and longwave radiations over high altitude regions: Observation and modeling in the Tibetan Plateau. Agric. For. Meteorol. 2010, 150, 38–46. [Google Scholar] [CrossRef]
  48. Chen, Y.; Yang, K.; He, J.; Qin, J.; Shi, J.; Du, J.; He, Q. Improving land surface temperature modeling for dry land of China. J. Geophys. Res. Space Phys. 2011, 116, 20104. [Google Scholar] [CrossRef]
  49. Rodell, M.; Houser, P.; Jambor, U.; Gottschalck, J.; Mitchell, K.; Meng, C.-J.; Arsenault, K.R.; Cosgrove, B.; Radakovich, J.; Bosilovich, M.; et al. The Global Land Data Assimilation System. Bull. Am. Meteorol. Soc. 2004, 85, 381–394. [Google Scholar] [CrossRef] [Green Version]
  50. Tropical Rainfall Measuring Mission. Available online: https://trmm.gsfc.nasa.gov/ (accessed on 9 February 2020).
  51. Gelaro, R.; Mccarty, W.; Suárez, M.J.; Todling, R.; Molod, A.; Takacs, L.; Randles, C.; Darmenov, A.; Bosilovich, M.G.; Reichle, R.H.; et al. The Modern-Era Retrospective Analysis for Research and Applications, Version 2 (MERRA-2). J. Clim. 2017, 30, 5419–5454. [Google Scholar] [CrossRef]
  52. Meteorological Observation Data from the Integrated Observation and Research Station of Multiple Spheres in Namco (2005–2016). Available online: https://data.tpdc.ac.cn/en/data/4deeb2b4-4fc1-4c7c-b0c6-6263a547d53f/ (accessed on 9 February 2020).
  53. Yang, D.; Herath, S.; Musiake, K. Comparison of different distributed hydrological models for characterization of catchment spatial variability. Hydrol. Process. 2000, 14, 403–416. [Google Scholar] [CrossRef]
  54. Yang, D.; Herath, S.; Musiake, K. A hillslope-based hydrological model using catchment area and width functions. Hydrol. Sci. J. 2002, 47, 49–65. [Google Scholar] [CrossRef]
  55. Sellers, P.; Tucker, C.; Collatz, G. A Revised Land Surface Parameterization (SiB2) for Atmospheric GCMS. Part I: Model Formulation. J. Clim. 1996, 9, 676–705. [Google Scholar] [CrossRef]
  56. Sellers, P.J.; Tucker, C.J.; Collatz, G.J.; Los, S.; Justice, C.O.; Dazlich, D.A.; Randall, D.A. A Revised Land Surface Parameterization (SiB2) for Atmospheric GCMS. Part II: The Generation of Global Fields of Terrestrial Biophysical Parameters from Satellite Data. J. Clim. 1996, 9, 706–737. [Google Scholar] [CrossRef] [Green Version]
  57. Wang, L.; Li, X.; Zhou, J. Hydrological modelling over the tibetan plateau: Current status and perspective. Adv. Earth Sci. 2014, 29, 674–682. (In Chinese) [Google Scholar]
  58. Penman, H.L. Natural evaporation from open water, bare soil and grass. Proc. R. Soc. London Ser. A Math. Phys. Sci. 1948, 193, 120–145. [Google Scholar] [CrossRef] [Green Version]
  59. McMahon, T.A.; Peel, M.C.; Lowe, L.; Srikanthan, R.; McVicar, T.R. Estimating actual, potential, reference crop and pan evaporation using standard meteorological data: A pragmatic synthesis. Hydrol. Earth Syst. Sci. 2013, 17, 1331–1363. [Google Scholar] [CrossRef] [Green Version]
  60. Yao, H. Long-Term Study of Lake Evaporation and Evaluation of Seven Estimation Methods: Results from Dickie Lake, South-Central Ontario, Canada. J. Water Resour. Prot. 2009, 1, 59–77. [Google Scholar] [CrossRef] [Green Version]
  61. Zhou, J.; Wang, L.; Zhang, Y. Exploring the water storage changes in the largest lake (Selin Co) over the Tibetan Plateau during 2003–2012 from a basin-wide hydrological modeling. Water Resour. Res. 2015, 51, 8060–8086. [Google Scholar] [CrossRef] [Green Version]
  62. Zhang, G.; Yao, T.; Xie, H.; Qin, J.; Ye, Q.; Dai, Y.; Guo, R. Estimating surface temperature changes of lakes in the Tibetan Plateau using MODIS LST data. J. Geophys. Res. Atmos. 2014, 119, 8552–8567. [Google Scholar] [CrossRef]
  63. Qu, B.; Kang, S.; Chen, F. Lake ice and its effect factors in the Nam Co Basin, Tibetan Plateau. Progress. Inquisitiones Mutat. Clim. 2012, 8, 327–333. (In Chinese) [Google Scholar]
  64. Gou, P.; Ye, Q.; Che, T.; Feng, Q.; Ding, B.; Lin, C.; Zong, J. Lake ice phenology of Nam Co, Central Tibetan Plateau, China, derived from multiple MODIS data products. J. Great Lakes Res. 2017, 43, 989–998. [Google Scholar] [CrossRef]
  65. Xue, B.-L.; Wang, L.; Yang, K.; Tian, L.; Qin, J.; Chen, Y.; Zhao, L.; Ma, Y.; Koike, T.; Hu, Z.; et al. Modeling the land surface water and energy cycles of a mesoscale watershed in the central Tibetan Plateau during summer with a distributed hydrological model. J. Geophys. Res. Atmos. 2013, 118, 8857–8868. [Google Scholar] [CrossRef]
  66. Lazhu; Yang, K.; Wang, J.; Lei, Y.; Chen, Y.; Zhu, L.; Ding, B.; Qin, J. Quantifying evaporation and its decadal change for Lake Nam Co, central Tibetan Plateau. J. Geophys. Res. Atmos. 2016, 121, 7578–7591. [Google Scholar] [CrossRef]
  67. Wang, B.; Ma, Y.; Wang, Y.; Su, Z.; Ma, W. Significant differences exist in lake-atmosphere interactions and the evaporation rates of high-elevation small and large lakes. J. Hydrol. 2019, 573, 220–234. [Google Scholar] [CrossRef]
  68. Duan, Z.; Bastiaanssen, W.G.M. Evaluation of three energy balance-based evaporation models for estimating monthly evaporation for five lakes using derived heat storage changes from a hysteresis model. Environ. Res. Lett. 2017, 12, 024005. [Google Scholar] [CrossRef] [Green Version]
  69. Gao, H.; He, X.; Ye, B.; Pu, J. Modeling the runoff and glacier mass balance in a small watershed on the Central Tibetan Plateau, China, from 1955 to 2008. Hydrol. Process. 2011, 26, 1593–1603. [Google Scholar] [CrossRef]
  70. Gao, H.; Ding, Y.; Zhao, Q.; Hrachowitz, M.; Savenije, H.H. The importance of aspect for modelling the hydrological response in a glacier catchment in Central Asia. Hydrol. Process. 2017, 31, 2842–2859. [Google Scholar] [CrossRef]
Figure 1. Topographic map of Nam Co Basin showing the river networks, meteorological station, discharge gauge, glacier distribution, and simulated lake inflow points.
Remotesensing 12 01926 g001
Figure 2. Comparison of monthly (a) China Meteorological Forcing Data (CMFD), (b) Tropical Rainfall Measuring Mission (TRMM), (c) Modern-Era Retrospective analysis for Research and Applications version 2 (MERRA2), and (d) Global Land Data Assimilation System (GLDAS) precipitation products with the observed precipitation at the Nam Co Monitoring and Research Station for Multisphere Interactions from 2005 to 2015. The black dotted line (“y = x, 1:1”) and the red dotted line (linear fitting) are given for reference.
Remotesensing 12 01926 g002
Figure 3. Comparisons of the original and corrected CMFD precipitation data with the observed precipitation at the Nam Co Monitoring and Research Station for Multisphere Interactions. Time-series (a), scatterplots of the observations and original CMFD data (b) and scatterplots of the observations and the corrected CMFD data (c) were given respectively.
Remotesensing 12 01926 g003
Figure 4. Daily observed and simulated discharge at Niyaqu Station from 2008 to 2010, and daily precipitation in the same period.
Remotesensing 12 01926 g004
Figure 5. Comparison of 8-daily basin-averaged LSTs of Nam Co between model simulations and MODIS time-series in (a) daytime and (c) nighttime; scatterplots in (b) daytime and (d) nighttime during 2001–2016
Remotesensing 12 01926 g005
Figure 6. Comparison of the simulated and MODIS-derived spatial patterns of seasonal mean daytime (a) and night-time (b) land surface temperatures during 2001–2016. Spring (MAM), summer (JJA) autumn (SON)and winter (DJF) were listed from left to right.
Remotesensing 12 01926 g006
Figure 7. Comparison of monthly simulated snow depth and Special Sensor Microwave/Image (SMM/I)-derived snow depth in (a) time-series and (b) scatterplots.
Remotesensing 12 01926 g007
Figure 8. Variations in (a) annual precipitation, (b) evapotranspiration, (c) total runoff, and (d) lake water storage during 1980–2016.
Remotesensing 12 01926 g008
Figure 9. Comparison of the daily simulated lake water storage (LWS) and the LWS derived from existing datasets, from 2000 to 2016 in (a) time-series and (b) scatterplots.
Remotesensing 12 01926 g009
Figure 10. The simulated daily LWS of Nam Co Lake from 1980 to 2016. The red dotted line (linear fitting) and green dotted lines (period dividing) are given for reference.
Remotesensing 12 01926 g010
Figure 11. Variations of annual lake inflow, melt, precipitation, and air temperature from 1980 to 2016.
Remotesensing 12 01926 g011
Figure 12. Variations of annual fraction of snow and glacier melt in total lake inflow from 1980 to 2016. The black dotted line (linear fitting in the whole period), red lines (linear fitting for each period) and the green dotted line (period dividing) are given for reference.
Remotesensing 12 01926 g012
Figure 13. Comparison between monthly change of Δs and (a) total lake inflow, (b) lake surface precipitation, (c) lake surface evaporation, (d) basin average precipitation, (e) snow and glacier melt, (f) precipitation runoff from 1980 to 2016.
Remotesensing 12 01926 g013
Table 1. Duration and transition date of Nam Co Lake ice cover from 1980 to 2016 based on MODIS land surface temperature (LST) products.
YearDuration *Transition DateYearDuration *Transition Date
1980–200011 Nov.–18 May (185 days)13 Mar.20095 Nov.–5 May (181 days)12 Mar.
200111 Nov.–6 May (176 days)8 Mar.201011 Nov.–21 May (191 days)10 Mar.
20026 Nov.–28 May (203 days)9 Mar.201117 Nov.–10 May (174 days)12 Mar.
20039 Nov.–23 May (195 days)1 Mar.201216 Nov.–25 May (191 days)22 Mar.
200413 Nov.–19 May (188 days)26 Mar.201314 Nov.–19 May (186 days)28 Feb.
20056.Nov.–26 May (201 days)19 Mar.20146 Nov.–23 May (198 days)20 Apr.
20068 Nov.–21 May (194 days)24 Feb.201519 Nov.–17 May (179 days)28 Mar.
200717 Nov.–17 May (181 days)21 Mar.20164 Nov.–12 May (190 days)25 Mar.
200812 Nov.–10 May (180 days)5 Mar.2016–201716 Nov.–18 May (183 days)
* The first date listed in each duration was in November of the previous year.
Table 2. Attribution analysis results in three periods.
PeriodPrecipitation RunoffMeltLake Surface PrecipitationLake Surface Evaporation
1980–198776%20%29%−25%
1988–200870%31%25%−26%
2009–201684%33%31%−49%
Table 3. Some surface evaporation estimates for Nam Co.
Value (mm)PeriodMethodsSource
1149 ± 711980–2016Penman formulaThis study
981 ± 18Unfrozen period of 2016EC methodsWang et al., 2019 [67]
6931961–2015FR estimationLi et al., 2017 [30]
832 ± 691980–2014Flake modelLazhu et al., 2016 [66]
6351979–2012CRLEMa et al., 2016 [38]
About 6501980–2010MWB modelWu et al., 2014 [29]
About 600May to Oct. of 2007–2011ObservationsZhou et al., 2013 [20]
11841976–2009Penman formulaZhang et al., 2011 [17]
14301971–2004Penman formulaZhu et al., 2010 [18]
Table 4. Changing rates of runoff, melt, precipitation, and air temperature in different periods.
PeriodRunoffMeltPrecipitationAir Temperature
1980–19882.69 m3 s−1/10a11.16 m3 s−1/10a20.85 mm/10a1.46 K/10a *
1988–20094.29 m3 s−1/10a *5.34 m3 s−1/10a39.87 mm/10a0.38 K/10a *
2009–2016−5.89 m3 s−1/10a−4.63 m3 s−1/10a−44.95 mm/10a1.35 K/10a
* for significant trend (p < 0.05).

