Determination and Quantification of the Distribution of CN-NL Nanoparticles Encapsulating Glycyrrhetic Acid on Novel Textile Surfaces with Hyperspectral Imaging

 , and
, and
Abstract
1. Introduction
2. Materials and Methods
2.1. Samples
2.2. NIR Hyperspectral Imaging System
2.3. Principal Component Analysis
2.4. Partial Least Square Regression
2.5. Software Tools
3. Results
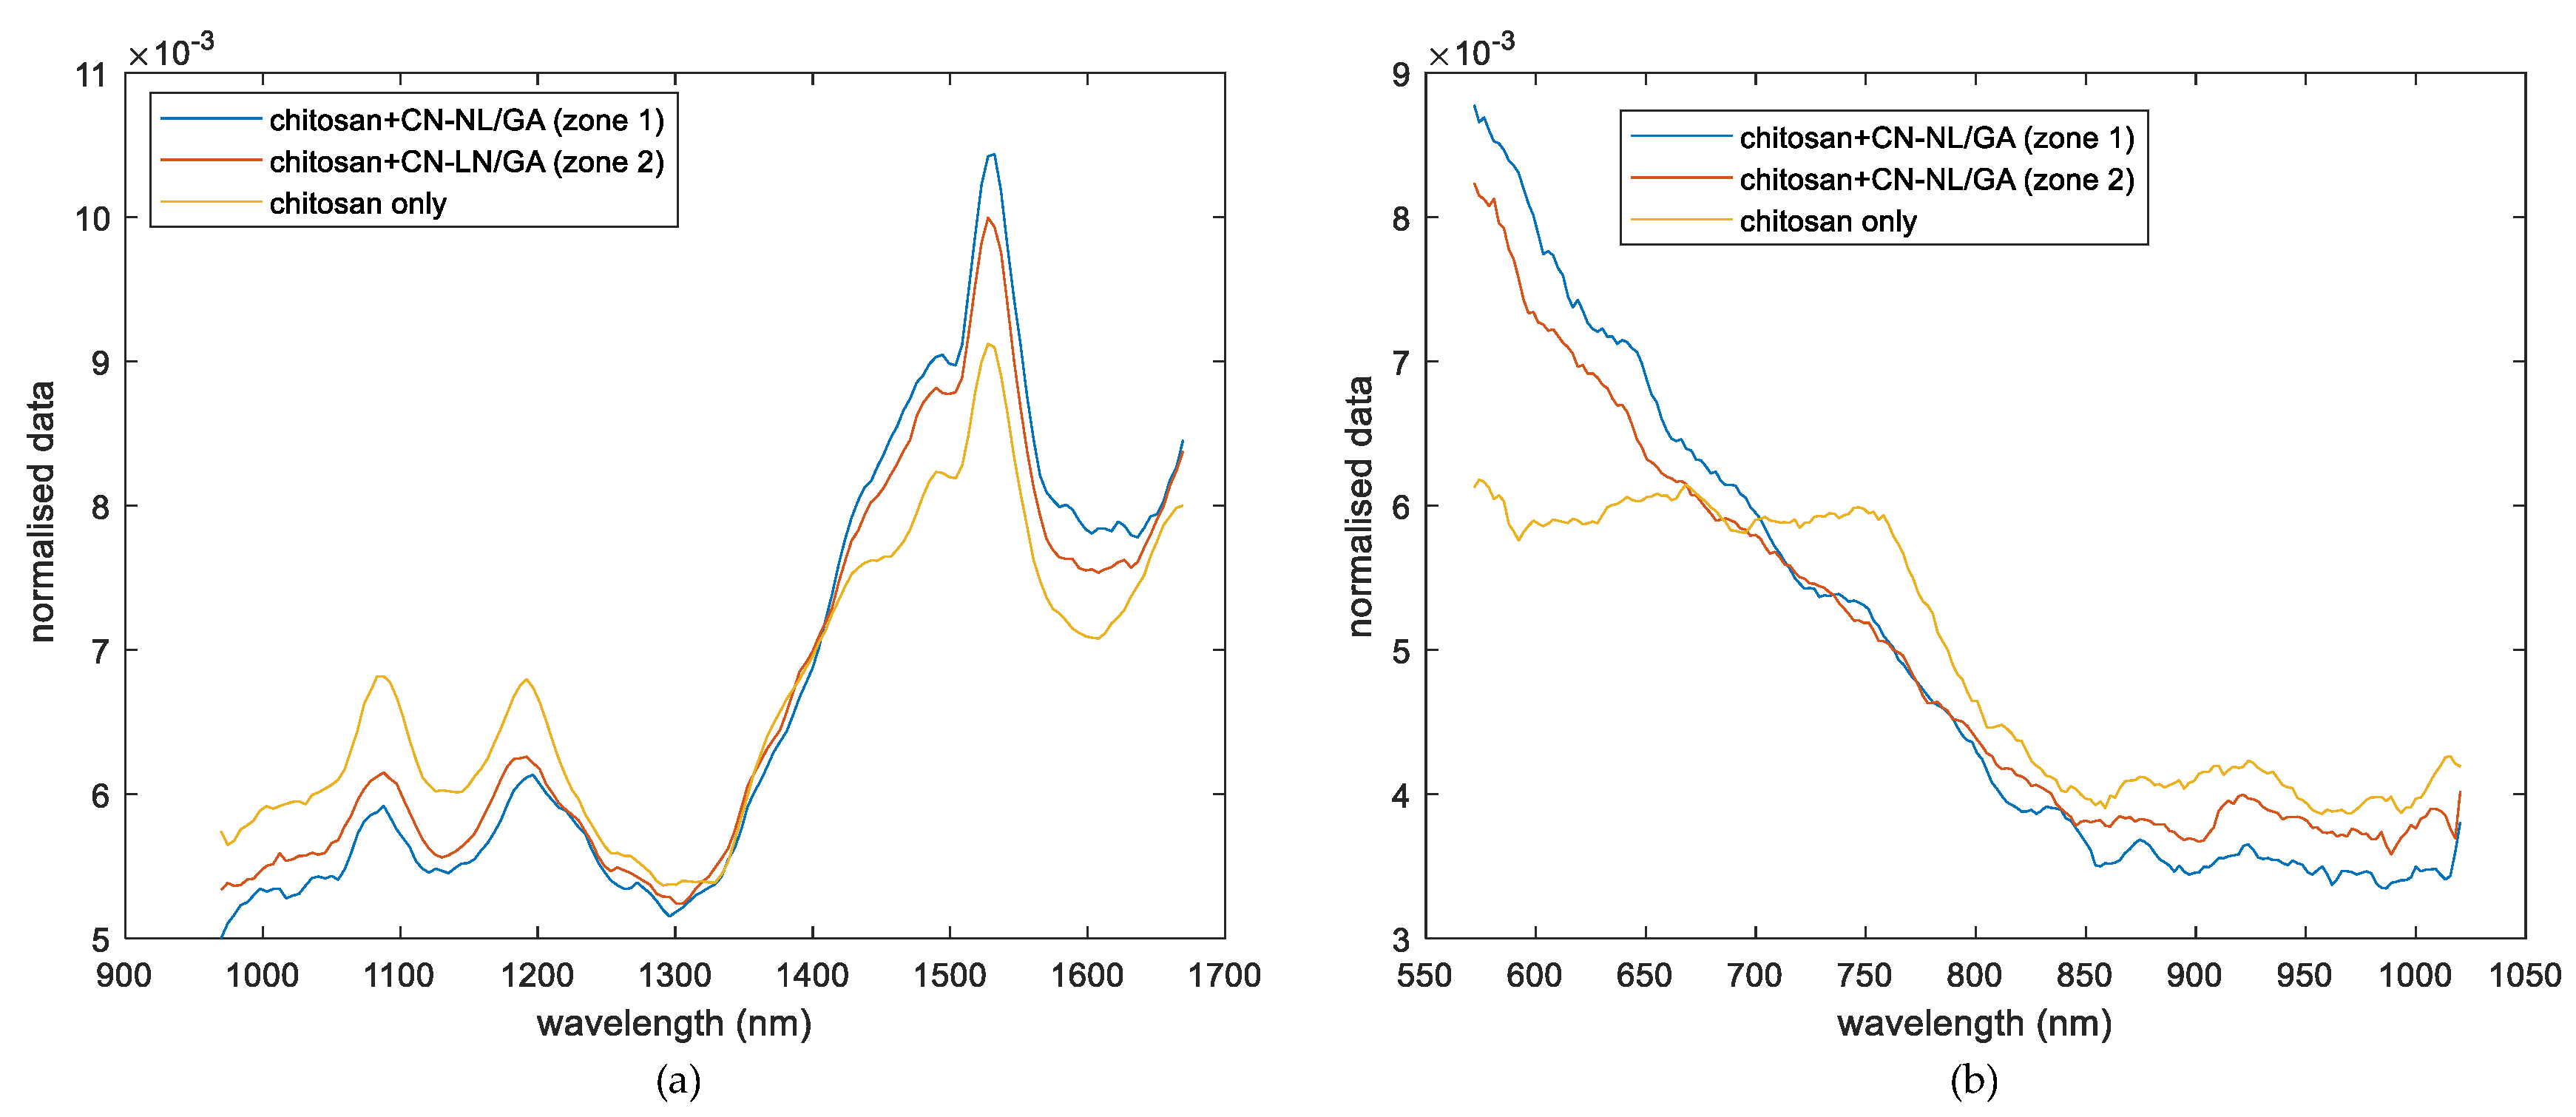
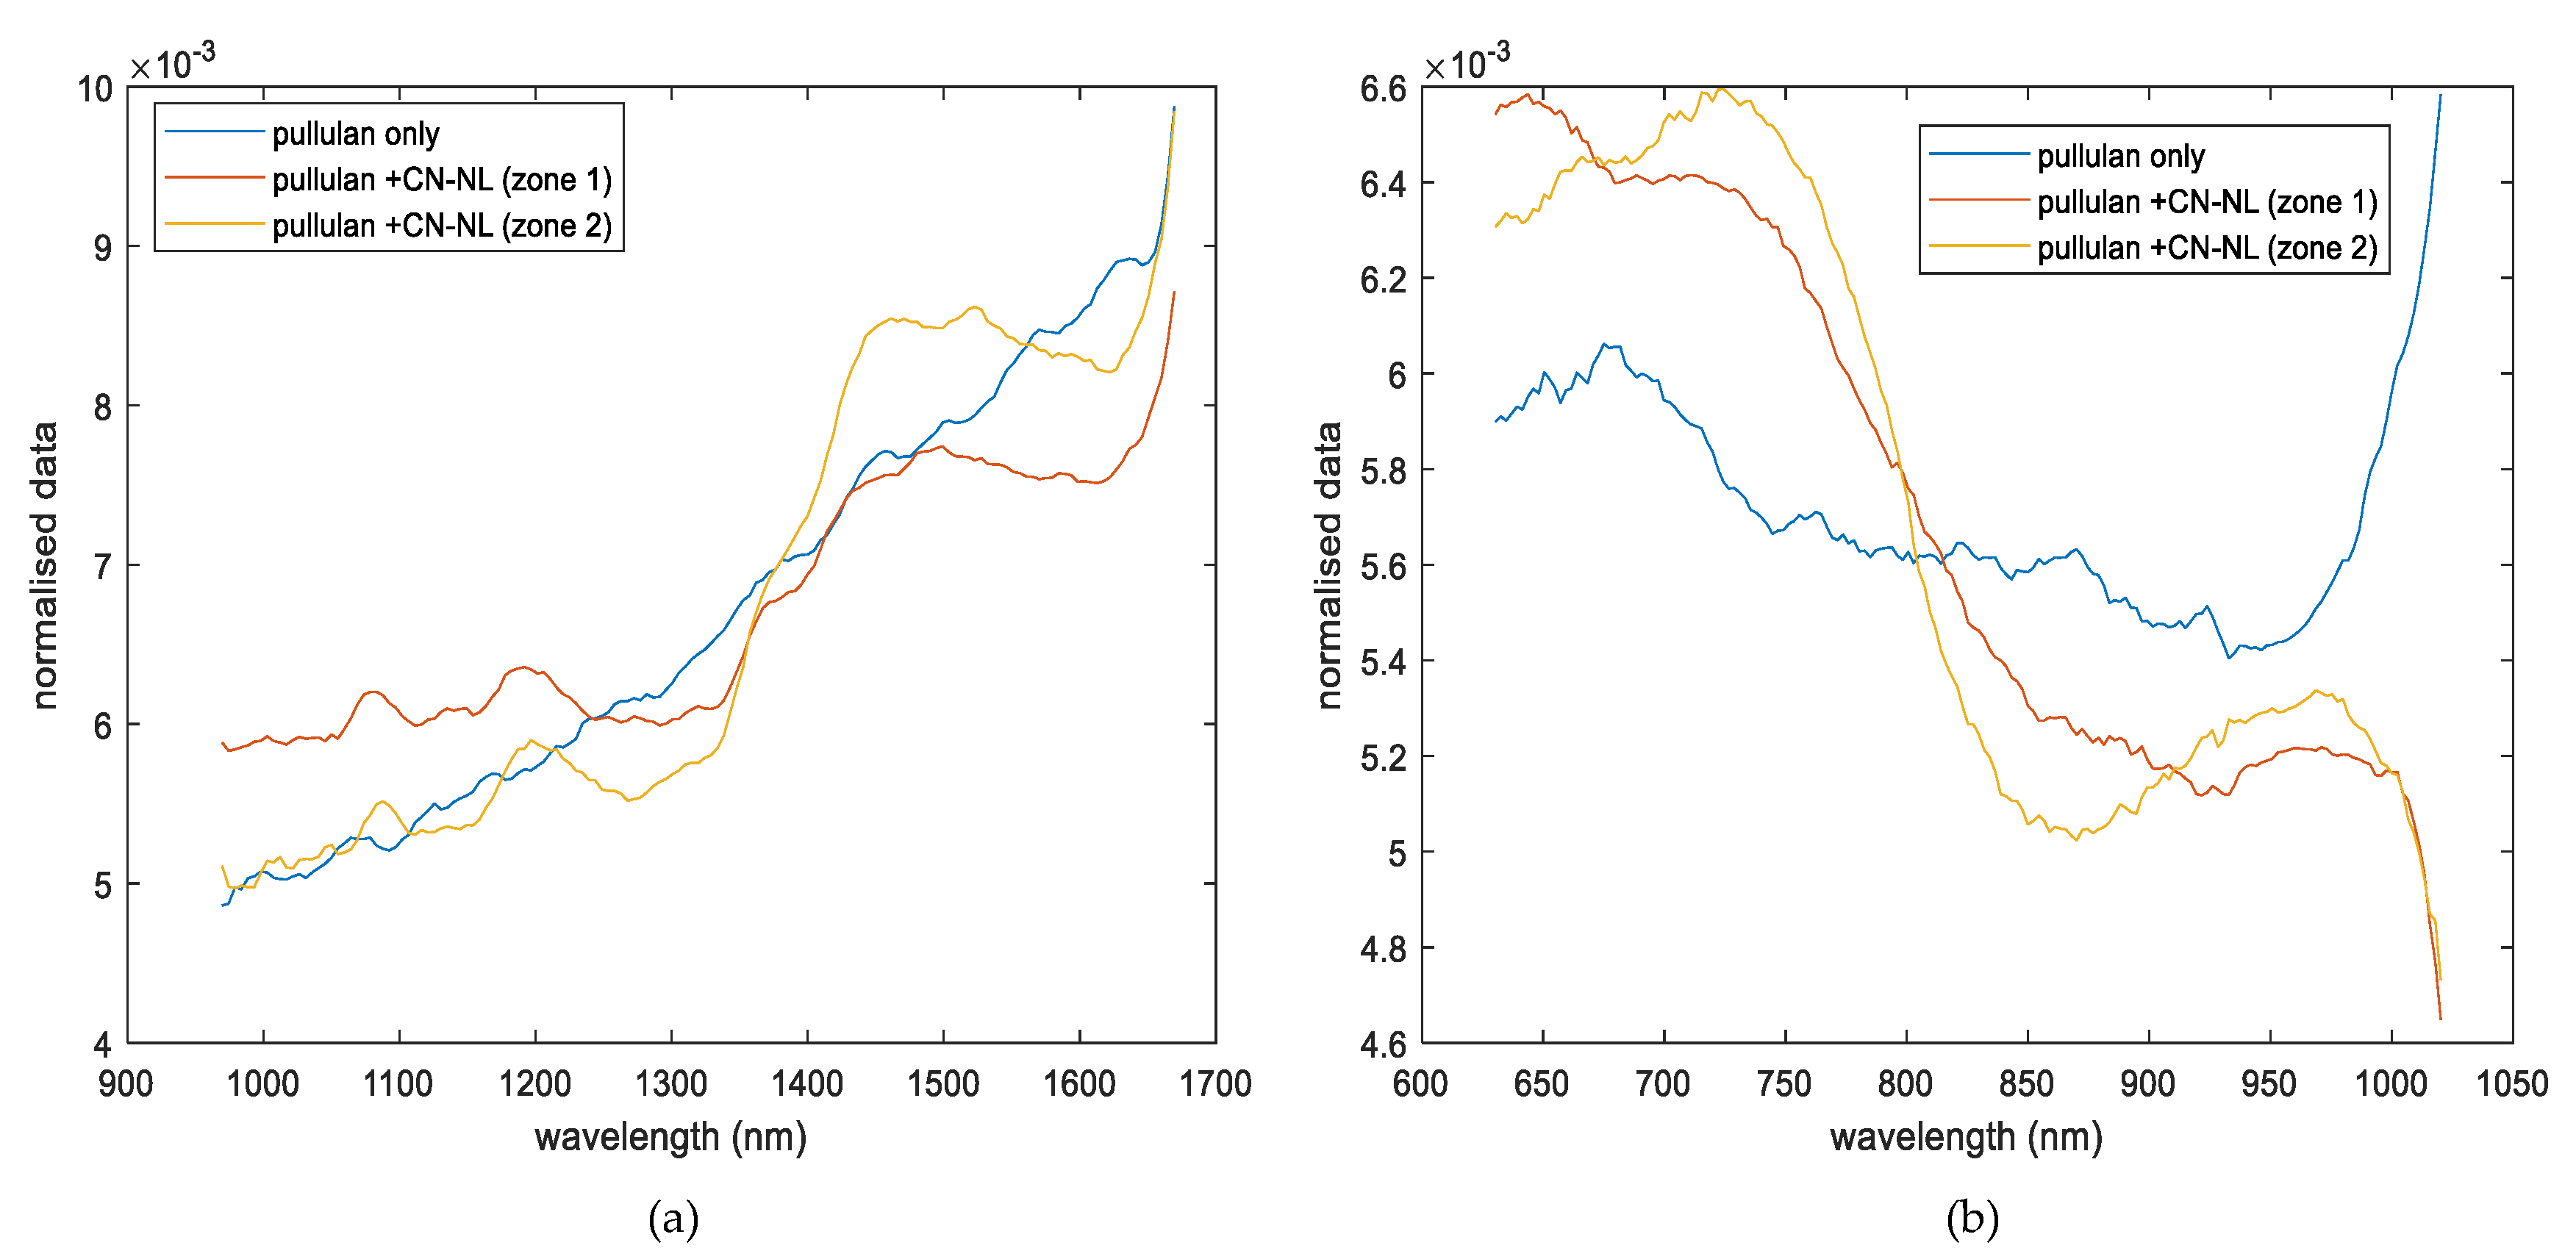
3.1. Spectroscopic Analysis
- Chitosan substrates impregnated with CN-NL/GA
- Pullulan substrates impregnated with CN-NL
3.2. Qualitative Distribution Analysis (PCA Method)
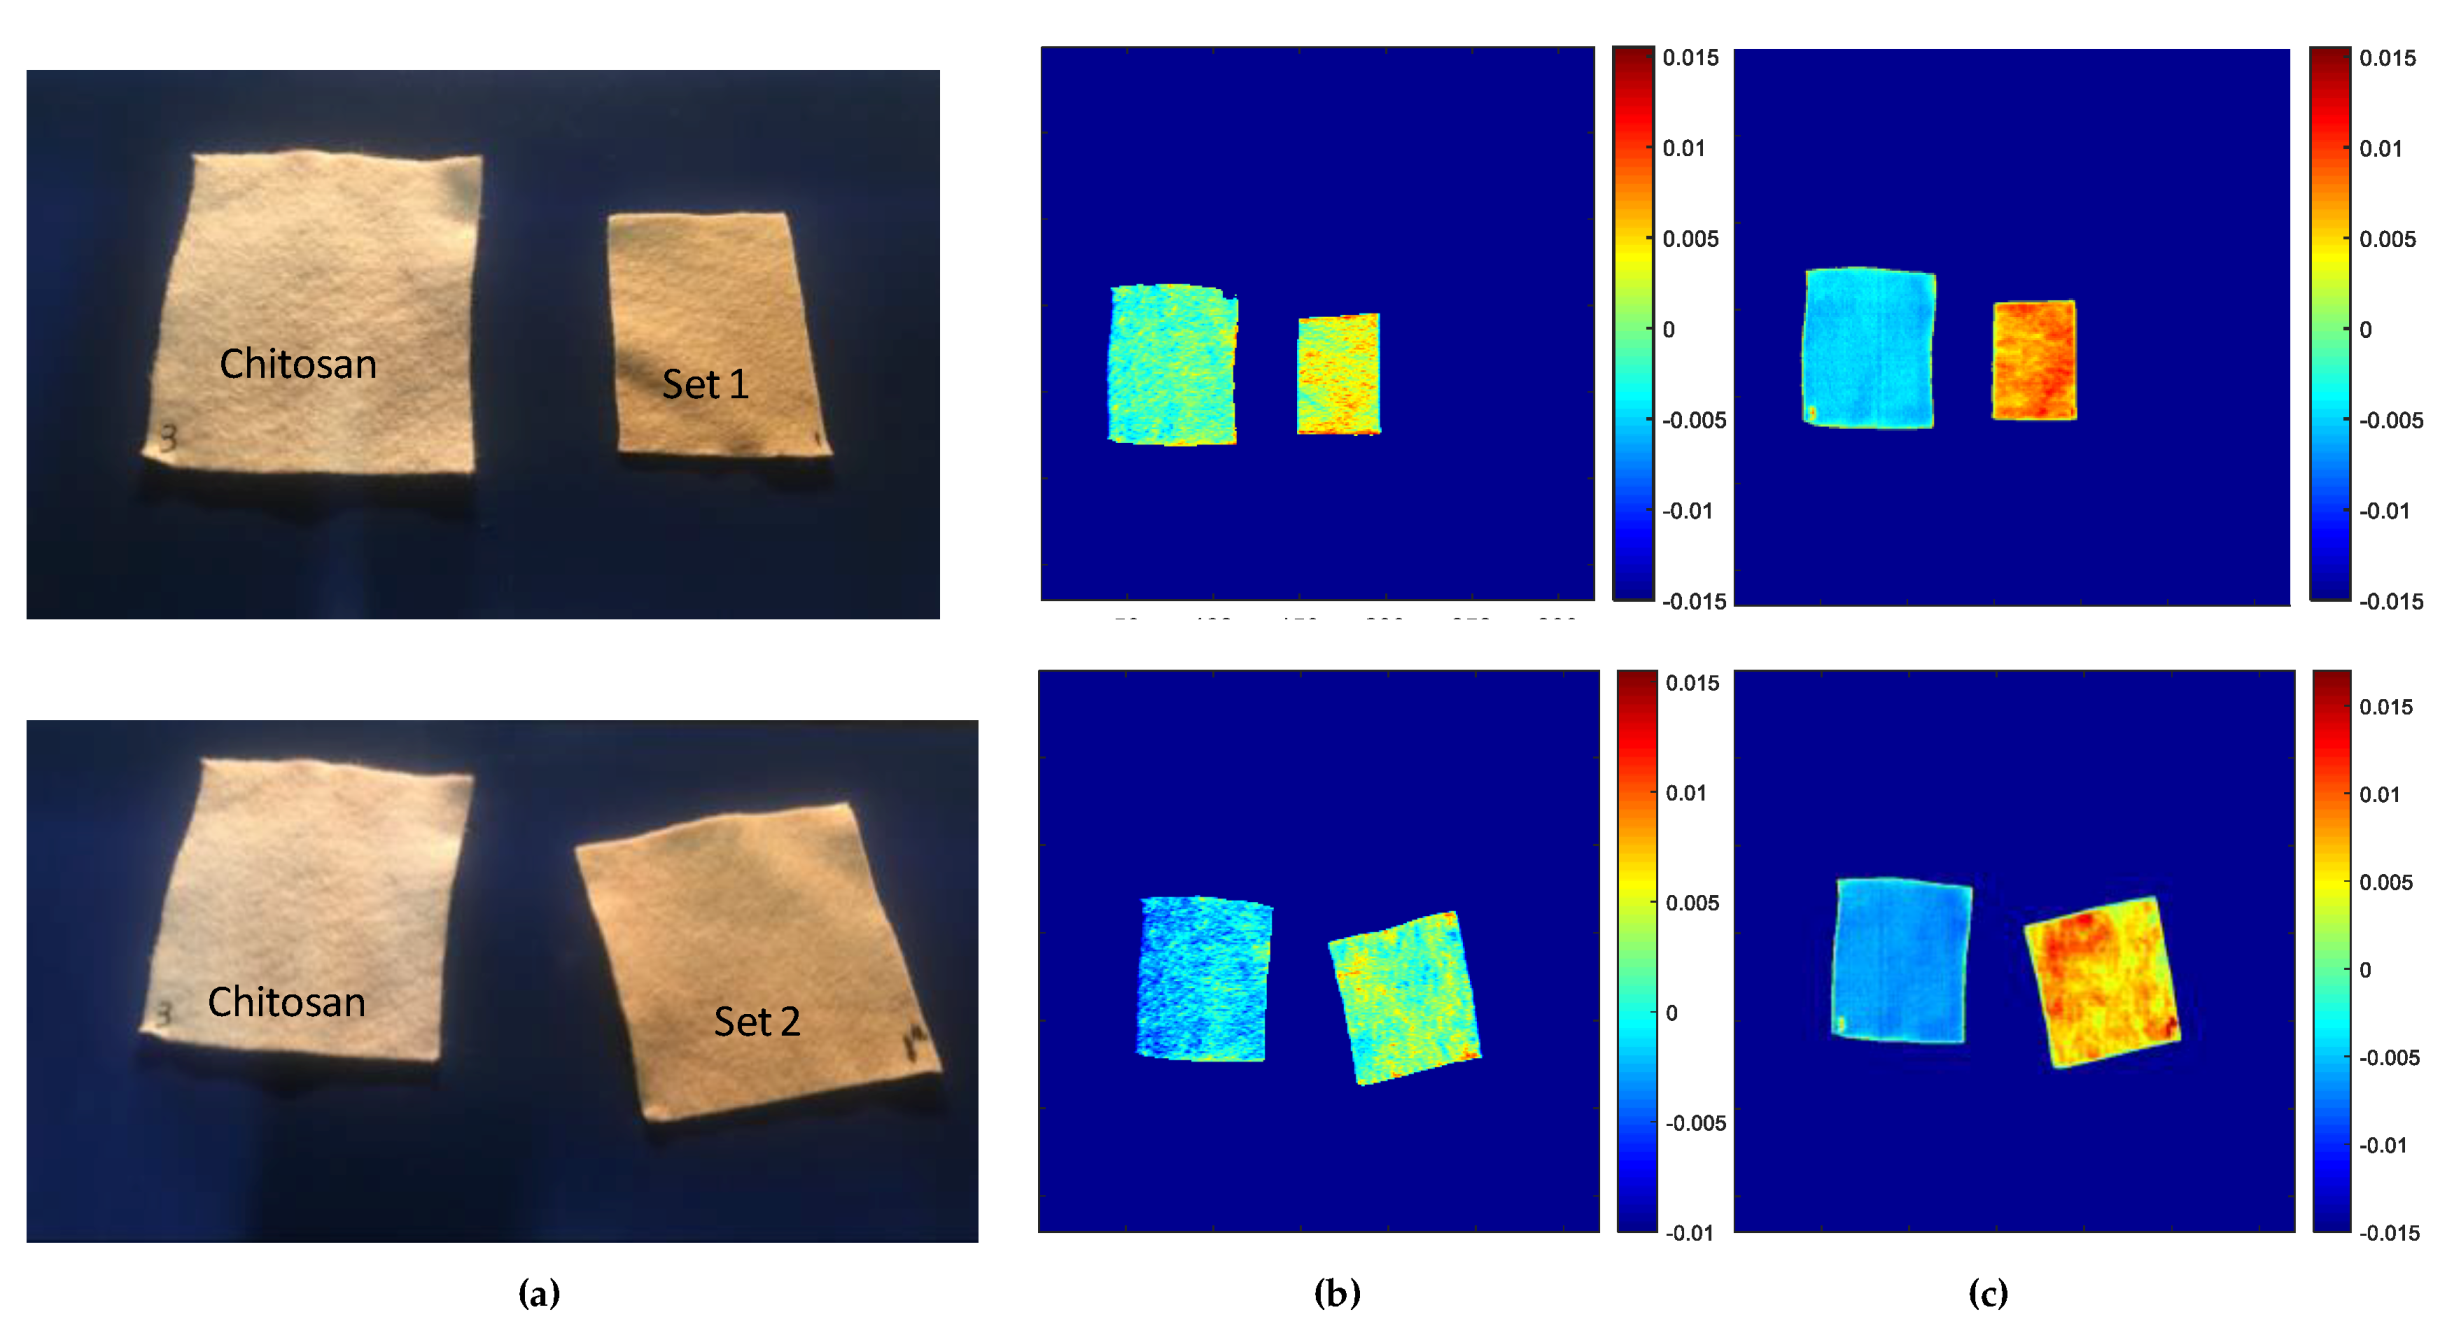
3.2.1. Evaluation of Chitosan Substrates
- Score Results
- Loading Results
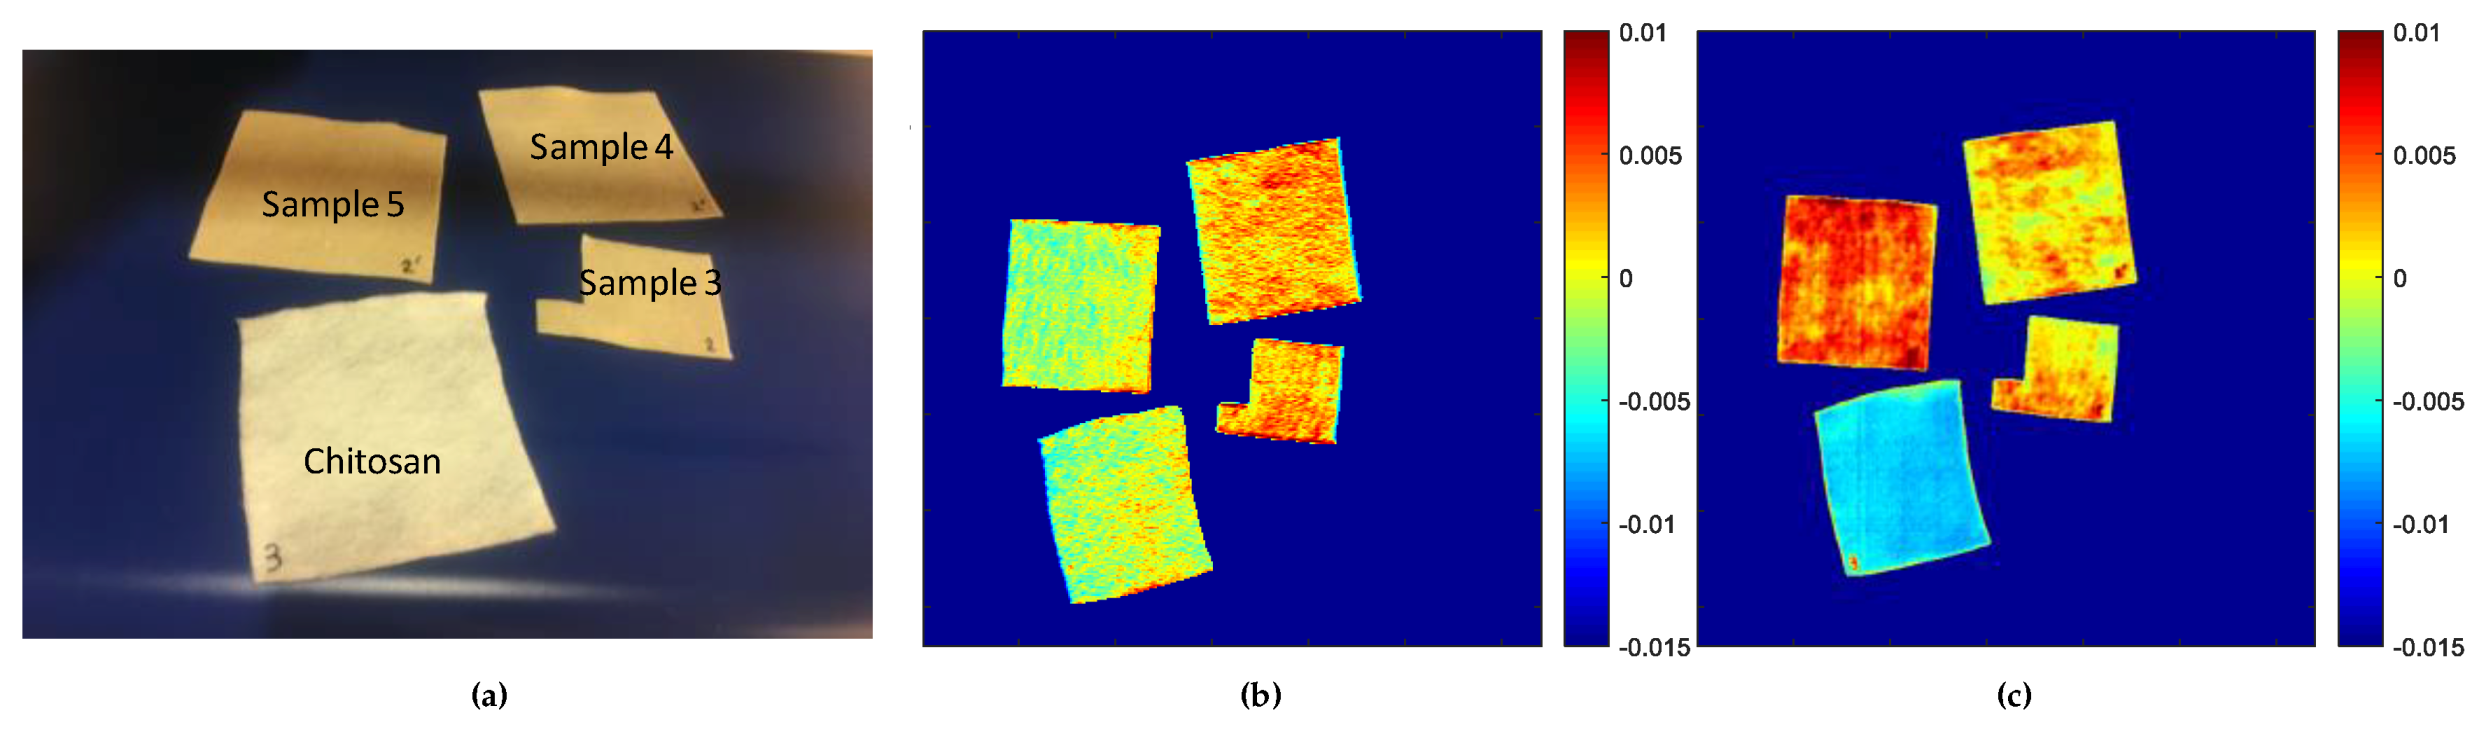
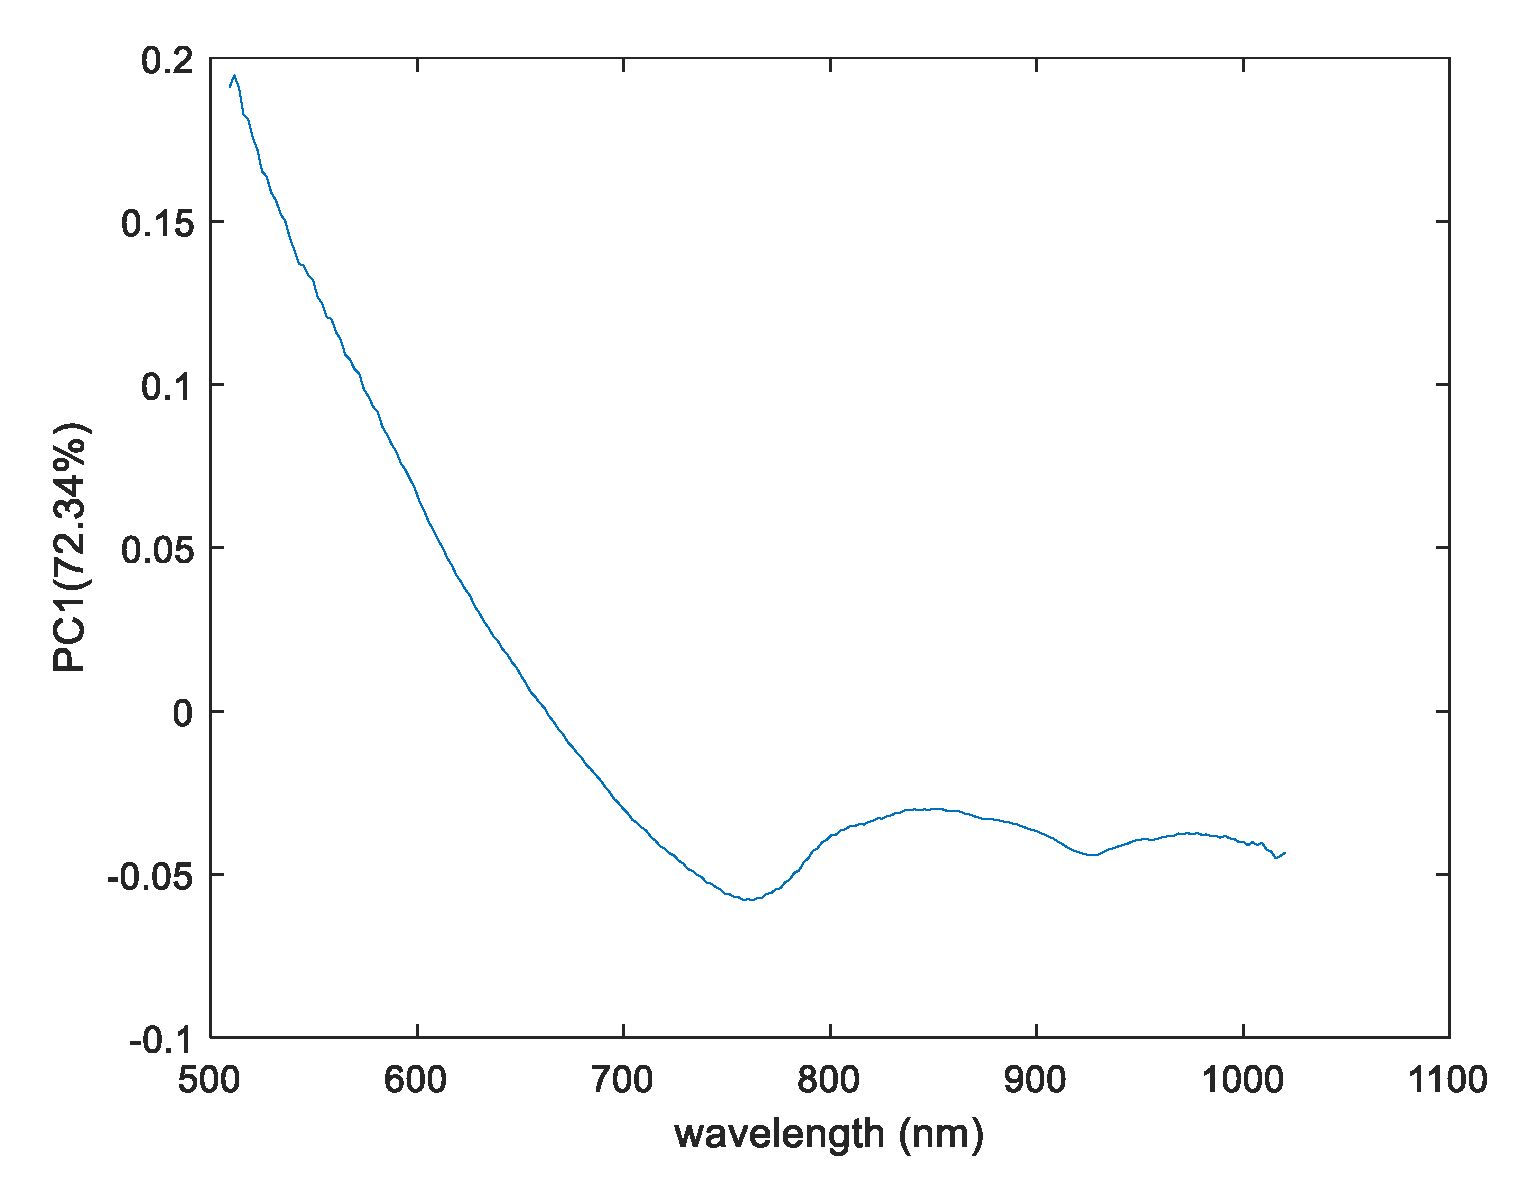
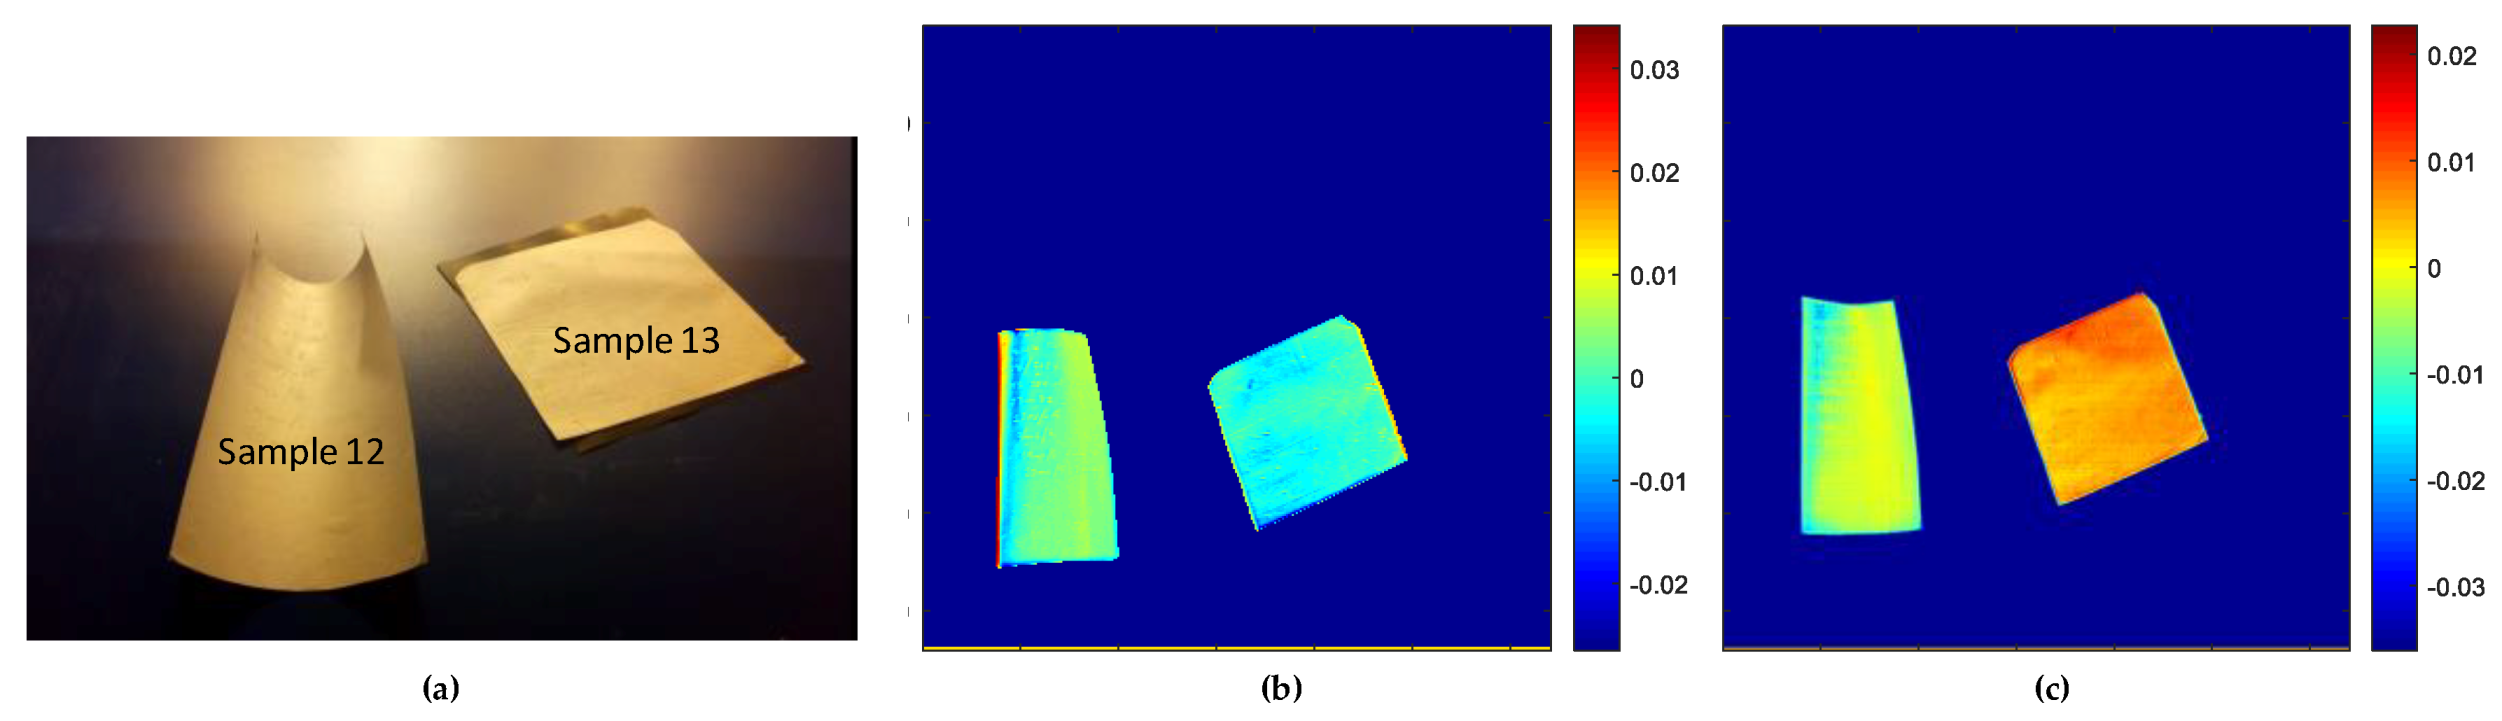
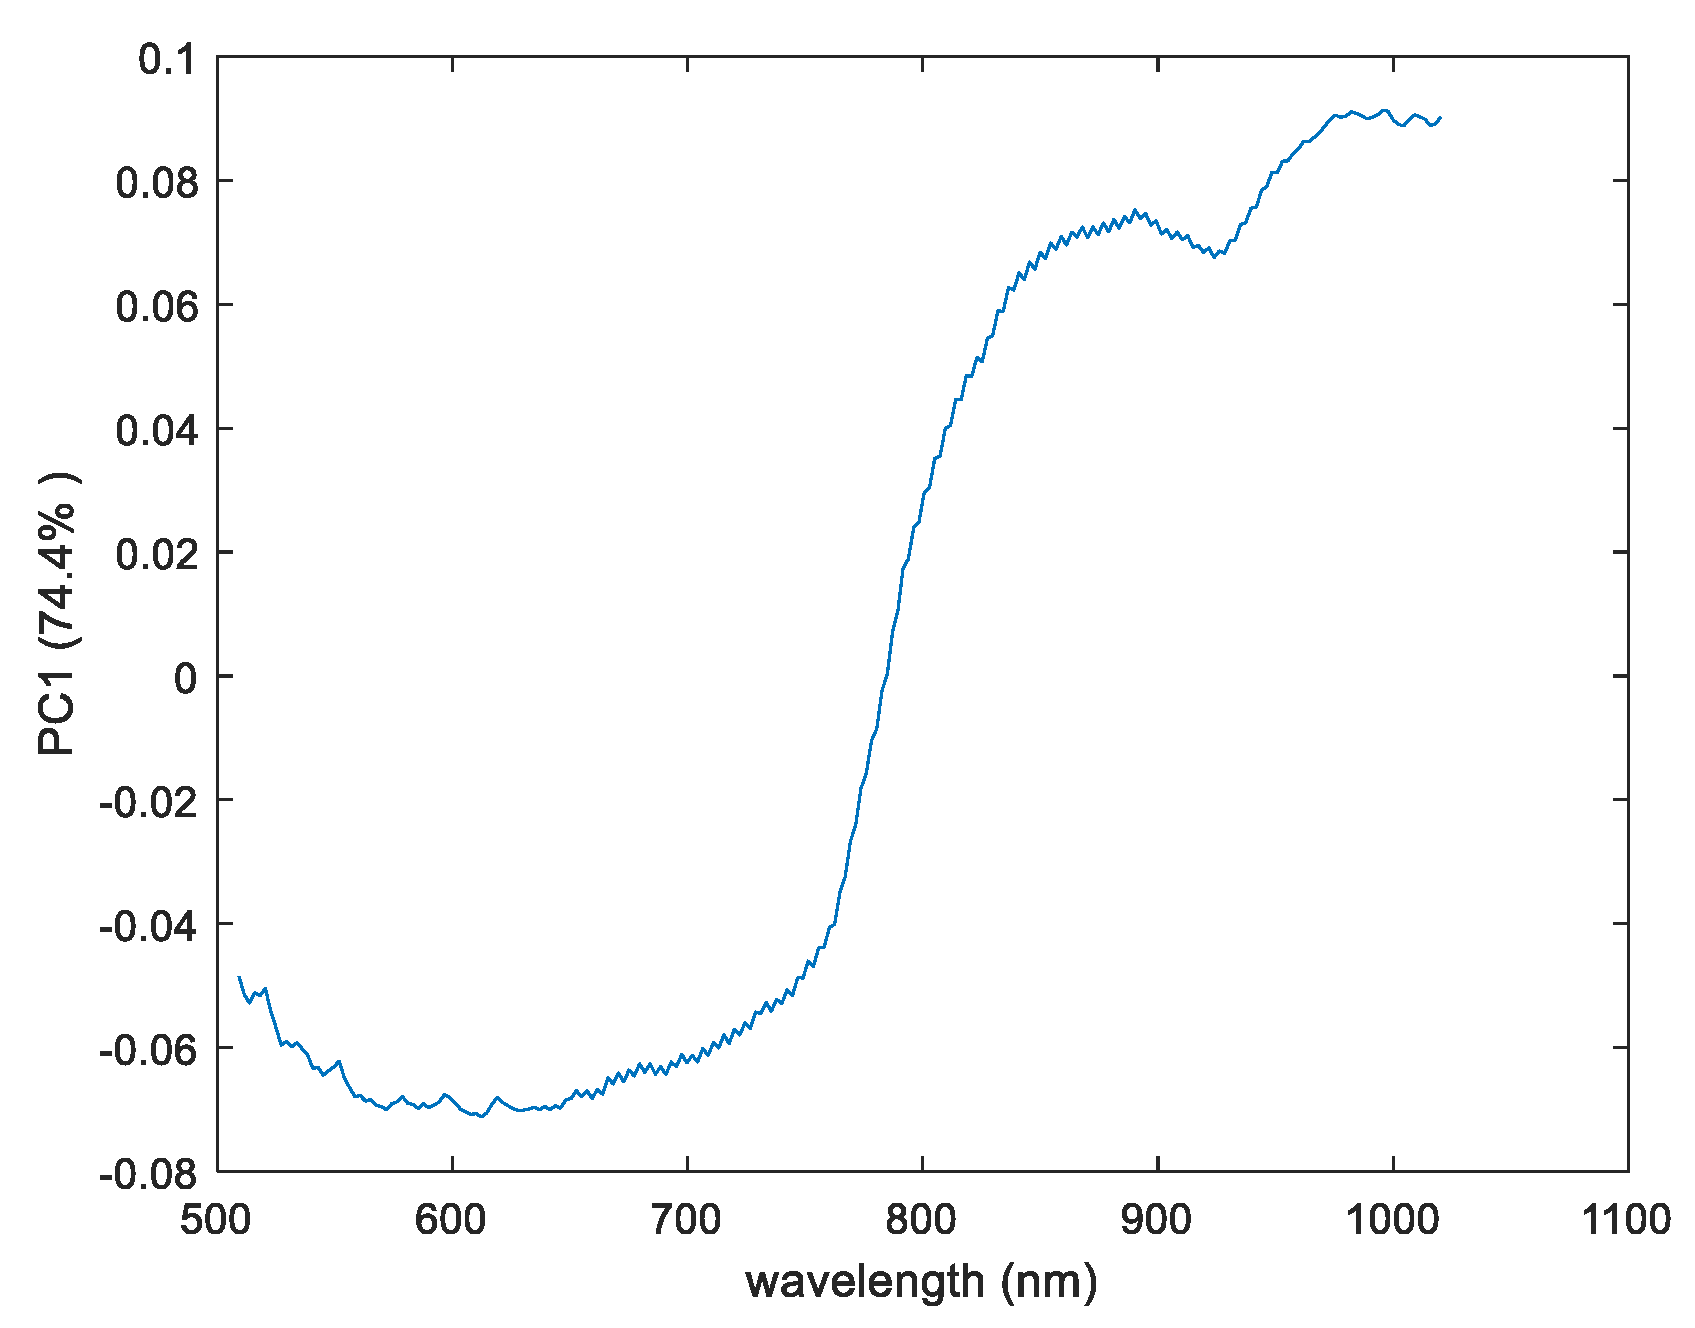
3.2.2. Evaluation of Pullulan Substrates
- Score Results
- Loadings Result
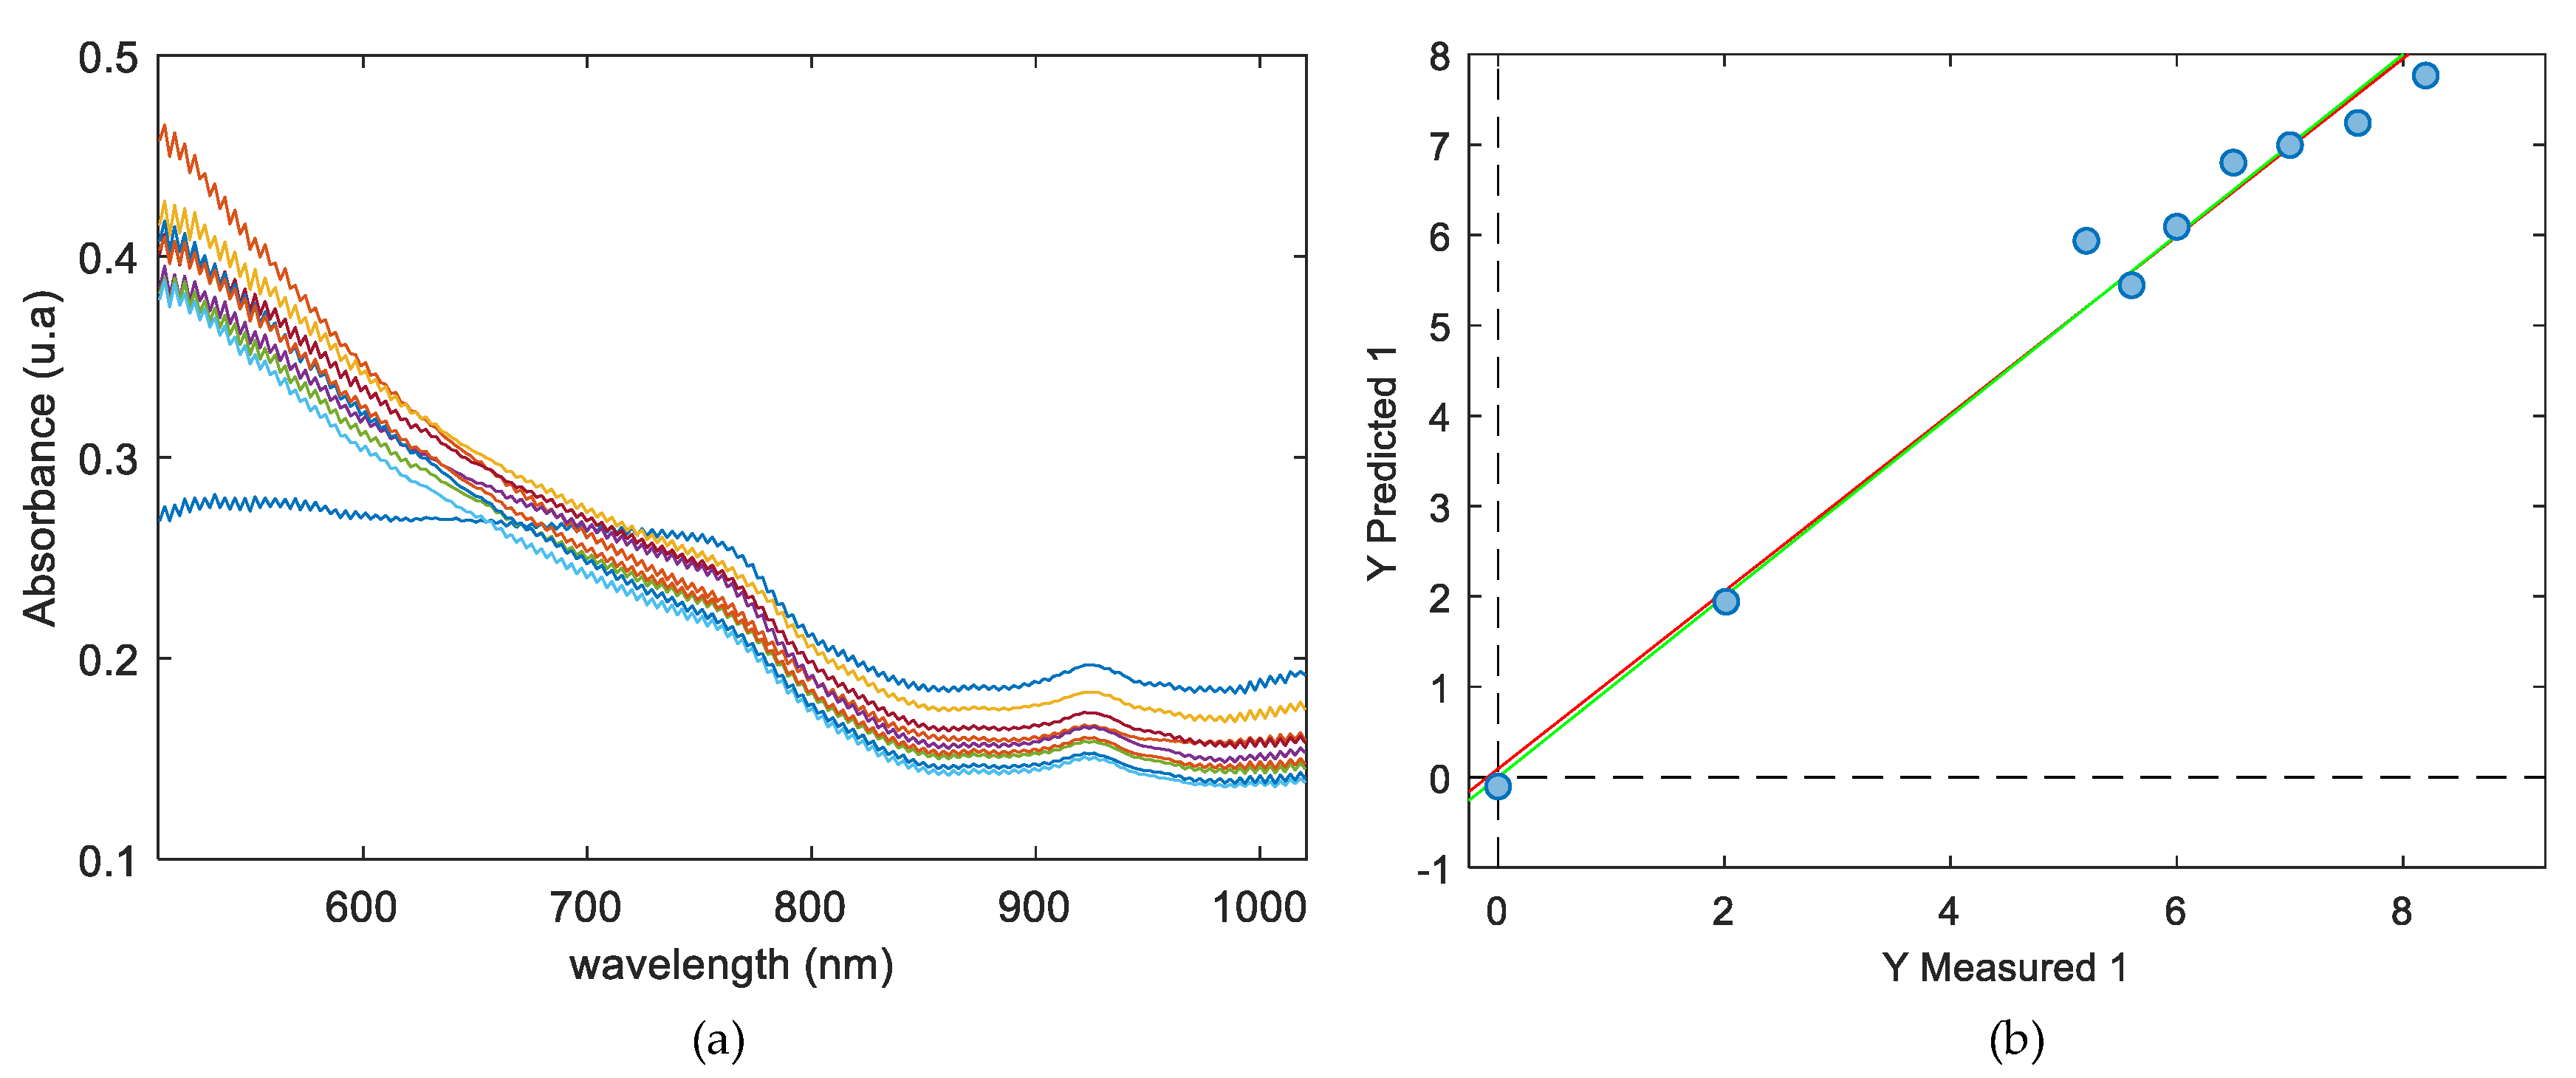
3.3. Quantitative Distribution Analysis (PCA Method)
4. Conclusions
5. Future Perspectives
Author Contributions
Funding
Acknowledgments
Conflicts of Interest
References
- Elieh-Ali-Komi, D.; Hamblin, M.R. Chitin and Chitosan: Production and Application of Versatile Biomedical Nanomaterials. Am. Math. Mon. 2004, 111, 915. [Google Scholar]
- Morganti, P.; Danti, S.; Coltelli, M.B. Chitin and lignin to produce biocompatible tissues. Res. Clin. Dermatol. 2018, 1, 5–11. [Google Scholar] [CrossRef]
- Danti, S.; Trombi, L.; Fusco, A.; Azimi, B.; Lazzeri, A.; Morganti, P.; Coltelli, M.-B. Chitin nanofibrils and nanolignin as functional agents in skin regeneration. Int. J. Mol. Sci. 2019, 20, 2669. [Google Scholar] [CrossRef]
- Sahana, T.G. Biopolymers: Applications in wound healing and skin tissue engineering. Mol. Biol. Rep. 2018, 45, 2857–2867. [Google Scholar] [CrossRef] [PubMed]
- Manley, M. Near-infrared spectroscopy and hyperspectral imaging: Non-destructive analysis of biological materials. Chem. Soc. Rev. 2014, 43, 8200–8214. [Google Scholar] [CrossRef]
- Cleve, E.; Bach, E.; Schollmeyer, E. Using chemometric methods and NIR spectrophotometry in the textile industry. Anal. Chim. Acta 2000, 420, 163–167. [Google Scholar] [CrossRef]
- Blanco, M.; Alcalá, M.; Planells, J.; Mulero, R. Quality control of cosmetic mixtures by NIR spectroscopy. Anal. Bioanal. Chem. 2007, 389, 1577–1583. [Google Scholar] [CrossRef]
- Lyon, R.C.; Lester, D.S.; Lewis, E.N.; Lee, E.; Lawrence, X.Y.; Jefferson, E.H.; Hussain, A.S. Near-Infrared Spectral Imaging for Quality Assurance of Pharma- ceutical Products: Analysis of Tablets to Assess Powder Blend Ho- mogeneity. AAPS PharmSciTech 2002, 3, 1–15. [Google Scholar] [CrossRef]
- Siche, R.; Vejarano, R.; Aredo, V.; Velasquez, L.; Saldaña, E.; Quevedo, R. Evaluation of Food Quality and Safety with Hyperspectral Imaging (HSI) Evaluation of Food Quality and Safety with Hyperspectral Imaging (HSI). Food Eng. Rev. 2016, 8, 306–322. [Google Scholar] [CrossRef]
- Plant, P. Hyperspectral Imaging for Mapping of Total Nitrogen Spatial Distribution in pepper plant. PLoS ONE 2014, 9, e116205. [Google Scholar]
- Nagaoka, T.; Kimura, Y. Quantitative cosmetic evaluation of long-lasting foundation using multispectral imaging. Ski. Res. Technol. 2019, 25, 318–324. [Google Scholar] [CrossRef]
- Ge, Y.; Atefi, A.; Zhang, H.; Miao, C.; Ramamurthy, R.K.; Sigmon, B.; Yang, J.; Schnable, J.C. High-throughput analysis of leaf physiological and chemical traits with VIS-NIR-SWIR spectroscopy: A case study with a maize diversity panel. Plant. Methods 2019, 15, 1–12. [Google Scholar] [CrossRef]
- Mäkelä, M.; Geladi, P. Hyperspectral near infrared imaging quantifies the heterogeneity of carbon materials. Sci. Rep. 2018, 8, 1–7. [Google Scholar] [CrossRef] [PubMed]
- Lambrechts, A.; Blanch-Perez-del-Notario, C. Hyperspectral Imaging for Textile Sorting and Recycling in Industry; 2016; Available online: http://www.resyntex.eu/images/downloads/HSI_2016_paper_final.pdf (accessed on 5 March 2020).
- Bureau, I. A Consumer Goods Product Comprising Chitin Nanofibrils, Lignin And A Polymer Or Co-Polymer Konsumgüterprodukt. U.S. Patent Application 14/854,121, 17 March 2016. [Google Scholar]
- Sarazyn, J. Method Of Preparation Of Chitin And Active Principle Complexes And Complexes Obtaned. U.S. Patent Application 14/111,886, 30 January 2014. [Google Scholar]
- Priyashantha, H.; Höjer, A.; Saedén, K.H.; Lundh, Å.; Johansson, M.; Bernes, G.; Geladi, P.; Hetta, M. Use of near-infrared hyperspectral (NIR-HS) imaging to visualize and model the maturity of long-ripening hard cheeses. J. Food Eng. 2020, 264, 109687. [Google Scholar] [CrossRef]
- Sacré, P.Y.; Lebrun, P.; Chavez, P.F.; De Bleye, C.; Netchacovitch, L.; Rozet, E.; Klinkenberg, R.; Ziemons, E. A new criterion to assess distributional homogeneity in hyperspectral images of solid pharmaceutical dosage forms. Anal. Chim. Acta 2014, 818, 7–14. [Google Scholar] [CrossRef] [PubMed]
- Yang, H.T.; Jiang, P. Scalable fabrication of superhydrophobic hierarchical colloidal arrays. J. Colloid Interface Sci. 2010, 352, 558–565. [Google Scholar] [CrossRef] [PubMed]
- Mitsutake, H.; Castro, S.R.; de Paula, E.; Poppi, R.J.; Rutledge, D.N.; Breitkreitz, M.C. Comparison of different chemometric methods to extract chemical and physical information from Raman images of homogeneous and heterogeneous semi-solid pharmaceutical formulations. Int. J. Pharm. 2018, 552, 119–129. [Google Scholar] [CrossRef]
- Suhandy, D.; Yulia, M. The Use of Partial Least Square Regression and Spectral Data in UV-Visible Region for Quantification of Adulteration in Indonesian Palm Civet Coffee. Int. J. Food Sci. 2017, 2017, 6274178. [Google Scholar] [CrossRef]
- Li, X.; Sun, C.; Zhou, B.; He, Y. Determination of Hemicellulose, Cellulose and Lignin in Moso Bamboo by Near Infrared Spectroscopy. Sci. Rep. 2015, 5, 17210. [Google Scholar] [CrossRef]
- Biniaś, W.; Biniaś, D. Application of ftnir spectroscopy for evaluation of the degree of deacetylation of chitosan fibres. Fibres Text. East. Eur. 2015, 23, 10–18. [Google Scholar]
- Cloutis, E.; Norman, L.; Cuddy, M.; Mann, P. Spectral reflectance (350-2500 nm) properties of historic artists’ pigments. II. Red-orange-yellow chromates, jarosites, organics, lead(-tin) oxides, sulphides, nitrites and antimonates. J. Near Infrared Spectrosc. 2016, 24, 119–140. [Google Scholar] [CrossRef]
- Hayem-Ghez, A.; Ravaud, E.; Boust, C.; Bastian, G.; Menu, M.; Brodie-Linder, N. Characterizing pigments with hyperspectral imaging variable false-color composites. Appl. Phys. A Mater. Sci. Process. 2015, 121, 939–947. [Google Scholar] [CrossRef]
- Elsoud, M.M.A.; el Kady, E.M. Current trends in fungal biosynthesis of chitin and chitosan. Bull. Natl. Res. Cent. 2019, 43, 1–12. [Google Scholar] [CrossRef]


| Substrates | Set of Samples | Number of Samples | Substrate Base + Active Compounds + Binders |
|---|---|---|---|
| Chitosan | Set 1 | Sample 1 | Chitosan + 2.68 g CN-NL/GA + 2% Silica |
| Set 2 | Sample 2 | Chitosan + 6 g CN-NL/GA + 2% Silica | |
| Set 3 | Sample 3 Samples 4 Sample 5 | Chitosan + 5 g (50% CN-NL/GA + 50% waxy bleached Shellac) + 2% Silica Chitosan + 5.4 g (50% CN-NL/GA + 50% waxy bleached Shellac) + 2% Silica Chitosan + 7 g (50% CN-NL/GA + 50% waxy bleached Shellac) + 2% Silica | |
| Set 4 | Sample 6 Sample 7 Sample 8 | Chitosan + 2.016 g (50% CN-NL/GA + 50% dewaxed bleached Shellac) + 2% silica Chitosan + 5.2 g (50% CN-NL/GA +50% dewaxed bleached Shellac) + 2% silica Chitosan + 5.6 g (50% CN-NL/GA + 50% dewaxed bleached Shellac) + 2% silica | |
| Set 5 | Sample 9 Sample 10 Sample 11 | Chitosan + 6.5 g (50% CN-NL/GA + 50% PEG) + 2% silica Chitosan + 7.6 g (50% CN-NL/GA + 50% PEG) + 2% silica Chitosan + 8.2 g (50% CN-NL/GA + 50% PEG) + 2% silica | |
| Pullulan | set 6 | Sample 12 Sample 13 | Pullulan + 8% CN-NL Pullulan only |
| Pretreatments | LVs | R2Cal | R2CV | RMSEC | RMSECV |
|---|---|---|---|---|---|
| non pretreatment | 3 | 0.721 | 0.278 | 1.335 | 2.435 |
| smoothing + normalize + mean centre | 3 | 0.973 | 0.743 | 0.418 | 1.485 |
| smoothing + SNV + mean centre | 3 | 0.977 | 0.624 | 0.384 | 4.820 |
| smoothing + baseline + mean centre | 3 | 0.983 | 0.857 | 0.333 | 0.993 |
© 2020 by the authors. Licensee MDPI, Basel, Switzerland. This article is an open access article distributed under the terms and conditions of the Creative Commons Attribution (CC BY) license (http://creativecommons.org/licenses/by/4.0/).
Share and Cite
A. Obisesan, K.; Neri, S.; Bugnicourt, E.; Campos, I.; Rodriguez-Turienzo, L. Determination and Quantification of the Distribution of CN-NL Nanoparticles Encapsulating Glycyrrhetic Acid on Novel Textile Surfaces with Hyperspectral Imaging. J. Funct. Biomater. 2020, 11, 32. https://doi.org/10.3390/jfb11020032
A. Obisesan K, Neri S, Bugnicourt E, Campos I, Rodriguez-Turienzo L. Determination and Quantification of the Distribution of CN-NL Nanoparticles Encapsulating Glycyrrhetic Acid on Novel Textile Surfaces with Hyperspectral Imaging. Journal of Functional Biomaterials. 2020; 11(2):32. https://doi.org/10.3390/jfb11020032
Chicago/Turabian StyleA. Obisesan, Kudirat, Simona Neri, Elodie Bugnicourt, Inmaculada Campos, and Laura Rodriguez-Turienzo. 2020. "Determination and Quantification of the Distribution of CN-NL Nanoparticles Encapsulating Glycyrrhetic Acid on Novel Textile Surfaces with Hyperspectral Imaging" Journal of Functional Biomaterials 11, no. 2: 32. https://doi.org/10.3390/jfb11020032
APA StyleA. Obisesan, K., Neri, S., Bugnicourt, E., Campos, I., & Rodriguez-Turienzo, L. (2020). Determination and Quantification of the Distribution of CN-NL Nanoparticles Encapsulating Glycyrrhetic Acid on Novel Textile Surfaces with Hyperspectral Imaging. Journal of Functional Biomaterials, 11(2), 32. https://doi.org/10.3390/jfb11020032