Diagnosis of the Severity of Fusarium Head Blight of Wheat Ears on the Basis of Image and Spectral Feature Fusion

 , , and
Abstract
1. Introduction
2. Materials and Methods
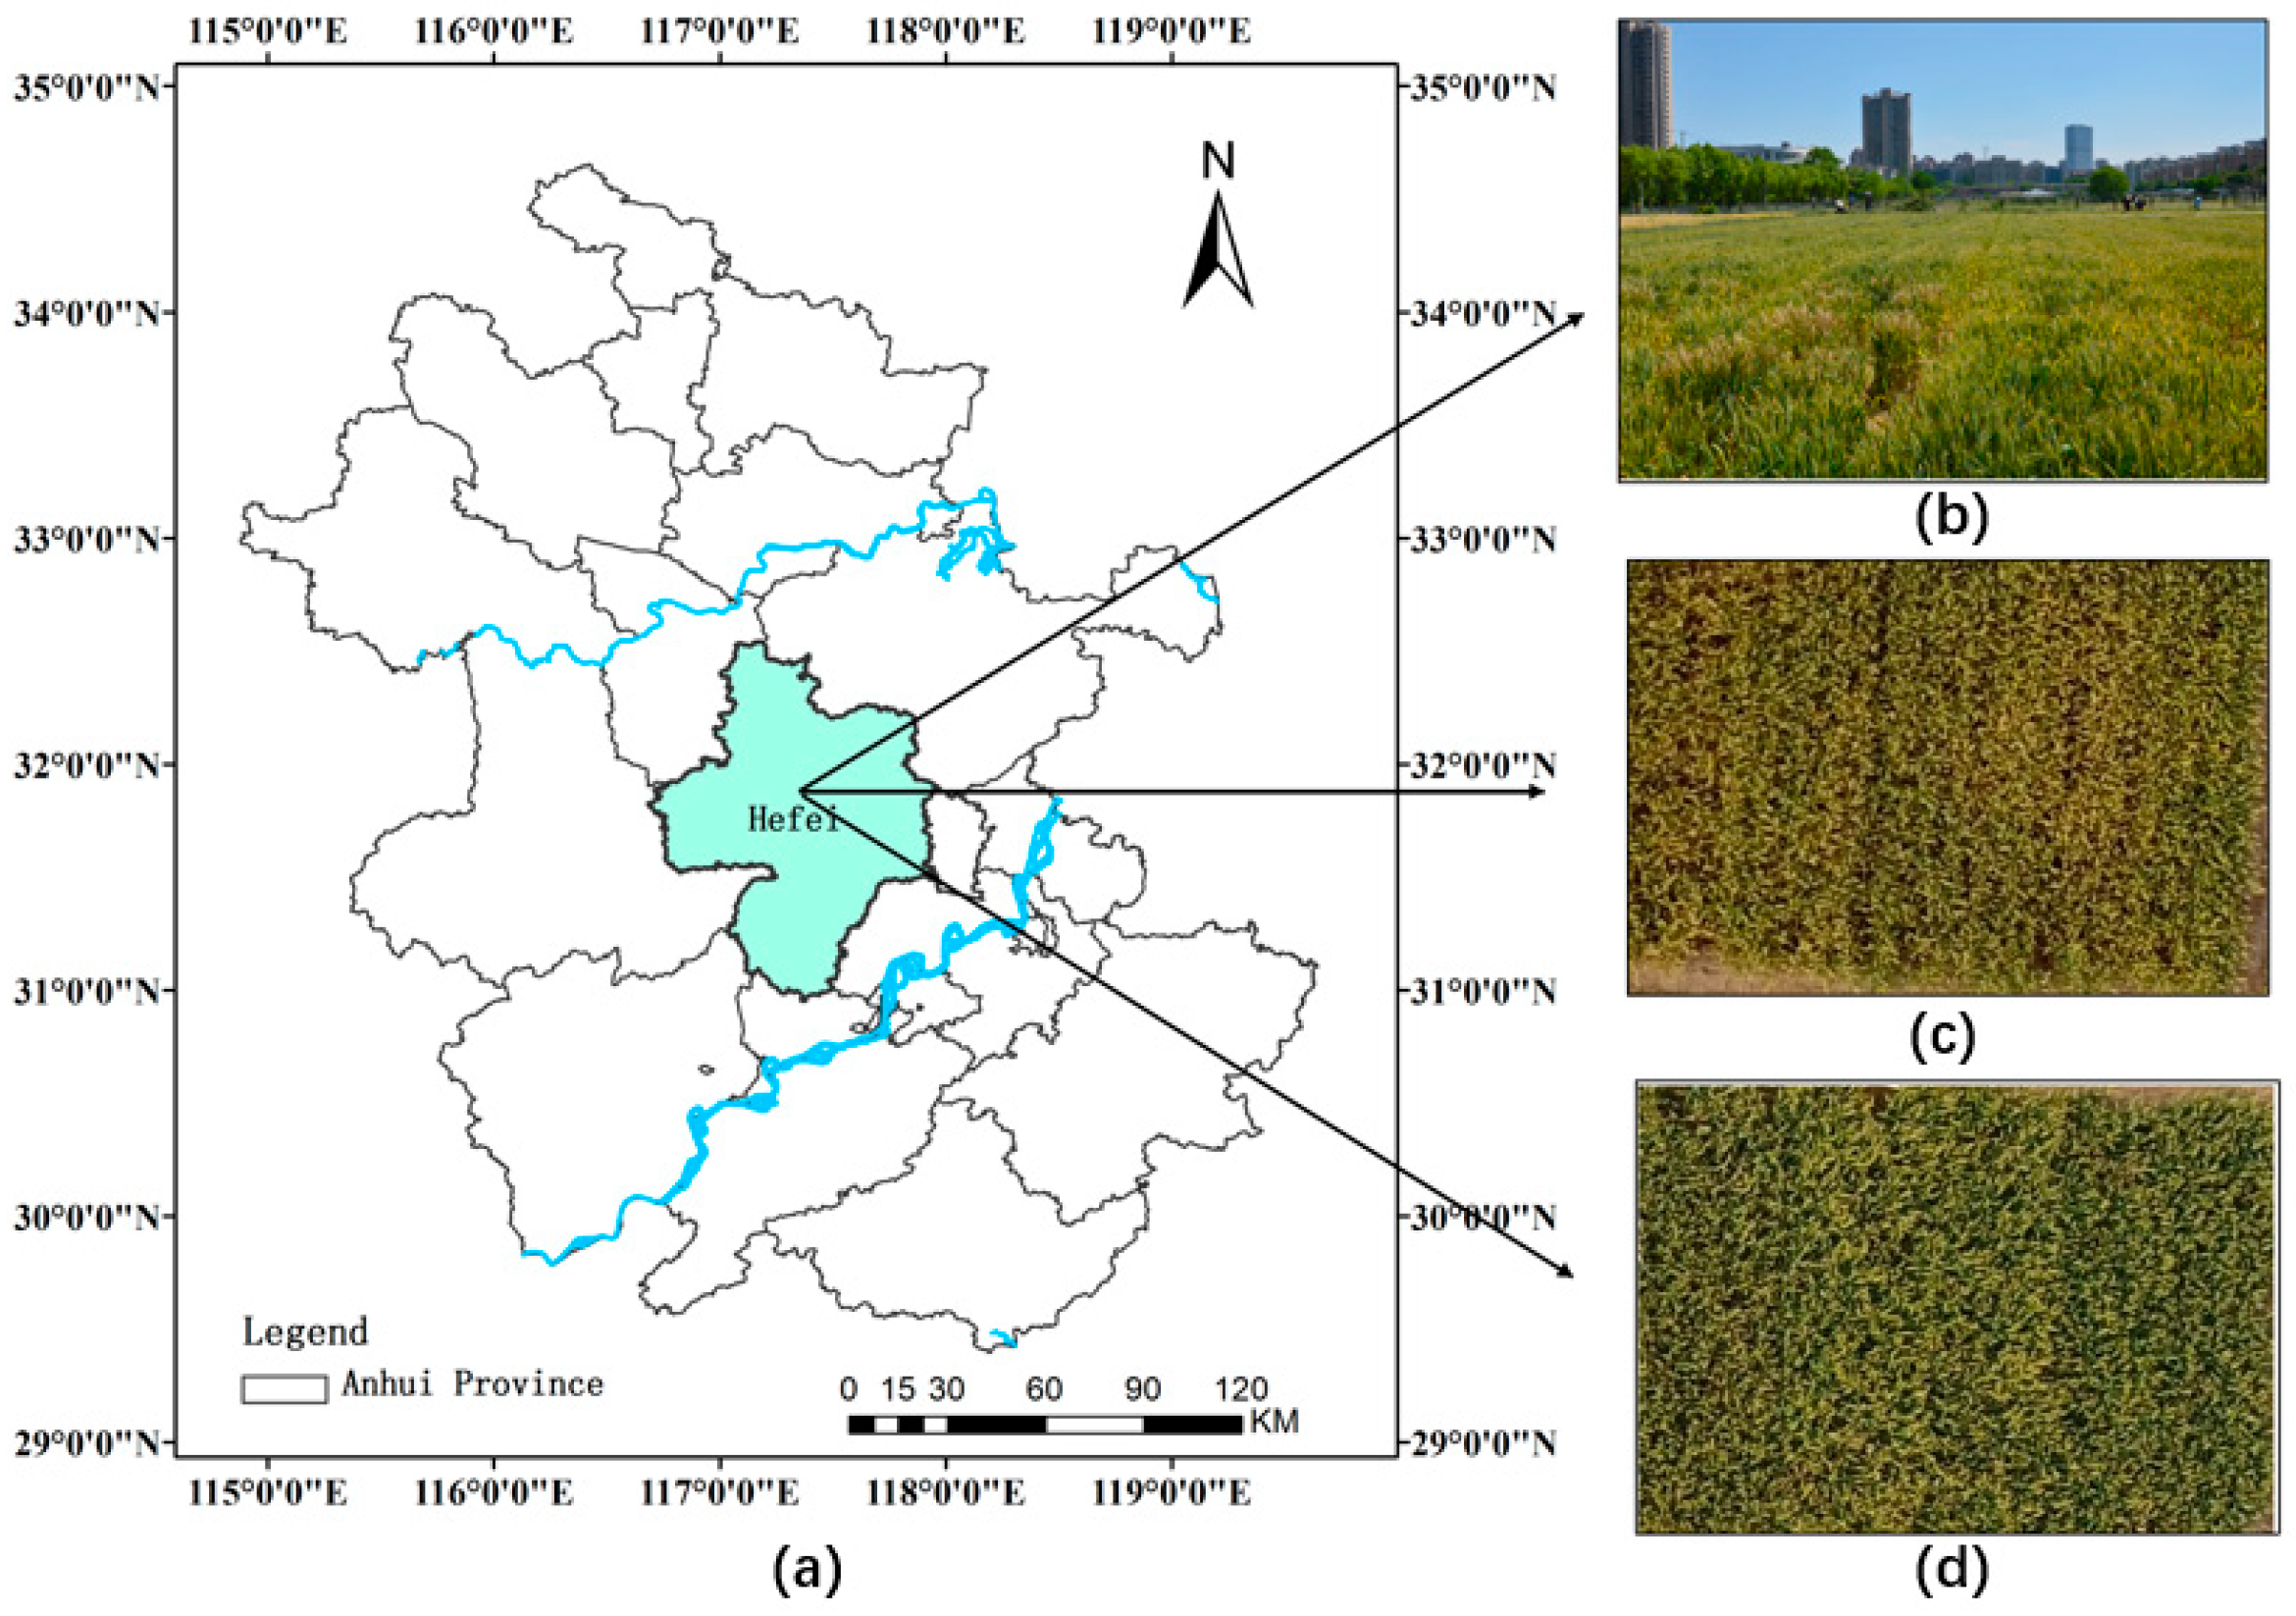
2.1. Study Area and Data Collection
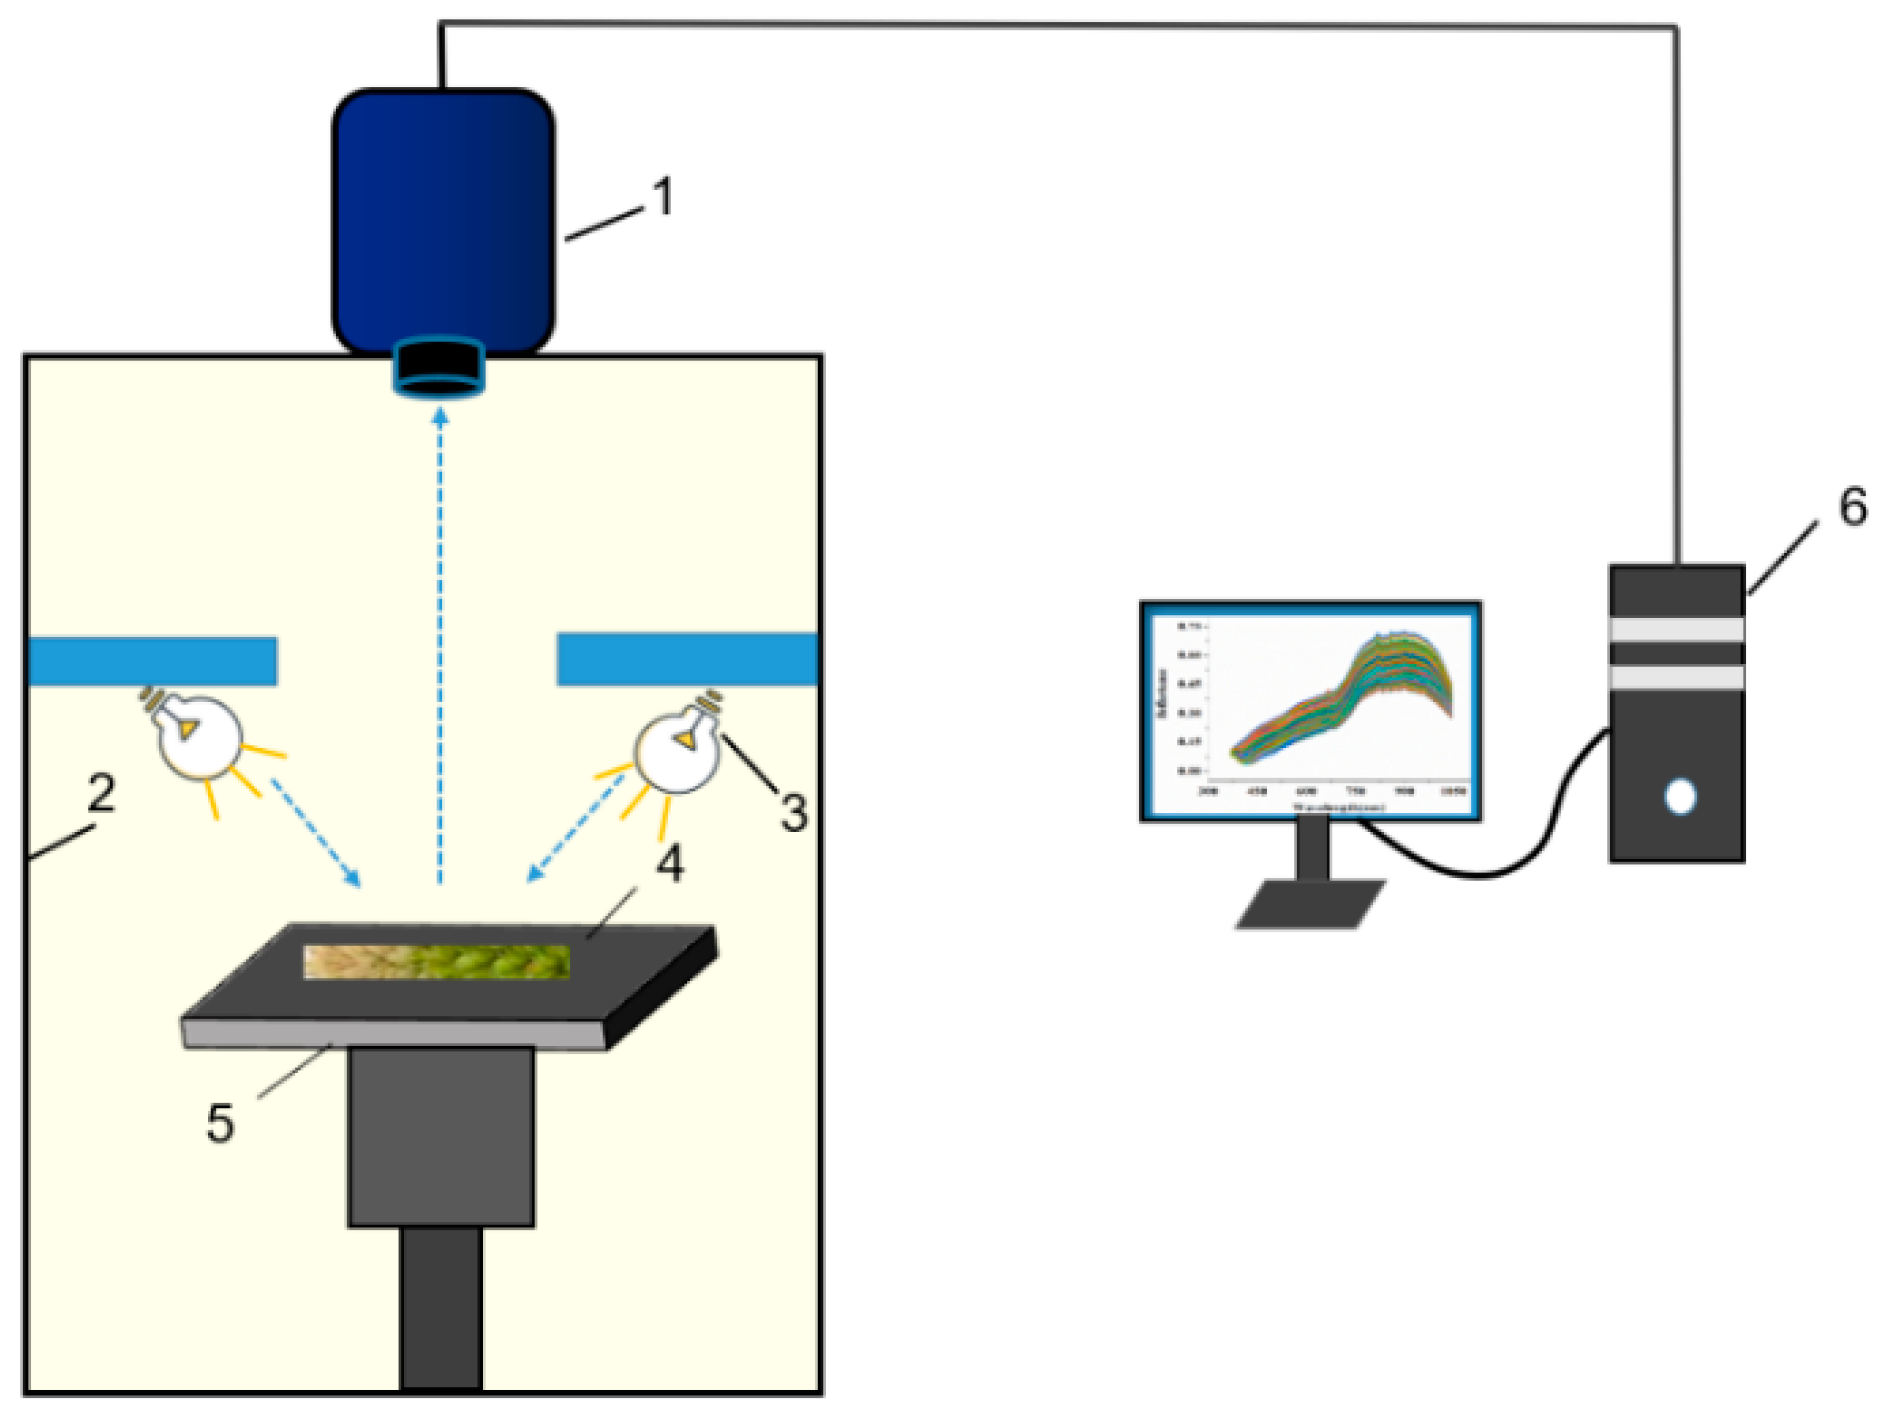
2.2. Acquisition and Preprocessing of Hyperspectral Images
2.3. Data Analysis Methodology
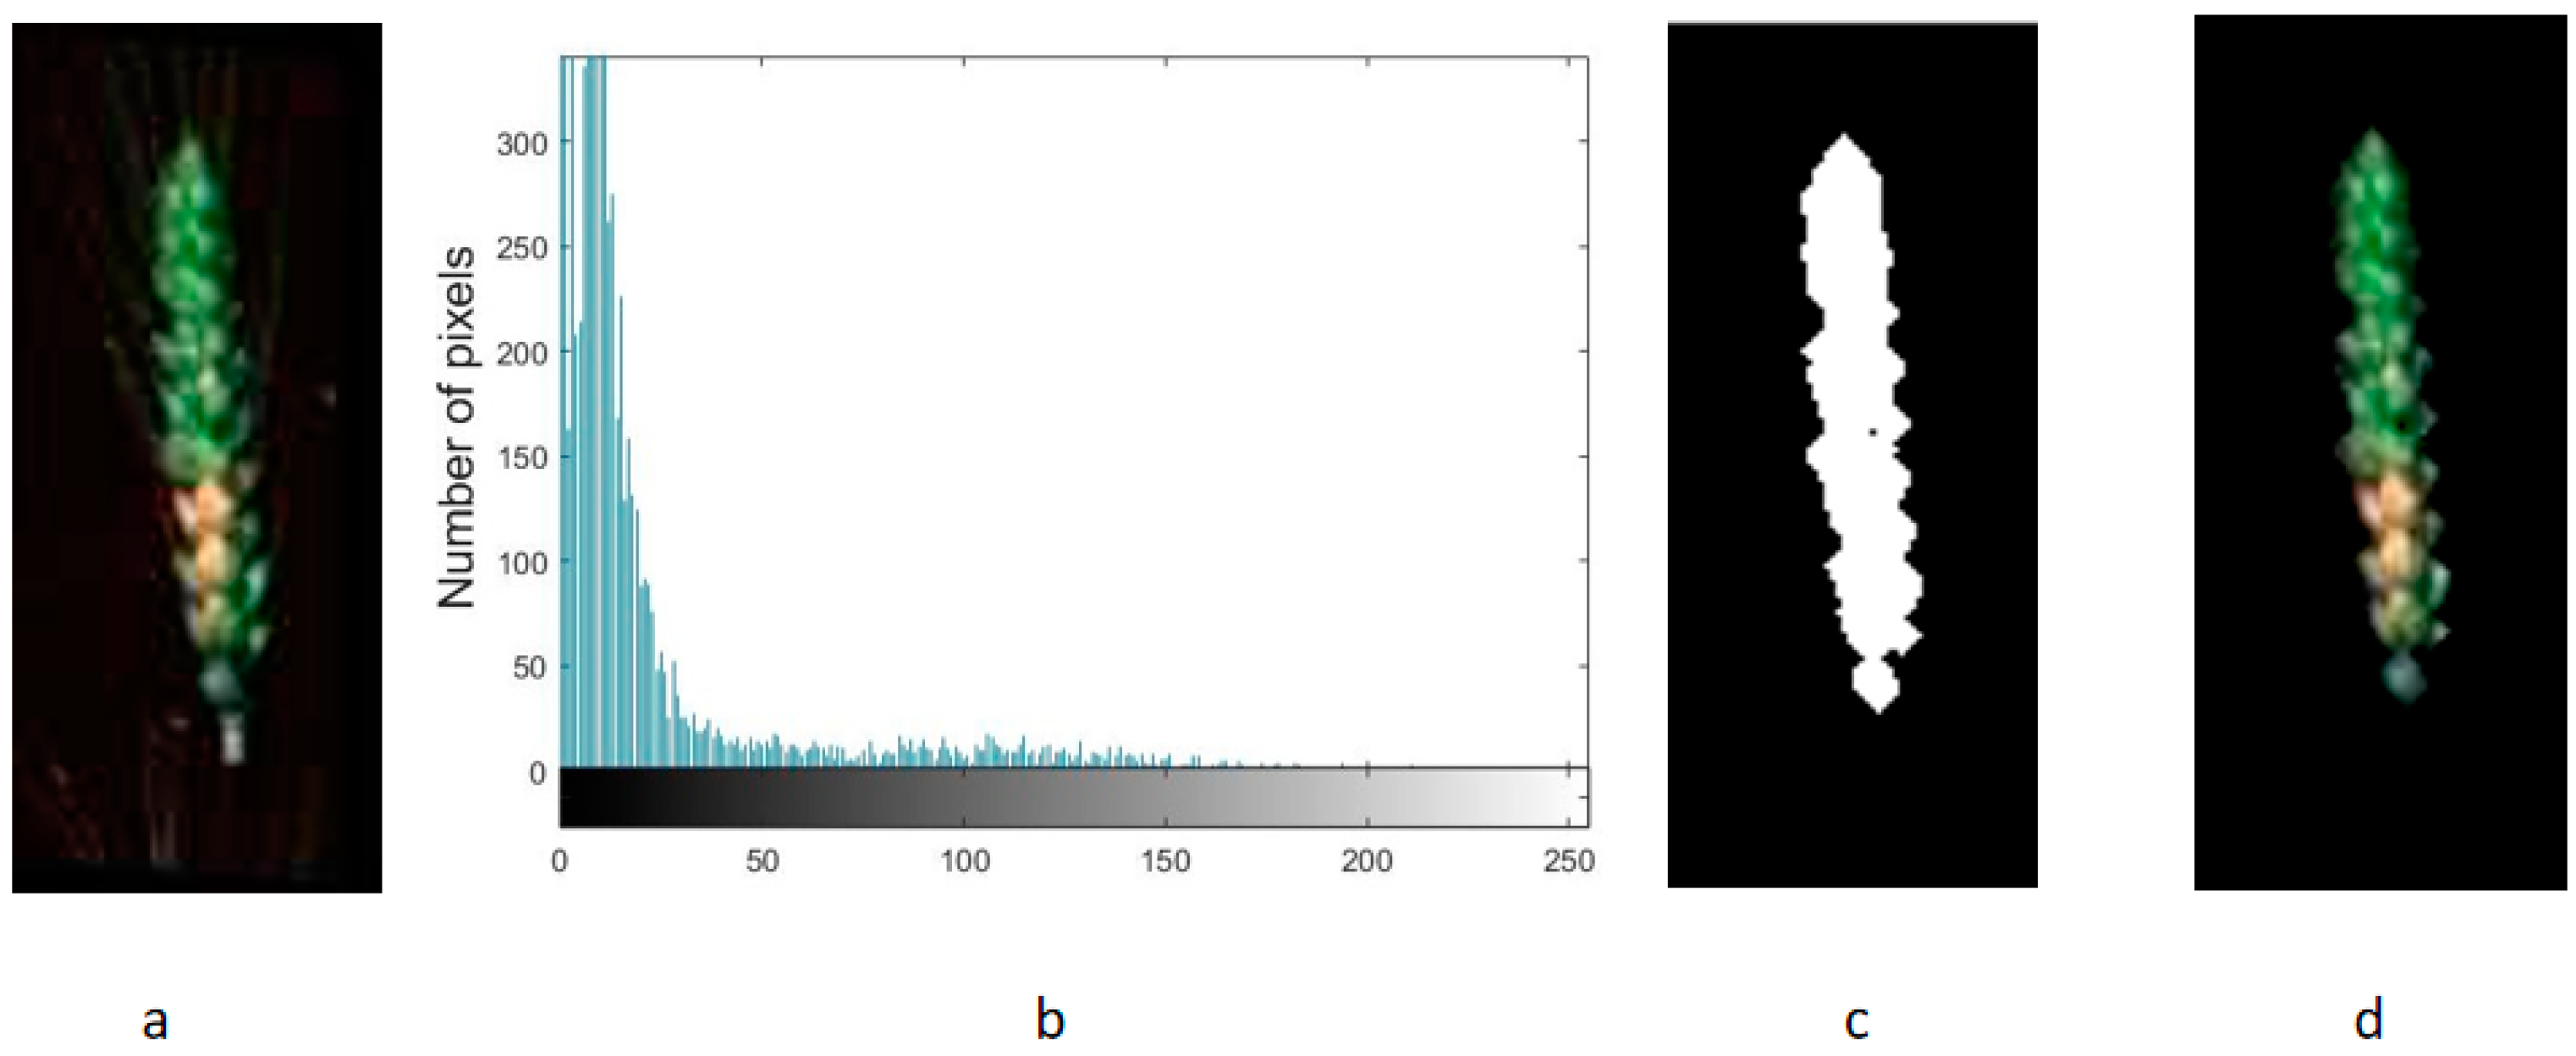
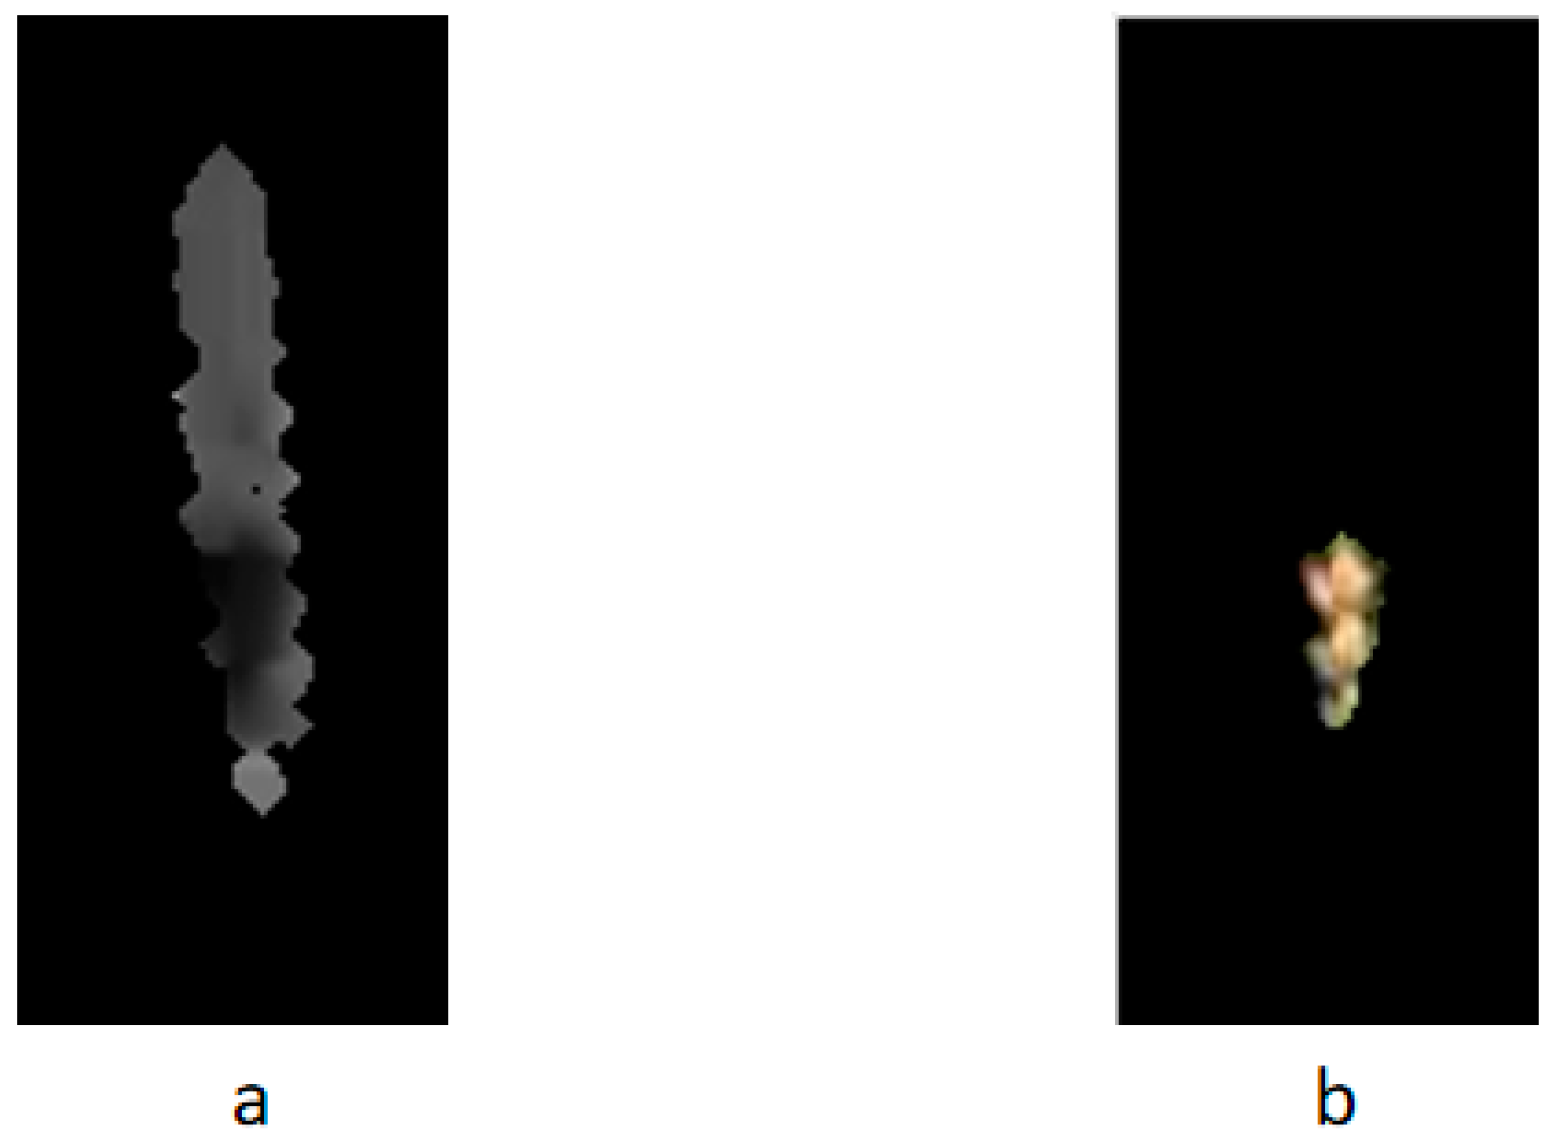
2.3.1. Image Segmentation and Severity Calculation
2.3.2. Spectral Feature Extraction
2.3.3. Texture Feature Extraction
2.3.4. Color Feature Extraction
2.3.5. PSO-SVM Modeling
- (1)
- Initialize the particle population, including random positions and velocities.
- (2)
- Find the optimal solution through iteration. In each iteration, the particle updates itself by tracking two “extreme values” (pbest, gbest).
- (3)
- After finding these two optimal values, the particles follow their own speed and position.
- (4)
- Determine whether the maximum number of iterations initially set was met, and the optimal penalty factor and kernel parameters were obtained when the conditions were met.
- (5)
- Classification of wheat scab mildew severity using parameter optimized SVM model.
3. Results
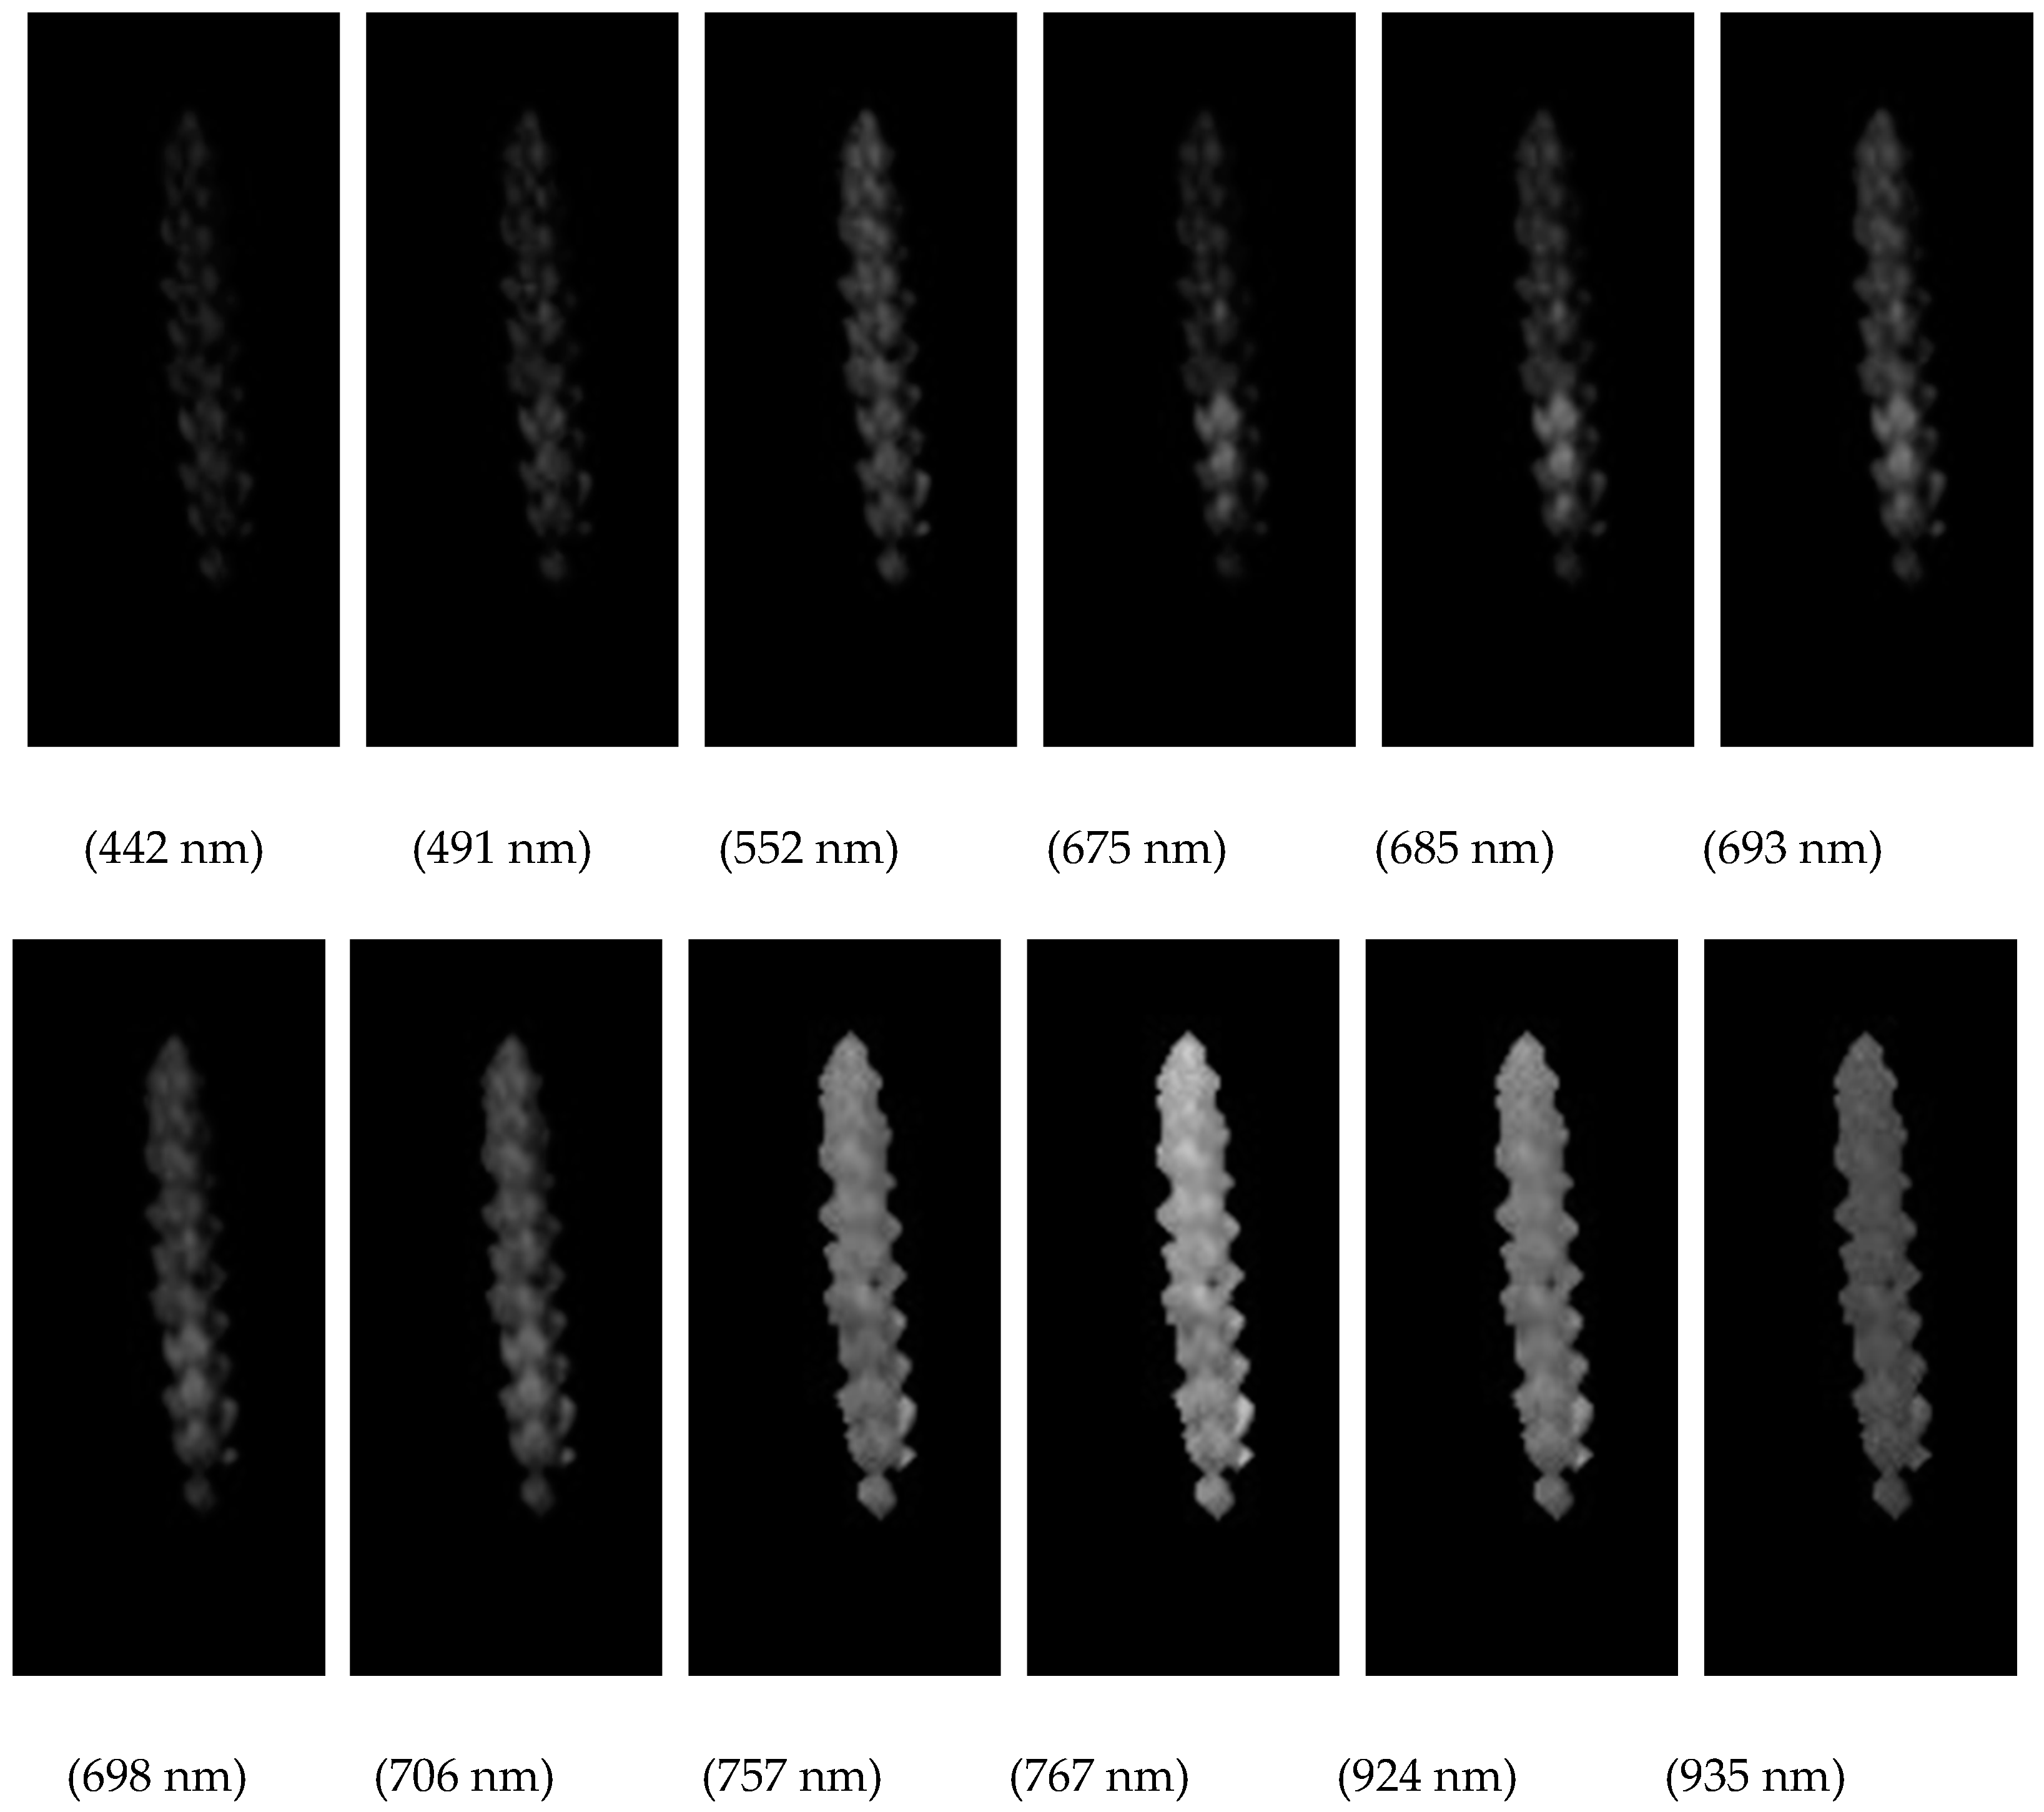
3.1. Image Segmentation
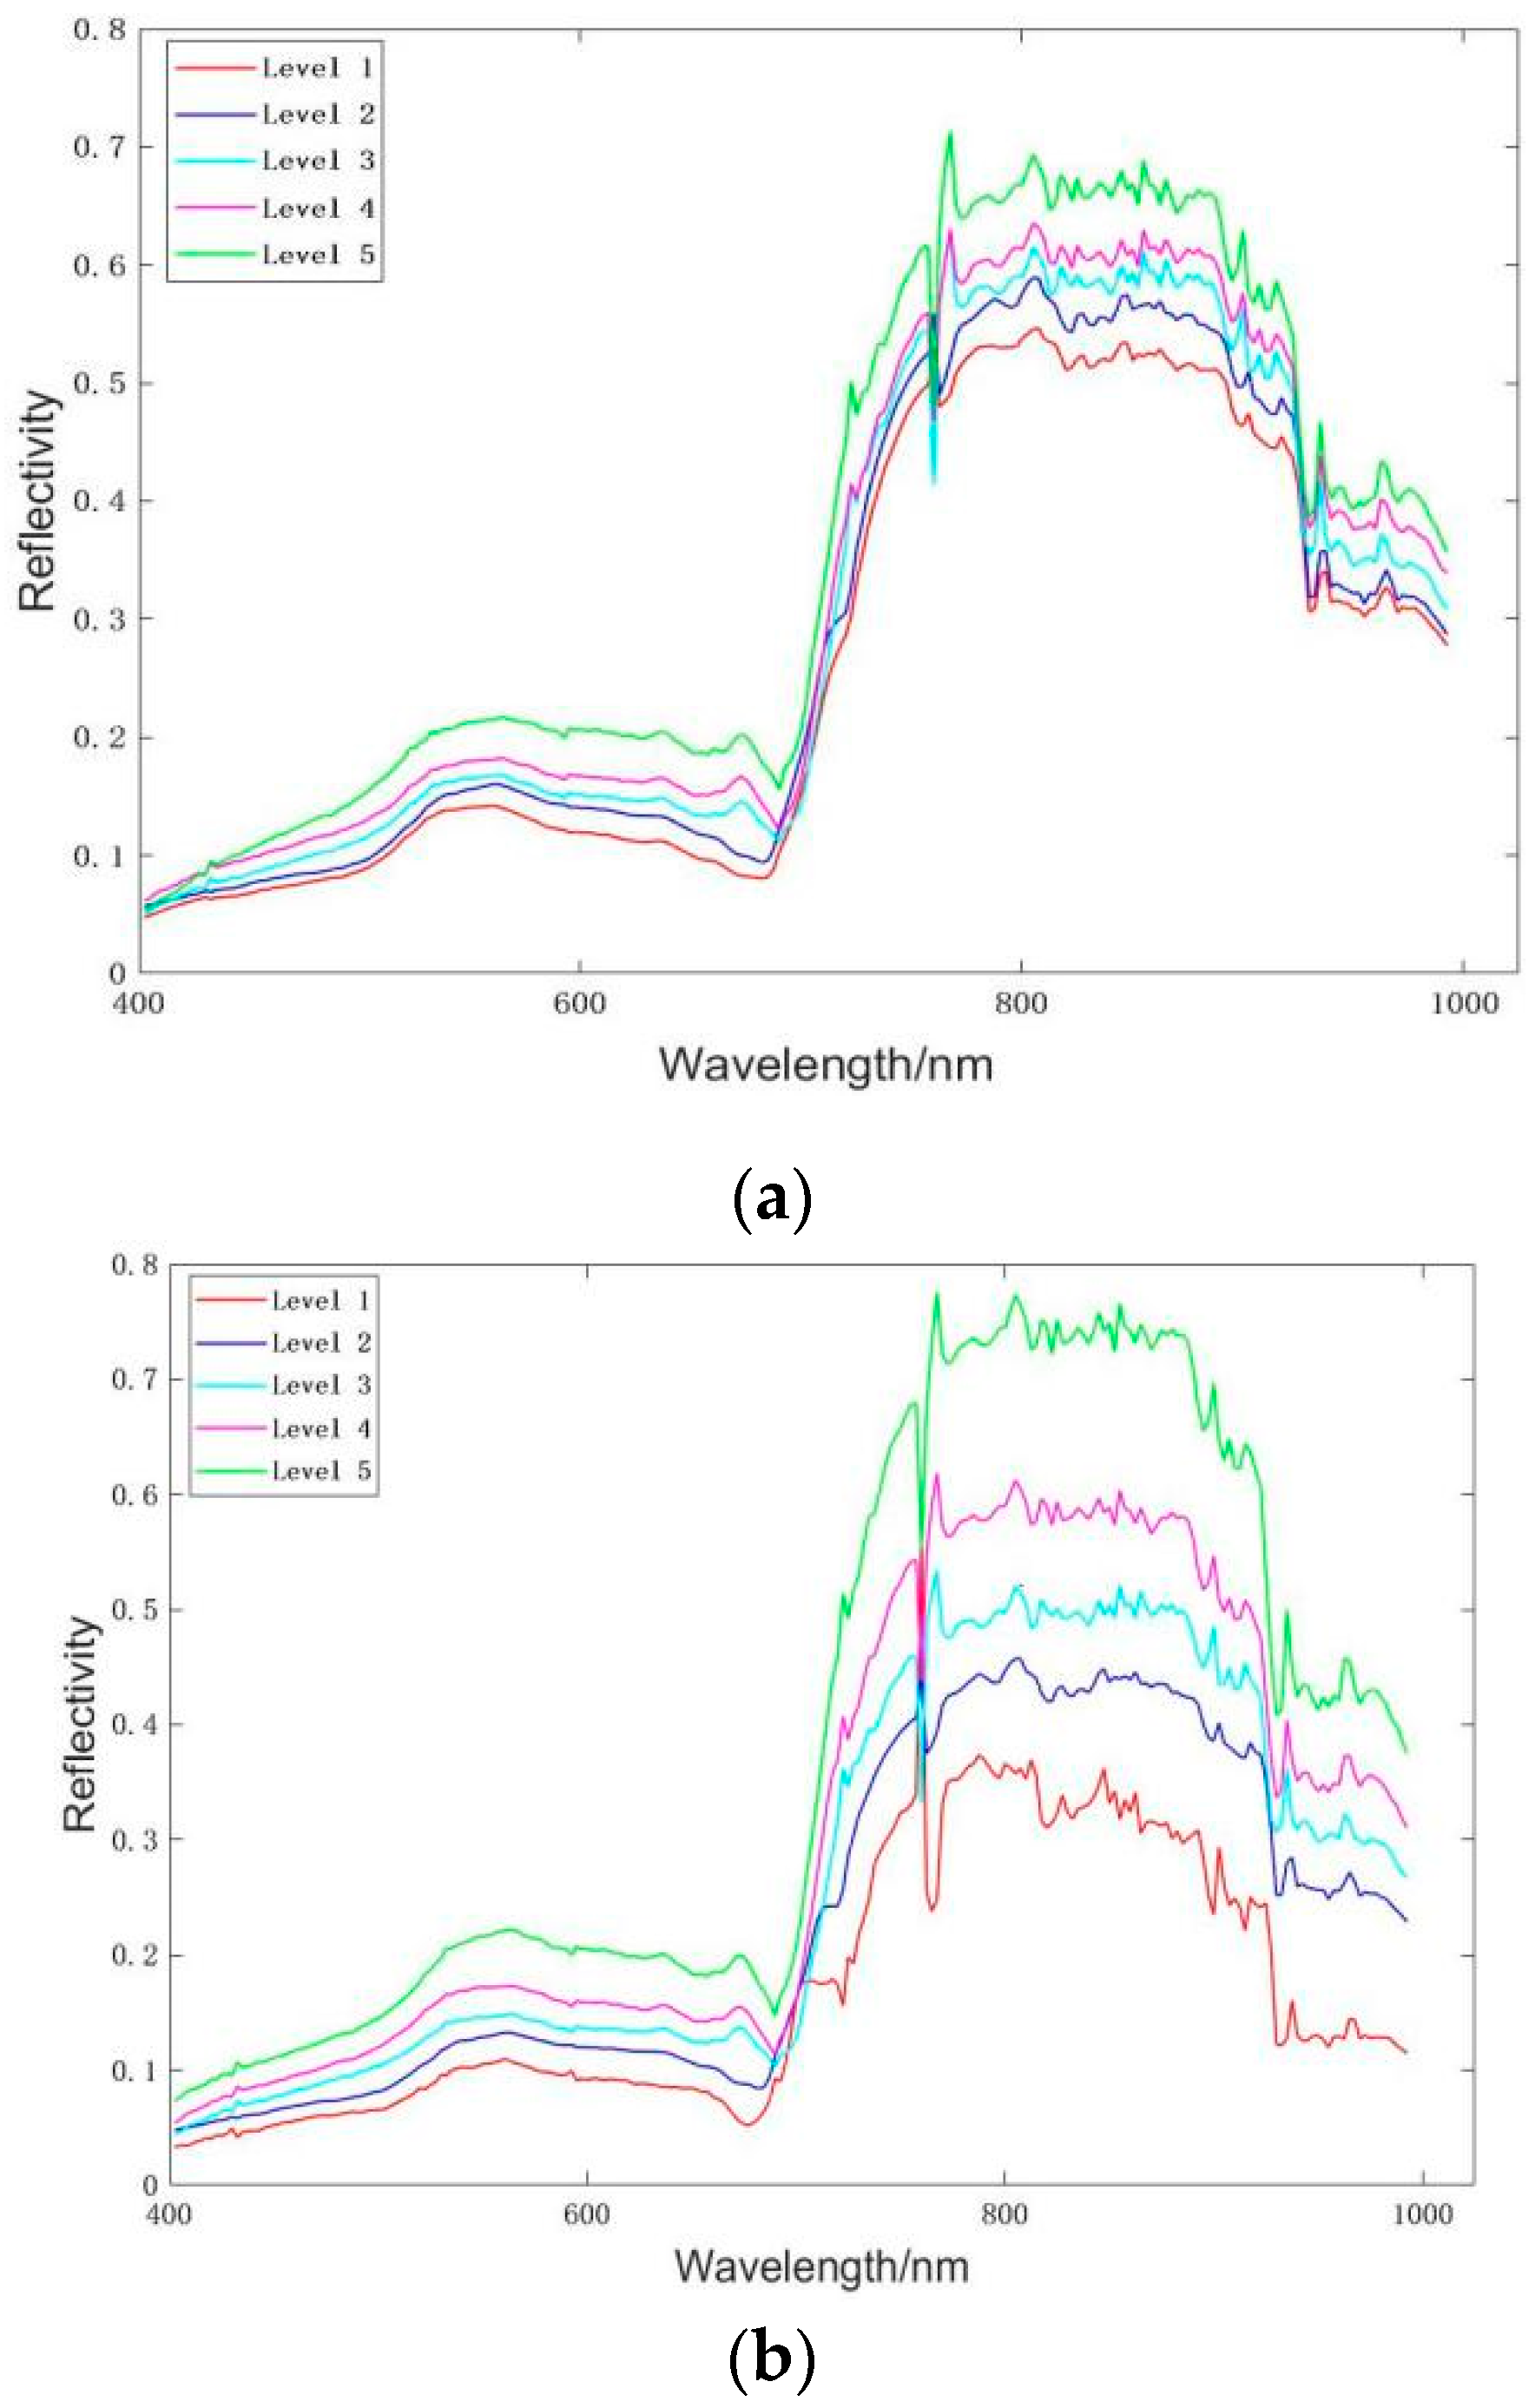
3.2. Spectral Analysis of Wheat Ears with Different Severity
3.3. Feature Variable Extraction
3.3.1. Feature Wavelength Extraction
3.3.2. Texture Feature Extraction
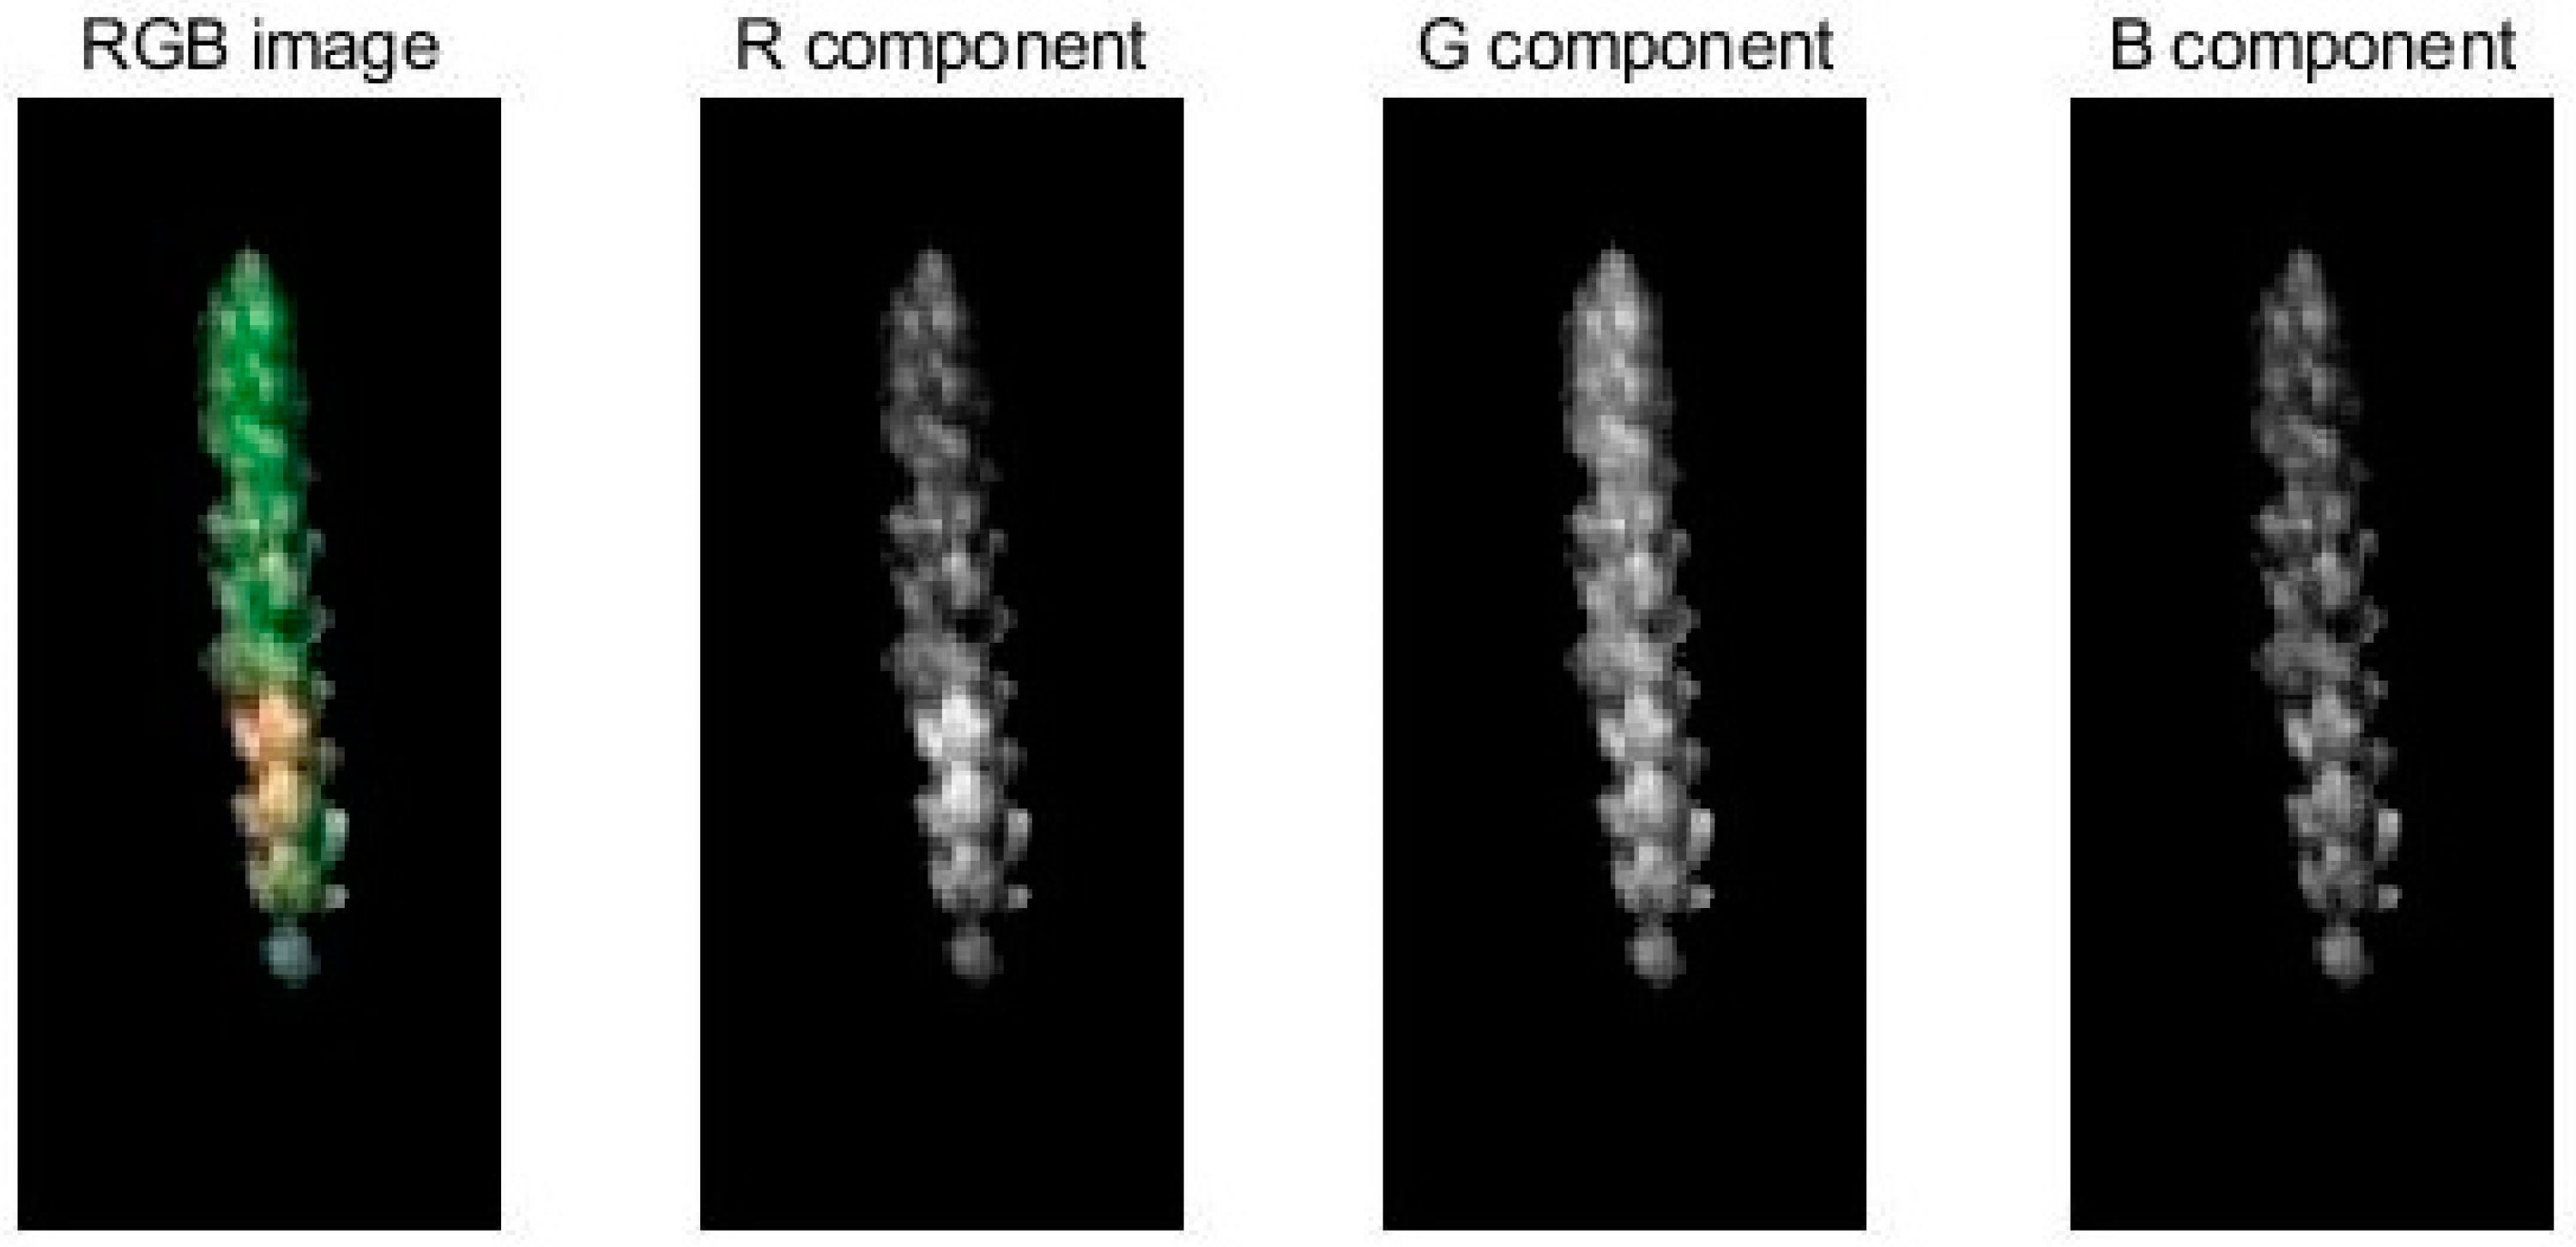
3.3.3. Color Feature Extraction
3.4. Variable Screening and Model Building
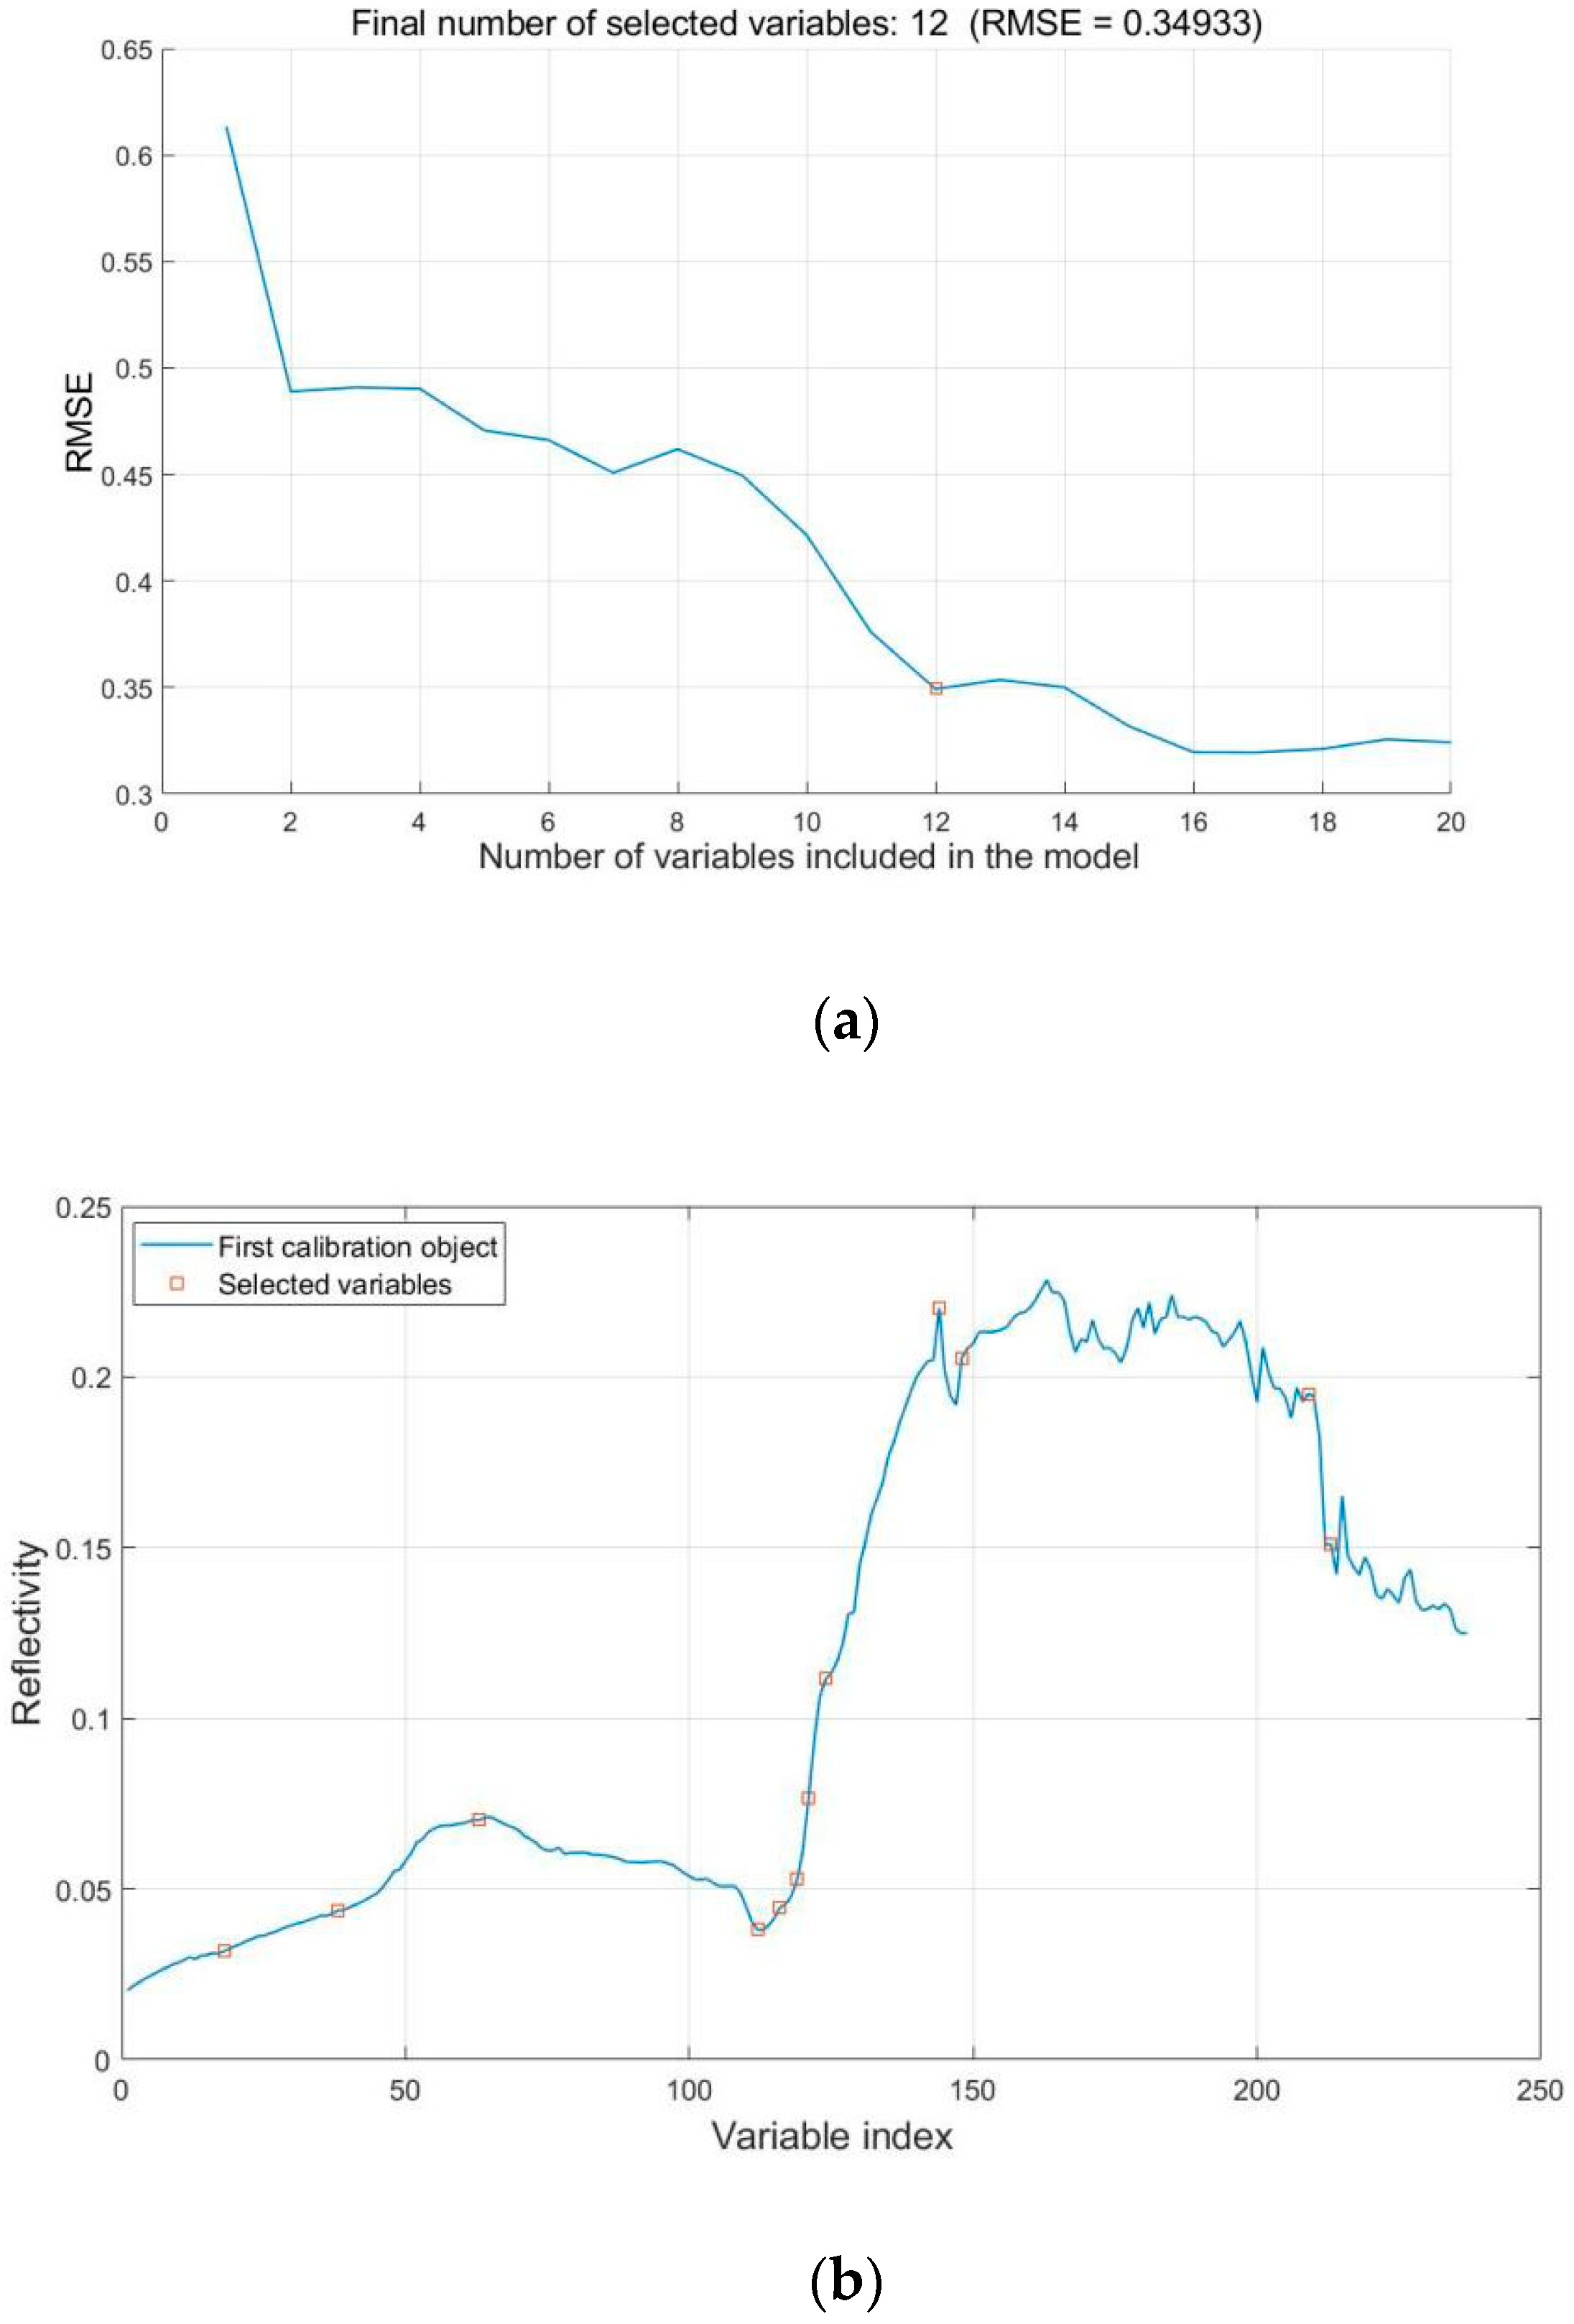
3.4.1. Selection of Characteristic Variables
3.4.2. Modelling
4. Discussion
5. Conclusions
Author Contributions
Funding
Conflicts of Interest
References
- Goswami, R.S.; Kistler, H.C. Heading for disaster: Fusarium graminearum on cereal crops. Mol. Plant Pathol. 2010, 5, 515–525. [Google Scholar] [CrossRef] [PubMed]
- Dillmacky, R.; Jones, R.K. The effect of previous crop residues and tillage on Fusarium head blight of wheat. Plant Dis. 2000, 84, 71–76. [Google Scholar] [CrossRef] [PubMed]
- Jin, X.; Jie, L.; Wang, S.; Qi, H.; Li, S. Classifying wheat hyperspectral pixels of healthy and Fusarium head blight disease using a deep neural network in the wild field. Remote Sens. 2018, 10, 395. [Google Scholar] [CrossRef]
- Steiner, B.; Buerstmayr, M.; Michel, S.; Schweiger, W.; Lemmens, M.; Buerstmayr, H. Breeding strategies and advances in line selection for Fusarium head blight resistance in wheat. Trop. Plant Pathol. 2017, 42, 165–174. [Google Scholar] [CrossRef]
- Miroslava, C.C.; Wang, L.; Lily, F.; Kerry, B.; Nadine, M.; Lan, B.; Pierre, R.F. Metabolic biomarker panels of response to Fusarium head blight infection in different wheat varieties. PLoS ONE 2016, 11, e0153642. [Google Scholar]
- Peñuelas, J.; Gamon, J.; Fredeen, A.; Merino, C. Reflectance indices associated with physiological changes in nitrogen- and water-limited sunflower leaves. Remote Sens. Environ. 1994, 48, 135–146. [Google Scholar] [CrossRef]
- Zhang, N.; Pan, Y.; Feng, H. Development of Fusarium head blight classification index using hyperspectral microscopy images of winter wheat spikelets. Biosyst. Eng. 2019, 86, 83–89. [Google Scholar] [CrossRef]
- Huang, Y.; Qing, Y. Environmental effects of fine agriculture. JAE 2009, S2, 250–254. [Google Scholar]
- Huang, L.; Zhang, Q.; Zhang, D. Early diagnosis of wheat powdery mildew in Relief-F screening band. Infrared Laser Eng. 2018, 47, 1–8. [Google Scholar]
- Barbedo, J.G.A.; Tibola, C.S.; Fernandes, J.M.C. Detection Fusarium head blight in wheat kernels using hyperspectral imaging. Biosyst. Eng. 2016, 131, 65–76. [Google Scholar] [CrossRef]
- Cambaza, E.; Koseki, S.; Kawamura, S. Why RGB imaging should be used to analyze Fusarium graminearum growth and estimate deoxynivalenol contamination. Methods Protoc. 2019, 2, 25. [Google Scholar] [CrossRef]
- Sena, D.G., Jr.; Pinto, F.A.C.; Queiroz, D.M.; Viana, P.A. Fall armyworm damaged maize plant identification using digital images. Biosys. Eng. 2013, 85, 449–454. [Google Scholar] [CrossRef]
- Qiu, R.; Yang, C.; Moghimi, A. Detection of fusarium head blight in wheat using a deep neural network and color imaging. Remote Sens. 2019, 11, 2658. [Google Scholar] [CrossRef]
- Zhang, D.; Wang, D.; Gu, C. Using neural network to identify the severity of wheat Fusarium head blight in the field environment. Remote Sens. 2019, 11, 2375. [Google Scholar] [CrossRef]
- Kuenzer, C.; Knauer, K. Remote sensing of rice crop areas. Remote Sens. 2013, 34, 2101–2139. [Google Scholar] [CrossRef]
- Ravikanth, L.; Jayas, D.S.; White, N.D.G.; Fields, P.G.; Sun, D.W. Extraction of spectral information from hyperspectral data and application of hyperspectral imaging for food and agricultural products. Food Bioprocess Technol. 2017, 10, 1–33. [Google Scholar] [CrossRef]
- Liu, F.; Wang, H.Y. Identification of yellow rice wine varieties using visible/near infrared spectroscopy. Spectrosc. Spect. Anal. 2008, 28, 586–589. [Google Scholar]
- Chai, A.L.; Liao, N.L.; Tian, L.H. Identification of cucumber lesions based on hyperspectral imaging and discriminant analysis. Spectrosc. Spect. Anal. 2010, 30, 1357–1361. [Google Scholar]
- Du, Y.; Chen, X.; Liang, K. Identification of content grade of deoxynivalenol in wheat based on hyperspectral images. Sci. Technol. Food Ind. 2016, 17, 54–58. [Google Scholar]
- Ding, J.; Liang, K.; Han, D. Prediction of vomiting toxin content in near infrared hyperspectral wheat by extracting ICO—SPA features. J. Triticeae Crops. 2019, 39, 867–876. [Google Scholar]
- Deng, X.; Zhu, Q.; Huang, M. Single grain identification of hyperspectral images of rice seed varieties with fusion spectra, texture and morphological characteristics. Las Optoelect Prog. 2015, 52, 1–7. [Google Scholar]
- Lu, B.; Sun, J.; Mao, H. Identification of lettuce disease by fusion of hyperspectral and image features. Jiangsu J. Agric. Sci. 2018, 34, 1254–1259. [Google Scholar]
- Patil, J.K.; Kumar, R. Analysis of content based image retrieval for plant leaf diseases using color, shape and texture features. Eng. Agric. Environ. Food 2016, 10, 69–78. [Google Scholar] [CrossRef]
- Michael, R.O.; Eric, G.; Samera, H. Quantification of elemental and organic carbon in atmospheric particulate matter using color space sensing—Hue, saturation, and value (HSV) coordinates. Sci. Total Environ. 2016, 548–549. [Google Scholar]
- GB/T 15796-2011. Technical Specification for Detection and Reporting of Wheat Scab. Available online: https://www.doc88.com/p-4753468301833.html (accessed on 15 April 2020).
- Xu, S.; Lu, J.; Lu, J.P. Identification techniques and evaluation criteria for resistance to scab in wheat varieties. Acta Agric. Shanghai 1985, 27–34. [Google Scholar]
- Svante, W.; Henrik, A. Orthogonal signal correction of near-infrared spectra. Chemometr. Intell. Lab. 1998, 44, 175–185. [Google Scholar]
- Cheng, J.; Sun, D.; Pu, H. Combining the genetic algorithm and successive projection algorithm for the selection of feature wavelengths to evaluate exudative characteristic in frozen-thawed fish muscle. Food Chem. 2016, 197, 855–863. [Google Scholar] [CrossRef]
- Zhang, Z.; Li, G.; Lin, L. EMD and SPA algorithms for detection of addition of benzoyl peroxide in flour by spectroscopy. Spectrosc. Spect. Anal. 2012, 32, 2815–2819. [Google Scholar]
- Hong, Y.; Hong, T.; Dai, F. Application of continuous projection algorithm in nondestructive testing of total acid in sugar orange. Trans. Chin. Soc. Agric. Eng. 2010, 26, 380–384. [Google Scholar]
- Arivazhagan, S.; Shebiah, R.N.; Ananthi, S.; Varthini, S.V. Detection of unhealthy region of plant leaves and classification of plant leaf diseases using texture features. Agric. Eng. Int. CIGR J. 2013, 15, 211–217. [Google Scholar]
- Haralick, R.M. Statistical and structural approaches to texture. Proc. IEEE 1979, 67, 786–804. [Google Scholar] [CrossRef]
- Zhang, X.; Cui, J.; Wang, W. A study for texture feature extraction of high-resolution satellite images based on a direction measure and gray level co-occurrence matrix fusion algorithm. Sensors 2017, 17, 1474. [Google Scholar] [CrossRef] [PubMed]
- Baraldi, A.; Parmiggiani, F. An investigation of the textual characteristics associated with gray level coocurrence matrix statistical parameters. IEEE Trans. Geosci. Remote Sens. 1995, 33, 293–304. [Google Scholar] [CrossRef]
- Zhao, C.; Li, Y.; Ma, Z. Analysis of texture features of breast pathological images based on gray level symbiosis matrix. China Medical Fquipment. 2018, 15, 5–8. [Google Scholar]
- Hou, Q.; Wang, F. Extraction of color image texture feature based on gray-level co-occurrence matrix. Remote Sens. Land Resour. 2013, 25, 26–32. [Google Scholar]
- Xu, J.; Croft, W.B. Improving the effectiveness of information retrieval with local content analysis. ACM Trans. Inf. Syst. 2000, 18, 79–112. [Google Scholar] [CrossRef]
- Yang, J.; Zhang, Y.; Cao, F. Color image retrieval approach based on color moments and multi-scale texture features. Comput. Sci. 2009, 36, 274–277. [Google Scholar]
- Kennedy, J.; Eberhart, R. Particle swarm optimization. In Proceedings of the ICNN’95-International Conference on Neural Networks, Perth, Australia, 27 November–1 December 1995. [Google Scholar]
- Ghaddar, B.; Naoum-Sawaya, J. High dimensional data classification and feature selection using support vector machines. Eur. J. Oper. Res. 2018, 265, 993–1004. [Google Scholar] [CrossRef]
- Zeng, N.; Qiu, H.; Wang, Z. A new switching-delayed-PSO-based optimized SVM algorithm for diagnosis of Alzheimer’s disease. Neurocomputing 2018, 320, 195–202. [Google Scholar] [CrossRef]
- Menezes, M.V.; Torres, L.C.; Braga, A.P. Width optimization of RBF kernels for binary classification of support vector machines: A density estimation-based approach. Pattern Recogn. Lett. 2019, 128, 1–7. [Google Scholar] [CrossRef]
- Li, W.; Huang, W.; Dong, Y. Estimation on winter wheat scab based on combination of temperature, humidity and remote sensing vegetation index. Trans. Chin. Soc. Agric. Eng. 2017, 33, 203–210. [Google Scholar]
- Muhovski, Y.; Batoko, H.; Jacquemin, J. Identification, characterization and mapping of differentially expressed genes in a winter wheat cultivar (Centenaire) resistant to Fusarium graminearum infection. Mol. Biol. Rep. 2012, 39, 9583–9600. [Google Scholar] [CrossRef] [PubMed]
- Somers, B.; Delalieux, S.; Verstraeten, W. An automated waveband selection technique for optimized hyperspectral mixture analysis. Int. J. Remote Sens. 2010, 31, 5549–5568. [Google Scholar] [CrossRef]
- Lu, J.; Zhou, M.; Gao, Y. Using hyperspectral imaging to discriminate yellow leaf curl disease in tomato leaves. Precis. Agric. 2018, 19, 379–394. [Google Scholar] [CrossRef]


| Texture and Color Features | Correlation Coefficient |
|---|---|
| Contrast | 0.1716 |
| Energy | 0.0755 |
| Entropy | 0.2588 |
| Correlation | −0.6969 |
| R-component first-order moment | 0.8480 |
| R-component second-order moment | 0.5428 |
| R-component third-order moment | 0.7723 |
| G-component first-order moment | 0.8097 |
| G-component second-order moment | 0.6028 |
| G-component third-order moment t | 0.6870 |
| B-component first-order moment | 0.4542 |
| B-component second-order moment | −0.2513 |
| B-component third-order moment | 0.2314 |
| Feature Information | Model Set Accuracy | Validation Set Accuracy | c, g |
|---|---|---|---|
| Spectral features | 85% | 84% | 20.2973, 14.6059 |
| Color features | 86% | 82% | 7.7751, 7.4498 |
| Texture features | 75% | 68% | 40.3025, 2.1227 |
| Spectral + Color features | 95% | 92% | 38.0265, 0.8672 |
| Spectral + Texture features | 82% | 78% | 3.9114, 3.1051 |
| Spectral + Color + Texture features | 85% | 82% | 99.3662, 0.0136 |
© 2020 by the authors. Licensee MDPI, Basel, Switzerland. This article is an open access article distributed under the terms and conditions of the Creative Commons Attribution (CC BY) license (http://creativecommons.org/licenses/by/4.0/).
Share and Cite
Huang, L.; Li, T.; Ding, C.; Zhao, J.; Zhang, D.; Yang, G. Diagnosis of the Severity of Fusarium Head Blight of Wheat Ears on the Basis of Image and Spectral Feature Fusion. Sensors 2020, 20, 2887. https://doi.org/10.3390/s20102887
Huang L, Li T, Ding C, Zhao J, Zhang D, Yang G. Diagnosis of the Severity of Fusarium Head Blight of Wheat Ears on the Basis of Image and Spectral Feature Fusion. Sensors. 2020; 20(10):2887. https://doi.org/10.3390/s20102887
Chicago/Turabian StyleHuang, Linsheng, Taikun Li, Chuanlong Ding, Jinling Zhao, Dongyan Zhang, and Guijun Yang. 2020. "Diagnosis of the Severity of Fusarium Head Blight of Wheat Ears on the Basis of Image and Spectral Feature Fusion" Sensors 20, no. 10: 2887. https://doi.org/10.3390/s20102887
APA StyleHuang, L., Li, T., Ding, C., Zhao, J., Zhang, D., & Yang, G. (2020). Diagnosis of the Severity of Fusarium Head Blight of Wheat Ears on the Basis of Image and Spectral Feature Fusion. Sensors, 20(10), 2887. https://doi.org/10.3390/s20102887