Article

Nutrient Accumulation and Distribution Assessment in Response to Potassium Application under Maize–Soybean Intercropping System

1
College of Agronomy, Sichuan Agricultural University, Chengdu 611130, China
2
College of Management, Sichuan Agricultural University, Chengdu 611130, China
3
Department of Agronomy, Sindh Agriculture University, Tandojam 70060, Pakistan
*
Author to whom correspondence should be addressed.
These authors contributed equally to this work.
Agronomy 2020, 10(5), 725; https://doi.org/10.3390/agronomy10050725
Submission received: 22 March 2020 / Revised: 24 April 2020 / Accepted: 29 April 2020 / Published: 19 May 2020
(This article belongs to the Section Innovative Cropping Systems)

Abstract

:
Intercropping is an intensive agricultural cropping system widely practiced for enhanced yield and nutrient acquisition advantages. A two-year maize–soybean intercropping (MSI) field study was performed in 2018 and 2019 to assess the effects of potassium (K) fertilizer application on biomass accumulation and distribution of essential nutrients in the various plant parts (root, green biomass and seed) of maize–soybean intercropping (MSI). Three different treatments of K fertilizer applications (T0: no potassium application; T1: maize 40, soybeans 30 and T2: maize 80, soybeans 60 kg ha−1) were designed with 2 rows of maize by wide, narrow row planting in row arrangements of 160 cm + 40 cm. Soybeans were grown in 2 wide rows at a width of 40 cm and a row spacing of 60 cm between the rows of maize and soybeans, while the sole maize (SM) and sole soybean (SS) were grown with 70-cm and 50-cm row spacing, respectively. The results of the two-year study confirmed that, as compared to T0, T2 significantly increased nitrogen, phosphate and potassium (NPK) accumulation in all maize parts by 27%, 16% and 20% grain, 23%, 22% and 14% green biomass and 30%, 17% and 15% root, respectively. In soybean treatments, T2 significantly increased NPK accumulation by 23%, 22% and 24% grain, 16%, 15% and 12% green biomass and 18%, 19% and 20% root, respectively. The increased accumulation of nutrients under T2 raised the overall biomass and its distribution to root, green biomass and grain in maize and soybeans by 11% and 18% and 16% and 19%, 20% and 12%, respectively, compared to T0. On average, after two years of experiments, the T2 intercropped maize and the soybeans showed 103% and 64% of the sole yield and attained the maximum LER of 1.66 and 1.68, respectively. Our results reveal that managing optimum K level application (80:60 kg ha−1) can accelerate biomass accumulation and distribution of other essential nutrients in the plant parts of intercropped maize and soybeans. Therefore, it is immensely important to concern potassium application levels in developing a sustainable maize–soybean intercropping systems for achieving higher productivity and land equivalent ratio (LER).

1. Introduction

With population expansions, intensification of urbanization, climate change, the worldwide food crises have been observed recently in the world [1,2]. Traditional cropping no longer meets the needs of food demand; though chemical fertilizers have contributed to high productivity, on the other hand, they worsen environmental deterioration. Therefore, to cope with environmental problems, bring the reviving of the intercropping systems in China. Developing countries like China, Ethiopia, India and Indonesia have committed extensive attention to intercropping to enhance sustainable agriculture productivity [3,4]. Various benefits of a cereal legume intercropping system—mainly intercropping legumes (soybeans) with cereals (maize or wheat)—make better use of nutrients, available resources and sunlight [5], enhance yield [6] and the improve land equivalent ratios [7]. In intercropping, both crops have a co-growth period requiring more resources to produce higher yields simultaneously [8,9].
Since 2005, maize production in China has increased by 39.4 percent, whereas soybean growing area has decreased by 24.9 percent [10]. Recently, intercropping systems of maize and soybeans in southwest China has increased to approximately 667,000 ha−1 and is still increasing to meet growing demand for protein-rich food [11,12]. Across China, cereal–legume intercropping is known as a common cropping practice typically of cereal and legume crops. Maize and soybeans are considered as dominant plant species, respectively. One of the important constraints in declining production of soybeans under a cereal and legume intercropping system is the improper fertilizer application accessible for the legumes to be productive. Throughout the growing period, soybean crops suffer from shading stress by maize hence adversely affecting physiological and morphologic characteristics [13]. Thus, increasing the plant height decreases the stem width and the breaking strength of stem [14] and reduces the nutrients’ accumulation. Additionally, intercropped soybean plants attain low photosynthesis rates [15] and a decrease in biomass under maize–soybean intercropping (MSI) as compare to sole soybeans [13]. Moreover, in MSI, the optimal K application effects are still unidentified in improving the nutrients’ accumulation and its allocation in various parts of the maize–soybean plant.
Proper management and application of balanced inputs is the pre-essential for a productive crop establishment [16,17], especially macronutrients nitrogen, phosphorus and potassium (NPK) are the vital inputs taking great consequence for both cereal legume intercrop. As with legume crops, the performance of the nodulation process is determined at K level and its relationship to nitrogen and P [18]. However, NPK availability is important for gaining higher crop yields, especially inadequate potassium application limits the yield [19,20,21], and yield differences owing to potassium under fertilization were identified [22,23,24], in China, maize yields fell by 26 percent while potash was not used [22]. The crop nitrogen requirement is determined by the nitrogen use efficiency that differs from crop to crop because of their leaf morphology, growth situations and photosynthesis differences [25,26]. Similarly, certain resources’ scarcity in general limits plant growth, such as phosphorus, which is tightly bound to the soil particles [27,28] and contributes to low spreading to the root surface. It is widely recognized that crop taking only 10–25 percent of the applied P fertilizer in each season and bound tightly. K has a prominent functionality in nitrogen and phosphorus uptake, which imparts luxurious vegetative development, intensified translocation of P and the accumulation of photosynthesis and has reported as the cause of an enhanced photosynthetic rate and carbohydrates production. This subsequent carbohydrate translocation and metabolism ultimately improved the grain quality as well as increase the crop yield. Previously it was reported that K alleviated the stomatal regulation, increased CO2 assimilation rate, improved stomatal closure and enzyme activity; thus, higher carbohydrates may have resulted in improved grain yield. To acquire sustainable agriculture production, soil deficient in essential nutrients could be managed by ensuring an adequate dose of fertilizer applications, which could increase translocation, surge up nutrients’ uptake.
Phosphate demand changes are related to internal metabolic paths or the rate of phosphate recycling [29,30]. Among crop nutrients, potassium is the most important nutrient after nitrogen in plants, particularly when the plant-available native soil K levels are lower than the required level. Potassium (K) element has a viable function in the development, growth and, production processes of the plant [31,32], as it imparts its role in the morphologic and physiological characteristics of living plant cells [33,34], rather than just a part of the plant structure [35]. In late 1990, a negative K balance in agricultural production conditions occurs due to inappropriate fertilizer applications in China [36]. Currently, more than 66% of China’s agricultural areas were stated to be scarce in K availability, which markedly limits the crops’ growth and production [37].
Many researchers have shown that under moisture stress, K improves the tolerance of drought [38], crop production, the partitioning of dry matter [39], and significantly increases yields [39,40,41,42,43]. Various physiological mechanisms, such as stomatal regulation and photosynthesis, depend on K [44]. Lodging can reduce plant growth severely, although researchers found that agronomic management can alleviate lodging incidence, especially by potassium (K) application, which is the primary nutrient considered important for crop growth and yield development [34]. Potassium is resistant to crop lodging, its scarcity is known to increase the incidence of lodging [45,46].
In intercropping systems, previous research in literature has mainly focused on crops’ light interception, nutrient allocation and yield. However, no specific research has been carried out to analyze the essential nutrients’ N, P and K accumulation and its distribution to various maize and soybean parts in MSI under K applications. Some scientists have reported the accumulation of P and N in maize under different row configuration of wheat and maize intercropping system [47], but up till now, potassium effects on dry matter, nutrients accumulation, and distribution are not stated in maize and soybeans. Consequently, there is a need to examine the nutrients accumulation and distribution trend in soybeans and maize for agricultural sustainability. In this experiment, we have accessed the effects of K nutrient manipulated by different treatment levels of maize and soybeans in MSI. This research-based on hypothesis (a) to explore the effects of K application on nutrients accumulation such as NPK, dry matter production and yield of maize and soybean plants; (b) to investigate the dynamic distribution of biomass and nutrients in maize and soybeans under specific K applications; (c) to propose optimum K application for better use of nutrients NPK and competitiveness and productivity of available resources. This hypothesis was investigated by comparing treated ones (T2 and T1) with non-treated (T0). Further, we have compared intercropping control with maize and soybean sole cropping control. The research aim was to realize whether nutrient accumulation in intercrops and higher biomass production under MSI can be obtained with optimum K application, to support a theoretical ground for greater intercrop production in the MSI.

2. Material and Methods

2.1. Plant Materials and Site Description

Field experiments comprising over two years were conducted during 2018 and 2019 at Sichuan Agricultural University experimental Farm, Sichuan China (31°46′ N, 119°00′ E, 535 m elevation). The climate condition was humid and subtropical and had a mean temperature of approximately 19.5 °C, with annual mean rainfall 106.89 mm, yearly sunlight 3.95 h and 310 days of frost-free period. The growing season climate included precipitation and an average temperature of each month, as indicated in Figure 1. The experimental site soil was comprised of clay loam texture 54% sand, 28% silt and 17% clay (hydrometer method), with total nitrogen 0.90 g kg−1 by Kjeldahl acid digestion method [48], total phosphorus 0.62 g kg−1 [49] total potassium 6.28 g kg−1 [50], available nitrogen 63.5 mg kg−1 automatic discontinuous analyzer (Clever chem200, Germany), available phosphorus 40.57 mg kg−1 [51] accessible potassium 96.36 mg kg−1 [52] and organic matter 30.34 g kg−1 in the top 0–25 cm soil layer and pH 6.6 [53].

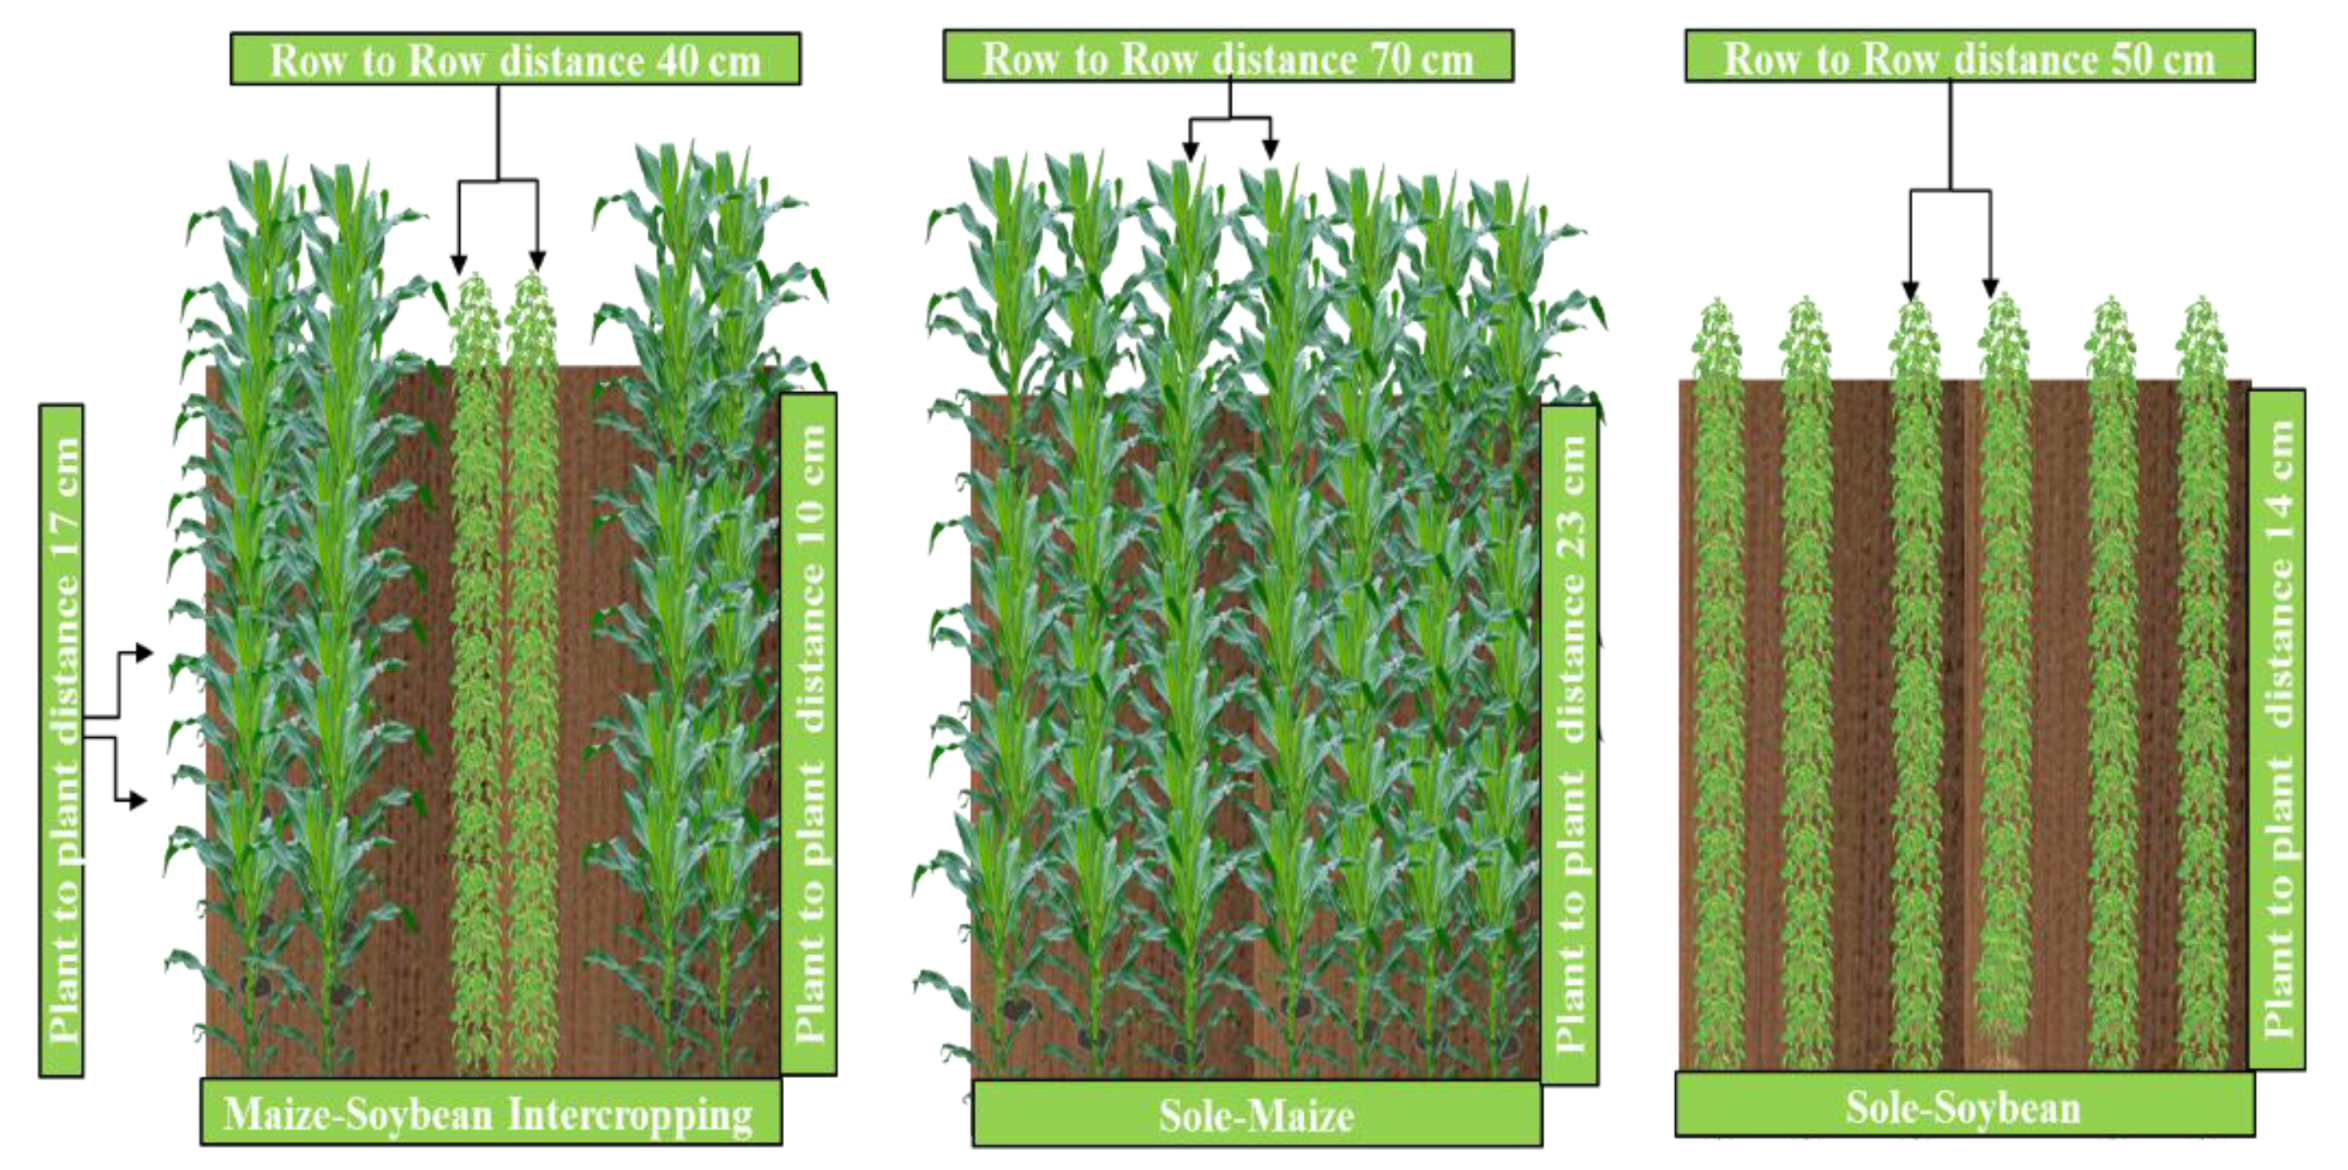
2.2. Experiment Design

Zheng Hong 505 semi compact maize crop and Nandou 25 soybeans were planted in this experiment, in the southwest of China such cultivars of maize and soybeans are commonly cultivated [54]. The field trial was comprised of a randomized complete block design (RCBD) with three potassium treatments (T0: no potassium application; T1: maize 40, soybeans 30 and T2: maize 80, soybeans 60 kg ha−1) with three replications, whereas sole maize (SM) and sole soybeans (SS) K applied viz K: 00 kg ha−1, respectively. The potassium application was applied to maize at the V6 stage, while soybeans were treated during the first fully trifoliate leaf V1 stage. In this experiment, maize–soybean intercropping (MSI) consisted of 2 rows’ maize and 2 rows’ soybeans (2:2) with the row-to-row distance between maize to maize and soybean to soybean was 40 cm. The plant–plant distance between maize and soybeans was 17 and 10 cm, respectively, while the inter-row spacing distance from maize to soybeans was 60 cm. Simultaneously, sole maize and sole soybeans were also planted at an interval 70 and 50 cm, respectively as shown in Figure 2. Each plot had a length and width of 6 × 6 m. Due to overseeding of both cultivars, the plant population was 60 K and 100 K ha−1 for maize and soybeans.
Plant populations for sole maize and sole soybeans were similarly, maintained, keeping a distance of 16.7 cm and 20 cm, respectively. Both crops were planted simultaneously on the 10th ± 6 days of June. Maize was harvested in the last week of September, while the soybeans were harvested on the 28th ± 4 day of October in both years. Basal fertilizer application was also applied to maize at 130 and 72 kg ha−1 of nitrogen and phosphorus at planting time in sole and intercrops. The second nitrogen dose was applied at the V6 stage of maize at 80 kg ha−1 as urea in all plots. For both intercropped and sole soybeans, the dosage nitrogen application was 50 kg ha−1 as urea, P with 60 kg ha−1 as calcium superphosphate, while at the flowering stage of soybeans, a 2nd dose of nitrogen was applied to all plots as urea at 25 kg ha−1 [8]. In addition, agricultural practices in all areas were the same as in crop demand and farming practices in the region [55]. The entire crop relied on rainfall.

2.3. Nutrient Accumulation and Distribution

At harvesting stage, 15 maize and 30 soybeans plants were sampled from every replication of nitrogen, phosphorus and potassium analysis. The harvested maize and soybean plants were divided into grain, green straw biomass and root; all plant parts were dried for 1 h at 105 °C for tissue destruction and then dehydrated at 80 °C in an oven for constant weight. Then, each part was crushed by Wiley Mill and passed over Udy Mill (Thomas Scientific, Swedesboro, NJ, USA) Fort Collins, CO fitted with a strainer of (0.5 mm), and each part nitrogen concentration (g plant−1 part) of maize and soybeans was found using the Kjeldahl method [56]. Estimations of each part P concentration (g plant−1 part) were determined by vanadomolybdate procedure [57]. The potassium content in each part (g plant−1) was determined by FAAS (flame atomic absorption spectrophotometry, Varian 250 plus). In each part of the maize and soybean plant, NPK concentrations were obtained by the product of total biomass of each plant part with the NPK concentrations of each part and presented as kg ha−1 [58]. The evaluative amounts of NPK in all of the plant organs in each plant (g plant−1) were determined total nitrogen accumulation (TNA), total phosphate accumulation (TPA) and total potassium accumulation (TKA) [59].

3. Statistical Analyses

All data obtained for every parameter were analyzed in Microsoft Excel-2013; and variance tests were accomplished using statistics (version, 8.1. Statistix, USA). Analysis of variance (ANOVA) methodologies and LSD were used for the estimation of treatment results on different parameters; both measures were measured at 0.05 probability level [60]. In comparison, the software Microsoft Excel-2013 used standard error (±SE) for visual visualization of results.

4. Results

4.1. K Effect on Plant Biomass Accumulation

The results of the present study suggests that potassium has a profound effect on the total biomass production of maize and soybeans under the MSI (Table 1). In the T2 treatment, maize and soybean plants produced higher TBP than other treatments. In both years, the average in sole soybean treatment produced the highest biomass (6.01 t ha−1), whereas the T2 maize plant had the maximum biomass accumulated (15.50 t ha−1), followed by T1 (13.19 t ha−1). In contrast, the average biomass produced by sole maize was 15.01 t ha−1.

4.2. K Effect on Plant Biomass Distribution

In addition, potassium treatments altered the biomass pattern distribution across various maize and soybean plant parts. Moreover, K treatments changed the biomass distribution trends in various parts of the maize and soybean plant. In general, the biomass of (root, green biomass and grain) in maize and soybeans decreased in T1 and T0 (Figure 3a–f). Seemingly, the highest biomass of maize and soybeans grain were (113.23 g plant−1) and (13.83 g plant−1) in T2 and the lowest (86.62 g plant−1) and (10.81 g plant−1) in T0 treatment, over the two years. Overall, the highest biomass was achieved in SS root (8.91 g plant−1), green biomass (34.49 g plant−1) and grain (16.71 g plant−1), while in MSI, T2 treatment enhanced the root (11% and 18%), green biomass 16% and 19%), and the grain (20% and 12%) biomass of an intercropped maize–soybean relative to T0, respectively.

4.3. K Effects on Nitrogen Accumulation

Data recording total nitrogen accumulation (TNA) of maize and soybean plants of MSI in response to different K applications are presented in Table 1. All K applications subsequently improved the TNA in various plant parts during two growing seasons (2018 and 2019). The results show that in T2 the average highest total nitrogen accumulation at maturity was 2.64 g of maize plant −1 and 1.93 g of soybean plant−1, respectively. Maize TNA showed T2 > SM > T1 > T0 and the soybeans showed a SS > T2 > T1 >T0 pattern, as presented in (Table 1). In comparison with T2 treatment, maize TNA increased by 26% and soybeans by 22%, relative to MSI T0.

4.4. K Effects on Nitrogen Distribution

The different nitrogen concentration of maize and soybean plant parts of various treatments is indicated in Figure 4a–f. Overall, the highest nitrogen content accumulation was observed in SS grain (1.23 g plant−1), green biomass (0.67) and root (0.06). Under all treatments’ of MSI nitrogen contents of maize and soybean grain (1.53 and 1.01 g plant−1 part), green biomass (0.96 and 0.55 g plant−1 part) and root (0.16 and 0.05 g plant−1 part) remained higher in T2, respectively than other respective treatments.

4.5. K Effects on Phosphorus (P) Accumulation

Results regarding total phosphorus accumulation in response to potassium fertilizer are illustrated in Table 1. Considerably, K application levels significantly improved the TPA of maize and soybeans during the two-year experimental period. The highest average TPA was recorded in sole soybeans 0.315 g plant−1 and sole maize 0.507 g plant−1. Maximum phosphorus concentrations in MSI were measured in T2 with 0.25 g plant−1 and 0.54 g plant−1 and minimum TPA in T0 treatment (Table 2) with lowest mean 0.18 g plant−1 and 0.38 g plant−1 in soybean and maize plants, respectively.

4.6. K Effects on Phosphorus (P) Distribution

Figure 5a–f shows the distribution of phosphorus contents in maize and soybean plant parts in response to different K treatment over the period 2018 and 2019. Under T2 treatment, maize achieved maximum average phosphate in grain 0.34 g plant−1 part, green biomass 0.18 g plant−1 part and root 0.02 g plant−1 part, while soybean grain 0.15 g plant−1 parts had the highest average P-value, green biomass 0.13 g of organ plant−1 and root 0.02 g of organ plant−1 in SS. Compared to T0, the T2 treatment enhanced phosphorus content of the grain, green biomass and root by 22%, 15% and 19% in soybeans and 16%, 22% and 17% in maize, respectively, in MSI.

4.7. K Effects on Potassium (K) Accumulation

Total potassium content in maize and soybean plants are presented in Table 1. During two- years, sole soybeans exhibited higher potassium content of 1.08 g plant−1, while in T2 4.05 g plant−1 for maize. The average lowest maize TKA was 3.19 g plant−1 in T1 and 2.95 g plant−1 in T0. Together, soybeans and maize TKU increased by 16% and 19% in MSI, T2, compared to T0, 4.8.

4.8. K Effects on Potassium (K) Distribution

The potassium content of different plant parts of maize and soybeans is provided in Figure 6a–f. The average K concentration of maize grain 0.59 g plant−1 part, green biomass 3.14 g plant−1 part and root 0.33 g plant−1 part was significantly (p < 0.05) higher in T2 than in SM, T1 and T0. Moreover, the average SS potassium concentration measured 0.32 g plant−1 part in grain, 0.74 g plant−1 part in green biomass and 0.03 g plant−1 part in the root of soybeans plant were significantly higher than in T2 with root 0.03 g plant−1, green biomass 0.19 g plant−1 and seed 1.08 g plant−1.

4.9. K Effect on Yield and Land Equivalent Ratio

Grain yield of maize in T2 (6.29 t ha−1 and 6.44 t ha−1) was significantly higher than in T0 (4.97 t ha−1 and 5.38 t ha−1) and T1 (5.15 t ha−1 and 5.50 t ha−1), in 2018 and 2019, respectively and significantly greater than sole maize (6.10 t ha−1 and 6.20 t ha−1). The maximum mean of soybean grain yield (1.99 t ha−1) was found in SS and the minimum mean yield of (0.97 t ha−1) was noted in T0 (p < 0.05; Table 2). In particular, the only treatment T2 that increased the yield of maize by (12% in 2018 and 9% in 2019) and soybeans (by 15% in 2018 and 11% in 2019) above normal MSI (T0). Maize grain yield exhibited a trend of T2> SM > T1 > T0 (Table 2) and soybean yield showed a trend of SS > T2 > T1 > T0 (Table 2). The LER values of maize were higher than the corresponding soybean values for all K treatments. Moreover, in T2 treatment, soybean LER was increased significantly.

5. Correlation Analysis

In MSI regression, the interdependence relationship of the maize and soybean yield and NPK concentration in response to different K levels were investigated. NPK concentrations were significantly correlated with a yield during the two-year field experiment (Figure 7). We concluded that maize seed yield R2 = 0.86, R2 = 0.93 R2 = 0.91, were strongly and positively (p < 0.05) related to the nitrogen, phosphorus and potassium concentration of grain, respectively. Similarly, in the case of soybean seed yield R2 = 0.91, R2 = 0.90 and R2 = 0.85 also had a strong and positive relationship with NPK concentration in response to different K levels. The mean datasets of 2018 and 2019 correlation coefficient between all parameters were found higher than 0.84 (p < 0.05).

6. Discussion

This study was carried out to investigate whether a change in potassium application would affect nutrients accumulation which results in increased biomass accumulation and yield under MSI. In various plant parts, the increased dry weight accumulation and biomass partitioning resulted due to the optimum supply of K to the crop [61,62]. Furthermore, in both years than T0, the total biomass of maize and soybeans under T2 treatment significantly increased by 14% and 19%), respectively. The decline in total biomass under T0 corresponds to previous literature that different crops along with maize and soybeans are more prone to potassium deficiency, with a strong effect on biomass accumulation, quality and yield [19,63,64]. Some studies have explained that K has a key role in stimulating the photosynthesis process for crop growth and biomass production thus confirming more final yield, which is clear in our data [65]. Therefore, variation of K treatments in MSI attributed to the increased biomass accumulation under T2 followed by T1 and T0.
This experiment illustrates that T2 considerably increased the TNA of both crop species than T1 and T0 under MSI, resulting in higher yield. In comparison with T2 treatment, maize TNA increased by 26% and soybeans by 23% relative to MSI T0. In all treatment’s total nitrogen accumulation and distribution to maize and soybeans plant parts such as (grain, green biomass and root) varied significantly, that may be correlated to high and low nitrogen requirements for maize and soybean plants, correspondingly. Previous studies have shown that N distribution is independent of the source size of maize [66]. The study, therefore, suggested that the distribution of N in different maize organs, especially grains, is responsive to source size. Among all treatments, the highest concentration of TNA in maize and soybean grain (1.53 and 1.01 g plant−1 part), green biomass (0.96 and 0.55 g plant−1 part) and root (0.14 and 0.05 g plant−1 part) were measured in T2 treatment. This consequence may be linked to higher biomass, which increased soil nitrogen absorption and transported higher nitrogen amounts to maize grains [67], making grain a major part of nitrogen storage and accumulation in the plant [66]. In the legume crops, nodulation is a common phenomenon and strongly connected to plant growth itself. Hence, there is a possibility that the extra nitrogen released by soybean nodules accumulated in nearby deep root maize in MSI [68].
Further research has shown that K application led to the release of fixed ammonium ion from the soil, which made the plant more capable of nitrogen accumulation [69]. However, there is a noticeable improvement in TNA and distribution of soybeans in various plant parts, primarily due to increased K applications in T1 and T2. Under T2, the maximum TNA in soybeans and maize can be attributed to the influential diffuse contact mechanism, which transfers CO2, water and heat through plants [70], which could contribute to the optimum absorption of plant nutrients like N, as previously reported [71].
Sole soybeans exhibit superiority over intercropping due to higher yield attributes such as a greater number of pods, seed index, number of seeds per plant, however in MSI due to high resource competition, shading effect of maize on soybeans ultimately reduces the yield attributes of intercropped soybeans. In SS P contents in various soybeans, parts are increased than MSI. Notably, in this experiment, found reduced differences in TPA and distribution in different parts of soybeans under T2 T1 and T0 treatments. Increased P accumulation in maize and soybean parts under T2, may be due to the reason (i) appropriate K application improve nutrients uptake efficiency by extending root surface area [72] increasing the P uptake available in the soil (ii) improving translocation of P and the accumulation of photosynthates [73]. Therefore, resulting in enhanced TPA in maize and soybean seed by 16% and 6% in T2, 4% and 6% in T1, respectively as a comparison to T0. Interestingly, our experiment revealed that adequate K application (T2) substantially increased TPA and distribution in maize and soybeans than T0, while the TPA reduced in T1 maize and soybeans under MSI. Meanwhile, in MSI the less accumulation of P was observed in root under T1 than T2, the results are consistent with [74]. Thus, K increases phosphorus use efficiency that was documented to have a key role in improving seed yield [57].
Very few studies stated the K accumulation and distribution in various organs of the maize and soybeans into different plant organs in MSI. Commonly, TKA in maize plants accumulated higher than soybean plants, whereas T2 increased maize TKA by 16% in 2018 and 19% in 2019 compared to T0 in all treatments. In comparison, T1 and T0 resulted in lower TKA, which may be partially correlated with the root receiving lower carbohydrates (lower plant biomass), further decrease in maize grain K accumulation. Our results showed a higher K accumulation in intercropped maize and similar results were recorded in intercropping systems of wheat and wheat–maize, maize–soybean, respectively [56].
Interestingly, all K treatments significantly increased the TKA of soybeans, indicating reduced K competition between maize and soybean plants under T2 and the T1 of MSI. An intense reduction of the leaf surface and sunlight interception was observed when the K application was below the plant’s required level [75]. Hence, in soybeans, the K application increases the availability and distribution of nutrients under the shading condition and controls photosynthesis through sunlight interception. Our results show that the accumulation ability of nutrients was significantly affected at different K applications in MSI and that the acquisition of NPK in soybean plants was higher than in maize plants. Overall, an increased level of nitrogen and phosphorus was observed in grain compared to green biomass and root, while green biomass accumulates more K than grain. Nutrient accumulation in the root of maize and soybeans could be explained because of nutrients competition to support optimum growth and biomass production and between plant parts near to nutrient sources. Interspecific interactions and the light conditions typically played an essential role in the improvement of resource efficiency by intercropping species, e.g., by improving nutrient recovery in comparison with the monocropping system by fixing nitrogen in the maize–soybean intercropping system [57].
In MSI, intensified competition and shade density by maize plants resulted in reduced soybean nutrient accumulation [56] and subsequently improved nitrogen fixation [76]. Various effects of potassium treatment on grain yields of two intercrop species in MSI were considered and the results of our studies have shown that the yield of the grain of both intercrop species has increased with the optimum use of potassium (T2) in both years [57,68]. Furthermore, we observed that the treatment T2 substantially increased plant−1 kernels (by 10% from 400 kernel numbers plant−1 in T0 to 439 kernel numbers Plant−1 in T2) and plant−1 kernel numbers (from 86.31 g in T0 to 106.14 g in T2) of maize in MSI. Moreover, lack of K lowers the grain filling, possibly due to the role of potassium in translocating sugar to the growing part of the plant resulting in yield decline [28]. Thousand grain’s weight was increased by 8% and 4% in maize and soybeans, respectively at the highest rate of K (80 and 60 Kg ha−1). The finding is consistent with [77] that increased 1000 grain weight with K application may be due to increased plants’ photosynthetic activity that finally moved toward the sink, [78] found increased grain number and grain weight. Potassium helps to enhance the efficient use of carbohydrates and improves the leaf index, which enhances dry matter accumulation, eventually increases the grain yield of rapeseed [79,80]. Therefore, T2 is the optimum potassium level, which increased the yields of maize and soybeans significantly by 10% and 13%, respectively, compared to T0. Altogether, NPK concentration substantially improved in various plant parts with higher K applications. A strong correlation between grain yield and NPK concentration at different K levels indicate that K can be used to predicate maize–soybean intercropped yield.
Notably, the land equivalent ratio (LER) of the two-year experiment in MSI treatments has always been higher than 1 and indicates that MSI grain, yields are advantageous than sole maize and sole soybean crops due to improved water, soil, light and growth of nutrients [81]. The average LER values in T0, T1 and T2 were 1.35, 1.42 and 1.67, respectively. These findings indicate that (51%–73%) extra agricultural land is needed for a sole maize and soybean crop equal to MSI grain yield, showing better land-use efficiency than sole cropping [82]. The entire intercrop species growth period of this experiment was 141 days, which for maize or soybeans is longer than 113 days. In one growing season, the two crop species may be cultivated in production regions, when the growing season is too short of doubling crop [12], such as Sichuan, Gansu, Chongqing in China. Moreover, our experimental study showed that K is not only responsible for higher production, but also for better harvest efficiency for treatment T2 and T0 under MSI. Thus, in MSI, K ensures improved biomass production and use of main nutrients for soybeans and maize crop and ultimately provides higher value crops and benefits for farmers’ profits.

7. Conclusions

Based on two years experiment of MSI, it was concluded that various potassium applications have significant effects on growth, nutrients accumulation, yield and yield-related parameters of intercropped maize and soybeans. T2 was found more advantageous for improved growth and increased accumulation of nutrients which has raised the overall biomass and its distribution to root, green biomass and grain in maize and soybeans by 11% and 18% and 16% and 19%, 20% and 12%, respectively, compared to T0. In this study, our field study investigated three different potassium treatments effects on maize and soybean. Adequate application of K gives rise to nutrients translocation towards grains of maize and soybeans and maximizes the grain yield of maize by improving soybean yield. Overall, T2 treatment considerably increased the LER by (1.67) of the maize–soybean intercropping system. The study suggests that in maize–soybean intercropping system, optimum K application of (80–60 kg ha−1) is a viable nutrient management option. Thus, considering potassium’s major role in yield’ development, maize–soybean yield can be grown in the intercropping system. Quality research advances should focus on expanding its importance in intercrop species; hence, ensuring optimal utilization of K fertilization enabling growers to achieve provided targets for future yield improvement efforts.

Author Contributions

A.A. and S.A. conducted the field experiment, collected all data in both study years, and drafted the manuscript; F.Y. and W.Y. conceived the study, secured the funding, and led the project progress. A.A. and S.H. performed the statistical analysis; A.A. and H.N.C. were involved in the data interpretation; A.A. and S.H. made all figures; A.A., F.Y. and W.L. reviewed and revised this research paper. All authors have read and agreed to the published version of the manuscript.

Funding

This research was funded by the International S&T Cooperation Projects of Sichuan Province grant number (20GJHZ0068); the National Nature Science Foundation (31571615) and the Program on Industrial Technology System of National Soybean (CARS-04-03A). A. A’s thanks, to Professor Wenyu Yang for his useful advice that significantly improved the quality of the manuscript.

Conflicts of Interest

The authors have declared that they have no conflict of interest.

References

  1. Foley, J.A.; Ramankutty, N.; Brauman, K.A.; Cassidy, E.S.; Gerber, J.S.; Johnston, M.; Mueller, N.D.; O’Connell, C.; Ray, D.K.; West, P.C. Solutions for a cultivated planet. Nature 2011, 478, 337–342. [Google Scholar] [CrossRef] [PubMed] [Green Version]
  2. Godfray, H.C.J.; Beddington, J.R.; Crute, I.R.; Haddad, L.; Lawrence, D.; Muir, J.F.; Pretty, J.; Robinson, S.; Thomas, S.M.; Toulmin, C. Food security: The challenge of feeding 9 billion people. Science 2010, 327, 812–818. [Google Scholar] [CrossRef] [PubMed] [Green Version]
  3. Ouma, G. Intercropping and its application to banana production in East Africa: A review. J. Plant Breed. Crop Sci. 2009, 1, 13–15. [Google Scholar]
  4. Zomer, R.J.; Trabucco, A.; Coe, R.; Place, F. Trees on farm: Analysis of global extent and geographical patterns of agroforestry. ICRAF Work. Pap. World Agrofor. Cent. 2009, 89, 63. [Google Scholar]
  5. Raza, M.A.; Feng, L.Y.; van der Werf, W.; Cai, G.R.; Khalid, M.H.B.; Iqbal, N.; Hassan, M.J.; Meraj, T.A.; Naeem, M.; Khan, I. Narrow-wide-row planting pattern increases the radiation use efficiency and seed yield of intercrop species in relay-intercropping system. Food Energy Secur. 2019, 8, e170. [Google Scholar] [CrossRef]
  6. Feng, L.; Raza, M.A.; Chen, Y.; Khalid, M.H.B.; Meraj, T.A.; Ahsan, F.; Fan, Y.; Du, J.; Wu, X.; Song, C. Narrow-wide row planting pattern improves the light environment and seed yields of intercrop species in relay intercropping system. PLoS ONE 2019, 14, e0212885. [Google Scholar] [CrossRef]
  7. Ahmed, S.; Raza, M.A.; Zhou, T.; Hussain, S.; Khalid, M.H.B.; Feng, L.; Wasaya, A.; Iqbal, N.; Ahmed, A.; Liu, W. Responses of soybean dry matter production, phosphorus accumulation, and seed yield to sowing time under relay intercropping with maize. Agronomy 2018, 8, 282. [Google Scholar] [CrossRef] [Green Version]
  8. Du, J.-B.; Han, T.-F.; Gai, J.-Y.; Yong, T.-W.; Sun, X.; Wang, X.-C.; Yang, F.; Liu, J.; Shu, K.; Liu, W.-G. Maize-soybean strip intercropping: Achieved a balance between high productivity and sustainability. J. Integr. Agric. 2018, 17, 747–754. [Google Scholar] [CrossRef] [Green Version]
  9. Iqbal, N.; Hussain, S.; Ahmed, Z.; Yang, F.; Wang, X.; Liu, W.; Yong, T.; Du, J.; Shu, K.; Yang, W. Comparative analysis of maize–soybean strip intercropping systems: A review. Plant Prod. Sci. 2019, 22, 131–142. [Google Scholar] [CrossRef] [Green Version]
  10. Shen, Y.; Sui, P.; Huang, J.; Wang, D.; Whalen, J.K.; Chen, Y. Global warming potential from maize and maize-soybean as affected by nitrogen fertilizer and cropping practices in the North China Plain. Field Crop. Res. 2018, 225, 117–127. [Google Scholar] [CrossRef]
  11. Yan, Y.; Gong, W.; Yang, W.; Wan, Y.; Chen, X.; Chen, Z.; Wang, L. Seed treatment with uniconazole powder improves soybean seedling growth under shading by corn in relay strip intercropping system. Plant Prod. Sci. 2010, 13, 367–374. [Google Scholar] [CrossRef]
  12. Yang, F.; Huang, S.; Gao, R.; Liu, W.; Yong, T.; Wang, X.; Wu, X.; Yang, W. Growth of soybean seedlings in relay strip intercropping systems in relation to light quantity and red: Far-red ratio. Field Crop. Res. 2014, 155, 245–253. [Google Scholar] [CrossRef]
  13. Wu, Y.; Gong, W.; Yang, W. Shade inhibits leaf size by controlling cell proliferation and enlargement in soybean. Sci. Rep. 2017, 7, 1–10. [Google Scholar] [CrossRef] [PubMed]
  14. Khalid, M.; Raza, M.; Yu, H.; Sun, F.; Zhang, Y.; Lu, F.; Si, L.; Iqbal, N.; Khan, I.; Fu, F. Effect of shade treatments on morphology, photosynthetic and chlorophyll fluorescence characteristics of soybeans (Glycine max L. Merr.). Appl. Ecol. Environ. Res. 2019, 17, 2551–2569. [Google Scholar] [CrossRef]
  15. Feng, L.; Raza, M.A.; Li, Z.; Chen, Y.; Khalid, M.H.B.; Du, J.; Liu, W.; Wu, X.; Song, C.; Yu, L. The Influence of Light Intensity and Leaf Movement on Photosynthesis Characteristics and Carbon Balance of Soybean. Front. Plant Sci. 2018, 9, 1952. [Google Scholar] [CrossRef]
  16. Dai, J.; Dong, H. Intensive cotton farming technologies in China: Achievements, challenges and countermeasures. Field Crop. Res. 2014, 155, 99–110. [Google Scholar] [CrossRef] [Green Version]
  17. Amin, A.; Nasim, W.; Mubeen, M.; Nadeem, M.; Ali, L.; Hammad, H.M.; Sultana, S.R.; Jabran, K.; ur Rehman, M.H.; Ahmad, S. Optimizing the phosphorus use in cotton by using CSM-CROPGRO-cotton model for semi-arid climate of Vehari-Punjab, Pakistan. Environ. Sci. Pollut. Res. 2017, 24, 5811–5823. [Google Scholar] [CrossRef]
  18. Divito, G.A.; Sadras, V.O. How do phosphorus, potassium and sulphur affect plant growth and biological nitrogen fixation in crop and pasture legumes? A meta-analysis. Field Crop. Res. 2014, 156, 161–171. [Google Scholar] [CrossRef]
  19. Ma, Q.; Scanlan, C.; Bell, R.; Brennan, R. The dynamics of potassium uptake and use, leaf gas exchange and root growth throughout plant phenological development and its effects on seed yield in wheat (Triticum aestivum) on a low-K sandy soil. Plant Soil 2013, 373, 373–384. [Google Scholar] [CrossRef]
  20. Abbadi, J.; Gerendás, J.; Sattelmacher, B. Effects of potassium supply on growth and yield of safflower as compared to sunflower. J. Plant Nutr. Soil Sci. 2008, 171, 272–280. [Google Scholar] [CrossRef]
  21. Fageria, N.; Melo, L. Agronomic evaluation of dry bean genotypes for potassium use efficiency. J. Plant Nutr. 2014, 37, 1899–1912. [Google Scholar] [CrossRef]
  22. Dai, X.; Ouyang, Z.; Li, Y.; Wang, H. Variation in yield gap induced by nitrogen, phosphorus and potassium fertilizer in North China Plain. PLoS ONE 2013, 8, e82147. [Google Scholar] [CrossRef] [PubMed] [Green Version]
  23. Xu, X.; Liu, X.; He, P.; Johnston, A.M.; Zhao, S.; Qiu, S.; Zhou, W. Yield gap, indigenous nutrient supply and nutrient use efficiency for maize in China. PLoS ONE 2015, 10, e0140767. [Google Scholar] [CrossRef] [PubMed]
  24. Yousaf, M.; Li, J.; Lu, J.; Ren, T.; Cong, R.; Fahad, S.; Li, X. Effects of fertilization on crop production and nutrient-supplying capacity under rice-oilseed rape rotation system. Sci. Rep. 2017, 7, 1–9. [Google Scholar] [CrossRef]
  25. Lambers, H.; Poorter, H. Inherent variation in growth rate between higher plants: A search for physiological causes and ecological consequences. In Advances in Ecological Research; Academic Press: Cambridge, MA, USA, 1992; Volume 23, pp. 187–261. [Google Scholar]
  26. Garnier, E.; Gobin, O.; Poorter, H. Nitrogen productivity depends on photosynthetic nitrogen use efficiency and on nitrogen allocation within the plant. Ann. Bot. 1995, 76, 667–672. [Google Scholar] [CrossRef]
  27. Hinsinger, P. Bioavailability of soil inorganic P in the rhizosphere as affected by root-induced chemical changes: A review. Plant Soil 2001, 237, 173–195. [Google Scholar] [CrossRef]
  28. Shen, J.; Yuan, L.; Zhang, J.; Li, H.; Bai, Z.; Chen, X.; Zhang, W.; Zhang, F. Phosphorus dynamics: From soil to plant. Plant Physiol. 2011, 156, 997–1005. [Google Scholar] [CrossRef] [PubMed] [Green Version]
  29. Vance, C.P.; Uhde-Stone, C.; Allan, D.L. Phosphorus acquisition and use: Critical adaptations by plants for securing a nonrenewable resource. New Phytol. 2003, 157, 423–447. [Google Scholar] [CrossRef] [Green Version]
  30. Chen, Y.L.; Dunbabin, V.M.; Diggle, A.J.; Siddique, K.H.; Rengel, Z. Phosphorus starvation boosts carboxylate secretion in P-deficient genotypes of Lupinus angustifolius with contrasting root structure. Crop Pasture Sci. 2013, 64, 588–599. [Google Scholar] [CrossRef]
  31. Minjian, C.; Haiqiu, Y.; Hongkui, Y.; Chunji, J. Difference in tolerance to potassium deficiency between two maize inbred lines. Plant Prod. Sci. 2007, 10, 42–46. [Google Scholar] [CrossRef]
  32. Marschner, H. Marschner’s Mineral Nutrition of Higher Plants; Academic Press: Cambridge, MA, USA, 2011. [Google Scholar]
  33. Amtmann, A.; Hammond, J.P.; Armengaud, P.; White, P.J. Nutrient sensing and signalling in plants: Potassium and phosphorus. Adv. Bot. Res. 2005, 43, 209–257. [Google Scholar]
  34. Pettigrew, W.T. Potassium influences on yield and quality production for maize, wheat, soybean and cotton. Physiol. Plant. 2008, 133, 670–681. [Google Scholar] [CrossRef] [PubMed]
  35. Wang, M.; Zheng, Q.; Shen, Q.; Guo, S. The critical role of potassium in plant stress response. Int. J. Mol. Sci. 2013, 14, 7370–7390. [Google Scholar] [CrossRef] [PubMed] [Green Version]
  36. Hu, W.; Lv, X.; Yang, J.; Chen, B.; Zhao, W.; Meng, Y.; Wang, Y.; Zhou, Z.; Oosterhuis, D.M. Effects of potassium deficiency on antioxidant metabolism related to leaf senescence in cotton (Gossypium hirsutum L.). Field Crop. Res. 2016, 191, 139–149. [Google Scholar] [CrossRef]
  37. Chen, X.; Shi, C.; Yin, Y.; Wang, Z.; Shi, Y.; Peng, D.; Ni, Y.; Cai, T. Relationship between lignin metabolism and lodging resistance in wheat. Acta Agron. Sin. 2011, 37, 1616–1622. [Google Scholar] [CrossRef]
  38. Wei, J.; Li, C.; Li, Y.; Jiang, G.; Cheng, G.; Zheng, Y. Effects of external potassium (K) supply on drought tolerances of two contrasting winter wheat cultivars. PLoS ONE 2013, 8, e69737. [Google Scholar] [CrossRef] [PubMed]
  39. Amanullah, A.; Iqbal, A.; Iqbal, M. Impact of potassium rates and their application time on dry matter partitioning, biomass and harvest index of maize (Zea mays) with and without cattle dung application. Emirates J. Food Agric. 2015, 27, 447–453. [Google Scholar] [CrossRef] [Green Version]
  40. Zhang, Y.; Zhang, C.C.; Yan, P.; Chen, X.P.; Yang, J.C.; Zhang, F.S.; Cui, Z.L. Potassium requirement in relation to grain yield and genotypic improvement of irrigated lowland rice in China. J. Plant Nutr. Soil Sci. 2013, 176, 400–406. [Google Scholar] [CrossRef]
  41. Amanullah, M.H.K. Difference in dry matter accumulation with variable rates of sulphur and potassium application under calcareous soils in Brassica napus vs. B. juncea. J. Oilseed Brassica 2016, 1, 241–248. [Google Scholar]
  42. Cakmak, I. The role of potassium in alleviating detrimental effects of abiotic stresses in plants. J. Plant Nutr. Soil Sci. 2005, 168, 521–530. [Google Scholar] [CrossRef]
  43. Damon, P.M.; Rengel, Z. Wheat genotypes differ in potassium efficiency under glasshouse and field conditions. Aust. J. Agric. Res. 2007, 58, 816–825. [Google Scholar] [CrossRef]
  44. Marschner, H. Marschner’s Mineral Nutrition of Higher Plants; Academic Press: Cambridge, MA, USA, 2012; Volume 89. [Google Scholar]
  45. Mondal, A.; Miah, S. Effect of K on bacterial blight (BB) development. Int. Rice Res. Newsl. (Philipp.) 1985, 10, 12–13. [Google Scholar]
  46. Sindhan, G.; Parashar, R. Influence of some nutrients on phenol and carbohydrate contents related to bacterial blight in rice. Plant Dis. Res. 1986, 1, 65–68. [Google Scholar]
  47. Gou, F.; Van Ittersum, M.K.; Couëdel, A.; Zhang, Y.; Wang, Y.; van der Putten, P.E.; Zhang, L.; van der Werf, W. Intercropping with wheat lowers nutrient uptake and biomass accumulation of maize, but increases photosynthetic rate of the ear leaf. AoB Plants 2018, 10, ply010. [Google Scholar] [CrossRef] [PubMed] [Green Version]
  48. Okalebo, J.R.; Gathua, K.W.; Woomer, P.L. Laboratory Methods of Soil and Plant Analysis: A Working Manual, 2nd ed.; Sacred Africa: Nairobi, Kenya, 2002; Volume 21. [Google Scholar]
  49. Olsen, S.; Sommers, L. Methods of Soil Analysis, Part 2, 2nd ed.; Agron. Monogr. 9; Page, A.L., Ed.; ASA and SSSA: Madison, WI, USA, 1982; pp. 403–430. [Google Scholar]
  50. Huoyan, W.; Cheng, W.; Ting, L.; Jianmin, Z.; Xiaoqin, C. Can nonexchangeable potassium be differentiated from structural potassium in soils? Pedosphere 2016, 26, 206–215. [Google Scholar]
  51. Olsen, S.R. Estimation of Available Phosphorus in Soils by Extraction with Sodium Bicarbonate; US Department of Agriculture: Washington, DC, USA, 1954; Circular No. 939.
  52. Jackson, M. Soil Chemical Analysis; 2nd Indian Print; Prentice-Hall of India Pvt. Ltd.: New Delhi, India, 1973; pp. 38–336. [Google Scholar]
  53. Pietsch, D.; Mabit, L. Terrace soils in the Yemen Highlands: Using physical, chemical and radiometric data to assess their suitability for agriculture and their vulnerability to degradation. Geoderma 2012, 185, 48–60. [Google Scholar] [CrossRef]
  54. Liu, W.; Deng, Y.; Hussain, S.; Zou, J.; Yuan, J.; Luo, L.; Yang, C.; Yuan, X.; Yang, W. Relationship between cellulose accumulation and lodging resistance in the stem of relay intercropped soybean [Glycine max (L.) Merr.]. Field Crop. Res. 2016, 196, 261–267. [Google Scholar] [CrossRef]
  55. Yang, F.; Liao, D.; Wu, X.; Gao, R.; Fan, Y.; Raza, M.A.; Wang, X.; Yong, T.; Liu, W.; Liu, J.; et al. Effect of aboveground and belowground interactions on the intercrop yields in maize-soybean relay intercropping systems. Field Crop. Res. 2017, 203, 16–23. [Google Scholar] [CrossRef]
  56. Li, L.; Sun, J.; Zhang, F.; Li, X.; Yang, S.; Rengel, Z. Wheat/maize or wheat/soybean strip intercropping: I. Yield advantage and interspecific interactions on nutrients. Field Crop. Res. 2001, 71, 123–137. [Google Scholar] [CrossRef]
  57. Xia, H.-Y.; Wang, Z.-G.; Zhao, J.-H.; Sun, J.-H.; Bao, X.-G.; Christie, P.; Zhang, F.-S.; Li, L. Contribution of interspecific interactions and phosphorus application to sustainable and productive intercropping systems. Field Crop. Res. 2013, 154, 53–64. [Google Scholar] [CrossRef]
  58. Raza, M.A.; Feng, L.Y.; Manaf, A.; Wasaya, A.; Ansar, M.; Hussain, A.; Khalid, M.H.B.; Iqbal, N.; Xi, Z.J.; Chen, Y.K. Sulphur application increases seed yield and oil content in sesame seeds under rainfed conditions. Field Crop. Res. 2018, 218, 51–58. [Google Scholar] [CrossRef]
  59. Raza, M.A.; Feng, L.Y.; Iqbal, N.; Manaf, A.; Khalid, M.H.B.; Ur Rehman, S.; Wasaya, A.; Ansar, M.; Billah, M.; Yang, F. Effect of sulphur application on photosynthesis and biomass accumulation of sesame varieties under rainfed conditions. Agronomy 2018, 8, 149. [Google Scholar] [CrossRef] [Green Version]
  60. Steel, R.G.D.; Torrie, J.H. Principles and Procedures of Statistics: A Biometrical Approach; McGraw-Hill: New York, NY, USA, 1980. [Google Scholar]
  61. Zhao, D.; Oosterhuis, D.; Bednarz, C. Influence of potassium deficiency on photosynthesis, chlorophyll content, and chloroplast ultrastructure of cotton plants. Photosynthetica 2001, 39, 103–109. [Google Scholar] [CrossRef]
  62. Reddy, K.R.; Zhao, D. Interactive effects of elevated CO2 and potassium deficiency on photosynthesis, growth, and biomass partitioning of cotton. Field Crop. Res. 2005, 94, 201–213. [Google Scholar] [CrossRef]
  63. Pettigrew, W. Effects of K on plant metabolism. Physiol. Plant 2008, 133, 670–681. [Google Scholar] [CrossRef]
  64. Gerardeaux, E.; Saur, E.; Constantin, J.; Porté, A.; Jordan-Meille, L. Effect of carbon assimilation on dry weight production and partitioning during vegetative growth. Plant Soil 2009, 324, 329–343. [Google Scholar] [CrossRef]
  65. Pettigrew, W.; Gerik, T. Cotton leaf photosynthesis and carbon metabolism. Adv. Agron. 2007, 94, 209–236. [Google Scholar]
  66. Dreccer, M.; Grashoff, C.; Rabbinge, R. Source-sink ratio in barley (Hordeum vulgare L.) during grain filling: Effects on senescence and grain protein concentration. Field Crop. Res. 1997, 49, 269–277. [Google Scholar] [CrossRef]
  67. Hao, M.B.; Wang, K.J.; Dong, S.T.; Zhang, J.W.; Li, D.H.; Liu, P.; Yang, J.S.; Liu, J.G. Leaf redundancy of high-yielding maize (Zea may L.) and its effects on maize yield and photosynthesis. Yingyong Shengtai Xuebao 2010, 21, 344–350. [Google Scholar]
  68. Chen, P.; Du, Q.; Liu, X.; Zhou, L.; Hussain, S.; Lei, L.; Song, C.; Wang, X.; Liu, W.; Yang, F. Effects of reduced nitrogen inputs on crop yield and nitrogen use efficiency in a long-term maize-soybean relay strip intercropping system. PLoS ONE 2017, 12, e0184503. [Google Scholar] [CrossRef] [PubMed] [Green Version]
  69. Sharma, P.; Ramna, S. Response of sorghum to nitrogen and potassium in Alfisol. J. Potash. Res. 1993, 9, 171–175. [Google Scholar]
  70. Hall, D.O.; Scurlock, J.; Bolhàr-Nordenkampf, H.; Leegood, R.C.; Long, S. Photosynthesis and Production in a Changing Environment: A Field and Laboratory Manual; Springer Science & Business Media: Berlin, Germany, 2013. [Google Scholar]
  71. Liu, G.; Hou, P.; Xie, R.; Ming, B.; Wang, K.; Liu, W.; Yang, Y.; Xu, W.; Chen, J.; Li, S. Nitrogen uptake and response to radiation distribution in the canopy of high-yield maize. Crop Sci. 2019, 59, 1236–1247. [Google Scholar] [CrossRef]
  72. Høgh-Jensen, H.; Pedersen, M.B. Morphological plasticity by crop plants and their potassium use efficiency. J. Plant Nutr. 2003, 26, 969–984. [Google Scholar] [CrossRef]
  73. Oosterhuis, D.M.; Loka, D.A.; Kawakami, E.M.; Pettigrew, W.T. The physiology of potassium in crop production. In Advances in Agronomy; Elsevier: Amsterdam, The Netherlands, 2014; Volume 126, pp. 203–233. [Google Scholar]
  74. Du, Q.; Zhao, X.; Jiang, C.; Wang, X. Effect of potassium deficiency on root growth and nutrient uptake in Maize (Zea mays L.). Agric. Sci. 2017, 8, 1263–1277. [Google Scholar] [CrossRef] [Green Version]
  75. Bednarz, C.; Oosterhuis, D.; Evans, R. Leaf photosynthesis and carbon isotope discrimination of cotton in response to potassium deficiency. Environ. Exp. Bot. 1998, 39, 131–139. [Google Scholar] [CrossRef]
  76. Li, L.; Sun, J.; Zhang, F.; Li, X.; Rengel, Z.; Yang, S. Wheat/maize or wheat/soybean strip intercropping: II. Recovery or compensation of maize and soybean after wheat harvesting. Field Crop. Res. 2001, 71, 173–181. [Google Scholar] [CrossRef]
  77. Ahmad, M.; Riaz, A.; Ishaque, M.; Malik, A. Response of maize hybrids to varying potassium application in Pakistan. Pak. J. Agric. Sci. 2009, 46, 179–184. [Google Scholar]
  78. Sadiq, S.; Jan, A. Effect of Graded Application of Potash on Kharif Maize Sown at Different fErtility Levels. Master’s Thesis, Department of Agronomy, The University of Agriculture, Peshawar, Pakistan, 2001. [Google Scholar]
  79. Uddin, S.; Sarkar, M.; Rahman, M. Effect of nitrogen and potassium on yield of dry direct seeded rice cv. NERICA 1 in aus season. Int. J. Agron. Plant Prod. 2013, 4, 69–75. [Google Scholar]
  80. Cheema, M.A.; Wahid, M.; Sattar, A.; Rasul, F.; Saleem, M. Influence of different levels of potassium on growth, yield and quality of canola (Brassica napus L.) cultivars. Pak. J. Agric. Sci. 2012, 49, 163–168. [Google Scholar]
  81. Yang, F.; Wang, X.; Liao, D.; Lu, F.; Gao, R.; Liu, W.; Yong, T.; Wu, X.; Du, J.; Liu, J. Yield response to different planting geometries in maize–soybean relay strip intercropping systems. Agron. J. 2015, 107, 296–304. [Google Scholar] [CrossRef]
  82. Agegnehu, G.; Ghizaw, A.; Sinebo, W. Yield performance and land-use efficiency of barley and faba bean mixed cropping in Ethiopian highlands. Eur. J. Agron. 2006, 25, 202–207. [Google Scholar] [CrossRef]
Figure 1. Monthly rainfall, the average mean temperature and humidity during seasons 2018–2019 from June–December.
Agronomy 10 00725 g001
Figure 2. Schematic representation of maize–soybean intercropping system (MSI) from 2018 to 2019.
Agronomy 10 00725 g002
Figure 3. Root, green biomass and grain biomass of maize (ac) and soybeans (df) as affected by different potassium treatments in the maize–soybean intercropping system (MSI) from 2018 to 2019 growing season. The T0, T1 and T2 represent the no potassium treatment, 40:30 kg ha−1 and 80:60 kg ha−1, respectively, in MSI. The SS and SM refer to sole cropping system of soybeans and maize, respectively. Means are averaged over three replicates ± standard error. Means do not share the same letters in the column differ significantly at p ≤ 0.05.
Agronomy 10 00725 g003
Figure 4. Root, green biomass and grain nitrogen content of maize (ac) and soybeans (df) as affected by different potassium treatments in the maize–soybean intercropping system (MSI) from 2018 to 2019 growing season. The T0, T1 and T2 represent the no potassium treatment, 40:30 kg ha−1 and 80:60 kg ha−1, respectively, in MSI. The SS and SM refer to sole cropping system of soybeans and maize, respectively. Means are averaged over three replicates ± standard error. Means do not share the same letters in the column differ significantly at p ≤ 0.05.
Agronomy 10 00725 g004
Figure 5. Root, green biomass and grain phosphorus content of maize (ac) and soybeans (df) as affected by different potassium treatments in the maize–soybean intercropping system (MSI) from 2018 to 2019 growing season. The T0, T1 and T2 represent the no potassium treatment, 40:30 kg ha−1 and 80:60 kg ha−1, respectively, in MSI. The SS and SM refer to sole cropping system of soybeans and maize, respectively. Means are averaged over three replicates ± standard error. Means do not share the same letters in the column differ significantly at p ≤ 0.05.
Agronomy 10 00725 g005
Figure 6. Root, green biomass and grain potassium content of maize (ac) and soybeans (df) as affected by different potassium treatments in the maize–soybean intercropping system (MSI) from 2018 to 2019 growing season. The T0, T1 and T2 represent the no potassium treatment, 40:30 kg ha−1 and 80:60 kg ha−1, respectively, in MSI. The SS and SM refer to sole cropping system of soybeans and maize, respectively. Means are averaged over three replicates ± standard error. Means do not share the same letters in the column differ significantly at p ≤ 0.05.
Agronomy 10 00725 g006
Figure 7. Relationship between seed yield and nutrient uptake of maize (AC) and soybeans (DF) under MSI nitrogen, phosphorus and potassium at the harvesting stage.
Agronomy 10 00725 g007
Table 1. Effect of different potassium application on a dry matter (TDM), total nitrogen accumulation (TNA), total phosphorus accumulation and total potassium accumulation (TKA) of maize and soybeans during 2018–2019.
YearsTreatmentTDM (t ha−1)TNA (g plant−1)TPA (g plant−1)TKA (g plant−1)
MaizeSoybeansMaizeSoybeansMaizeSoybeansMaizeSoybeans
2018T011.40 ± 0.05 d3.03 ± 0.16 d1.52 ± 0.02 c0.98 ± 0.04 d0.36 ± 0.02 d0.17 ± 0.01 d2.93 ± 0.03 d0.58 ± 0.01 d
T113.07 ± 0.11 c3.77 ± 0.05 c1.87 ± 0.04 b1.29 ± 0.05 c0.41 ± 0.01 c0.19 ± 0.05 c3.09 ± 0.07 c0.71 ± 0.02 c
T215.28 ± 0.18 a4.46 ± 0.08 b2.58 ± 0.01 a1.58 ± 0.06 b0.52 ± 0.01 a0.23 ± 0.08 b3.92 ± 0.06 a0.85 ± 0.01 b
SM14.51 ± 0.07 b-1.90 ± 0.03 b-0.49 ± 0.06 b-3.43 ± 0.04 b-
SS-5.97 ± 0.04 a-1.89 ± 0.03 a-0.29 ± 0.03 a-1.01 ± 0.04 a
LSD 0.400.290.110.170.0460.140.20.05
2019T011.81 ± 0.06 d3.12 ± 0.02 d1.58 ± 0.01 d1.04 ± 0.01 d0.39 ± 0.01 d0.19 ± 0.01 d2.97 ± 0.03 d0.63 ± 0.02 d
T113.32 ± 0.03 c3.85 ± 0.03 c2.01 ± 0.08 c1.42 ± 0.02 c0.46 ± 0.02 c0.21 ± 0.06 c3.29 ± 0.02 c0.77 ± 0.04 c
T215.73 ± 0.04 a4.54 ± 0.01 b2.72 ± 0.02 a1.65 ± 0.02 b0.56 ± 0.03 a0.26 ± 0.02 b4.19 ± 0.02 a0.93 ± 0.02 b
SM15.51 ± 0.20 b-2.17 ± 0.02 b-0.52 ± 0.02 b-3.81 ± 0.01 b-
SS-6.05 ± 0.07 a-1.97 ± 0.03 a-0.34 ± 0.04 a-1.12 ± 0.03 a
LSD 0.330.130.130.610.0430.320.090.05
The T0, T1 and T2 represent the no potassium treatment, 40:30 kg ha−1 and 80:60 kg ha−1, respectively, in MSI. The SS and SM refer to sole cropping system of soybeans and maize, respectively. Means are averaged over three replicates ± standard error. Means do not share the same letters in the columns differ significantly at p ≤ 0.05.
Table 2. Effect of different potassium application on yield and yield-related components of maize and soybean intercropping and sole cropping during cropping seasons 2018–2019.
YearsTreatmentsKernels plant−1Seed Number plant−1Seed Weight plant−1 (g)Seed Index (1000 Seed Weight)Grain-Yield t ha−1LERTotal LER
MaizeSoybeansMaizeSoybeansMaizeSoybeansMaizeSoybeans
2018T0394 ± 0.02 d74.22 ± 0.13 d82.88 ± 0.17 d9.25 ± 0.42 d246.05 ± 0.26 d178.42 ± 0.22 d4.973 ± 0.09 d0.925 ± 0.02 d0.81 ± 0.02 c0.46 ± 0.04 c1.28 ± 0.01 c
T1402 ± 0.01 c80.59 ± 0.31 c85.82 ± 0.07 c10.87 ± 0.57 c253.57 ± 0.17 c185.12 ± 0.01 c5.149 ± 0.03 c1.087 ± 0.07 c0.84 ± 0.03 b0.54 ± 0.02 b1.39 ± 0.02 b
T2432 ± 0.06 a91.72 ± 0.07 b104.87 ± 0.20 a12.65 ± 0.59 b288.48 ± 0.22 a194.75 ± 0.15 b6.292 ± 0.02 a1.265 ± 0.06 b1.03 ± 0.49 a0.63 ± 0.02 a1.66 ± 0.02 a
SM409 ± 0.08 b-101.77 ± 0.05 b-261.29 ± 0.05 b-6.106 ± 0.04 b----
SS-102.08 ± 0.17 a-20.02 ± 0.43 a-203.12 ± 0.18 a-2.002 ± 0.036 a---
LSD 0.150.360.520.090.180.610.150.030.080.020.06
2019T0407 ± 0.10 d70.91 ± 0.11 d89.75 ± 0.20 d10.13 ± 0.59 d252.32 ± 0.46 d181.27 ± 0.14 d5.385 ± 0.05 d1.013 ± 0.02 d0.87 ± 0.03 c0.51 ± 0.3 c1.41 ± 0.02 c
T1419 ± 0.06 c77.69 ± 0.15 c91.62 ± 0.01 c11.09 ± 0.72 c269.07 ± 0.11 c189.61 ± 0.20 c5.497 ± 0.30 c1.109 ± 0.01 c0.89 ± 0.15 b0.56 ± 0.02 b1.44 ± 0.03 b
T2447 ± 0.59 a85.29 ± 0.17 b107.42 ± 0.27 a12.71 ± 0.25 b295.56 ± 0.20 a196.77 ± 0.05 b6.445 ± 0.06 a1.271 ± 0.05 b1.04 ± 0.03 a0.64 ± 0.05 a1.68 ± 0.01 a
SM429 ± 0.08 b-103.33 ± 0.17 b-288.48 ± 0.34 b 6.200 ± 0.04 b----
SS-97.86 ± 0.15 a-15.90 ± 0.60 a-199.65 ± 0.18 a-1.993 ± 0.08 a---
LSD 0.980.550.560.190.660.570.190.040.050.010.03
The T0, T1 and T2 represent the no potassium treatment, 40:30 kg ha−1 and 80:60 kg ha−1, respectively, in MSI. The SS and SM refer to sole cropping system of soybeans and maize, respectively. Means are averaged over three replicates ± standard error. Means do not share the same letters in the columns differ significantly at ≤0.05.

