
A Herbal Mixture from Propolis, Pomegranate, and Grape Pomace Endowed with Anti-Inflammatory Activity in an In Vivo Rheumatoid Arthritis Model


 ,
,  ,
,  ,
,  and
and 
Abstract
1. Introduction
2. Results and Discussion
2.1. Chemical Characterization of Extracts
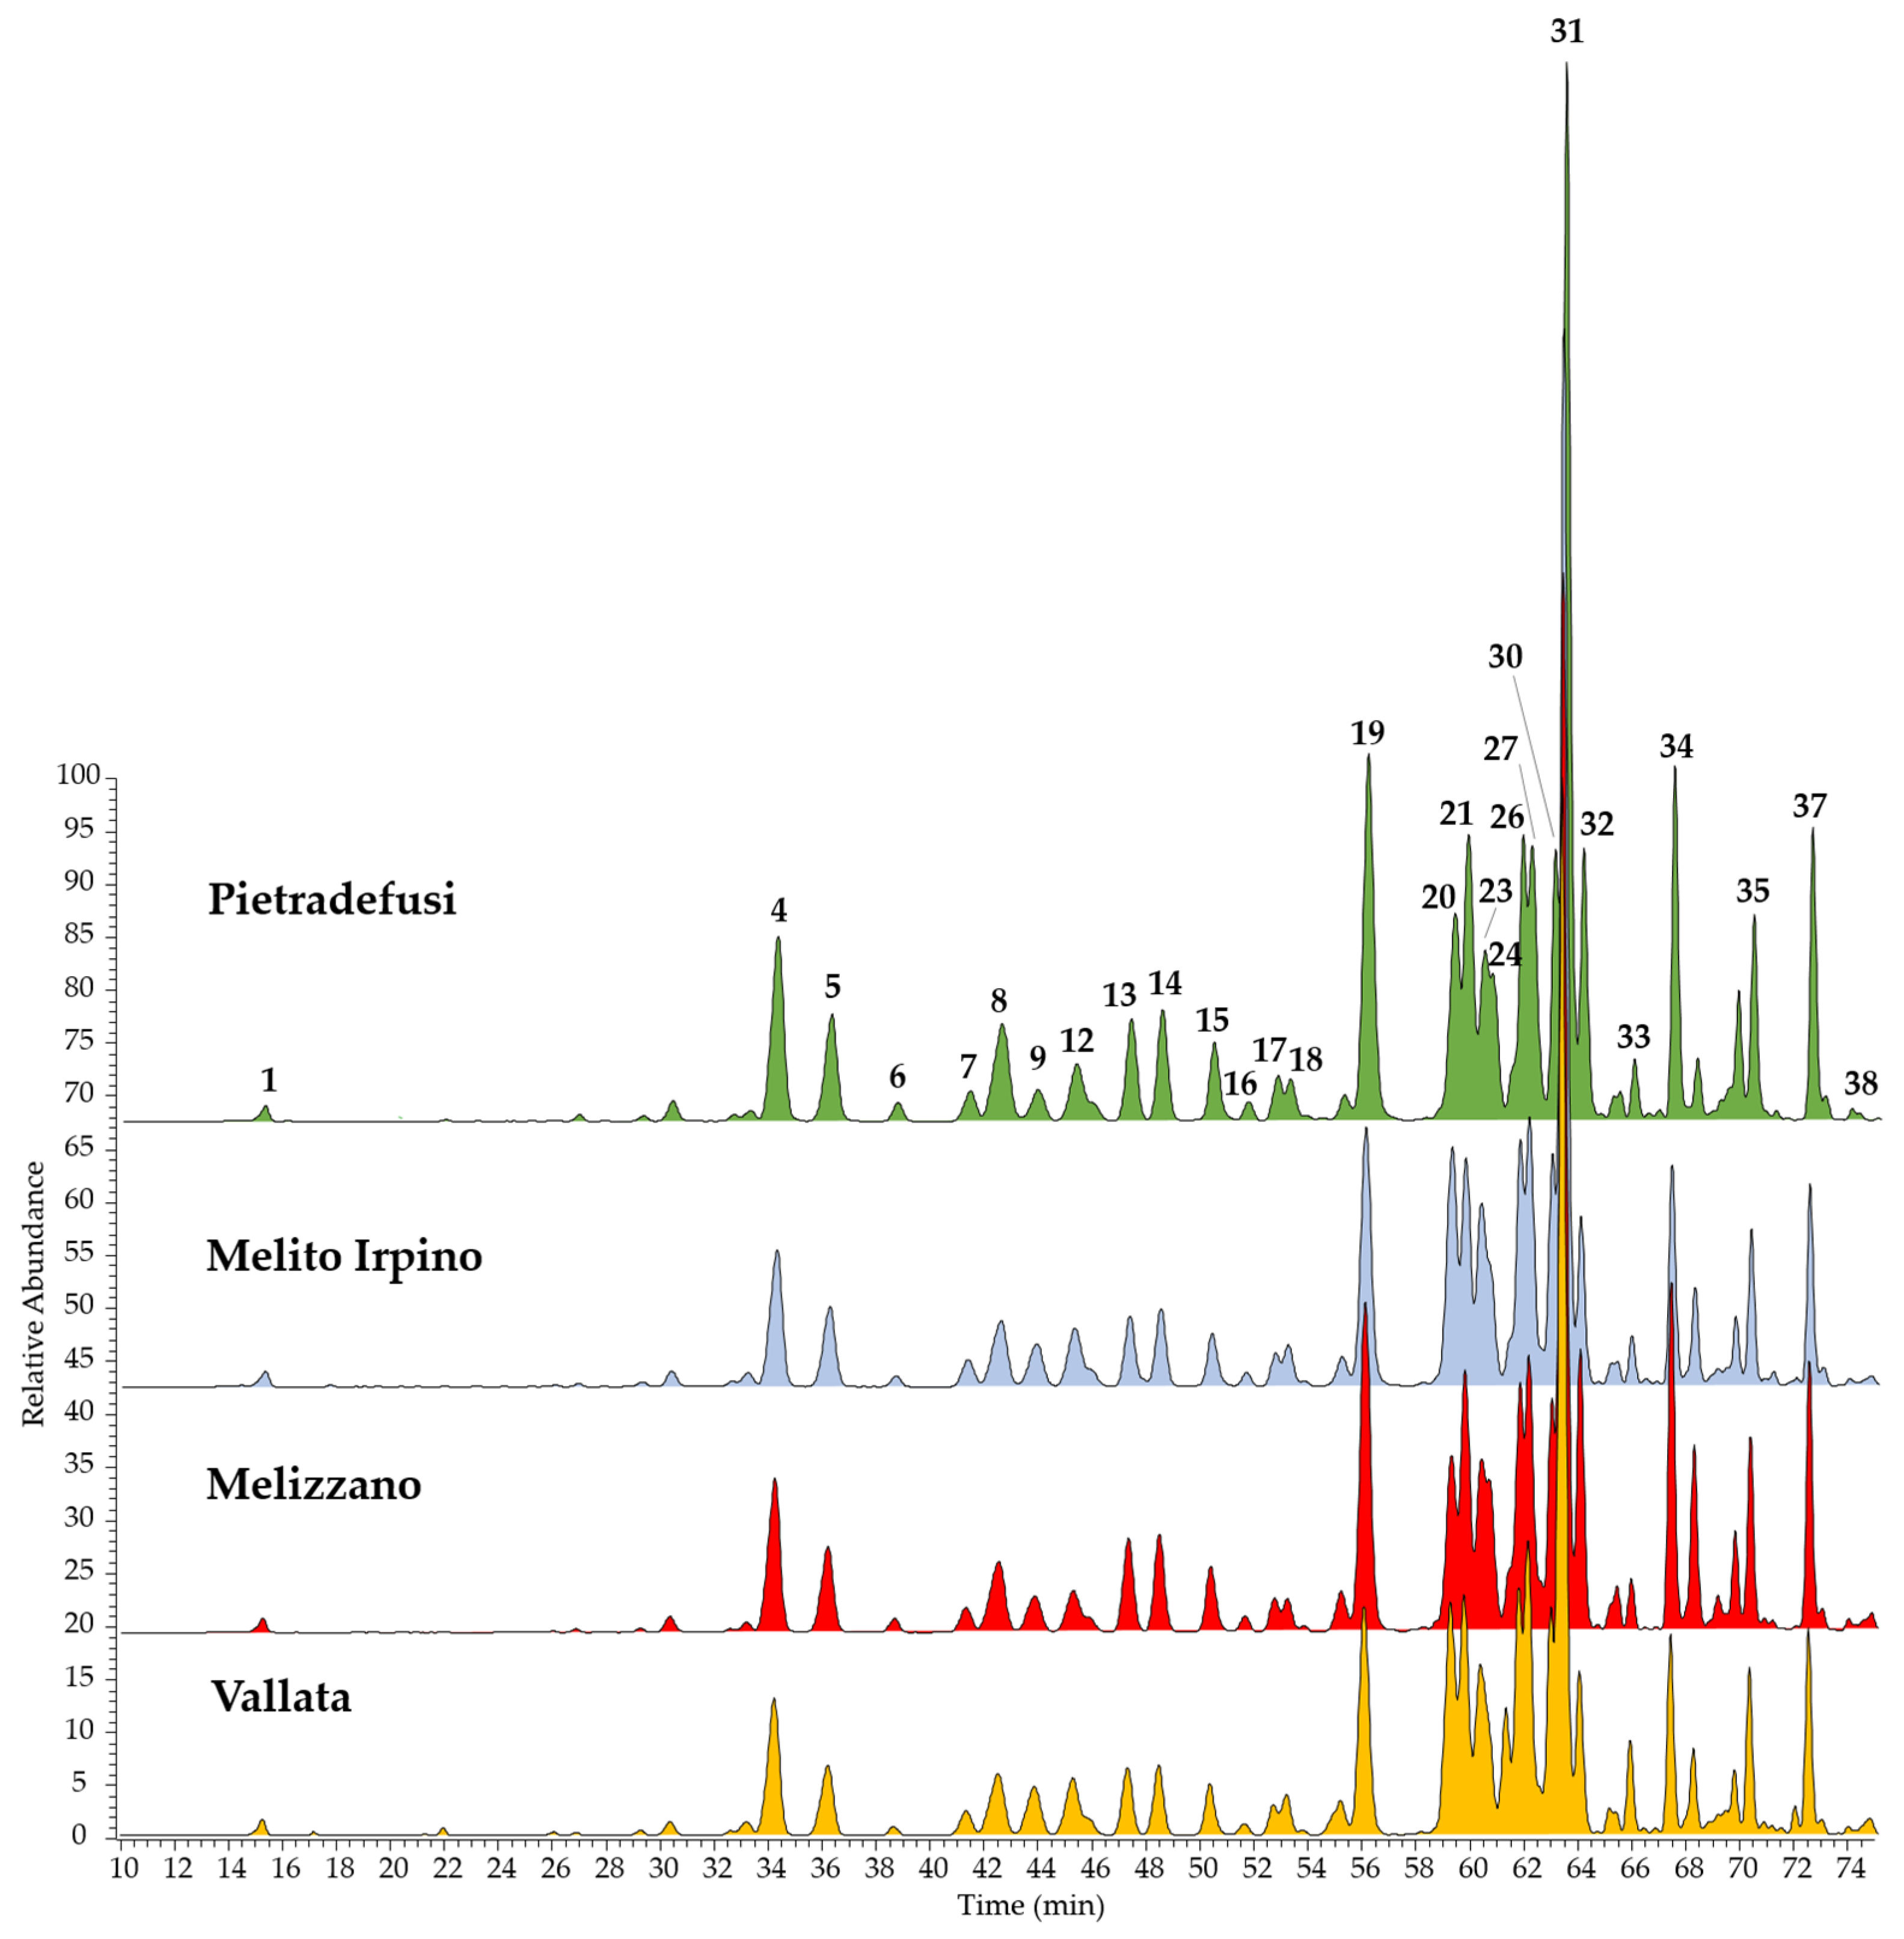
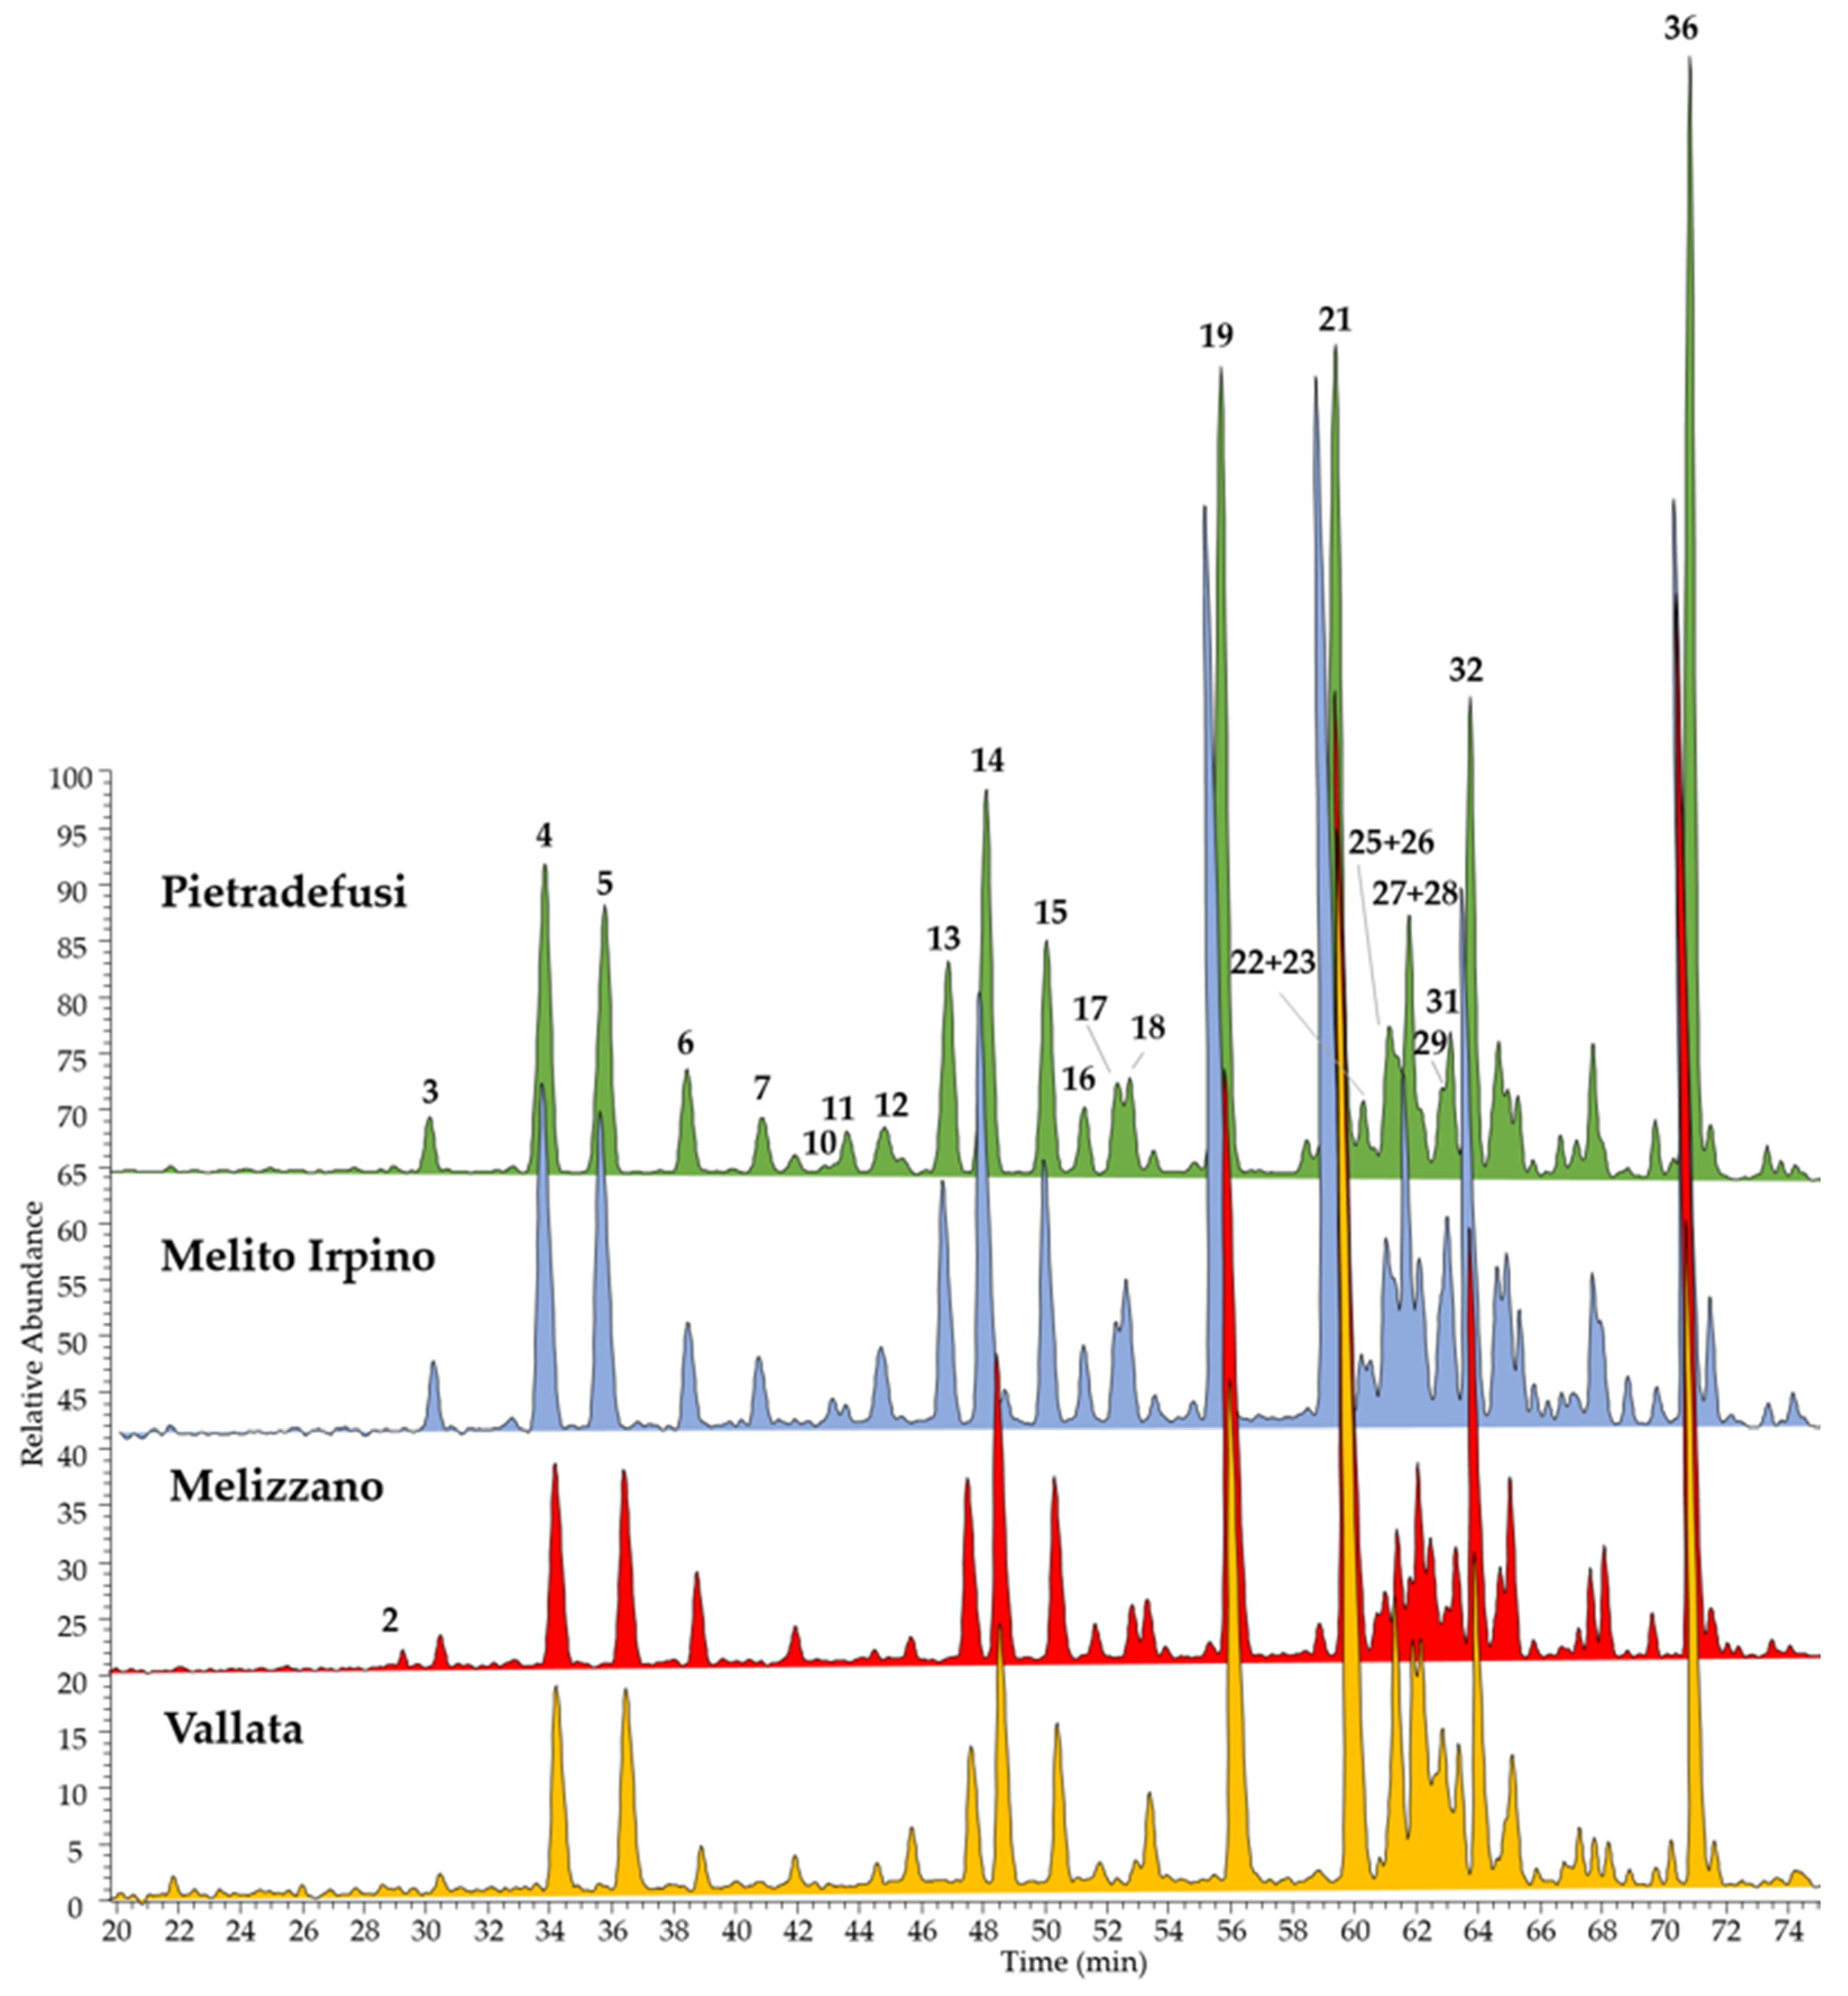
2.1.1. Comparative Analysis of Four Different Italian Propolis
2.1.2. Chemical Content of Pomegranate Peel and Grape Pomace
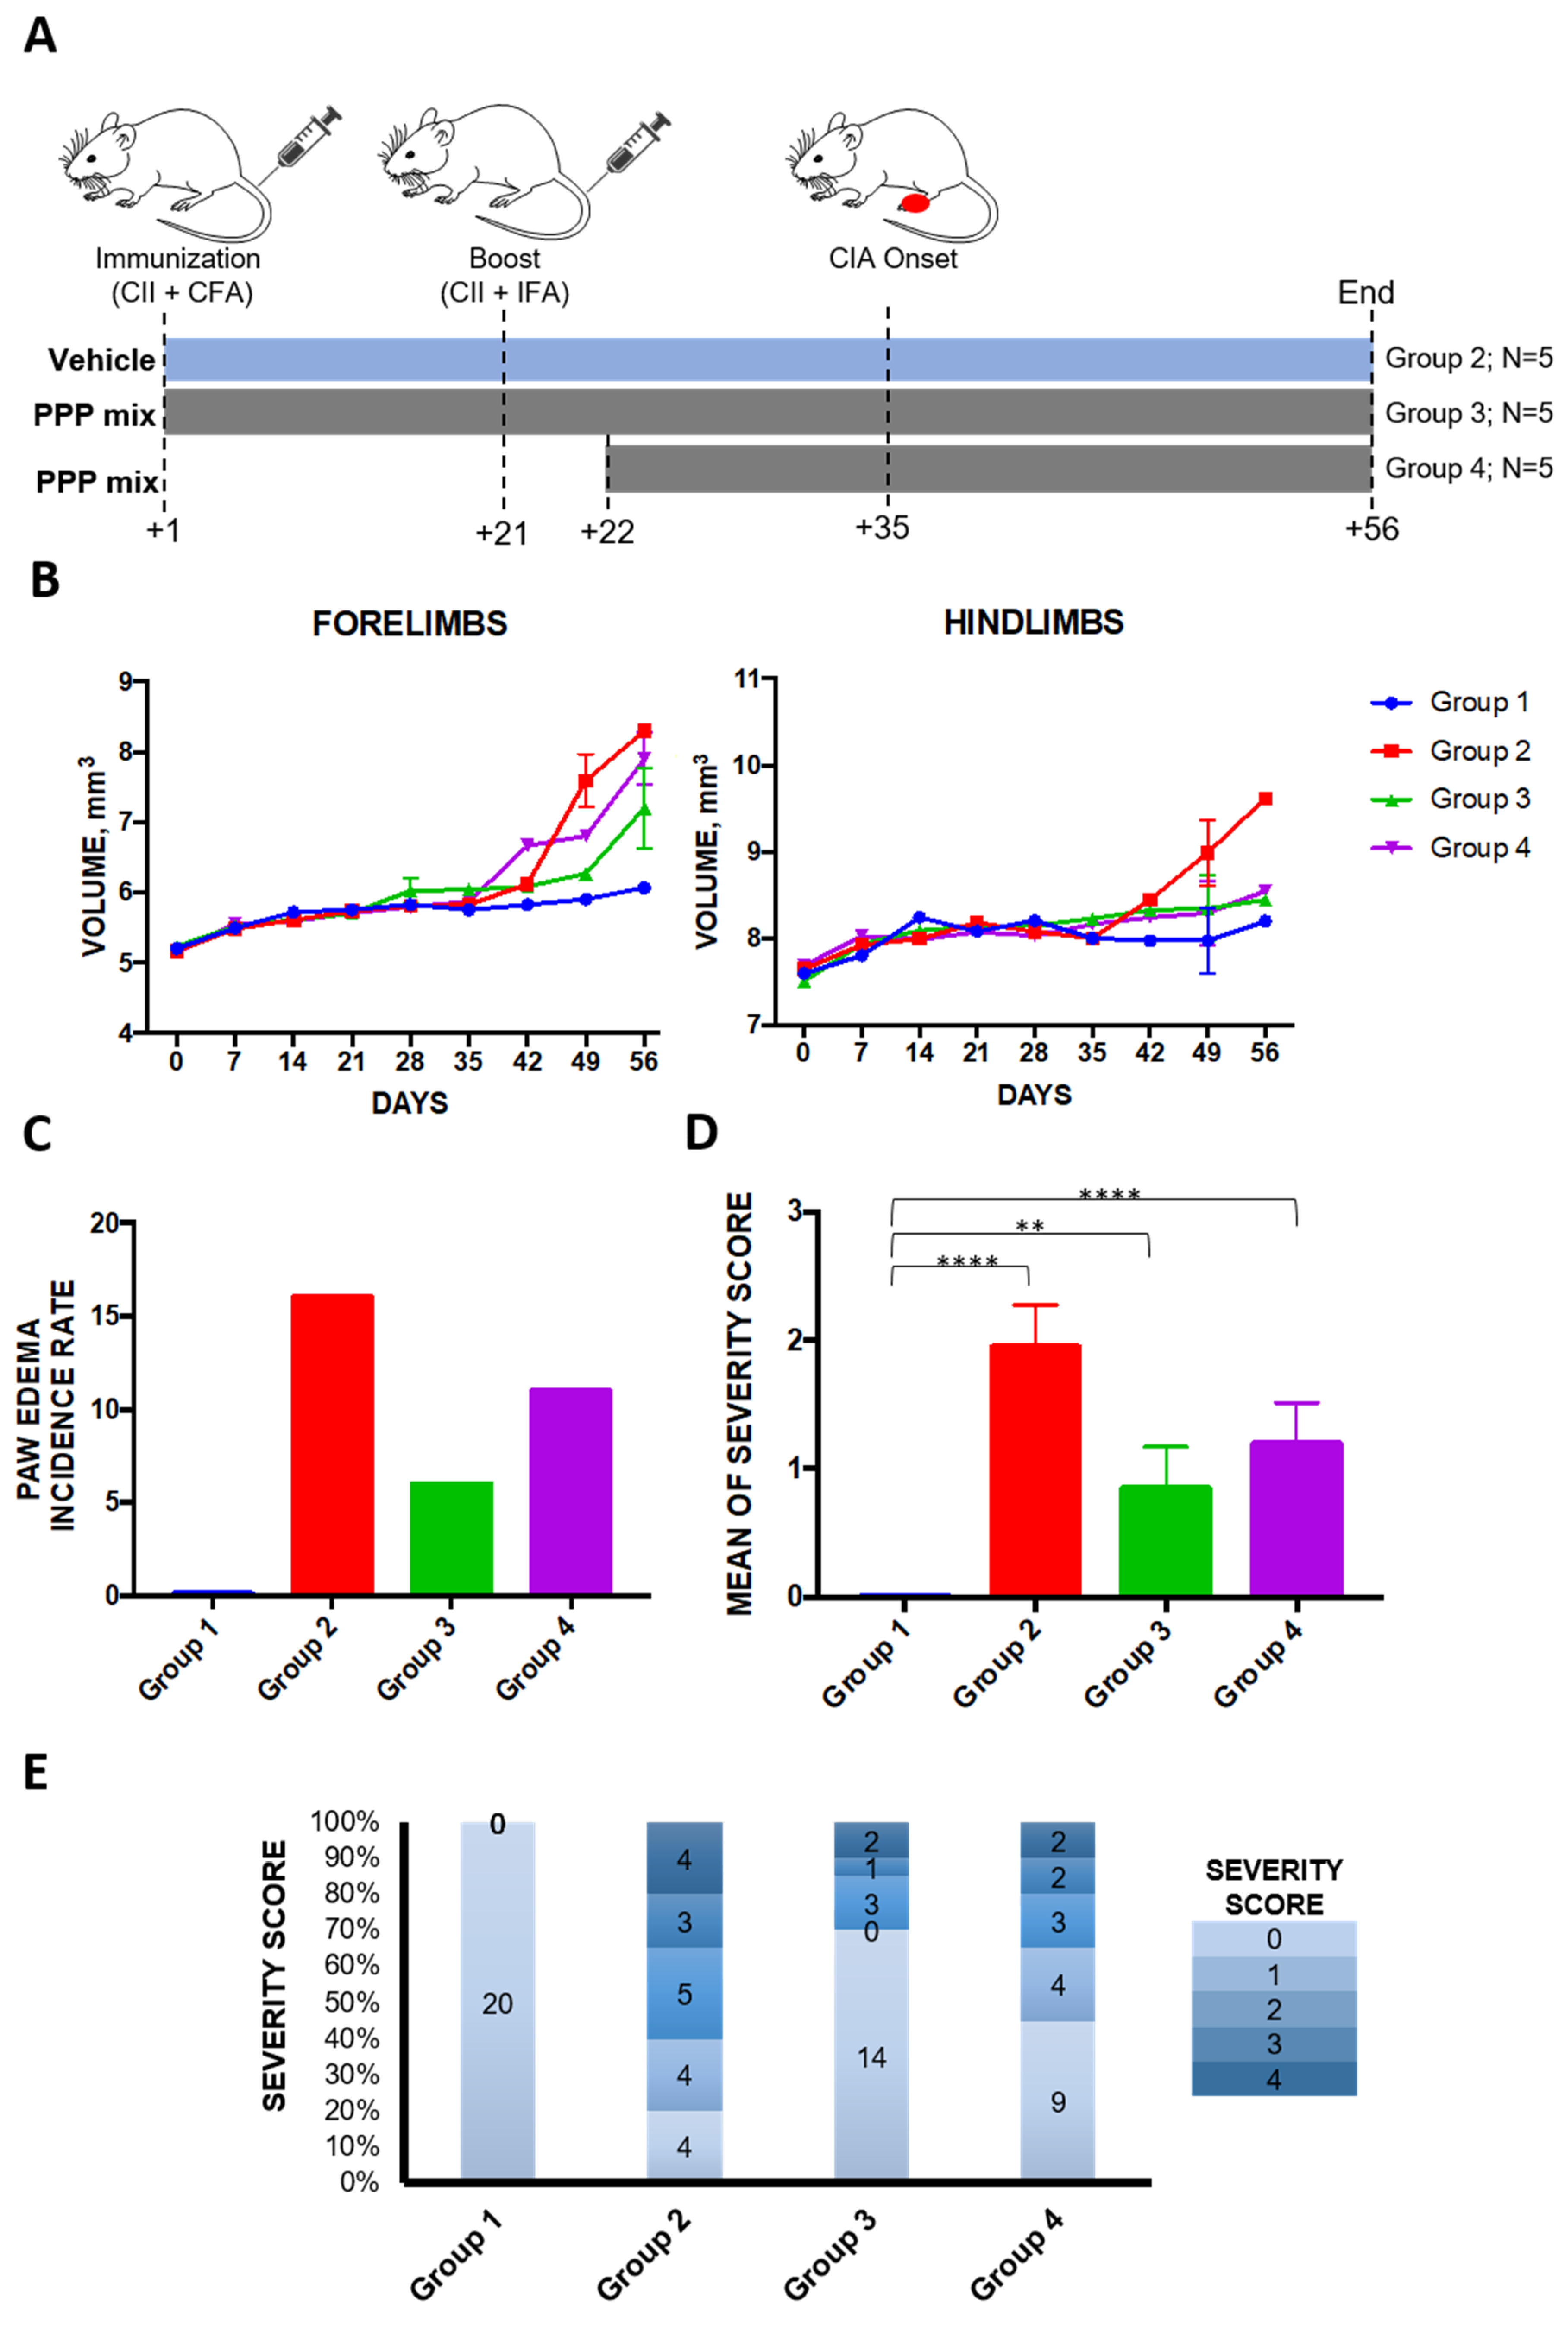
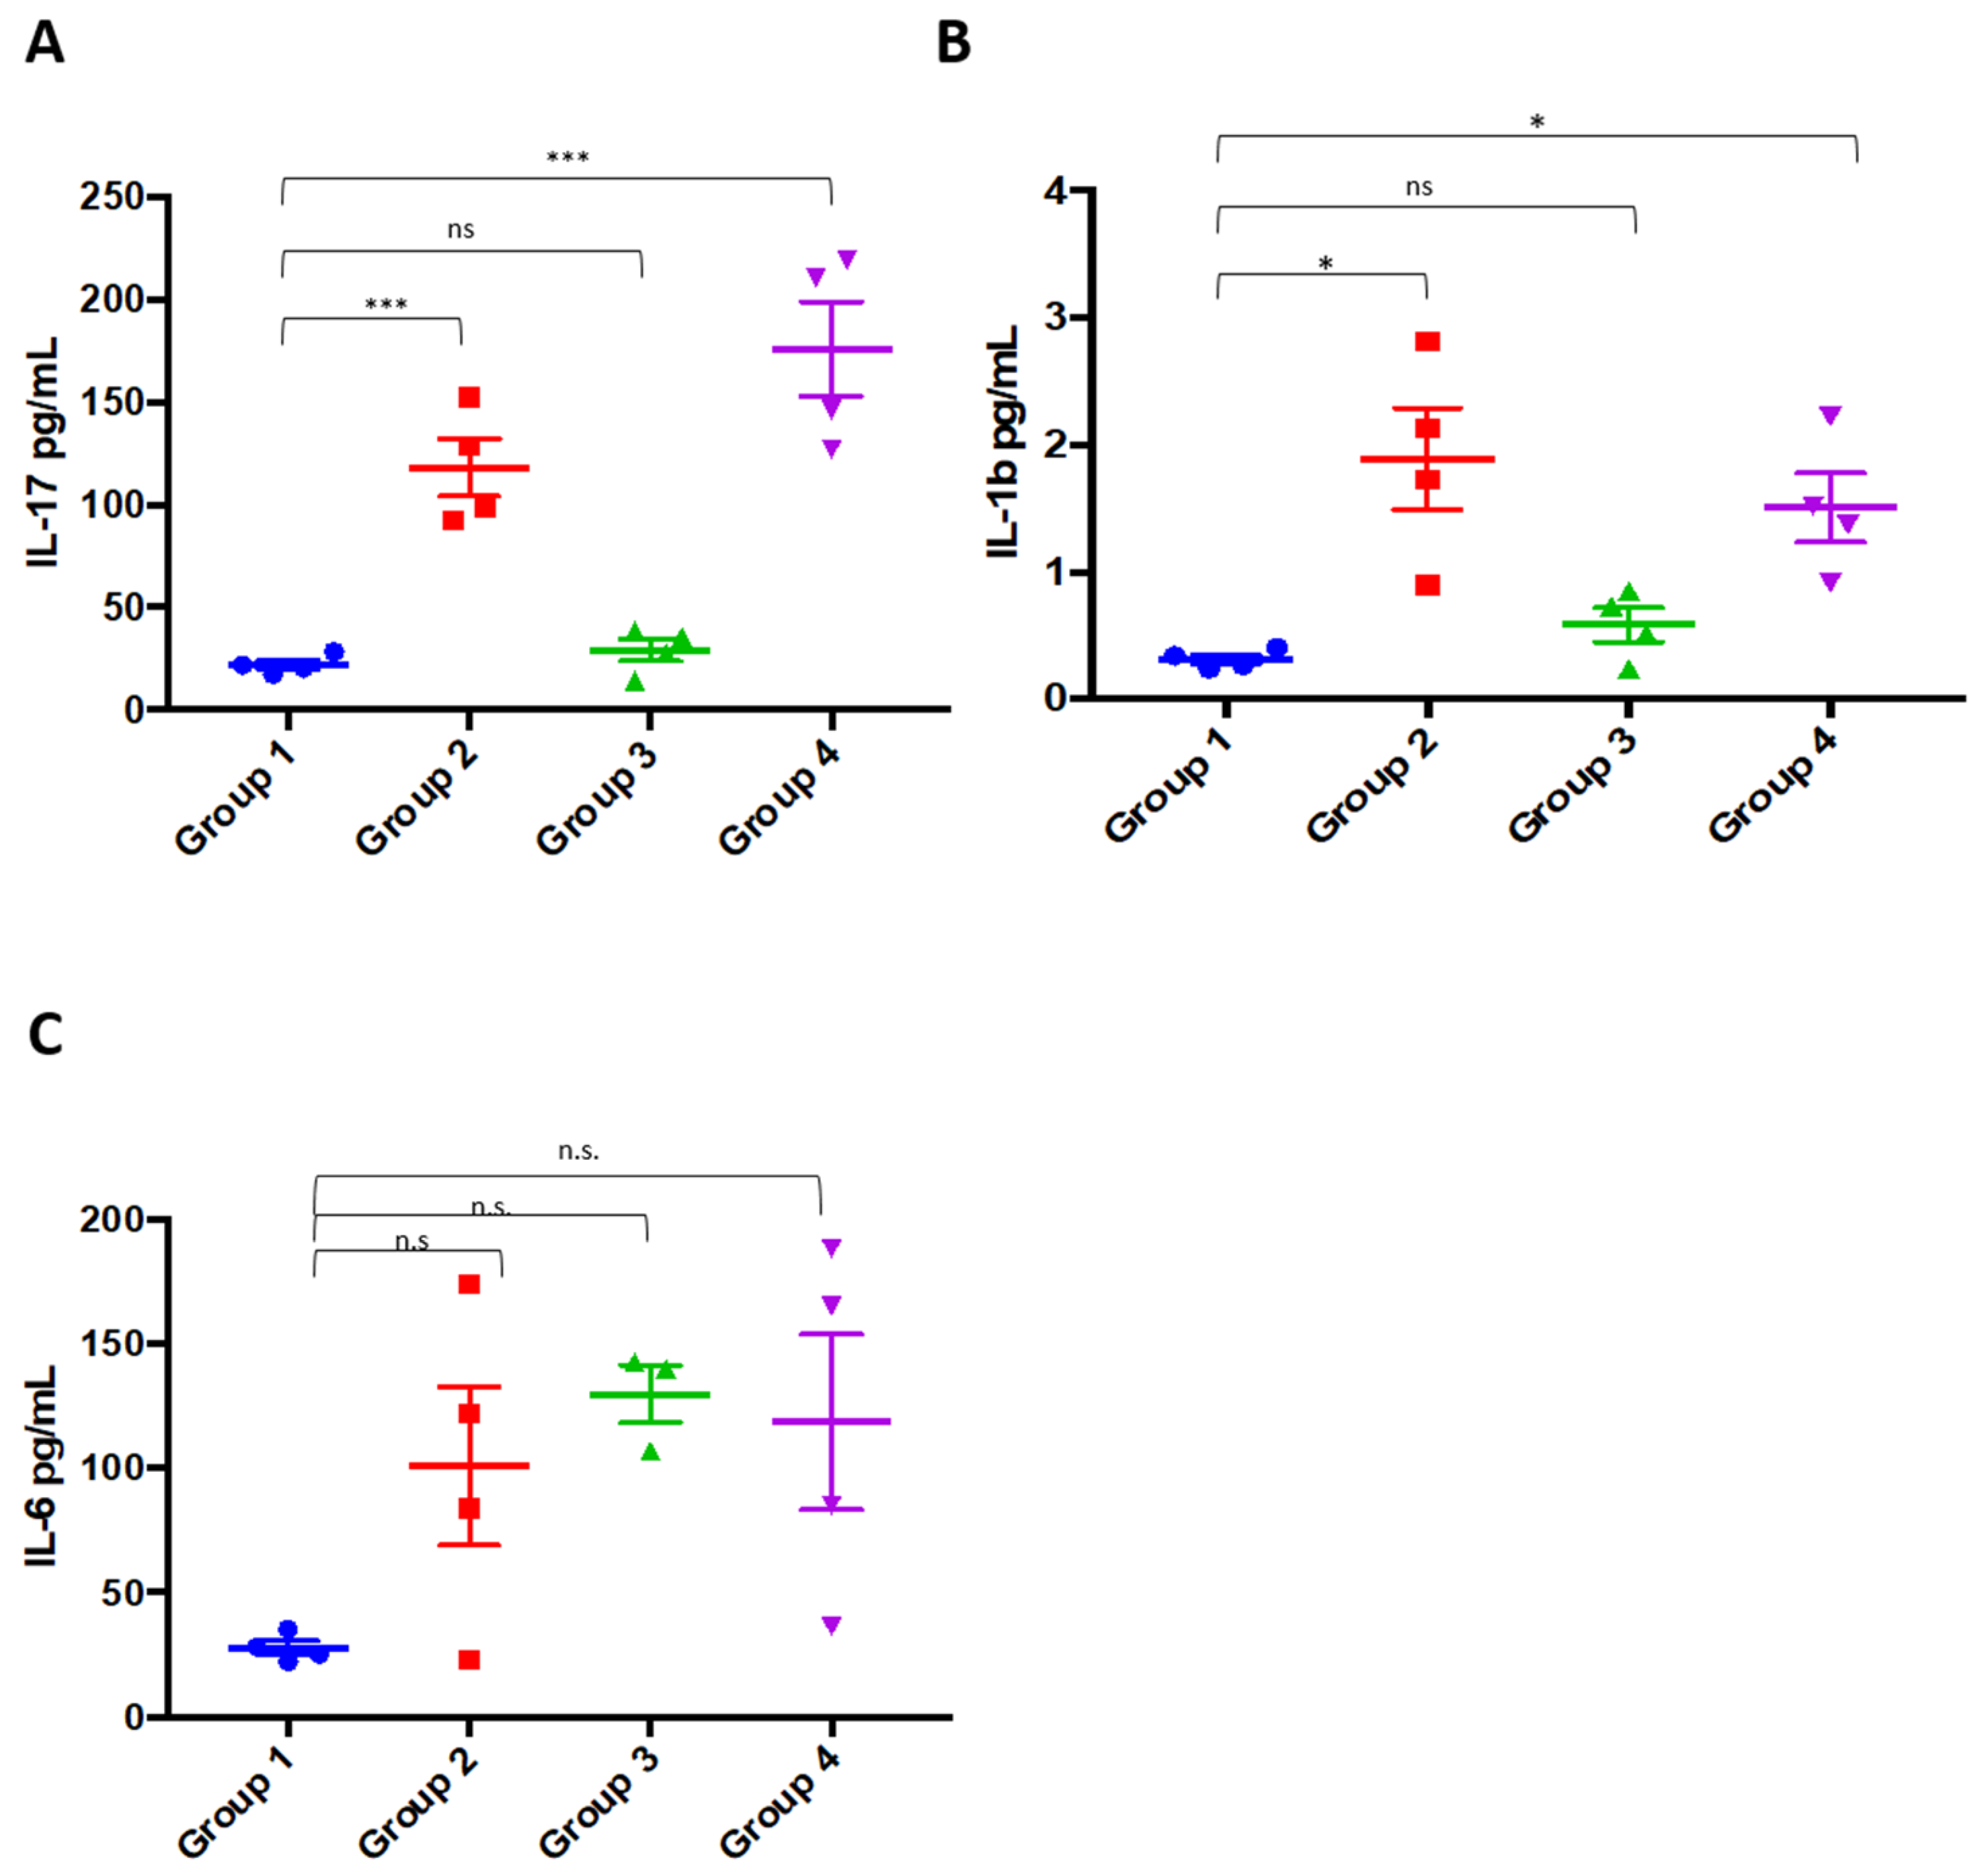
2.2. Murine RA Model Assay
3. Materials and Methods
3.1. Chemicals
3.2. Materials
3.3. Extraction
3.3.1. Preliminary Laboratory Scale Investigation on Propolis Samples
3.3.2. Scale up Extract Preparation
3.4. LC-MS Analyses
3.4.1. Quali-Quantitative Analyses of Phenols in Propolis Extracts
3.4.2. Chemical Characterization of Pomegranate Peel and Grape Pomace
3.5. Collagen-Induced Arthritis Assay
3.6. Statistical Analysis
4. Conclusions
Author Contributions
Funding
Acknowledgments
Conflicts of Interest
References
- van der Woude, D.; van der Helm-van Mil, A.H.M. Update on the epidemiology, risk factors, and disease outcomes of rheumatoid arthritis. Best Pract. Res. Clin. Rheumatol. 2018, 32, 174–187. [Google Scholar] [CrossRef]
- Smolen, J.S.; Aletaha, D.; McInnes, I.B. Rheumatoid arthritis. Lancet 2017, 388, 2023–2038. [Google Scholar] [CrossRef]
- Carmona, L.; Cross, M.; Williams, B.; Lassere, M.; March, L. Rheumatoid arthritis. Best Pract. Res. Clin. Rheumatol. 2010, 24, 733–745. [Google Scholar] [CrossRef] [PubMed]
- Spel, L.; Martinon, F. Inflammasomes contributing to inflammation in arthritis. Immunol. Rev. 2020, 294, 48–62. [Google Scholar] [CrossRef] [PubMed]
- Khan, M.A.; Khurana, N.; Ahmed, R.S.; Umar, S.; Md, G.; Sarwar, A.H.; Alam, Q.; Kamal, M.A.; Ashraf, G.M. Chemokines: A potential therapeutic target to suppress autoimmune arthritis. Curr. Pharm. Des. 2019, 25, 2937–2946. [Google Scholar] [CrossRef]
- Kishore, N.; Kumar, P.; Shanker, K.; Verma, A.K. Human disorders associated with inflammation and the evolving role of natural products to overcome. Eur. J. Med. Chem. 2019, 179, 272–309. [Google Scholar] [CrossRef]
- Attiq, A.; Jalil, J.; Husain, K.; Ahmad, W. Raging the war against inflammation with natural products. Front. Pharmacol. 2018, 9, 976. [Google Scholar] [CrossRef]
- Fonseca, L.J.S.; Nunes-Souza, V.; Goulart, M.O.F.; Rabelo, L.A. Oxidative stress in rheumatoid arthritis: What the future might hold regarding novel biomarkers and add-on therapies. Oxid. Med. Cell. Longev. 2019, 2019, 7536805. [Google Scholar] [CrossRef]
- Dudics, S.; Langan, D.; Meka, R.R.; Venkatesha, S.H.; Berman, B.M.; Che, C.-T.; Moudgil, K.D. Natural products for the treatment of autoimmune arthritis: Their mechanisms of action, targeted delivery, and interplay with the host microbiome. Int. J. Mol. Sci. 2018, 19, 2508. [Google Scholar] [CrossRef]
- Mphahlele, R.R.; Fawole, O.A.; Stander, M.A.; Opara, U.L. Preharvest and postharvest factors influencing bioactive compounds in pomegranate (Punica granatum L.)—A review. Sci. Hort. 2014, 178, 114–123. [Google Scholar] [CrossRef]
- Teixeira, A.; Eiras-Dias, J.; Castellarin, S.D.; Gerós, H. Berry Phenolics of grapevine under challenging environments. Int. J. Mol. Sci. 2013, 14, 18711–18739. [Google Scholar] [CrossRef] [PubMed]
- Brighenti, V.; Groothuis, S.F.; Prencipe, F.P.; Amir, R.; Benvenuti, S.; Pellati, F. Metabolite fingerprinting of Punica granatum L. (pomegranate) polyphenols by means of high-performance liquid chromatography with diode array and electrospray ionization-mass spectrometry detection. J. Chromatogr. A 2017, 1480, 20–31. [Google Scholar] [CrossRef] [PubMed]
- Fontana, A.R.; Antoniolli, A.; Bottini, R. Grape pomace as a sustainable source of bioactive compounds: Extraction, characterization, and biotechnological applications of phenolics. Agric. Food Chem. 2013, 61, 8987–9003. [Google Scholar] [CrossRef] [PubMed]
- Ruberto, G.; Renda, A.; Daquino, C.; Amico, V.; Spatafora, C.; Tringali, C.; De Tommasi, N. Polyphenol constituents and antioxidant activity of grape pomace extracts from five Sicilian red grape cultivars. Food Chem. 2007, 100, 203–210. [Google Scholar] [CrossRef]
- Guaita, M.; Bosso, A. Polyphenolic characterization of grape skins and seeds of four Italian red cultivars at harvest and after fermentative maceration. Foods 2019, 8, 395. [Google Scholar] [CrossRef] [PubMed]
- Saftic, L.; Persuric, Z.; Fornal, E.; Pavlesic, T. Targeted and untargeted LC-MS polyphenolic profiling and chemometric analysis of propolis from different regions of Croatia. J. Pharm. Biomed. Anal. 2019, 165, 162–172. [Google Scholar] [CrossRef]
- Silva-Carvalho, R.; Baltazar, F. Almeida-Aguiar. Propolis, a complex natural product with a plethora of biological activities that can be explored for drug development. Evid. Based Complement. Alternat. Med. 2015, 206439. [Google Scholar] [CrossRef]
- Tanaka, M.; Okamoto, Y.; Fukui, T.; Masuzawa, T. Suppression of interleukin 17 production by Brazilian propolis in mice with collagen-induced arthritis. Inflammopharmacology 2012, 20, 19–26. [Google Scholar] [CrossRef]
- Gupta, M.; Dey, S.; Marbaniang, D.; Pal, P.; Ray, S.; Mazumder, B.J. Grape seed extract: Having a potential health benefits. Food Sci. Technol. 2020, 57, 1205–1215. [Google Scholar] [CrossRef]
- Rodríguez-Pérez, C.; García-Villanova, B.; Guerra-Hernández, E.; Verardo, V. Grape seeds proanthocyanidins: An overview of in vivo bioactivity in animal models. Nutrients 2019, 11, 2435. [Google Scholar] [CrossRef]
- Mossalayi, M.D.; Rambert, J.; Renouf, E.; Micouleau, M.; Mérillon, J.M. Grape polyphenols and propolis mixture inhibits inflammatory mediator release from human leukocytes and reduces clinical scores in experimental arthritis. Phytomedicine 2014, 21, 290–297. [Google Scholar] [CrossRef] [PubMed]
- Harzallah, A.; Hammami, M.; Kępczyńska, M.A.; Hislop, D.C.; Arch, J.R.; Cawthorne, M.A.; Zaibi, M.S. Comparison of potential preventive effects of pomegranate flower, peel and seed oil on insulin resistance and inflammation in high-fat and high-sucrose diet-induced obesity mice model. Arch. Physiol. Biochem. 2016, 122, 75–87. [Google Scholar] [CrossRef] [PubMed]
- Neyrinck, A.M.; Van Hée, V.F.; Bindels, L.B.; De Backer, F.; Cani, P.D.; Delzenne, N.M. Polyphenol-rich extract of pomegranate peel alleviates tissue inflammation and hypercholesterolaemia in high-fat diet-induced obese mice: Potential implication of the gut microbiota. Br. J. Nutr. 2013, 109, 802–809. [Google Scholar] [CrossRef] [PubMed]
- Rasheed, Z.; Akhtar, N.; Anbazhagan, A.N.; Ramamurthy, S.; Shukla, M.; Haqqi, T.M. Polyphenol-rich pomegranate fruit extract (POMx) suppresses PMACI-induced expression of pro-inflammatory cytokines by inhibiting the activation of MAP Kinases and NF-κB in human KU812 cells. J. Inflamm. 2009, 6, 1. [Google Scholar] [CrossRef] [PubMed]
- De Nisco, M.; Manfra, M.; Bolognese, A.; Sofo, A.; Scopa, A.; Tenore, G.C.; Pagano, F.; Milite, C.; Russo, M.T. Nutraceutical properties and polyphenolic profile of berry skin and wine of Vitis vinifera L. (cv. Aglianico). Food Chem. 2013, 140, 623–629. [Google Scholar] [CrossRef]
- Falcão, S.I.; Tomása, A.; Valec, N.; Gomesc, P.; Freireb, C.; Vilas-Boasa, M. Phenolic quantification and botanical origin of Portuguese propolis. Ind. Crop. Prod. 2013, 49, 805–812. [Google Scholar] [CrossRef]
- Pellati, F.; Prencipe, F.P.; Bertelli, D.; Benvenuti, S. An efficient chemical analysis of phenolic acids and flavonoids in raw propolis by microwave-assisted extraction combined with high-performance liquid chromatography using the fused-core technology. J. Pharm. Biomed. Anal. 2013, 81, 126–132. [Google Scholar] [CrossRef]
- De Zordi, N.; Cortesi, A.; Kikic, I.; Moneghini, M.; Solinas, D.; Innocenti, G.; Portoland, A.; Baratto, G.; Dall’Acqua, S. The supercritical carbon dioxide extraction of polyphenols from propolis: A central composite design approach. J. Supercrit. Fluid 2014, 95, 491–498. [Google Scholar] [CrossRef]
- Pellati, F.; Orlandini, G.; Pinetti, D.; Benvenuti, S. HPLC-DAD and HPLC-ESI-MS/MS methods for metabolite profiling of propolis extracts. J. Pharm. Biomed. Anal. 2011, 55, 934–948. [Google Scholar] [CrossRef]
- Fischer, U.A.; Carle, R.; Kammerer, D.R. Identification and quantification of phenolic compounds from pomegranate (Punica granatum L.) peel, mesocarp, aril and differently produced juices by HPLC-DAD-ESI/MS(n). Food Chem. 2011, 127, 807–821. [Google Scholar] [CrossRef]
- Mena, P.; Calani, L.; Dall’Asta, C.; Galaverna, G.; García-Viguera, C.; Bruni, R.; Crozier, A.; Del Rio, D. Rapid and comprehensive evaluation of (poly)phenolic compounds in pomegranate (Punica granatum L.) juice by UHPLC-MSn. Molecules 2012, 17, 14821–14840. [Google Scholar] [CrossRef] [PubMed]
- Asenstorfer, R.E.; Markides, A.J.; Iland, P.G.; Jones, G.P. Formation of vitisin A during red wine fermentation and maturation. Aus. J. Grape Wine Res. 2003, 9, 40–46. [Google Scholar] [CrossRef]
- Bakker, J.; Timberlake, C.F. Isolation, identification, and characterization of new color-stable anthocyanins occurring in some red wines. J. Agric. Food Chem. 1997, 45, 35–43. [Google Scholar] [CrossRef]
- Flamini, R. Recent applications of mass spectrometry in the study of grape and wine polyphenols. Int. Sch. Res. Notices-Spectroscopy 2013, 2013, 813563. [Google Scholar] [CrossRef]
- Kammerer, D.; Claus, A.; Carle, R.; Schieber, A. Polyphenol screening of pomace from red and white grape varieties (Vitis vinifera L.) by HPLC-DAD-MS/MS. J. Agr. Food Chem. 2004, 52, 4360–4367. [Google Scholar] [CrossRef]
- Jara-Palacios, M.J.; Hernanz, D.; Cifuentes-Gomez, T.; Escudero-Gilete, M.L.; Heredia, F.J.; Spencer, J.P. Assessment of white grape pomace from winemaking as source of bioactive compounds, and its antiproliferative activity. Food Chem. 2015, 183, 78–82. [Google Scholar] [CrossRef]
- Taams, L.S. Interleukin-17 in rheumatoid arthritis: Trials and tribulations. J. Exp. Med. 2020, 217, e20192048. [Google Scholar] [CrossRef]
- Choi, E.M.; Kim, Y.H. A preliminary study of the effects of an extract of Ligularia fischeri leaves on type II collagen-induced arthritis in DBA/1J mice. Food Chem. Toxicol. 2008, 46, 375–379. [Google Scholar] [CrossRef]
- Lee, J.H.; Lim, H.; Kwon, Y.S.; Kim, H.P. New phytoformula (CAS) containing the roots of Cyathula officinalis, Achyranthes japonica and Sophora subprostrata inhibits collagen-induced arthritis in mice. Nat. Prod. Sci. 2014, 20, 17–21. [Google Scholar]
- Nho, J.-H.; Lee, H.-J.; Jung, H.-J.; Jang, J.-H.; Lee, K.-H.; Kim, A.-H.; Sung, T.-K.; Cho, H.-W. Effect of Saururus chinensis leaves extract on type II collagen-induced arthritis mouse model. BMC Complement. Altern. Med. 2019, 19, 2. [Google Scholar] [CrossRef]
- Da Pozzo, E.; De Leo, M.; Faraone, I.; Milella, L.; Cavallini, C.; Piragine, E.; Testai, L.; Calderone, V.; Pistelli, L.; Braca, A.; et al. Antioxidant and antisenescence effects of bergamot juice. Oxidative Med. Cell. Longev. 2018, 9395804. [Google Scholar] [CrossRef] [PubMed]
Sample Availability: Samples of the compounds alpinetin, caffeic acid prenyl ester, luteolin, pinobanksin 5-methyl ether, and pinobanksin 3-O-acetate are available from the authors. |


| Peak * | Compound | tR (min) | M | [M − H]− | [M + HCOO]− | ESI-MS/MS Product Ions ** | UV (λmax) | Extract |
|---|---|---|---|---|---|---|---|---|
| 1 | Caffeic acid | 15.1 | 180 | 179 | - | 135 | 243, 324 | A-D |
| 4 | Pinobanksin 5-methyl ether | 34.1 | 286 | 285 | 331 | 267, 253, 239, 179, 139 | 236, 287 | A-D |
| 5 | Quercetin 3-methyl ether | 36.1 | 316 | 315 | - | 300, 271, 228 | 256, 357 | A-D |
| 6 | Chrysin 5-methyl ether | 38.6 | 268 | 267 | 313 | 252, 224 | 264, 319 | A-D |
| 7 | Apigenin | 41.2 | 270 | 269 | 315 | 225, 151, 117 | 268, 335 | A-D |
| 8 | Pinobanksin | 42.4 | 272 | 271 | 317 | 253, 243, 165, 107 | 236, 291 | A-D |
| 9 | Kaempferol | 43.7 | 286 | 285 | 331 | 257, 241 | 269, 364 | A-D |
| 12 | Isorhamnetin | 45.2 | 316 | 315 | 361 | 300, 151 | 255, 370 | A-D |
| 13 | Luteolin 3′-methyl ether | 47.2 | 300 | 299 | 345 | 284, 256, 151 | 267, 351 | A-D |
| 14 | Quercetin dimethyl ether | 48.4 | 330 | 329 | 375 | 314, 299, 285, 243 | 255, 356 | A-D |
| 15 | Galangin 5-methyl ether | 50.3 | 284 | 283 | 329 | 268, 239 | 260, 300, 351 | A-D |
| 16 | Pinobanksin 5-methyl ether-3-O-acetate | 51.2 | 328 | 327 | 373 | 285, 267, 252, 224 | 309 | A-D |
| 17 | Luteolin methyl ether | 52.7 | 300 | 299 | - | 284 | 268, 347 | A-D |
| 18 | Quercetin 7-methyl ether | 53.1 | 316 | 315 | 361 | 300, 271, 256, 193, 165 | 256, 368 | A-D |
| 19 | Quercetin dimethyl ether | 56.0 | 330 | 329 | - | 314, 299 | 256, 357 | A-D |
| 20 | Caffeic acid prenyl ester | 59.2 | 248 | 247 | 293 | 179, 135 | 245, 326 | A-D |
| 21 | Chrysin | 59.7 | 254 | 253 | - | 254, 209 | 268, 321 | A-D |
| 23 | Caffeic acid benzyl ester | 60.3 | 270 | 269 | - | 178, 134 | 295, 320 | A-D |
| 24 | Caffeic acid prenyl ester | 60.6 | 248 | 247 | 293 | 179, 203, 135 | 245, 327 | A-D |
| 26 | Pinocembrin | 61.7 | 256 | 255 | 300 | 300, 213, 187, 151, 145 | 237, 289 | A-C |
| 27 | Galangin | 62.1 | 270 | 269 | 315 | 269, 227, 197 | 266, 359 | A-C |
| 30 | Caffeic acid phenylethyl ester (CAPE) | 62.9 | 284 | 283 | 329 | 179, 135 | 301, 326 | A-C |
| 31 | Pinobanksin 3-O-acetate | 63.3 | 314 | 313 | 359 | 271, 253, 209 | 237, 293 | A-C |
| 32 | Methoxychrysin | 64.0 | 284 | 283 | 329 | 268, 239, 211 | 266, 335 | A-D |
| 33 | Caffeic acid cinnamyl ester | 65.9 | 296 | 295 | 341 | 251, 211, 178, 134 | 248, 301, 313 | A-D |
| 34 | Pinobanksin 3-O-propionate | 67.3 | 328 | 327 | 373 | 271, 253 | 293 | A-D |
| 35 | Pinobanksin 3-O-butyrate | 70.3 | 342 | 341 | - | 271, 253 | 248, 292 | A-D |
| 37 | Pinobanksin 3-O-pentanoate | 72.5 | 356 | 355 | 401 | 271, 253 | 292 | A-D |
| 38 | Pinobanksin 3-O-hexanoate | 73.9 | 370 | 369 | - | 271, 253 | 292 | A-D |
| Peak * | Compound | tR (min) | [M + H]+ | ESI-MS/MS Product Ions ** | UV (λmax) | Extract |
|---|---|---|---|---|---|---|
| 2 | Luteolin methyl ether | 29.1 | 301 | 286 | 259, 358 | C |
| 3 | Quercetin dimethyl ether | 30.3 | 331 | 316, 301 | 252, 362 | A-D |
| 4 | Pinobanksin 5-methyl ether | 33.8 | 287 | 269, 241, 91 | 288 | A-D |
| 5 | Quercetin 3-methyl ether | 35.7 | 317 | 302, 165, 153, 137 | 256, 357 | A-D |
| 6 | Chrysin 5-methyl ether | 269 | 254, 167 | 262, 329 | A-D | |
| 7 | Apigenin | 40.7 | 271 | 247, 153 | 268, 337 | A-D |
| 10 | Pinobanksin methyl ether | 43.0 | 287 | 269, 241 | 266, 366 | B-D |
| 11 | Alpinetin | 43.6 | 271 | 167, 131 | 268, 365 | A, D |
| 12 | Isorhamnetin | 44.6 | 317 | 302, 285, 261, 257 | 254, 370 | A, C |
| 13 | Luteolin 3′-methyl ether | 46.8 | 301 | 286 | 267, 350 | A-D |
| 14 | Quercetin dimethyl ether | 48.0 | 331 | 316, 301, 299 | 253, 355 | A-D |
| 15 | Galangin 5-methyl ether | 50. 0 | 285 | 270, 167 | 260, 352 | A-D |
| 16 | Pinobanksin 5-methyl ether-3-O-acetate | 51.2 | 329 | 287, 269, 241, 167 | 289, 329 | A-D |
| 17 | Luteolin methyl ether | 52.2 | 301 | 286 | 266, 348 | A-D |
| 18 | Quercetin 7-methyl ether | 52.6 | 317 | 302, 299, 271, 243, 179, 167 | 256, 370 | A-D |
| 19 | Quercetin dimethyl ether | 55.6 | 331 | 316, 299 | 256, 356 | A-D |
| 21 | Chrysin | 59.3 | 255 | 209, 153, 129 | 268, 314 | A-D |
| 22 | Flavonoid aglycon methyl ether | 60.1 | 285 | 270 | 245, 327 | B-D |
| 25 | Flavonoid aglycon methyl ether | 61.0 | 285 | 270 | 272, 318 | A-D |
| 26 | Pinocembrin | 61.3 | 257 | 215, 153, 131, 103 | 290 | A-D |
| 27 | Galangin | 61.7 | 271 | 165, 153 | 246, 327 | A-D |
| 28 | Luteolin methyl ether | 62.1 | 301 | 286 | 268, 362 | A-D |
| 29 | Quercetin dimethyl ether | 62.8 | 331 | 316, 299 | 296, 326 | A-D |
| 31 | Pinobanksin 3-O-acetate | 63.0 | 315 | 273, 255, 227, 153 | 296, 326 | A-D |
| 32 | Methoxychrysin | 63.7 | 285 | 270, 242 | 293 | A-D |
| 36 | Chrysin 5-methyl ether | 70.8 | 269 | 254, 167 | 289 | A-D |
| Peak | Compound | Pietradefusi | Melito Irpino | Melizzano | Vallata |
|---|---|---|---|---|---|
| 1 | Caffeic acid | 0.308 ± 0.01 | 0.273 ± 0.01 | 0.150 ± 0.03 | 0.203 ± 0.01 |
| 3 | Quercetin dimethyl ether | 0.014 ± 0.00 | 0.010 ± 0.00 | 0.005 ± 0.00 | Trace * |
| 4 | Pinobanksin 5-methyl ether | 0.971 ± 0.01 | 0.557 ± 0.05 | 0.354 ± 0.03 | 0.219 ± 0.01 |
| 5 | Quercetin 3-methyl ether | 0.843 ± 0.04 | 0.288 ± 0.01 | 0.252 ± 0.01 | 0.092 ± 0.00 |
| 6 | Chrysin 5-methyl ether | 0.612 ± 0.01 | 0.309 ± 0.03 | 0.260 ± 0.01 | 0.103 ± 0.01 |
| 7 | Apigenin | 0.378 ± 0.01 | 0.240 ± 0.02 | 0.179 ± 0.09 | 0.103 ± 0.02 |
| 8 | Pinobanksin | 1.226 ± 0.12 | 0.620 ± 0.00 | 0.542 ± 0.06 | 0.477 ± 0.03 |
| 9 | Kaempferol | 0.038 ± 0.00 | 0.021 ± 0.00 | 0.012 ± 0.00 | 0.031 ± 0.00 |
| 10 | Pinobanksin methyl ether | 0.126 ± 0.01 | 0.149 ± 0.02 | 0.071 ± 0.01 | 0.089 ± 0.01 |
| 11 | Alpinetin | 0.221 ± 0.00 | 0.127 ± 0.00 | 0.069 ± 0.01 | 0.053 ± 0.00 |
| 12 | Isorhamnetin | 0.267 ± 0.01 | 0.141 ± 0.01 | 0.020 ± 0.00 | 0.011 ± 0.00 |
| 13 | Luteolin 3′-methyl ether | 0.656 ± 0.00 | 0.361 ± 0.02 | 0.299 ± 0.02 | 0.170 ± 0.01 |
| 14 | Quercetin dimethyl ether | 0.791 ± 0.03 | 0.272 ± 0.01 | 0.281 ± 0.01 | 0.051 ± 0.00 |
| 15 | Galangin 5-methyl ether | 1.217 ± 0.00 | 0.653 ± 0.00 | 0.494 ± 0.00 | 0.265 ± 0.00 |
| 16 | Pinobanksin 5-methyl ether-3-O-acetate | 0.030 ± 0.00 | 0.020 ± 0.00 | 0.013 ± 0.00 | 0.012 ± 0.00 |
| 17 | Luteolin methyl ether | 0.479 ± 0.02 | 0.279 ± 0.03 | 0.143 ± 0.01 | 0.076 ± 0.08 |
| 18 | Quercetin 7-methyl ether | 0.374 ± 0.02 | 0.101 ± 0.00 | 0.051 ± 0.00 | 0.047 ± 0.00 |
| 19 | Quercetin dimethyl ether | 1.981 ± 0.13 | 0.704 ± 0.05 | 0.754 ± 0.03 | 0.278 ± 0.01 |
| 20 | Caffeic acid prenyl ester I | 3.930 ± 0.13 | 3.682 ± 0.05 | 1.779 ± 0.36 | 2.973 ± 0.12 |
| 21 | Chrysin | 4.535 ± 0.06 | 2.743 ± 0.08 | 2.267 ± 0.14 | 1.452 ± 0.08 |
| 22 | Flavonoid aglycon methyl ether | 0.323 ± 0.00 | 0.146 ± 0.01 | 0.097 ± 0.01 | 0.046 ± 0.01 |
| 23 | Caffeic acid benzyl ester | 3.220 ± 028 | 2.186 ± 0.11 | 0.914 ± 0.13 | 1.990 ± 0.14 |
| 24 | Caffeic acid prenyl ester II | 3.695 ± 0.02 | 2.750 ± 0.09 | 2.032 ± 0.28 | 1.574 ± 0.03 |
| 25 | Flavonoid aglycon methyl ether | 0.676 ± 0.03 | 0.392 ± 0.01 | 0.256 ± 0.04 | 0.040 ± 0.00 |
| 26 | Pinocembrin | 0.594 ± 0.02 | 0.387± 0.01 | 0.203 ± 0.02 | 0.140± 0.08 |
| 27 | Galangin | 0.983 ± 0.01 | 0.662 ± 0.00 | 0.351 ± 0.01 | 0.202 ± 0.03 |
| 28 | Luteolin methyl ether | 0.295 ± 0.01 | 0.389 ± 0.02 | 0.300 ± 0.03 | 0.168 ± 0.00 |
| 29 | Quercetin dimethyl ether | 0.139 ± 0.00 | 0.181 ± 0.00 | 0.466 ± 0.00 | 0.016 ± 0.00 |
| 30 | Caffeic acid phenylethyl ester (CAPE) | 4.100 ± 0.26 | 2.787 ± 0.07 | 1.811 ± 0.30 | 2.088 ± 0.13 |
| 31 | Pinobanksin 3-O-acetate | 1.415 ± 0.09 | 1.139 ± 0.02 | 0.747 ± 0.13 | 0.925 ± 0.06 |
| 32 | Methoxychrysin | 1.030 ± 0.01 | 0.590 ± 0.01 | 0.553 ± 0.05 | 0.249 ± 0.02 |
| 33 | Caffeic acid cinnamyl ester | 1.08 ± 0.07 | 0.715 ± 0.03 | 0.438 ± 0.09 | 0.910 ± 0.09 |
| 34 | Pinobanksin 3-O-propionate | 0.471 ± 0.03 | 0.249 ± 0.01 | 0.255 ± 0.04 | 0.177 ± 0.02 |
| 35 | Pinobanksin 3-O-butyrate | 0.292 ± 0.02 | 0.176 ± 0.01 | 0.143 ± 0.03 | 0.137 ± 0.01 |
| 36 | Chrysin 5-methyl ether | 4.450 ± 0.13 | 1.642 ± 0.05 | 1.884 ± 0.10 | 0.705 ± 0.70 |
| 37 | Pinobanksin 3-O-pentanoate | 0.509 ± 0.04 | 0.289 ± 0.01 | 0.261 ± 0.04 | 0.231 ± 0.02 |
| 38 | Pinobanksin 3-O-hexanoate | 1.415 ± 0.00 | 0.012 ± 0.00 | 0.014 ± 0.00 | 0.009 ± 0.00 |
| Total flavonoids | 22.85 ± 0.86 | 12.99 ± 0.49 | 10.92 ± 0.92 | 5.800 ± 1.23 | |
| Total phenolic acids | 16.33 ± 0.70 | 12.40 ± 0.37 | 7.124 ± 0.92 | 9.739 ± 0.53 | |
| Total phenols | 39.18 ± 1.56 | 25.39 ± 0.86 | 18.04 ± 1.84 | 15.54 ± 1.76 |
| Compound | [M − H]− | ESI-MS/MS Product Ions * | UV (λmax) |
|---|---|---|---|
| Pomegranate | |||
| Ellagitannins | |||
| Ellagic acid | 301 | 229, 173 | 254, 368 |
| Ellagic acid pentoside | 433 | 301, 285 | 254, 363 |
| Ellagic acid hexoside | 463 | 301 | 253, 362 |
| HHDP-hexoside | 481 | 301, 275 | 237 |
| Galloyl-HHDP-hexose | 633 | 463, 301, 275 | 235, 257 |
| Ellagic acid derivative | 799 | 781, 479, 301 | 235, 259 |
| Galloyl-HHDP-DHHDP-hexose (granatin B) | 952 | 933, 915, 613, 445, 301 | 237, 261 |
| Castalagin derivative | 965 | 933, 915, 781, 631, 445, 301 | 242, 269 |
| Gallagyl derivatives | |||
| Gallagyl-hexose (punicalin isomer I) | 781 | 721, 601, 575, 449, 299 | 223, 259, 376 |
| Gallagyl-hexose (punicalin isomer II) | 781 | 721, 601, 575, 449, 299 | 234, 259, 380 |
| HHDP-gallagyl-hexose (punicalagin isomer I) | 541 ** | 781, 601, 575, 301, 275 | 235, 259, 380 |
| HHDP-gallagyl-hexose (punicalagin isomer II) | 541 ** | 781, 601, 575, 301, 275 | 236, 258, 379 |
| Compound | HR-[M + H]+/[M]+ | HR-ESI-MS/MS Product Ions | Error (ppm) |
|---|---|---|---|
| Phenolics | |||
| Resveratrol | 229.0858 | 211, 135 | −0.43 |
| Catechin/epicatechin | 291.0860 | 165, 139, 123 | −1.03 |
| Quercetin | 303.0499 | 257, 229, 165, 137 | −0.01 |
| Cyanidin 3-O-glucoside | 449.1070 * | 287 | −1.78 |
| Delphinidin 3-O-glucoside | 465.1022 * | 303 | −1.07 |
| Petunidin 3-O-glucoside | 479.1176 * | 317 | −1.67 |
| Quercetin 3-O-glucuronide | 479.0812 | 303 | −1.67 |
| Malvidin 3-O-glucoside | 493.1329 * | 331 | −2.23 |
| Myricetin 3-O-glucuronide | 495.0751 | 319 | −3.64 |
| Laricitricin 3-O-glucoside | 495.1127 * | 333 | −1.21 |
| Syringetin 3-O-glucoside | 509.1278 | 347 | −2.36 |
| Vitisin B (malvidin-3-O-glucoside acetaldehyde) | 517.1331 * | 355 | −1.74 |
| Malvidin 3-O-acetylglucoside | 535.1430 * | 331 | −2.99 |
| Vitisin A (malvidin-3-O-glucoside pyruvate) | 561.1223 * | 399 | −2.85 |
| Procyanidin dimer | 579.1476 | 427, 291 | −3.63 |
| Procyanidin dimer | 595.1439 | 443, 291 | −1.18 |
| Malvidin 3-O-p-coumaroylglucoside | 639.1699 * | 331 | −1.41 |
| Malvidin 3-O-glucoside-ethyl-(epi)catechin | 809.2177 * | 647, 519, 357 | −1.41 |
| Procyanidin trimer | 867.2130 | 579, 427 | −0.11 |
| Malvidin 3-O-p-coumaroylglucoside-ethyl-(epi)catechin | 955.2630 * | 665, 357 | −2.62 |
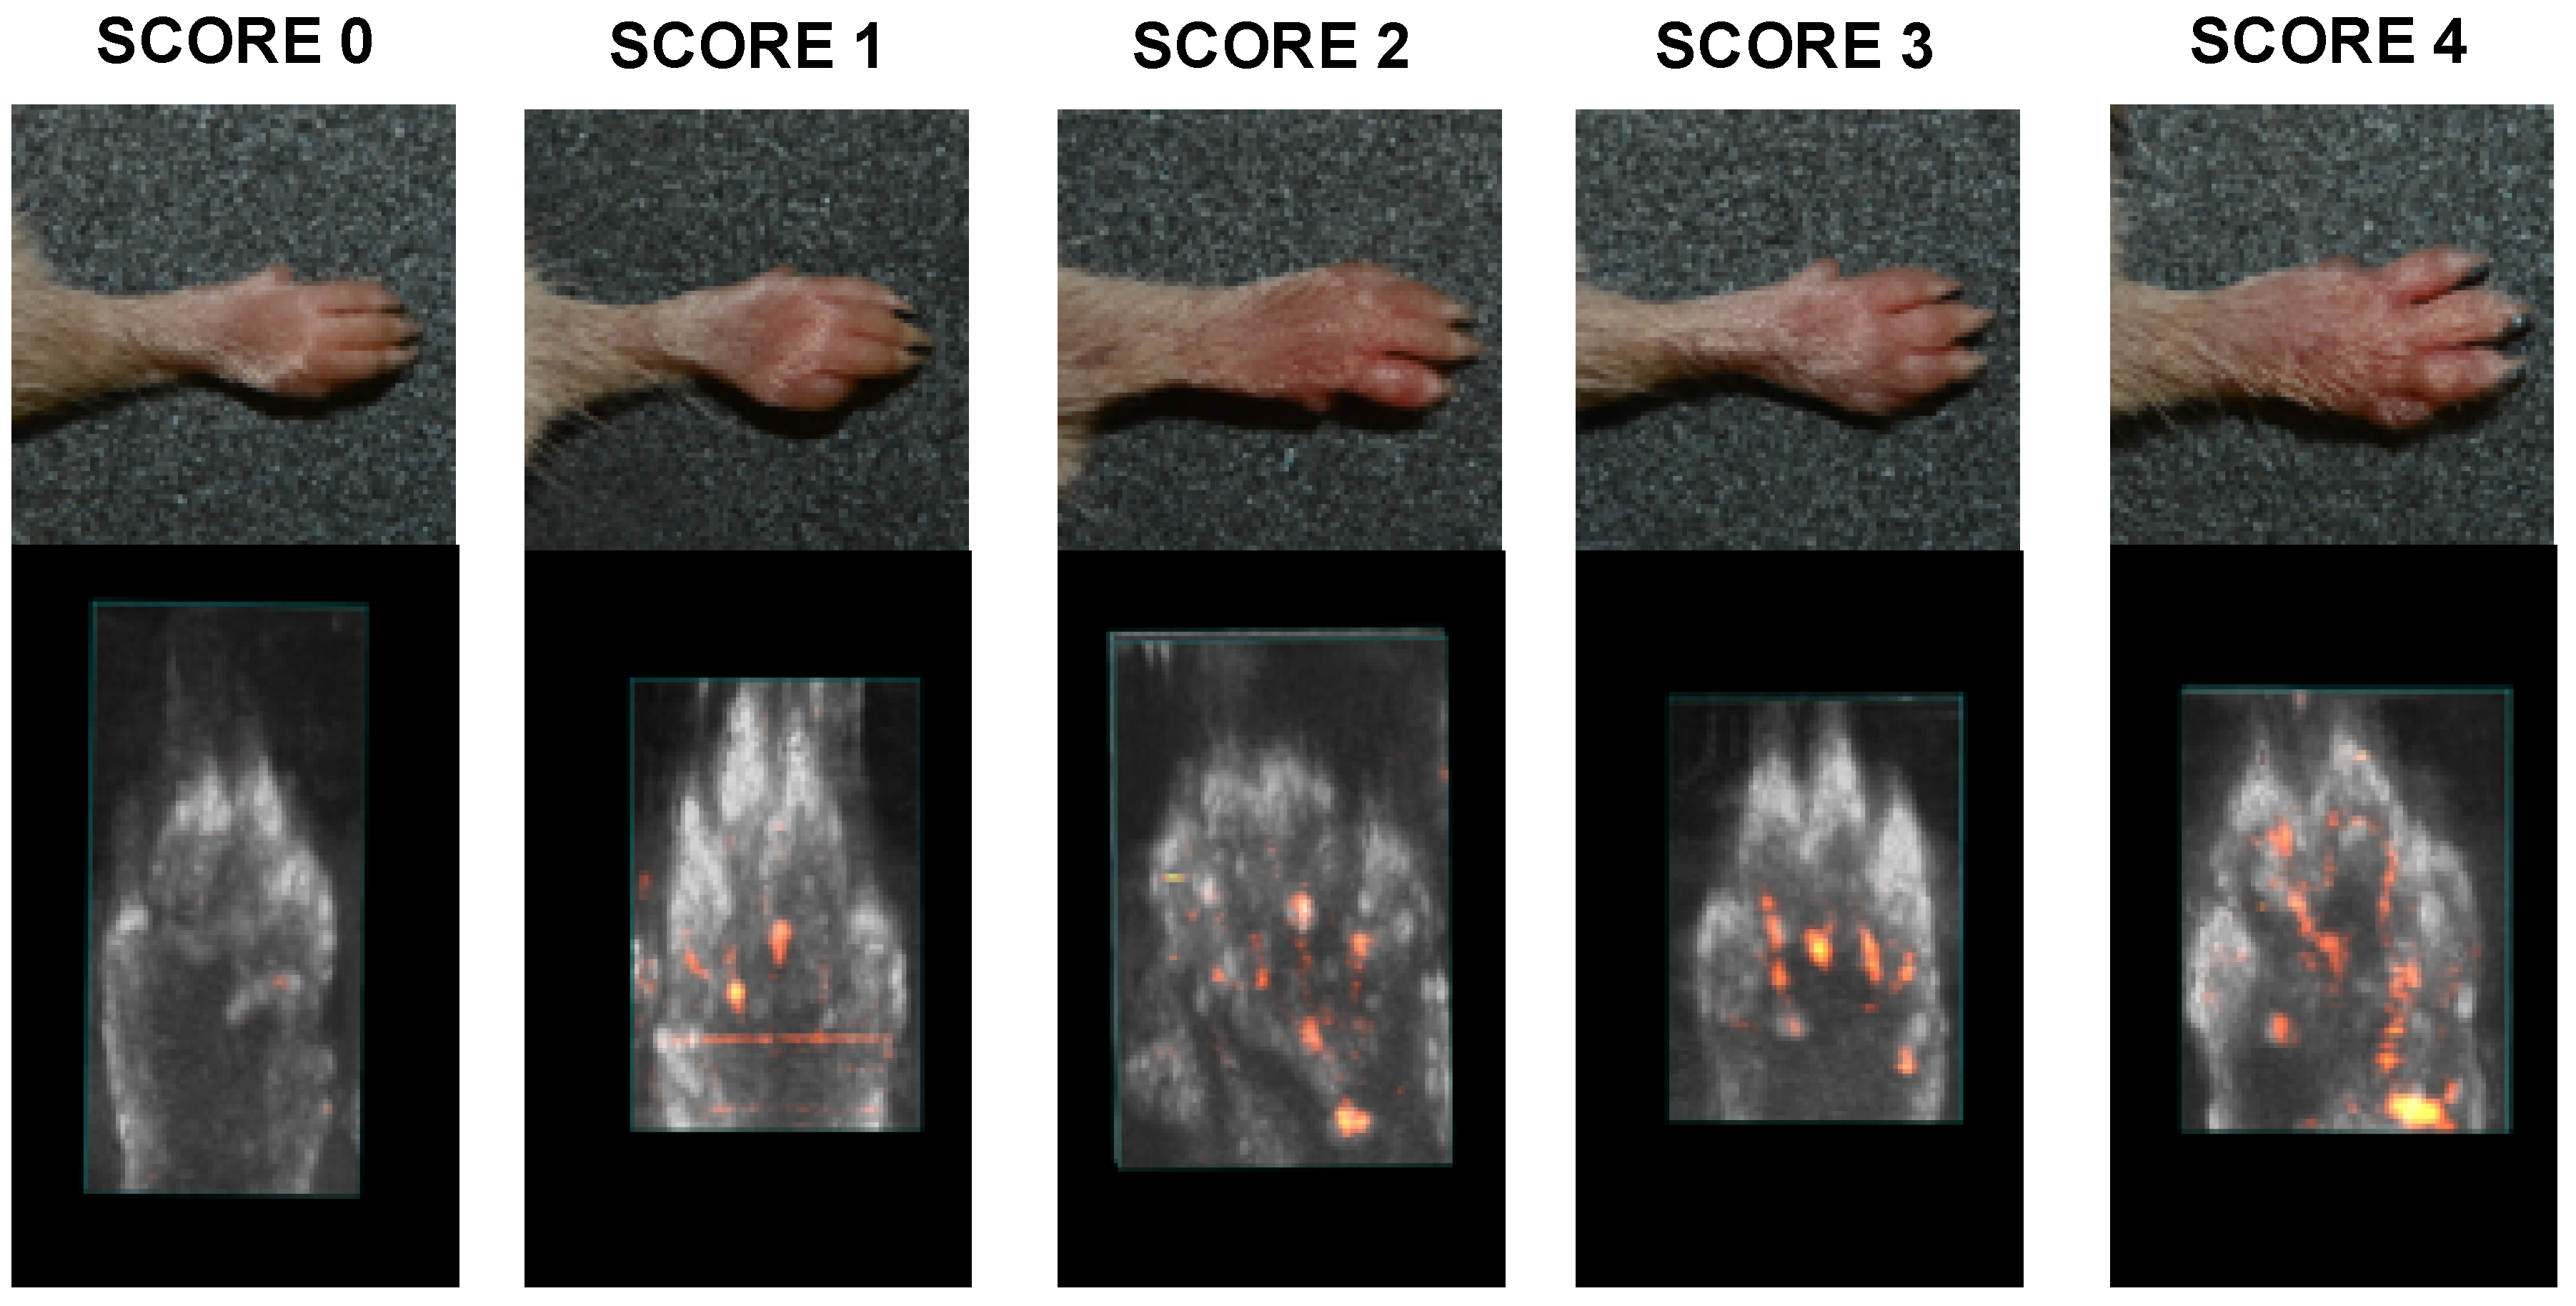
| Severity Score | Degree of Inflammation |
|---|---|
| 0 | No evidence of erythema and swelling |
| 1 | Erythema and mild swelling confined to the tarsals or ankle joint |
| 2 | Erythema and mild swelling extending from the ankle to the tarsals |
| 3 | Erythema and moderate swelling extending from the ankle to metatarsal joints |
| 4 | Erythema and severe swelling encompass the ankle, foot and digits, or ankylosis of the limb |
© 2020 by the authors. Licensee MDPI, Basel, Switzerland. This article is an open access article distributed under the terms and conditions of the Creative Commons Attribution (CC BY) license (http://creativecommons.org/licenses/by/4.0/).
Share and Cite
Parisi, V.; Vassallo, A.; Pisano, C.; Signorino, G.; Cardile, F.; Sorrentino, M.; Colelli, F.; Fucci, A.; D’Andrea, E.L.; De Tommasi, N.; et al. A Herbal Mixture from Propolis, Pomegranate, and Grape Pomace Endowed with Anti-Inflammatory Activity in an In Vivo Rheumatoid Arthritis Model. Molecules 2020, 25, 2255. https://doi.org/10.3390/molecules25092255
Parisi V, Vassallo A, Pisano C, Signorino G, Cardile F, Sorrentino M, Colelli F, Fucci A, D’Andrea EL, De Tommasi N, et al. A Herbal Mixture from Propolis, Pomegranate, and Grape Pomace Endowed with Anti-Inflammatory Activity in an In Vivo Rheumatoid Arthritis Model. Molecules. 2020; 25(9):2255. https://doi.org/10.3390/molecules25092255
Chicago/Turabian StyleParisi, Valentina, Antonio Vassallo, Claudio Pisano, Giacomo Signorino, Francesco Cardile, Milena Sorrentino, Fabiana Colelli, Alessandra Fucci, Egildo Luca D’Andrea, Nunziatina De Tommasi, and et al. 2020. "A Herbal Mixture from Propolis, Pomegranate, and Grape Pomace Endowed with Anti-Inflammatory Activity in an In Vivo Rheumatoid Arthritis Model" Molecules 25, no. 9: 2255. https://doi.org/10.3390/molecules25092255
APA StyleParisi, V., Vassallo, A., Pisano, C., Signorino, G., Cardile, F., Sorrentino, M., Colelli, F., Fucci, A., D’Andrea, E. L., De Tommasi, N., Braca, A., & De Leo, M. (2020). A Herbal Mixture from Propolis, Pomegranate, and Grape Pomace Endowed with Anti-Inflammatory Activity in an In Vivo Rheumatoid Arthritis Model. Molecules, 25(9), 2255. https://doi.org/10.3390/molecules25092255