Morphological Characteristics of Informal Settlements and Strategic Suggestions for Urban Sustainable Development in Tanzania: Dar es Salaam, Mwanza, and Kigoma


 , and
, and
Abstract
1. Introduction
2. Methodology
2.1. Tanzania’s Informal Settlements
2.2. Case Area Selection and Description
2.2.1. Chamazi
2.2.2. Buhongwa
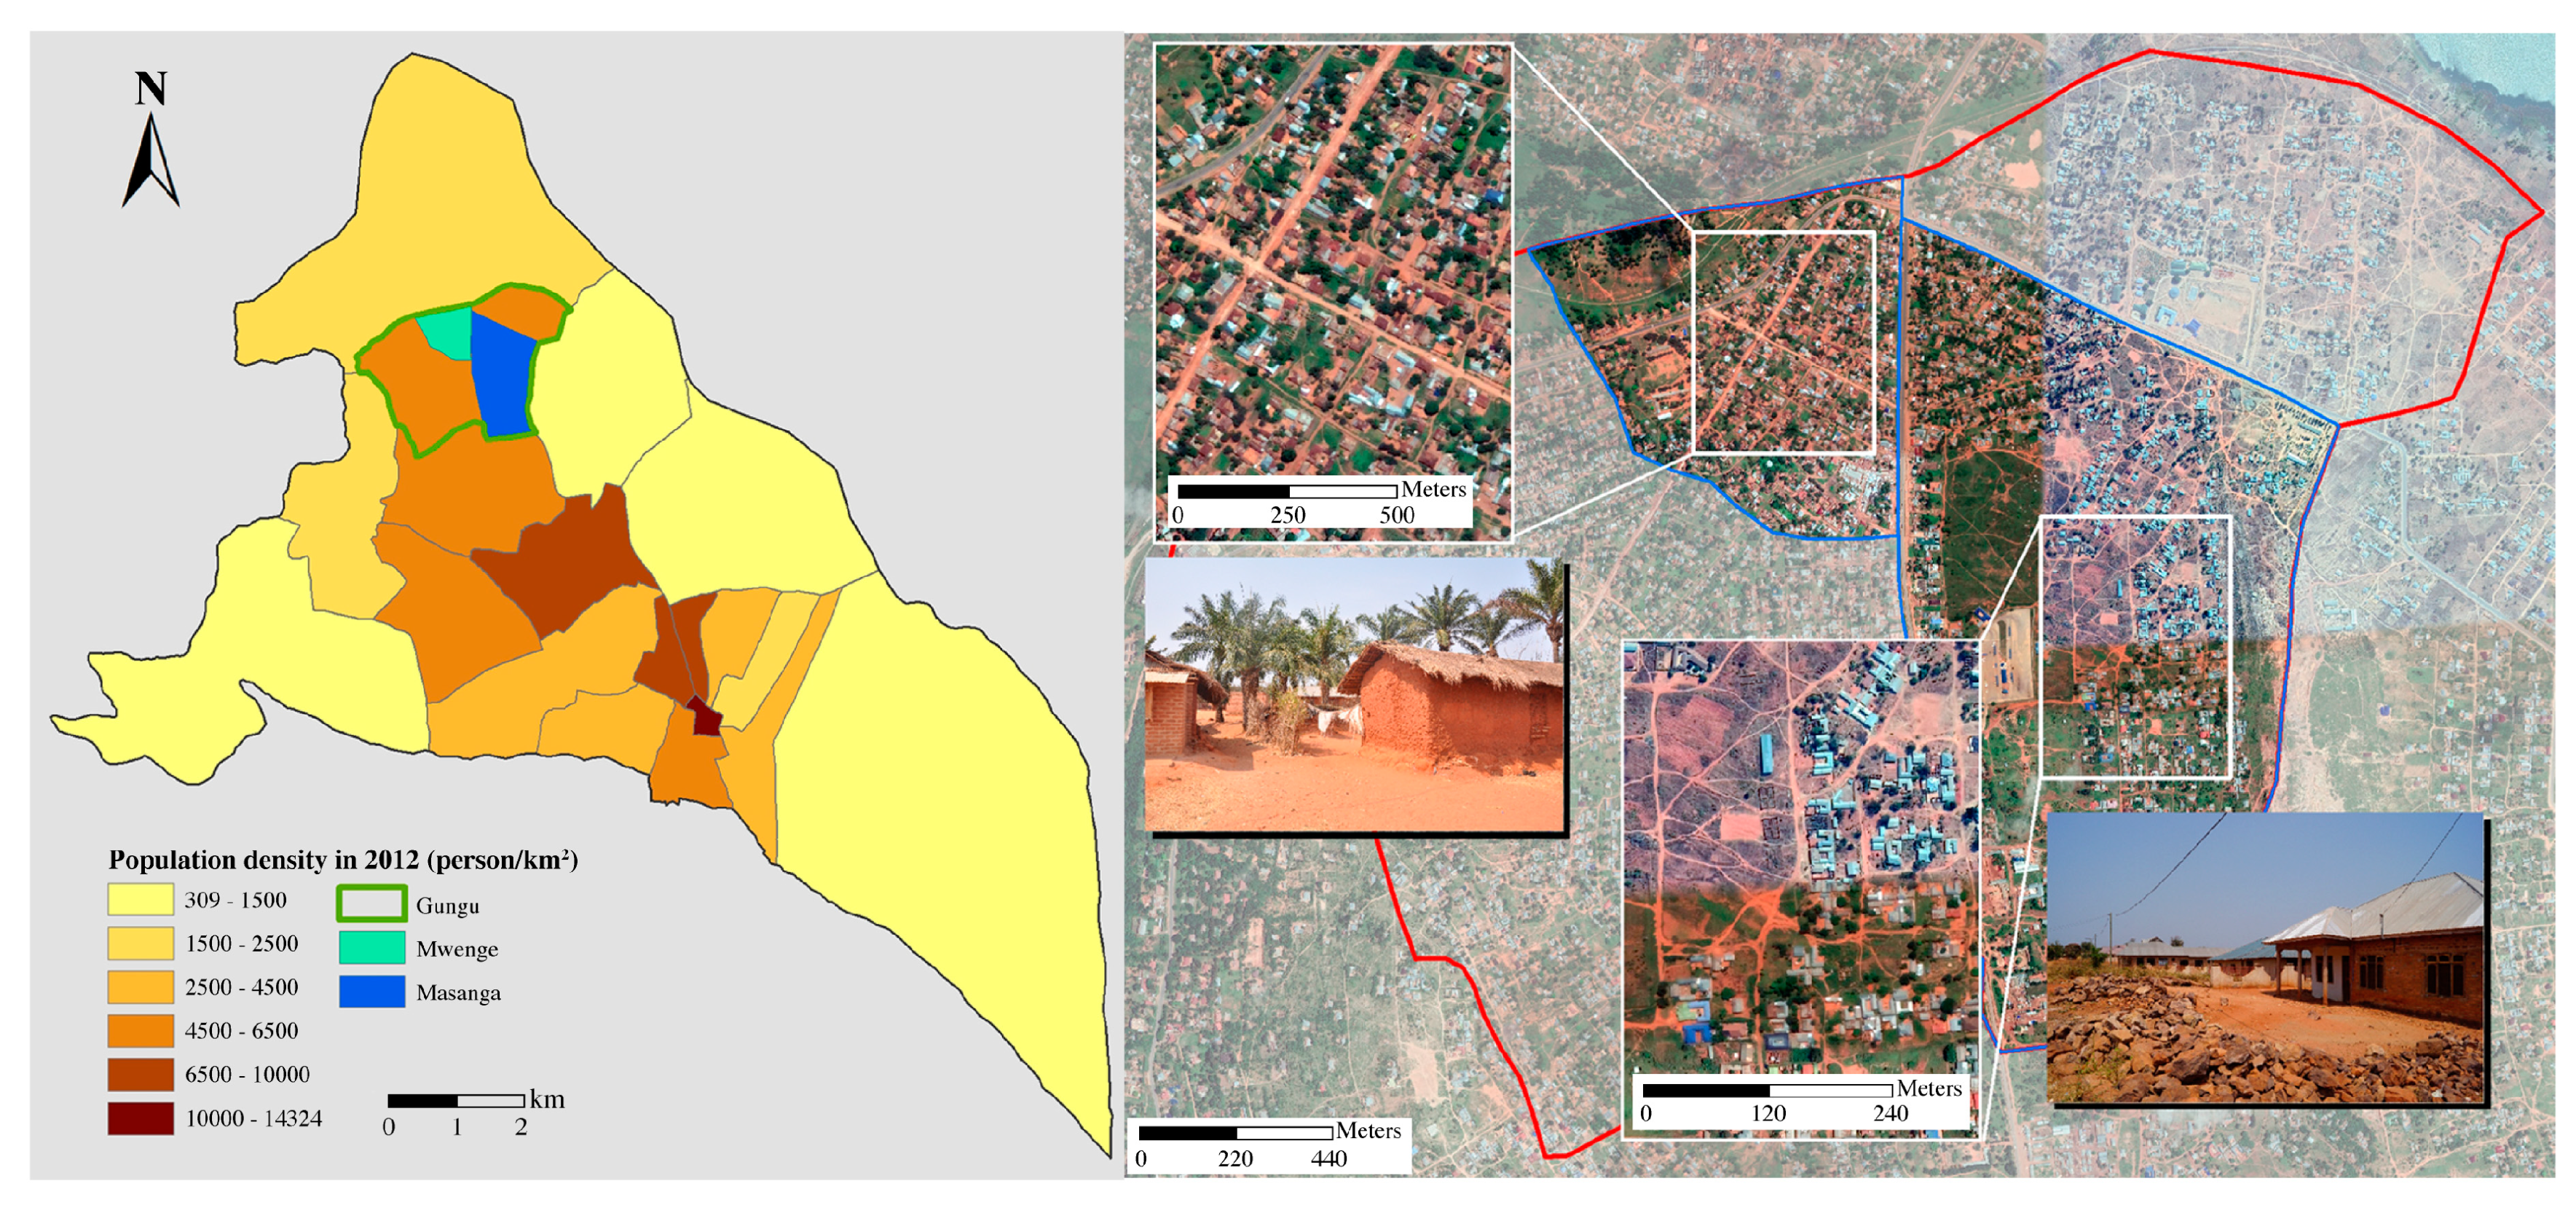
2.2.3. Gungu
2.3. Data Collection and Processing
2.3.1. Field Survey Data
2.3.2. GIS and Remote Sensing Data
2.4. Morphological Analysis
2.4.1. Building Form
2.4.2. Road Connectivity
3. Results
3.1. The Densification Process of Informal Settlements
3.1.1. Change in Building Area
3.1.2. Differences in Building Unit Density
3.1.3. Change in Vegetation Coverage
3.1.4. Changes in Building Landscape
3.2. Morphological Characteristics of Informal Settlements
3.2.1. Block Texture
3.2.2. Road Network Structure and Accessibility
3.2.3. Distribution Characteristics of Building Density
- (1)
- With the increase in the road network density, building density tended to increase (Figure 9). Convenient transportation can promote economic development within settlements since the main economic activities are conducted along the main roads. Buildings were also found to be concentrated around the roads. In informal settlements, buildings tend to be established first, with roads formed around them. The road network was complex and irregular with poor road conditions, which reduce residents’ quality of life and limit the economic development potential of the settlements.
- (2)
- The results showed that building density decreased with increases in slope (Figure 10). Many of the buildings in informal settlements were constructed ignoring slope conditions. The total area and average number of buildings with a slope of more than 15 degrees were largest in Chamazi, followed by Buhongwa and Gungu. Floods and landslides are significant environmental problems in these settlements. The demolition and reconstruction of residential areas have also caused difficulties.
- (3)
- With the increase in the ENN distance, building density tended to decrease (Figure 11). We found that the average distance between buildings was about 10 m, which gradually decreased over time. Many buildings are very close together and have a disordered orientation.
- (4)
- With an increase in the average building area, building density increased (Figure 12). The average building area was about 85 m2 in Dar es Salaam, and about 75 m2 in Mwanza and Kigoma. Most of the newly built houses have a large area, with more permanent building materials used. The newly built houses (mostly with courtyard walls) and old smaller houses (mostly semi-open) were both separated and intermixed. There was an obvious social gap between the residents of these two building types.
- (5)
- With increasing building density, building quality tended to worsen (Figure 13). In 2013, the building densities of Chamazi and Gungu were 6.712% and 23.237%, respectively; in 2016, the building density of Buhongwa was only 1.615%. New, good quality housing in Chamazi and Gungu was mostly distributed in newly developed areas with a lower building density, low population, and poor infrastructure conditions. Settlements mainly expanded horizontally, with building quality and density showing a negative correlation. In most areas of Buhongwa, building density remained low over time, with newly added houses interspersed with old houses. Building construction was mainly in the process of densification. Therefore, the relationship between building quality and building density was not obvious.
3.3. Functional Development of Informal Settlements
3.3.1. Number and Composition of Residents
3.3.2. Infrastructure Development
3.3.3. Living Environment and Health
4. Discussion
4.1. Building Density Control
4.2. Environmental Protection
4.3. Road Planning
4.4. Local Autonomy
5. Conclusions
Author Contributions
Funding
Acknowledgments
Conflicts of Interest
References
- Majale, M. Employment creation through participatory urban planning and slum upgrading: The case of Kitale, Kenya. Habitat Int. 2008, 32, 270–282. [Google Scholar] [CrossRef]
- UN-Habitat. Habitat III Issue Paper 22—Informal Settlements; UN Habita: New York, NY, USA, 31 May 2015. [Google Scholar]
- Okurut, K.; Kulabako, R.N.; Abbott, P.; Adogo, J.M.; Chenoweth, J.; Pedley, S.; Tsinda, A.; Charles, K.J. Access to improved sanitation facilities in low-income informal settlements of East African cities. J. Water Sanit. Hyg. Dev. 2014, 5, 89–99. [Google Scholar] [CrossRef]
- Matamanda, A.R. Battling the informal settlement challenge through sustainable city framework: Experiences and lessons from Harare, Zimbabwe. Dev. S. Afr. 2019, 37, 217–231. [Google Scholar] [CrossRef]
- Wekesa, B.; Steyn, G.; Otieno, F.F. A review of physical and socio-economic characteristics and intervention approaches of informal settlements. Habitat Int. 2011, 35, 238–245. [Google Scholar] [CrossRef]
- Dobson, S.; Nyamweru, H.; Dodman, D. Local and participatory approaches to building resilience in informal settlements in Uganda. Environ. Urban. 2015, 27, 605–620. [Google Scholar] [CrossRef]
- Ziervogel, G.; Waddell, J.; Smit, W.; Taylor, A. Flooding in Cape Town’s informal settlements: Barriers to collaborative urban risk governance. S. Afr. Geogr. J. 2014, 98, 1–20. [Google Scholar] [CrossRef]
- UN-Habitat. State of the World’s Cities 2012/2013: Prosperity of Cities; Routledge: Abingdon-on-Thames, UK, 2013. [Google Scholar] [CrossRef]
- UN-Habitat. The State of African Cities 2014: Re-Imagining Sustainable Urban. Transitions; United Nations Human Settlement Programme: Nairobi, Kenya, 2014. [Google Scholar] [CrossRef]
- Massey, R.T. Integral Theory: A Tool for Mapping and Understanding Conflicting Governmentalities in the Upgrading of Cape Town’s Informal Settlements. Urban Forum 2015, 26, 303–319. [Google Scholar] [CrossRef]
- Turok, I.; Borel-Saladin, J. Backyard shacks, informality and the urban housing crisis in South Africa: Stopgap or prototype solution? Hous. Stud. 2015, 31, 384–409. [Google Scholar] [CrossRef]
- Mwiga, B.G. Evaluating the Effectiveness of the Regulatory Framework in Providing Planned Land in Urban Areas: The Case of Dar Es Salaam City 20,000 Plots Project, Tanzania. Master’s Thesis, Faculty of Geo-Information Science and Earth Observation (ITC) of the University of Twente, Enschede, The Netherlands, March 2011. [Google Scholar]
- Gwaleba, M.J.; Chigbu, U.E. Participation in property formation: Insights from land-use planning in an informal urban settlement in Tanzania. Land Use Policy 2020, 92, 104482. [Google Scholar] [CrossRef]
- Huchzermeyer, M. Informal settlements at the intersection between urban planning and rights: Advances through judicialisation in the South African case. In Rethinking Precarious Neighborhoods; Agence Française de Développement (AFD): Paris, France, 2016; pp. 195–210. [Google Scholar]
- Dovey, K.; King, R. Forms of Informality: Morphology and Visibility of Informal Settlements. Built Environ. 2011, 37, 11–29. [Google Scholar] [CrossRef]
- Taubenböck, H.; Kraff, N.J. The physical face of slums: A structural comparison of slums in Mumbai, India, based on remotely sensed data. J. Hous. Environ. Res. 2013, 29, 15–38. [Google Scholar] [CrossRef]
- Fallatah, A.; Jones, S.; Mitchell, D.; Kohli, D. Mapping informal settlement indicators using object-oriented analysis in the Middle East. Int. J. Digit. Earth 2018, 12, 802–824. [Google Scholar] [CrossRef]
- Kohli, D.; Sliuzas, R.; Kerle, N.; Stein, A. An ontology of slums for image-based classification. Comput. Environ. Urban Syst. 2012, 36, 154–163. [Google Scholar] [CrossRef]
- Suditu, B.; Vâlceanu, D.G. Informal settlements and squatting in Romania: Socio-spatial features and typologies. Hum. Geogr. J. Stud. Res. Hum. Geogr. 2013, 7, 65–72. [Google Scholar] [CrossRef]
- Quirós, T.P.; Information, R.; Mehndiratta, S.R. Accessibility analysis of growth patterns in Buenos Aires, Argentina: Density, Employment, and Spatial Form. Transp. Res. Rec. 2015, 2512, 101–109. [Google Scholar] [CrossRef]
- Guzman, L.A.; Bocarejo, J.P. Urban form and spatial urban equity in Bogota, Colombia. Transp. Res. Procedia 2017, 25, 4491–4506. [Google Scholar] [CrossRef]
- Niebergall, S.; Mauser, W.; Loew, A. Integrative Assessment of Informal Settlements Using VHR Remote Sensing Data—The Delhi Case Study. IEEE J. Sel. Top. Appl. Earth Obs. Remote Sens. 2008, 1, 193–205. [Google Scholar] [CrossRef]
- Graesser, J.; Cheriyadat, A.; Vatsavai, R.R.; Chandola, V.; Long, J.; Bright, E. Image based characterization of formal and informal neighborhoods in an urban landscape. IEEE J. Sel. Top. Appl. Earth Obs. Remote Sens. 2012, 5, 1164–1176. [Google Scholar] [CrossRef]
- Mboga, N.; Persello, C.; Bergado, J.R.; Stein, A. Detection of Informal Settlements from VHR Satellite Images Using Convolutional Neural Networks. Remote Sens. 2017, 9, 1106. [Google Scholar] [CrossRef]
- Kuffer, M.; Barrosb, J. Urban Morphology of Unplanned Settlements: The Use of Spatial Metrics in VHR Remotely Sensed Images. Procedia Environ. Sci. 2011, 7, 152–157. [Google Scholar] [CrossRef]
- Kit, O.; Lüdeke, M.; Reckien, D. Texture-based identification of urban slums in Hyderabad, India using remote sensing data. Appl. Geogr. 2012, 32, 660–667. [Google Scholar] [CrossRef]
- Ahmed, B.; Hasan, R.; Maniruzzaman, K.M. Urban Morphological Change Analysis of Dhaka City, Bangladesh, Using Space Syntax. ISPRS Int. J. Geo-Inf. 2014, 3, 1412–1444. [Google Scholar] [CrossRef]
- Gevaert, C.M.; Persello, C.; Sliuzas, R.; Vosselman, G. Informal settlement classification using point-cloud and image-based features from UAV data. ISPRS J. Photogramm. Remote Sens. 2017, 125, 225–236. [Google Scholar] [CrossRef]
- Pánek, J.; Sobotova, L. Community Mapping in Urban Informal Settlements: Examples from Nairobi, Kenya. Electron. J. Inf. Syst. Dev. Ctries. 2015, 68, 1–13. [Google Scholar] [CrossRef]
- Kamalipour, H.; Peimani, N. Towards an Informal Turn in the Built Environment Education: Informality and Urban Design Pedagogy. Sustainability 2019, 11, 4163. [Google Scholar] [CrossRef]
- Swai, O.A. Architectural dynamics of street food-vending activities in Dar es Salaam city centre, Tanzania. Urban Des. Int. 2019, 24, 129–141. [Google Scholar] [CrossRef]
- Farinmade, A.; Soyinka, O.; Siu, K.W.M. Assessing the effect of urban informal economic activity on the quality of the built environment for sustainable urban development in Lagos, Nigeria. Sustain. Cities Soc. 2018, 41, 13–21. [Google Scholar] [CrossRef]
- Sliuzas, R.V.; Kuffer, M. Analysing the spatial heterogeneity of poverty using remote sensing: Typology of poverty areas using selected RS based indicators. In Proceedings of the Remote Sensing–New Challenges of High Resolution, Bochum, Germany, 5–7 March 2008. [Google Scholar]
- Owen, K.K.; Wong, D.W.S. An approach to differentiate informal settlements using spectral, texture, geomorphology and road accessibility metrics. Appl. Geogr. 2013, 38, 107–118. [Google Scholar] [CrossRef]
- Persello, C.; Stein, A. Deep Fully Convolutional Networks for the Detection of Informal Settlements in VHR Images. IEEE Geosci. Remote Sens. Lett. 2017, 14, 2325–2329. [Google Scholar] [CrossRef]
- Falco, E.; Zambrano-Verratti, J.; Kleinhans, R. Web-based participatory mapping in informal settlements: The slums of Caracas, Venezuela. Habitat Int. 2019, 94, 102038. [Google Scholar] [CrossRef]
- Soyinka, O.; Siu, K.W.M. Urban informality, housing insecurity, and social exclusion; concept and case study assessment for sustainable urban development. City Cult. Soc. 2018, 15, 23–36. [Google Scholar] [CrossRef]
- Kuffer, M.; Barros, J.; Sliuzas, R. The development of a morphological unplanned settlement index using very-high-resolution (VHR) imagery. Comput. Environ. Urban Syst. 2014, 48, 138–152. [Google Scholar] [CrossRef]
- Sirueri, F.O. Comparing Spatial Patterns of Informal Settlements between Nairobi and Dar es Salaam. Master’s Thesis, Faculty of Geo-Information Science and Earth Observation (ITC) of the University of Twente, Enschede, The Netherlands, February 2015. [Google Scholar]
- Kuffer, M.; Orina, F.; Sliuzas, R.; Taubenbock, H. Spatial patterns of slums: Comparing African and Asian cities. In Proceedings of the 2017 Joint Urban Remote Sensing Event (JURSE), Dubai, United Arab Emirates, 6–8 March 2017; pp. 1–4. [Google Scholar] [CrossRef]
- Kuffer, M.; Pfeffer, K.; Sliuzas, R. Slums from Space—15 Years of Slum Mapping Using Remote Sensing. Remote Sens. 2016, 8, 455. [Google Scholar] [CrossRef]
- Wolff, M.; Haase, A. Viewpoint: Dealing with trade-offs in comparative urban studies. Cities 2020, 96, 102417. [Google Scholar] [CrossRef]
- Kantor, P.; Savitch, H. How to Study Comparative Urban Development Politics: A Research Note. Int. J. Urban Reg. Res. 2005, 29, 135–151. [Google Scholar] [CrossRef]
- Kombe, W.J. Land use dynamics in peri-urban areas and their implications on the urban growth and form: The case of Dar es Salaam, Tanzania. Habitat Int. 2005, 29, 113–135. [Google Scholar] [CrossRef]
- Sliuzas, R. Managing Informal Settlements: A Study Using Geo-Information in Dar es Salaam, Tanzania. Ph.D. Thesis, Utrecht University, Utrecht, The Netherlands, 2004. [Google Scholar]
- Hill, A.; Lindner, C. Modelling Informal Urban Growth under Rapid Urbanisation: A CA-Based Land-Use Simulation Model for the City of Dar es Salaam, Tanzania. Master’s Thesis, Technische Universität Dortmund, Dortmund, Germany, 2010. [Google Scholar]
- Augustijn, E.-W.; Flacke, J.; Retsios, B. Simulating informal settlement growth in Dar es Salaam, Tanzania: An agent-based housing model. Comput. Environ. Urban Syst. 2011, 35, 93–103. [Google Scholar] [CrossRef]
- Collin, M.; Sandefur, J.; Zeitlin, A. Falling off the Map: The Impact of Formalizing (Some) Informal Settlements in Tanzania; Centre for the Study of African Economies Working Paper; University of Oxford: Oxford, UK, 2015. [Google Scholar]
- Sheuya, S.A.; Burra, M.M. Tenure Security, Land Titles and Access to Formal Finance in Upgraded Informal Settlements: The Case of Dar es Salaam, Tanzania. Curr. Urban Stud. 2016, 4, 440–460. [Google Scholar] [CrossRef]
- Nguluma, H. Housing themselves—Transformation, Modernisation and Spatial Qualities in Informal Settlements in Dar Es Salaam, Tanzania. Ph.D. Thesis, Department of Infrastructure, Royal Institute of Technology, Stockholm, Sweden, 2003. [Google Scholar]
- Hambati, H. Population increase and vulnerability to disasters in the informal settlements of Mwanza city, Tanzania. Tanzan. J. Popul. Stud. Dev. 2011, 18, 55–80. [Google Scholar]
- CNFER. Patch Analyst-ArcGIS Add-on Extensions for Spatial Statistical Analysis. Available online: http://cnfer.on.ca/SEP/patchanalyst/ (accessed on 21 March 2019).
- McGarigal, K. FRAGSTATS 4.2 Help; University of Massachusetts: Amherst, MA, USA, 2013. [Google Scholar]
- Patarasuk, R. Road network connectivity and land-cover dynamics in Lop Buri province, Thailand. J. Transp. Geogr. 2013, 28, 111–123. [Google Scholar] [CrossRef]
- UN-Habitat. Informal Settlements and Finance in Dar es Salaam, Tanzania; United Nations Human Settlements Programme: Nairobi, Kenya, 2010. [Google Scholar]
- Abebe, F.K. Modelling Informal Settlement Growth in Dar es Salaam, Tanzania. Master’s Thesis, Faculty of Geo-Information Science and Earth Observation (ITC) of the University of Twente, Enschede, The Netherlands, March 2011. [Google Scholar]
- Kironde, J.L. The regulatory framework, unplanned development and urban poverty: Findings from Dar es Salaam, Tanzania. Land Use Policy 2006, 23, 460–472. [Google Scholar] [CrossRef]
- Lupala, J.M. Urban Governance in the Changing Economic and Political Landscapes: A Comparative Analysis of Major Urban Centres of Tanzania. Curr. Urban Stud. 2015, 3, 147–160. [Google Scholar] [CrossRef]
- Kyessi, A.G.; Sekiete, T. Formalising Property Rights in Informal Settlements and Its Implications on Poverty Reduction: The Case of Dar es Salaam, Tanzania. J. Bus. Econ. 2014, 5, 2352–2370. [Google Scholar] [CrossRef]
- Tanzania NBS. 2012 Population and Housing Census: Population Distribution by Administrative Areas; National Bureau of Statistics: Dar es Salaam, Tanzania, 2013.
- Parsa, A.; Nakendo, F.; McCluskey, W.J.; Page, M.W. Impact of formalisation of property rights in informal settlements: Evidence from Dar es Salaam city. Land Use Policy 2011, 28, 695–705. [Google Scholar] [CrossRef]
- Schmidt, S.; Zakayo, E. Land formalization and local leadership in Moshi, Tanzania. Habitat Int. 2018, 74, 18–26. [Google Scholar] [CrossRef]
- Rhinane, H.; Hilali, A.; Berrada, A.; Hakdaoui, M. Detecting Slums from SPOT Data in Casablanca Morocco Using an Object Based Approach. J. Geogr. Inf. Syst. 2011, 3, 217–224. [Google Scholar] [CrossRef]
- Tandari, C. The Tanzania Development Vision 2025; Department of Poverty Eradication, Vice President’s Office: Dar es Salaam, Tanzania, 2001.
- United Republic of Tanzania. MKUKUTA II: National Strategy for Growth and Reduction of Poverty; Ministry of Finance and Economic Affairs: Dar-es-Salaam, Tanzania, 2010. [Google Scholar]
- African Development Bank Group. Tanzania Transport Sector Review; Transport & ICT Department: Abidjan, Côte d’Ivoire, 2013. [Google Scholar]
- Locke, A.; Henley, G. Urbanisation, Land and Property Rights; ODI Report; Overseas Development Institute: London, UK, 2016. [Google Scholar]
- UN-Habitat. The Challenge of Slums: Global Report on Human Settlements; Earthscan: London, UK, 2003. [Google Scholar] [CrossRef]
- Klopp, J.M.; Petretta, D.L. The urban sustainable development goal: Indicators, complexity and the politics of measuring cities. Cities 2017, 63, 92–97. [Google Scholar] [CrossRef]
- Jenks, M. Compact City. In The Wiley Blackwell Encyclopedia of Urban and Regional Studies; Wiley: Hoboken, NJ, USA, 2019; pp. 1–4. [Google Scholar]
- Maretto, M. Sustainable urbanism: The role of urban morphology. Urban Morphol. 2014, 18, 163–174. [Google Scholar]
- Barau, A.S.; Maconachie, R.; Ludin, A.; Abdulhamid, A. Urban morphology dynamics and environmental change in Kano, Nigeria. Land Use Policy 2015, 42, 307–317. [Google Scholar] [CrossRef]


| Evaluating Indicator | Observation | Score |
|---|---|---|
| Courtyard | 30% and below have a courtyard | 1 |
| 30–70% have a courtyard | 3 | |
| 70% and above have a courtyard | 5 | |
| Roofing materials | 30% and below are concrete, ceramic tile, or high quality iron sheet | 1 |
| 30–70% are concrete, ceramic tile, or high quality iron sheet | 3 | |
| 70% and above are concrete, ceramic tile, or high quality iron sheet | 5 | |
| Wall materials | 30% and below are permanent materials such as bricks or cement | 1 |
| 30–70% are permanent materials such as bricks or cement | 3 | |
| 70% and above are permanent materials such as bricks or cement | 5 | |
| Degree of mixed land use | Mainly used for living | 1 |
| Mix of residence and agriculture | 3 | |
| Mix of residence, industry, and commerce | 5 |
| Parameter | Chamazi | Buhongwa | Gungu | ||||||
|---|---|---|---|---|---|---|---|---|---|
| 2005 | 2010 | 2013 | 2004 | 2010 | 2016 | 2003 | 2010 | 2013 | |
| Smallest building area (m2) | 8 | 7 | 4 | 8 | 7 | 6 | 8 | 6 | 5 |
| Average building area (m2) | 87 | 86 | 85 | 53 | 63 | 76 | 74 | 75 | 75 |
| Largest building area (m2) | 840 | 2151 | 2151 | 380 | 460 | 1630 | 1474 | 1474 | 1474 |
| Total building area (m2) | 116,324 | 468,453 | 1,008,774 | 51,859 | 142,183 | 522,199 | 177,597 | 315,130 | 1,008,774 |
| Standard deviation | 63.067 | 75.726 | 68.649 | 43.513 | 50.000 | 69.032 | 66.768 | 67.676 | 67.203 |
| Number of buildings (unit) | 1334 | 5429 | 11844 | 977 | 2246 | 6871 | 2382 | 4225 | 4920 |
| Building unit density (unit/ha) | 0.9 | 3.6 | 7.9 | 0.3 | 0.7 | 2.1 | 5.0 | 8.9 | 10.4 |
| Building coverage (%) | 0.774 | 3.117 | 6.712 | 0.16 | 0.44 | 1.615 | 3.739 | 6.634 | 21.237 |
| Chamazi | Buhongwa | Gungu | |||||||
|---|---|---|---|---|---|---|---|---|---|
| 2005 | 2010 | 2013 | 2004 | 2010 | 2016 | 2003 | 2010 | 2013 | |
| Vegetation area (km2) | 6.492 | 4.538 | 2.482 | 8.366 | 7.664 | 6.259 | 1.557 | 1.264 | 1.195 |
| Vegetation coverage (%) | 43.2 | 30.2 | 16.5 | 25.9 | 23.7 | 19.4 | 32.8 | 26.6 | 25.2 |
| Index | Chamazi | Buhongwa | Gungu | ||||||
|---|---|---|---|---|---|---|---|---|---|
| 2005 | 2010 | 2013 | 2004 | 2010 | 2016 | 2003 | 2010 | 2013 | |
| SEI | 0.9731 | 0.9724 | 0.9760 | 0.9646 | 0.9671 | 0.9673 | 0.9699 | 0.9703 | 0.9704 |
| MSI | 1.192 | 1.197 | 1.193 | 1.206 | 1.218 | 1.218 | 1.228 | 1.231 | 1.230 |
| SD of MSI | 0.0924 | 0.0898 | 0.0828 | 0.0810 | 0.1020 | 0.1021 | 0.1165 | 0.1152 | 0.1138 |
| SDI | 6.9951 | 8.3619 | 9.1538 | 6.6349 | 7.4603 | 8.5458 | 7.5388 | 8.1009 | 8.2484 |
| ENN(m) | 15.81 | 10.96 | 9.82 | 10.59 | 10.71 | 11.17 | 11.29 | 10.31 | 10.28 |
| Ward | L | N | α | β | γ | Overall Road Network Density (km/km2) | Main Road Network Density (km/km2) |
|---|---|---|---|---|---|---|---|
| Chamazi | 578 | 346 | 0.3392 | 1.6705 | 0.5601 | 6.5863 | 0.6811 |
| Buhongwa | 527 | 319 | 0.3302 | 1.6520 | 0.5542 | 3.1533 | 0.1765 |
| Gungu | 336 | 184 | 0.4215 | 1.8261 | 0.6154 | 8.6643 | 1.0499 |
© 2020 by the authors. Licensee MDPI, Basel, Switzerland. This article is an open access article distributed under the terms and conditions of the Creative Commons Attribution (CC BY) license (http://creativecommons.org/licenses/by/4.0/).
Share and Cite
Zhang, J.; Shuang Chen, S.; Gao, Q.; Shen, Q.; Kimirei, I.A.; Mapunda, D.W. Morphological Characteristics of Informal Settlements and Strategic Suggestions for Urban Sustainable Development in Tanzania: Dar es Salaam, Mwanza, and Kigoma. Sustainability 2020, 12, 3807. https://doi.org/10.3390/su12093807
Zhang J, Shuang Chen S, Gao Q, Shen Q, Kimirei IA, Mapunda DW. Morphological Characteristics of Informal Settlements and Strategic Suggestions for Urban Sustainable Development in Tanzania: Dar es Salaam, Mwanza, and Kigoma. Sustainability. 2020; 12(9):3807. https://doi.org/10.3390/su12093807
Chicago/Turabian StyleZhang, Jiaqi, Sophia Shuang Chen, Qun Gao, Qiushi Shen, Ismael Aaron Kimirei, and Damas William Mapunda. 2020. "Morphological Characteristics of Informal Settlements and Strategic Suggestions for Urban Sustainable Development in Tanzania: Dar es Salaam, Mwanza, and Kigoma" Sustainability 12, no. 9: 3807. https://doi.org/10.3390/su12093807
APA StyleZhang, J., Shuang Chen, S., Gao, Q., Shen, Q., Kimirei, I. A., & Mapunda, D. W. (2020). Morphological Characteristics of Informal Settlements and Strategic Suggestions for Urban Sustainable Development in Tanzania: Dar es Salaam, Mwanza, and Kigoma. Sustainability, 12(9), 3807. https://doi.org/10.3390/su12093807