Abstract
The efficacy, safety, and cost of medication are the major concerns for a patient; thus, this research addresses factors that influence the physician’s prescription behavior. The objective of the undertaken study is the empirical testing of a novel conceptual model that was newly developed by the previous literature, which is based on behavioral and social theories. The considered model explains the association between marketing efforts, pharmacist factors, patient characteristics, and the physician’s decision to prescribe a drug. This unique model also includes the influence of cost and benefit ratio, drug characteristics, physician’s persistence, and trustworthiness as moderating variables. This model is useful for analyzing the prospects of marketing. We have collected 984 physicians’ responses from the urban centers of Pakistan through a structured questionnaire. We have used Structural equation modelling (SEM) based multivariate techniques such as exploratory and confirmatory factor analysis, and conditional process modelling to explore the direct and indirect relationship amongst the exogenous, moderating, and endogenous variables. The findings of the study demonstrated that marketing efforts, patient’s characteristics, and pharmacist factors have a positive and significant influence on the physician’s decision to prescribe medicines. The moderation analysis exhibited the significant effect of drug characteristics, cost–benefit ratio, physician’s persistence, and trustworthiness in a relationship between exogenous and endogenous variables. The results of the undertaken study are helpful for the marketers of the pharmaceutical industry to save wasteful marketing expenditures for the product portfolios, and measured variables may help to make meaningful marketing strategies for the physician’s prescription that provide optimum Returns on Investment (ROI) of their investments.
1. Introduction
Pharmaceutical marketing has the same objectives as other industries to enhance the profitability and market share of the organization by fulfilling the needs and demands of the customers taking into account the preferable consideration of products. Other than the pharmaceutical industry, it is very easy to disseminate the marketing message to the end-users through above the line (ATL) and below the line (BTL) media communication strategies. However, in the pharmaceutical industry, the consumers are not the customer of the pharmaceutical industry; rather, the doctor community is the prime customer for the pharmaceutical companies [1,2]. Since the pharmaceutical industry is highly regulated, companies cannot advertise their drugs through electronic and print media channels. Pharmaceutical marketing is quite different as compared to the other industries where the consumer (patient) is not the direct customer of the pharmaceutical industry, however a doctor is the customer of the pharmaceutical industry and the patient is a customer of a doctor. Therefore, pharmaceutical companies target the physicians, and physicians decide to prescribe a certain medicine; thus, in pharmaceutical marketing, strategies are devised for the doctors, not for the patient. According to Campbell et al. [3], Moynihan [4], and Ahmed et al. [5], the relationship between pharmaceutical companies and doctors has gained considerable attention that originates from a conflict between the doctor’s financial self-interest and the ethical professional interest. The pharmaceutical companies market their drugs through diverse marketing and promotional activities such as free sampling to the doctors, expensive and inexpensive gifts to the doctors, sponsored lecture/symposia for individual doctors and hospitals, sponsoring physicians in national and international conferences, medical detailing, and sponsorship of continuing medical educations (CMEs) for individual doctors. Thus, these marketing activities exert a significant impact on the prescription behavior of physicians, and doctors prescribe their medicine without a due cost and benefit analysis (side effects vs. cure effects) [6,7]. However, few studies demonstrated that the marketing activities of the pharmaceutical industry do not influence the majority of doctors; instead, doctors prescribe medicines on the merit of the drug [7,8,9]. However, a substantial amount of literature has confirmed the influential effect of pharmaceutical marketing activities, which has a positive and significant on physician’s prescription behavior [9,10]. Besides the increasing trend of pharmaceutical marketing expenditure, another important concern is the inappropriate, expensive, irrational, and harmful drugs’ prescription. According to Hogerzeil [10] and Carthy et al. [11], this matter is two exhibitions; on the one hand, unnecessary and ineligible medicine are being prescribed to the patient, and on other hand, there are ample shreds of evidence of the prescribed drug being useless or misuse of medicines. The outcome of this misuse of drugs may result in the loss of health, loss of quality of life of the patient, and enhances the medical and healthcare expenditure, thus it is important to follow the prescription guidelines for prescription medicines [5,12].
Thus, in this context, there is a strong need to evaluate factors that alter or change the physician’s prescription decisions. Numerous medical pieces of literature concern the influential factor of physician’s prescription decisions, which demonstrates that few factors are fixed and cannot be changed or modified; however, several factors have a significant role to influence the physician’s prescription decisions [13,14]. Most of the literature considers the empirical analysis only. To date, literature regarding the physician’s decision-making process lacks the sound theoretical foundations [15], as most studies have been based on an exploratory approach, and did not address the theoretical approach for the decision-making process of physicians regarding the selection and prescription of a drug [7,16,17]. However, few research studies have incorporated different theoretical model to understand decision-making processes such as attitude–behavior models including the planned behavior theory (TPB) and the reasoned action theory [18,19,20,21,22,23,24]. The main intention is to understand the rationale in the decision making of an individual through these theories; thus, the cognitive method can elucidate the individuals’ behavior. According to Raisch [22], the cognitive models may address the physician’s decision-making process, however Godin et al. [19] and Lee and Yun [25] have demonstrated that the theory of planned behavior (TPB) has several drawbacks, and the TPB does not take into account the emotional approach of an individual. In the same vein, Conner et al. [26] have recommended including the emotional variables to modify the behavioral theories. The impact of social media on emotions was studied in terms of technology acceptance [27].
According to Theodorou et al. [15] and Prosser et al. [28], the decision of the physician’s prescription is a multifaceted procedure, which encompasses several variables. Raisch [22] and Schommer and Hansen [29] have demonstrated that physicians take into account several factors while deciding to prescribe a drug and numerous sorts of precarious heuristics in performing their responsibilities of patient treatment. According to Reyna and Rivers [30], there are several factors that have been narrated regarding the physician’s decision-making process in previous literature, but according to the literature, any single theory cannot explain the factors about the physician’s prescription behavior. Thus, the multifaceted model of theories is employed to comprehend the influencing variables for the decision-making process of physicians [19]. The current studies demonstrated a lack of agreement amongst the researchers regarding the use of theories to examine the physician’s prescription behavior and its determinants for the decision-making process [31,32,33]. According to the existing literature, the important factors include patient characteristics (expectations and requests), and marketing efforts of pharmaceutical companies. The pharmacist factor (pharmacist expert power and pharmacist–physician collaboration) has also been recognized as a cogent element for physician’s decision-making process for the responsible prescription behavior [34,35,36,37]. However, there is a need to understand these factors and approaches in a conclusive conceptual framework for the decision-making process of the physician’s decision to prescribe a drug [19,38].
The development of the theoretical model is important to address the comprehensiveness of the decision-making process of physicians, regarding any prescription pattern across the globe [20,39,40]. For the development of a theoretical model, some research studies have been carried out such as those by Howie [14], Raisch [22], Hemminki [23], and Knapp and Oeltjen [41], but most of them are outdated. Therefore, there is a need to address more theoretical research studies to comprehend the physician’s decision-making process. Thus, Murshid and Mohaidin [42] have carried out important research to develop a conceptual framework to understand the physician’s decision-making process regarding responsible prescription behavior towards medicines. However, there is no empirical evidence for the effectiveness of that theoretical framework. Thus, the undertaken study is an attempt to confirm the complex conceptual framework, which was developed by the Murshid and Mohaidin [42]. The previous literature assessed the behavioral and social theories such as a theory of planned behavior (TPB), agency theory, the theory of social power, theory of stimulus–response behavior, and persuasion theory to ascertain the influence of marketing efforts, pharmacist factors, and patient characteristics on the physician’s prescription behavior. Hence, these social and behavioral theories and models were studied to comprehend the significant factors, which determine and develop the innovative conceptual paradigm to influence the physician’s prescription behavior [22,42].
This research is a shred of conclusive evidence for practical implications of that complex theoretical framework. Hence, this research fills the gap to employ an integrated theoretical model and to examine the practicality of this multi-dimensional theoretical model to assess the factors that contribute to reshaping the physician’s decision-making process regarding prescription behavior. This model used the theory of planned behavior (TPB) and agency theories that elucidate the twofold function of the doctor as an intermediary and customer. The TPB model is very much linked to the physician as an intermediary in a clinical environment [19,43]. The stimulus–response theory and persuasion theory have been demonstrated the role of pharmaceutical marketing efforts in reshaping the behavior of the physician to prescribe the drug [42]. However, in this model, the social power theory is used in the context of the influential effects of pharmacist factors [42].
The rest of the paper is comprised of several sections, such as: (1) Section 2 deals with previous literature and conceptual framework; (2) Section 3 contains the material and methods: (3) Section 4 demonstrates the results and findings; (4) Section 5 is comprised of the discussion; and (5) Section 6 contains the conclusions, followed by the practical implications, limitations, and future areas of research studies.
2. Previous Literature and Conceptual Framework
According to previous literature, multiple factors influence the physician’s prescription behavior towards the drugs. Murshid and Mohaidin [42] and Hartzema et al. [44] have demonstrated that non-medical factors are significant predictors to influence the physician’s prescription behavior. However, Armstrong et al. [45] have revealed that senior doctors’ prescription patterns can influence the behavior of general practitioners’ prescription habits. According to Kareem et al. [46], tangible rewards used by the pharmaceutical companies as promotion tactics and frequent visits to medical representatives significantly increase the prescription loyalty of physicians. Though Rahmner et al. [47] have identified new dimensions for influencing physician’s prescription behavior such as the physician–patient relationship, Taneja [48] has exhibited that private doctors are more attracted towards the personalized activities and promotional tools, whereas the hospital’s associated physicians are attracted towards the scientific activities. According to Tan et al. [49], family physicians give more weight to the promotional activities than the detailing and CMEs programs; however, Theodorou et al. [15] have demonstrated that clinical effectiveness of the drugs is the major criteria for the physician’s prescription behavior. According to Kotwani et al. [36], sales calls of Medical Representatives (MRs) exert a cogent influence on the physician’s prescription behavior; however, Karayanni [50] has concluded that the personal obligation is a major factor to influence physician’s prescription behavior. Several research studies have investigated that trust and quality of the drug, effective marketing communication, MRs effectiveness, cost of the drug, and corporate image of pharmaceutical companies are the significant factors to influence the physician’s prescription behavior [5,47,51,52]. According to Wazana [53], Prosser and Walley [54], and Caudil et al. [55], the interaction between doctors and pharmaceutical companies starts at the beginning of their careers, thus customer relationship employs a significant part in reshaping the responsible prescription behavior of physicians. However, Lieb and Brandtönies [56], Chimonas et al. [57], Saito et al. [58], and Watkins et al. [59] examine the pharmaceutical sales representatives’ (PSRs) association with the doctors, and effectiveness of PSRs, and concluded the major factors to influence the physician’s prescription behavior. Numerous studies have examined the impact of marketing tools and established a positive correlation with the prescription behavior of physicians [9,60,61].
2.1. Theories Relevant to Factors Influencing the Prescribing Decision
Besides the marketing and medical tools, previous literature also studied the link of these factors with different theories and models to influence the physician’s prescription behavior towards medicines, thus the literature has provided the theoretical and conceptual foundation to the elements that influence the responsible prescription behavior. Therefore, the previous literature assessed the behavioral and social theories such as a theory of planned behavior (TPB), agency theory, the theory of social power, theory of stimulus–response behavior, and persuasion theory to ascertain the influence of marketing efforts, pharmacist factors, and patient characteristics on the physician’s prescription behavior. Hence, these social and behavioral theories and models were studied to comprehend the significant factors, which determine and develop the innovative conceptual paradigm to influence the physician’s prescription behavior [22,42,62].
2.1.1. Agency Theory
Jansen and Meckling [63] have introduced the concept of agency theory, and Shapiro [62] has introduced the different objectives of this theory. However, Eisenhardt [64] has reviewed the context, concept, and different principles of agency theory, and he established that this theory offers a framework for examining the relationship between impartial to analyze the problem, which exists between two parties and instrument to resolve it. According to Eisenhardt [64] and Mott et al. [65], in agency theory, the association happens when the patient (first party) believes physician (second party) to accomplish certain activities on behalf of the client (the pharmaceutical company). Thus, based on this approach, the pharmaceutical company is motivated to sell its drugs by using different marketing and branding efforts and provide necessary prescribing information to the physician to prescribe the drugs. During the pharmaceutical and physician relationship, various environmental elements may have little control over the cost and benefit (side effects vs. cure effects) ratio of a drug, and persistence of physicians [43]. Though in the physician and patient’s relationship, the patient entirely relies on the expert power of physician for diagnosis and prescription [29]. However, Epstein and Ketcham [66] exhibited that the patient is interested in cost-effective and appropriate treatment in terms of a physician’s prescription. According to Groves [43], the physician’s decision to prescribe a certain drug is based on several influencing factors that the patient has little control over such as physician’s persistence, drug characteristics, and cost/benefit (side effects vs. cure effects) of the medicine. The physician–patient relationship is further strengthened when the doctor fulfils the patients’ requests and expectations for a certain drug [37,66].
2.1.2. Theory of Persuasion
Persuasion is a successful attempt to influence the decision-making process of an individual; persuasion is an art of changing the principles, philosophies, and behavior through effective communication [29,67]. Persuasion is comprised of cognition and emotional responses, and the interaction of emotion and cognition can change the physician’s behavior regarding a certain drug prescriptions. The process of persuasion consists of four elements, for instance, (1) sender information (medical representatives of pharmaceutical firm), (2) the physician (a receiver), (3) the interchange between receiver and sender (medical Representative and physician), and (4) the alteration in behavior (the physician’s prescription behavior). According to Bettinghaus [68], the persuasion instructs an individuals’ behavior (doctors’ prescription behavior) voluntarily in reaction to a specific stimulus, which alters the mind. According to Storey [69], the change of mind is associated with the particular desires of an individual (physician), for instance, prescriptions required for his/her patient, such changes might be accomplished immediately (prescription decision) or sometimes it requires several months or years. The previous literature demonstrated that the persuasion theory is used to enhance the physician’s prescribing behavior through effective pharmaceutical marketing and activities [22,29]. According to O’keefe [67] and Petty and Cacioppo [70], the elaboration likelihood model (ELM), which is widely employed in the model in persuasion theory’s perspective, suggests that the individual (the physician) uses both emotional and cognitive abilities and reactions to deduce data for decision-making. The influencing factors for physician’s prescription behavior include a personal relationship with the pharmacist and medical representatives, environmental stimuli (patient and pharmacist), marketing stimuli (brand name of a drug such as famous brands of multinational companies, for example Amoxil, Lipitor, Zocor, Augmentin, etc., in comparisons of local companies brands), sales promotion, drug information such as prescribing information of medicine such as dosage, indications, side effects, etc., drug characteristics, and physician’s characteristics (habit persistence) towards the medicines.
2.1.3. The Buyer Behaviour—Stimulus–Response (SR) Theory
Both buying behavior models such as the stimulus–response (SR) model and elaboration likelihood model (ELM) are similar because both consider emotions and cognizance to influence the individual. Xing and Othman [71] conclude that the SR model is linked to the black box model in which emphasis is not on the process, instead it deals with the relationship between the stimuli and the consequential reaction. However, original communication inferred from this model is the procedure of physician’s awareness from the outward stimuli for the prescription decision towards medicines. Similar to a consumer, the physician is faced with numerous influences that may reshape his/her prescription behavior; the SR model offers a combined stimulus with appropriate modification. The pharmaceutical companies generate different stimuli through marketing mix factors, which influence the physician’s intention to prescribe a drug; these stimuli trespass into the black box of a doctor and ultimately translate into influences. According to Kotler [72], it comprises two elements; firstly, physician characteristics influence the way in which stimuli are perceived, imagined, and translated through the marketers, and such features of a physician can be accredited to secretive factors, for instance psychological and social variables. However, secondly, the process of decision making of the physician eventually defines the physician’s prescription behavior [73].
2.1.4. Theory of Planned Behavior (TPB)
According to Eccles et al. [74], the theory of planned behavior (TPB) is one of the most applicable and repeatedly employed behavioral theories to understand the responsible prescription behavior of physicians. Ponnet et al. [18], Godin et al. [19], Perkins et al. [75], and Kramer et al. [76] have successfully used TPB theory to comprehend the underlying factors for prescribing behavior of doctors in different specialties. The literature is based on the TPB model of Ajzen [24] that explains and examines the personal norms’ capability, attitude, and a device of perceived behavioral force that changes the intentions and responsible prescription behavior of physicians. The degree that the doctor is favorable or unfavorable depends on their attitude towards the marketing efforts and other factors such as availability of drug information (prescribing information of medicine such as dosage, indications, side effects, etc.), sales promotion, medical representatives’ effectiveness, and brand name of a drug (famous brands of multinational companies such as Amoxil, Lipitor, Zocor, Augmentin, etc. in comparison to local companies brands) [42]. The second element of the TPB theory concerning subjective norms measures the influencing pressure of patients’ demand for a certain drug, expectations of patients, pharmacists’ expert power, and pharmacist and physician collaboration for the prescription of a certain drug. However, the third factor of the TPB theory deals with the perceived behavioral control that is a function of behavior, which suggests experience or product knowledge that deals with future problems. Thus, perceived behavioral control (PBC) directly influences the physician’s responsible prescription behavior because of the first-hand experience of a physician [24]. However, drug characteristics, physician’s persistence, cost/benefit ratio (side effects vs. cure effects) of the drug, and trustworthiness of physicians on the expert power of pharmacist are contextual factors, which influence the physician’s responsible prescription behavior [42].
2.1.5. Theory of Social Power (TSP)
According to Basak et al. [77], in the healthcare context, there will always be cooperation and communication amongst team members, which will usually have an effect due to the social power of team members. For understanding the crucial role of the pharmacist, the social power theory is the best application; the power is expressed as the ability to influence. However, the social power is the ability to influence the behavior of someone else through persuasion, which in the healthcare context concerns the role of an individual to have a significant influence on team members to alter their behavior [77,78,79]. However, expert power refers to the knowledge, work experience, and skills of an individual that are mostly based on intensive education and work experience, and credentials of an individual. Thus, in the context of healthcare, pharmacists’ expert power influences the physician’s prescription intentions due to their intensive education and working experience, and physicians rely on the recommendations of a pharmacist [78,80]. The power and influence are the two significant components of the theory of social power, following the control relational theory, the pharmacist and physician collaboration, the pharmacist education, and experience, which drive the responsible prescription behavior of physicians by providing information, indications, advice, and safety profile regarding the drug. On the other hand, the literature exhibited that trustworthiness is the moderating factor in a relationship between pharmacist factors and physician’s prescription behavior [42,78].
As shown in Figure 1, 13 causal factors are classified and merged; this novel model consists of marketing efforts, patients’ characteristics, and pharmacist factors as direct influencers. However, trustworthiness has been used as a moderating variable in a relationship between pharmacist factors and physician’s decision to prescribe drugs [42,80]. Moreover, the suggested model assimilates several features of seven recognized conceptual models; thus, the undertaken research is an empirical effort to examine the physician’s decision to prescribe the drug based on different theories and models, which were discussed earlier. This research also evaluates or empirically tests previously featured models and theories that were demonstrated in several research studies [19,23,39,41,42]. The undertaken research aims to empirically examine the theoretical framework in the context of the Pakistani healthcare sector; thus, the results of this study provide new aspects that influence the physician’s prescription behavior. Hence, this study will also be beneficial to the marketers of the pharmaceutical industry to develop effective and efficient marketing strategies to get maximum ROI of their investments.
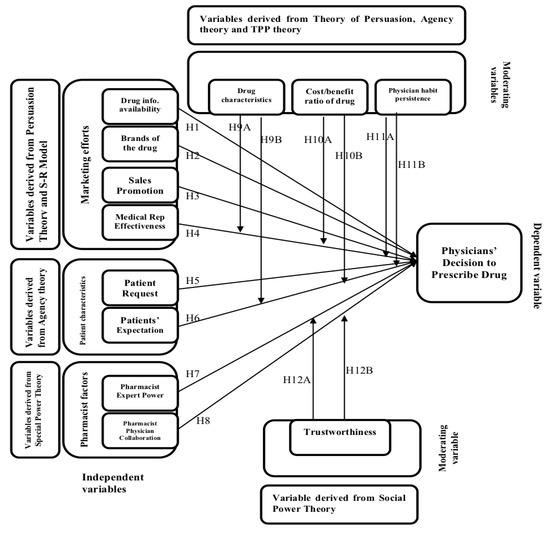
Figure 1.
Theoretical and conceptual model of the study [42].
2.2. Hypotheses Formulation
Thus, based on previous literature about the social and behavioral theories, the following hypotheses have been developed:
Hypotheses about the DIRECT relationship
Hypothesis 1 (H1).
Drug information availability has a significant and positive effect on a physician’s decision to prescribe a drug.
Hypothesis 2 (H2).
Brands of the drug have a significant and positive influence on physician’s decision to prescribe a drug.
Hypothesis 3 (H3).
Sales promotion has a significant and positive effect on a physician’s decision to prescribe a drug.
Hypothesis 4 (H4).
Medical representatives’ effectiveness has a significant and positive effect on a physician’s decision to prescribe a drug.
Hypothesis 5 (H5).
Patient’s request for a drug has a significant and positive effect on a physician’s decision to prescribe a drug.
Hypothesis 6 (H6).
Patient’s expectation has a significant and positive effect on a physician’s decision to prescribe a drug.
Hypothesis 7 (H7).
Pharmacist expert power has a significant and positive effect on a physician’s decision to prescribe a drug.
Hypothesis 8 (H8).
Pharmacist–physician collaboration has a significant and positive effect on a physician’s decision to prescribe a drug.
2.3. The Moderating Variables for the Recommended Model
The suggested model proposes an association between the influences (moderation) of numerous variables, which have been found in distinctive physician’s models for prescription intentions towards the medicines. Thus, based on previous literature, the cost and benefit ratio of a drug has a significant moderating effect between endogenous variables and physician’s decision to prescribe a drug [29,37,43]. However, in the physician and patient relationship, the patient entirely relies on the expert power of physician for diagnosis and prescription, hence physician’s habit persistence is also a significant moderating variable [29,39,66]. According to Groves [43], the physician’s decision to prescribe a certain drug is based on several influencing (moderating) factors that the patient has a little control over such as physician’s persistence, drug characteristics, and cost/benefit of a medicine [37,42,64,66]. Similarly, the literature exhibited that trustworthiness is a moderating factor in the relationship between pharmacist factors and physician’s prescription behavior [42,78,80]. Hence, the undertaken model, the cost and benefit ratio of drug (CBR), drugs’ characteristics (DCH), and physician’s habit persistence (PHP) have been taken as moderating factors in an association between medical representative effectiveness (MRE) and patient expectations (PEX), and physician’s decision to prescribe drugs (PDP) [29,39,41,42,66]. The conceptual frame also included trustworthiness (TRU) as the moderating factor in an association between pharmacists’ expert power (PEP) and pharmacist–physician collaboration (PPC), and physician’s decision to prescribe drugs (PDP) [43,66,78,80].
2.4. Hypotheses about Moderating Effect
The moderating variables have a direct relationship with physician’s decision to prescribe a drug. The direct relationship is defined as “If the value of moderating variable increases, then the value of outcome variable also increases or vice versa”. However, the values of exogenous variables are considered constant as explained in results section.
Hypothesis 9A (H9A).
Drug characteristics have a significant and direct moderating effect between medical representatives’ effectiveness and physician’s decision to prescribe a drug.
Hypothesis 9b (H9b).
Drug characteristics have a significant and direct moderating effect between the patient’s expectations and the physician’s decision to prescribe a drug.
Hypothesis 10A (H10A).
Cost and benefit ratio of a drug has a significant and direct moderating effect between medical representatives’ effectiveness and physician’s decision to prescribe a drug.
Hypothesis 10B (H10B).
Cost and benefit ratio of a drug has a significant and direct moderating effect between patient’s expectations and physician’s decision to prescribe a drug.
Hypothesis 11A (H11A).
Physician’s habit persistence has a significant and direct moderating effect between medical representatives’ effectiveness and physician’s decision to prescribe a drug.
Hypothesis 11B (H11B).
Physician’s habit persistence has a significant and direct moderating effect between a patient’s expectations and the physician’s decision to prescribe a drug.
Hypothesis 12A (H12A).
Trustworthiness has a significant moderating effect between pharmacist expert power and a physician’s decision to prescribe a drug.
Hypothesis 12B (H12B).
Trustworthiness has a significant and direct moderating effect between pharmacist–physician collaboration and physician’s decision to prescribe a drug.
2.5. Proposed Model of the Study
The previous review helps to understand and assimilate the important theories and frameworks to build a concrete model to comprehend the multifaceted physician’s decision to prescribe the medicines. The challenge of this model is to test and measure the conceptual framework because it is comprised of different theories and models. This empirical study tests the theoretical framework of different scholarly works such as French and Raven [79], Ajzen [24], Kotler [73], Petty and Cacioppo [70], Jansen and Meckling [63], and Murshid and Mohaidin [42]. The undertaken study not only tests and validates the existing findings, but also enhances the current knowledge base on the foundation of a newly derived model of Figure 2. These relationships have been based on previous theories, which were discussed earlier and mentioned in Figure 1 [42].
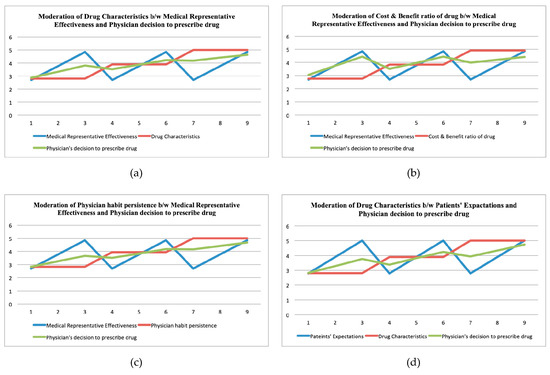
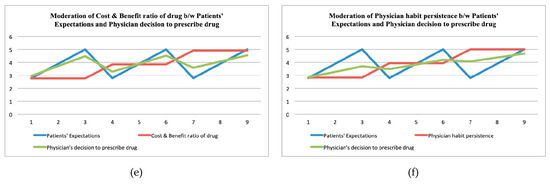
Figure 2.
The visualizing conditional effect of moderators (drugs’ characteristics (DCH), the cost and benefit ratio of drug (CBR), and physician’s habit persistence (PHP).
3. Material and Methods
3.1. Research Design and Measurement Scales
The research design of this research is cross-sectional and quantitative; we employed a modified structured questionnaire for the collection of data. The scales of questionnaire were adapted from the previous literature; the modified items for marketing efforts related factors such as drug information and availability, the brand of a drug, the sales promotion, and MRs effectiveness were adapted from Howie [14], Ponnet et al. [18], Godin et al. [19], Raisch [22], Hemminki [23], Knapp and Oeltjen [41], Murshid and Mohaidin [42], Xing and Othman [71], Perkins et al. [75], and Kramer et al. [76]. The modified items for patients’ characteristics and related factors such as patients’ requests for a drug and patient’s expectations were considered from previous literature [42,62,63,64]. The items for pharmacists related factors such as pharmacists’ expert power, and pharmacist and physician collaborations were adapted from previous literature [42,77,78,79,80]. However, the items for contextually related factors such as drug characteristics, cost and benefit (side effects vs. cure effects) ratio, physician’s persistence, and trustworthiness were taken from previous literature such as Godin et al. [19], Hemminki [23], Knapp and Oeltjen [41], Murshid and Mohaidin [42], Xing and Othman [71], Perkins et al. [75], Kramer et al. [76], Basak et al. [77], Busch and Wilson [78], and Rigby [80].
3.2. Sampling Frame and Sample Size
The sampling frame for the undertaken study was the family physicians from the metropolitan cities of Pakistan such as Karachi, Lahore, Islamabad, Peshawar, Multan, and Hyderabad. We used non-probability sampling, for instance a purposive sampling strategy for selecting the sample size; the self-administered survey technique was employed. The data were collected through skilled research personnel directly from the family physician in person through an appointment. We used a 5-point Likert scale structured questionnaire that was adapted from previous literature. Primarily, we collected data from 1050 family physicians, but we received 984 questionnaires that were completed filled; however, 66 questionnaires were found inadequately filled. Hence, the response rate was 93.71%.
3.3. Estimations Techniques for the DATA Analysis
We used the SEM-based multivariate approach for data analysis such as exploratory factor analysis for the adequacy and retention of modified items and constructs. However, the confirmatory factor analysis was used to check the previous items and constructs that were already used in previous studies [9]. The CFA modeling provides the substantiality for adopted items and constructs and whether they are fit for the undertaken study or not [9,27]. We employed descriptive analysis for the characteristics of data samples such as mean, standard deviation, skewness, and kurtosis. In the exploratory factor analysis, we used the rotated component matrix for the analysis of factor loading, composite reliability, and average variance extracted. We also employed Kaiser Meyer Olkin (KMO) and Bartlett’s techniques for the reduction and adequacy of constructs and items. For the reliability and suitability of the data sample, we used the total variance explained and anti-image correlation matrix techniques. For the conformity of the hypothesized structured model, we employed confirmatory factor analysis. Finally, we used a conditional process modeling technique for measuring direct and indirect (moderation) hypothesized relationships [27]. For the estimation purposes, we employed SPSS21, AMOS21, Hayes Conditional Process, and EXCEL software
3.4. Respondents’ Profile
A total of 1050 questionnaires were distributed to the physicians of Pakistan, and we collected 984 responses, which were completed in every aspect, however 66 responses were incomplete or inappropriate. Thus, in this way, the response rate was 93.71%, which is considered excellent as the previous literature demonstrated [81,82]. As far as the demographic profile of respondents is concerned, there were 552 (56.1%) males and 432 (43.9%) females. In terms of marital status, 564 (57.3%) respondents were single, whereas, 387 (39.3%) respondents were married, and 33 (3.4%) were divorced. In terms of age, 341 (34.7%) respondents were in the 20–30 years age bracket and 221 (22.5%) respondents were in the 30–40 years age bracket. Moreover, 147 (14.9%) respondents were in the 40–50 years age bracket, 154 (15.7%) respondents were in the 50–60 years age bracket, and 121 (12.3%) respondents were in the age bracket of more than 60 years. As far as the qualification of respondents is concerned, 417 (42.4%) possessed a graduation degree and 314 (31.9%) respondents had local post-graduation qualifications. However, 162 (16.5%) respondents had foreign post-graduation qualification, and 91 (9.2%) respondents had PhDs degrees. As far as the experience is concerned, 255 (25.9%) respondents acquired (1–5) years of experience, 299 (30.4%) respondents had 5–10 years, 142 (14.4%) respondents had 10–15 years, 134 (13.6%) respondents had 15–20 years, and 154 (15.7%) respondents possessed more than 20 years of experience. Finally, in terms of income in Pakistani Rupee, there were 167 (17.0%) respondents that had 10K–30K earnings, 427 (43.4%) respondents had 30K–50K income, 211 (21.4%) respondents had 50K–70K earnings, 108 (11.0%) respondents had 70K–90K income, and 71 (7.2%) respondents had more than 90K income in Pakistani Rupee (PKR). Table 1 exhibits the details of the results.

Table 1.
Respondents’ Profile.
4. Results
4.1. Descriptive Analysis
The normality of the sample data is a pre-requisite for using structural equation modeling [83]; thus, taken data have been transformed into z-scores, and descriptive analysis was employed. The outcomes of Table 2 showed that all the cases remained between ±3 kurtosis. It is further exhibited in Table 2 that the skewness and standard deviation lie between the ranges of ±1.5, therefore it is concluded that the normality pattern is evident in the collected data [84,85].
Table 2.
Descriptive statistics.
4.2. Reliabilities and AVE Analyses
The outcome of Table 3 demonstrated that the values of composite reliabilities and Cronbach’s alphas are over 0.85, which meets the minimum criterion of a threshold of 0.60 [84]. It is also evident from Table 3 that the values of all the factor loadings are in the range of 0.50–0.95, which fulfilled the criterion of discriminant validities [84,85]. The condition of convergent validities is satisfied because the AVE is greater than 0.50 [86], which is also a pre-requisite for employing SEM-based structural modelling such as exploratory and confirmatory factor analysis. The results of Table 3 demonstrated the results of Factor Loading (FL), Composite Reliabilities (CR), Cronbach’s Alpha (CA), and Average Variance Extracted (AVE).
Table 3.
Reliabilities and average variance extracted.
4.3. Exploratory Factor Analysis—EFA
We employed the analysis of exploratory factors to ascertain the fitness and reduction of the sample data; the EFA further categorizes the loaded items, which were enlisted on the comparable factor or construct. Exploratory factor analysis has the proficiency to shrink a large amount of data sample into a reduced form. According to Emory and Cooper [87], the EFA technique may assist the researcher in scrutinizing the possessions of the variables. The outcomes of Table A1 (see Appendix A) exhibited the results of the principal component rotated matrix, which authenticated the construct validities of factors and items of the data sample. The undertaken study consists of 13 factors, and 39 items, in which physician decision to prescribe drug (PDP) is comprised of three items each with factor loadings of 0.935, 0.879, and 0.938; drugs’ information availability (DIA) has three items each with factor loadings of 0.897, 0.894, and 0.904; brands of a drug (BOD) is contained on three items each with factor loadings of 0.904, 0.869, and 0.908; sales promotion (SPR) is comprised of three items each with factor loadings of 0.910, 0.891, and 0.919; medical representatives’ effectiveness (MRE) is contained on three items each with factor loadings of 0.928, 0.900, and 0.948; patients’ request for drug (PRD) is comprised of three items each with factor loadings of 0.897, 0.868, and 0.920; patients’ expectations (PEX) has three items each with factor loadings of 0.921, 0.893, and 0.908; pharmacists’ expert power (PEP) is comprised of three items each with factor loadings of 0.897, 0.870, and 0.909; pharmacist–physician collaborations (PPC) is contained on three items each with factor loadings of 0.907, 0.878, and 0.914; drug characteristics (DCH) is comprised of three items each with factor loadings of 0.930, 0.902, and 0.937; cost and benefit ratio of a drug (CBR) is comprised of three items each with factor loadings of 0.929, 0.895, and 0.909; trustworthiness (TRU) is contained on three items each with factor loadings of 0.895, 0.894, and 0.915; and physician’s habit persistence (PHP) is comprised of three items each with factor loadings of 0.907, 0.883, and 0.922. The outcomes of Table A1 (see Appendix A) exhibits that the values of factor loading for each construct was over 0.50, which confirmed and validated all items and factors, which we have loaded for the undertaken study [84,88,89].
4.4. Kaiser Meyer Olkin (KMO) and Bartlett’s Techniques
The KMO analysis and Bartlett’s Sphericity technique examine the suitability and fitness of the data sample; the outcomes of Table 4 exhibit that the KMO value is 0.931, which is fairly excellent because according to Kaiser [89], values ranging 0.70–0.79 are considered to be good, and ranging 0.80–0.99 are to be considered excellent. The results of Table 4 further demonstrate the values of Bartlett’s Sphericity test, and it shows the probability is less than 0.50 i.e., 0.000, which indicated the correlation between items is cogent and adequate at 0.05 level of significance.
Table 4.
Bartlett’s and Kaiser Meyer Olkin (KMO) tests.
4.5. Total Variance Explained
The cumulative percentage of variance for 13 factors demonstrated the dispersion of the variance of these potential factors; the total value of Eigen is greater than 1, which further established the amount of variance amongst prospective factors as indicated by Table 5. The results also exhibited that the cumulative variance is 81.06%, which is considered to be very good since the minimum threshold value is 50%. Hence, based on total Eigenvalue and cumulative variance, it is concluded that our data sample is to be considered reliable, and we can proceed for further analysis.
Table 5.
Total variance explained.
4.6. Confirmatory Factor Analysis—CFA
The CFA is an appropriate and direct approach to check the measurement model; moreover, the CFA analysis examines whether our data fit a hypothesized measurement model [88]. In our measurement model, we confirm the factors of physician’s decision to prescribe a drug (PDP) such as drug information availability (DIA), brands of the drug (BOD), sales promotion (SPR), medical representative effectiveness (MRE), and patients characteristics like patient request for drug (PRD), patients’ expectations (PEX), and pharmacist factors, for instance, pharmacist expert power (PEP) and pharmacist physician collaborations (PPC). Moreover, drug characteristics (DCH), cost/benefit ratios of the drug (CBR), physician habit persistence (PHP), and trustworthiness (TRU) have been considered as moderating variables. We incorporated 39 items of all these 13 factors into the confirmatory factor analysis and fixed the data sample between observed and unobserved [84,86]. The results showed that factor loading ranged 0.80–0.95, which demonstrated that the overall measurement model is acceptable; moreover, it was also confirmed through the factor loading of all the items, which were greater than 0.50, which also substantiated the construct and convergent validities of the hypothesized measurement model. The outcomes of Table 6 demonstrate that the fit-indices (GFI: 0.96, IFI: 0.95, CFI: 0.96, TLI:0.97, NFI:0.92, RNI:0.98, PCFI:0.85, PNFI:0.87, RMSEA:0.004) for the measured model are within the prescribed ranges, and it is finally concluded that considered the hypothesized measurement model for the physician decision to prescribe the drug is suitable. Moreover, Hair et al. [88] and Bentler [90] have concluded, if the values of GFI, CFI, IFI, TLI, and IFI are close to 0.95 or over then the hypothesized model should be accepted.
Table 6.
Fit-indices statistic.
4.7. Structural Equation Modelling—SEM
We employed structural equation modelling for the estimation of parameters for the physician decision to prescribe the drug (PDP) from the perspective of the healthcare sector of Pakistan. In our structural model, we used four factors of marketing efforts such as drug information availability (DIA), brands of the drug (BOD), sales promotion (SPR), and medical representative effectiveness (MRE); patients characteristics like patient request for drug (PRD) and patients’ expectations (PEX); and pharmacist factors, for instance, pharmacist expert power (PEP) and pharmacist physician collaborations (PPC). Moreover, drug characteristics (DCH), cost/benefit ratio of the drug (CBR), physician habit persistence (PHP), and trustworthiness (TRU) were considered as moderating variables, and physician decision to prescribe the drug (PDP) as a dependent variable. The results of Table 6 exhibit that based on our suggested research hypothesis, the results of the structural model indicate that the entire model is acceptable under the threshold values of the fit-indices statistics. The outcomes of Table 6 show that values of GFI:0.98, CFI:0.98, IFI:0.97, TLI:0.99, NFI:0.94, RNI:0.99, PCFI:0.88, PNFI:0.89, and RMSEA:0.005 are within the prescribed limits of all the indices. Hence, the overall results of the structural model exhibited adequate information to accept the model for the data sample. Finally, it is concluded that our structural model is accepted as a useful instrument to examine the PDP.
4.8. Hypothesized Direct Relationship
We employed standardized regression weights to interpret the direct relationship between four factors of marketing efforts such as drugs’ information availability (DIA), sales promotion (SPR), brands of a drug (BOD), medical representatives’ effectiveness (MRE); characteristics of patients including patients’ request for a drug (PRD) and patients’ expectations (PEX); and pharmacist factors, for instance, pharmacist and physician collaboration (PPC), pharmacists’ expert power (PEP), and physician’s decision to prescribe a drug (PDP) in the perspective of healthcare sector of Pakistan. The results of Table 7 demonstrated that all eight null hypotheses (H1–H8) have been rejected because T-values are greater than 2, and corresponding probabilities are less than 0.5 in all the hypotheses. Thus, it is concluded that all the null hypotheses are supported, and DIA, BOD, SAL, MRE, PRD, PEX, PEP, and PPC have a significant and positive influence on the PDP. The individual results signified that the pharmacist physician collaborations (PPC), and patients’ expectations (PEX) have the highest impacts of 0.522 and 0.515, respectively. However, patient request for a drug (PRD) and drug information availability (DIA) followed with the impacts of 0.402 and 0.344, respectively, on the PDP.
Table 7.
Hypothesized direct relationship.
4.9. Moderation Analysis in a Relationship between Endogenous and Exogenous Variables
Outcomes of Table 8 exhibit the moderation analysis of moderating variables, for instance drugs’ characteristics (DCH), cost and benefit ratio of a drug (CBR), and physician’s habit persistence (PHP), in the relationship of exogenous variables such as medical representative effectiveness (MRE) and patients’ expectations (PEX) and endogenous variables i.e., physician’s decision to prescribe a drug (PDP). Moreover, Table 8 further exhibited the moderation analysis of trustworthiness (TRU) in the relationship of exogenous variables such as pharmacists’’ expert power (PEP), and pharmacist and physician collaborations (PPC) and an endogenous variable i.e., PDP. Thus, the results demonstrated that hypotheses H9A, H10A, H11A, H10B, H11B, H12A, and H12B have been supported, however H9B has not been supported. Thus, it is finally concluded that CBR and PHP have played a significant moderating effect between MRE and PDP, and CBR and PHP have a significant moderating effect between PEX, and PDP. However, drug characteristics (DCH) do not have any moderating impact between PEX and PDP. Similarly, the trustworthiness has a significant moderating effect between PEP and PPC, and endogenous variables i.e., PDP.
Table 8.
Moderating effect.
4.10. Visualization of Conditional Effect
Figure 2 exhibit the visualizing conditional effects of the moderating variables such as drug characteristics (DCH), physician’s habit persistence (PHP), and cost and benefit (side effects vs. cure effects) ratio of drug (CBR) in an association with medical representative effectiveness (MRE) and patients’ expectations (PEX), and endogenous variables such as physician’s decision to prescribe a drug (PDP). Figure 2 exhibit that the independent variables such as MRE and PEX experienced a significant influence of moderation while we inducted three mediating variables such as DCH, CBR, and PHP. The results of Figure 2 depict that the effect of a physician’s decision to prescribe a drug (PDP) changes with the different values of moderating variables (DCH, CBR, and PHP), with constant values for independent variables (MRE and PEX) during this moderating process. Hayes [91] pointed out that the graphical representation is an essential condition to show the moderation process because it demonstrates the impact of moderation. Figure 2 show blue for the independent variables (MRE, PEX), red depicts the incorporated moderators (DCH, CBR, and PHP), and green exhibits the influence of the physician’s decision to prescribe a drug (PDP). Hence, it is finally concluded from Figure 2, the mediating variables (DCH, CBR, PHP) have a cogent influence amongst the association of MRE and PEX, and physician decision to prescribe the drug (PDP) in the context of the healthcare sector of Pakistan. The x-axis demonstrates the continuums of moderating (drug characteristics, cost and benefit ratio of drug, and physician habit persistence), exogenous (medical representative effectiveness and patients’ expectations), and endogenous (physician’s decision to prescribe a drug) variables’ values. However, the y-axis represents the total values of moderating, exogenous, and endogenous variables. Moreover, the x-axis further demonstrates the low, average, and high values of exogenous variables; similarly, the y-axis also showed the patterns of physician’s decision to prescribe a drug (endogenous variable) due to the interaction of moderating variables.
Similarly, the visualized conditional effect can also be seen in Figure 3, in which the moderating variable trustworthiness in an association of pharmacist–physician collaboration (PPC) and pharmacist expert power (PEP), was an endogenous variable such as physician’s decision to prescribe a drug (PDP). The results of Figure 3 depict that the effect of a physician’s decision to prescribe a drug (PDP) changes with the different values of the moderating variable (TRU), with constant values for independent variables (PEP and PPC) during this moderating process. Thus, it is also concluded from Figure 3 that the moderating variable (TRU) has a significant influence amongst the association of PEP and PPC, and physician decision to prescribe the drug (PDP) in the context of the healthcare sector of Pakistan. In Figure 3, blue represents the independent variables such as pharmacist–physician collaboration (PPC) and pharmacist expert power (PEP), red depicts the incorporated moderator trustworthiness (TRU), and green exhibits the influence of physician’s decision to prescribe a drug (PDP). The x-axis demonstrates the continuums of moderating (trustworthiness), exogenous (pharmacist expert power and pharmacist physician collaboration), and endogenous (physician’s decision to prescribe a drug) variables’ values. Furthermore, the y-axis represents the total values of moderating, exogenous, and endogenous variables. Moreover, the x-axis further demonstrates the low, average, and high values of exogenous variables; similarly, the y-axis shows the patterns of physician’s decision to prescribe a drug (endogenous variable) due to the interaction of moderating variables.
Figure 3.
The visualizing conditional effect of a moderator (trustworthiness) amongst pharmacist–physician collaboration, pharmacist expert power, and physician decision to prescribe a drug.
5. Discussion
The purpose of the undertaken study is to test the model empirically, which encompasses different theories and models. The outcomes of this study concluded that the marketing factors such as brands of the drug, sales promotion, drug information availability, and medical representatives’ effectiveness, as well as the characteristics of patients including patients’ expectations, patients’ request for a particular drug, and pharmacist factors, for instance, pharmacist expert power and pharmacist physician collaborations, have a positive and significant influence on the decision of a physician to prescribe a medicine. Thus, the outcomes of the direct relationship validated the theoretical construct such as attitudes and marketing stimuli, which were derived from the theory of planned behavior (TPB) [18,19,24,74,75,76], theory of persuasion [22,29,67,68,69,70], theory of social power [77,78,79,80], and stimulus–response (SR) theory [71,72,73] for marketing factors such as brands of the drug, sales promotion, drug information availability (prescribing information), and MR effectiveness. Similarly, results also validated theoretical constructs such as social norm and social stimuli, which were extracted from the theory of planned behavior [18,19,24,74,75,76], theory of persuasion [22,29,67,68,69,70,71], agency theory [29,37,43,62,63,64,65,66], and stimulus–response (SR) theory [71,72,73] for the characteristics of patients including patients’ expectations, patients’ request for a particular medicine. Finally, the outcomes of direct relationship also confirmed the similar theoretical constructs such as social norm and social stimuli, which were also taken from TPB [18,19,24,74,75,76], theory of persuasion [22,29,67,68,69,70], social power theory [71,77,78,79,80], and SR theory [71,72,73] for the factors of pharmacist including pharmacist–physician collaboration and expert power of pharmacist. The outcomes of the indirect relationship (moderation) validated the theoretical construct of moderating variables such as physician’s habit persistence, cost and benefit ratio of the drug, and drug characteristics, which were derived from the theory of planned behavior (TPB) [18,19,24,74,75,76], theory of persuasion [22,29,67,68,69,70], and agency theory [29,37,43,62,63,64,65,66]. Moreover, physician’s habit persistence, and cost and benefit (side effects vs. cure effects) ratio of the drug have a significant moderating effect between the expectations of patients and the decision of physician to prescribe a medicine. The results further confirmed moderating variables such as DCH, CBR, and PHP that were extracted from TPB [18,19,24,74,75,76], theory of persuasion [22,29,67,68,69,70], and agency theory [29,37,43,62,63,64,65,66]. The outcomes of the indirect relationship (moderation) of trustworthiness, which was derived from the theory of planned behavior (TPB) [18,19,24,74,75,76], theory of persuasion [22,29,67,68,69,70], the theory of social power [77,78,79,80], and agency theory [29,37,43,62,63,64,65,66] were validated.
6. Conclusions
The undertaken study not only tests and validates the existing findings, but also enhances the current knowledge that is based on the foundation of a newly derived model in which 13 causal factors are classified and merged. Thus, the undertaken research is an attempt to empirically examine the intentions of physicians to prescribe a certain medicine based on different theories and models that were embedded into the considered model. The outcomes of this study concluded that marketing factors such as brands of the drug, sales promotion, drug information availability, and medical representatives’ effectiveness, as well as the characteristics of patient including patients’ expectations and patients’ request for a particular drug, and pharmacist factors, for instance pharmacist expert power and pharmacist physician collaborations, have a positive and significant influence on the decision of physician to prescribe a medicine. Thus, the outcomes of the direct relationship validated the theoretical construct such as attitude and marketing stimuli, which were derived from the theory of planned behavior (TPB). It is also concluded from the moderation analysis that physician’s habit persistence and cost and benefit (side effects vs. cure effects) ratio of the drug have played a significant moderating effect between medical representative effectiveness and the decision of physician to prescribe a certain medicine. However, drug characteristics do not have any moderating impact between the expectations of patients, and the decision of physicians to prescribe the medicine. Similarly, trustworthiness has a significant moderating effect between pharmacist–physician collaboration, and expert power of pharmacists and the decision of physician to prescribe a medicine. Finally, it is concluded that the considered conceptual model has been validated from the results of an undertaken study for both direct and indirect relationships amongst the variables. Hence, the outcomes of the undertaken research specify the new aspects that influence the physician’s prescription behavior towards a certain medicine. Hence, this study will also be beneficial to the marketers of the pharmaceutical industry to develop their effective and efficient marketing strategies to get maximum ROI of their investments.
7. Managerial Policy Implications
The results of this study offer a soil, predominantly to the policymakers, marketing, and brand managers to select how to specify distinctive strategies for the pharmaceutical marketing effectiveness to have optimum ROI of their investments. Our research assists and ensures good receptivity between the pharmaceutical health sector and its customers (physicians). As far as the practical implications of the undertaken study, pharmaceutical marketing and brand managers should be considerate regarding physician’s psychological and behavioral factors to comprehend the physician’s decision to prescribe the drugs. However, the undertaken research has successfully implemented the modified version of a theory of planned behavior, a theory of social power, persuasive theory, SR theory, and agency theory model that exhibited the theoretical constructs to understand the physician’s behavior. The empirically tested model improves the existing scenario for pharmaceutical managers toward the physician’s prescription behavior for effective and efficient marketing strategies. This practice can be used to analyze the attitude and behavioral intentions of prospective customers by segmenting them into different categories. In conclusion, the outcomes of this research have major contributions to the existing literature regarding the physician’s prescription behaviors’ theory development.
8. Limitations and Delimitations of the Research
The undertaken study has introduced new findings and sets a novel dimension in the perspective of a physician’s decision to prescribe drugs. However, the undertaken research has exhibited certain limitations and delimitations such as the study did not distinguish the other specialties of doctors’ pool, the geographic scope is limited to the urban centres of Pakistan, and thus, the findings cannot be generalized. Therefore, future studies should be carried out for other regional and developed countries. The considered model may have some limitations to predict behavioral intentions to prescribe certain medicines. In this context, the predictive control of TPB, SR theory, persuasive theory, social power theory, and agency model do not consider personality and demographic factors in the model. Similarly, the undertaken model of an individual is hard to measure, while this model ignores the unconscious motives of an individual under the assumption of rational and systematic decisions of physicians. Finally, the SEM-based modelling does not offer the clarification of causality, however numerous research scholars are covertly concerned to examine cause and affect phenomenon. Thus, future research studies may nurture causal models to comprehend the causation and cause-effect for the behavioral intention of doctors to prescribe the drug.
Author Contributions
Conceptualization, R.R.A., and D.S.; methodology, J.V.; software, R.R.A.; validation, D.S., R.R.A., and J.A.; formal analysis, J.S.; investigation, J.V.; resources, J.S.; data curation, J.A.; writing—original draft preparation, R.R.A.; writing—review and editing, J.V.; visualization, J.A.; supervision, R.R.A.; project administration, D.S. All authors have read and agreed to the published version of the manuscript.
Funding
This research received no external funding.
Acknowledgments
We acknowledge the healthcare institutions, and support of Indus University that provided during this project including administrative and technical support.
Conflicts of Interest
The authors declare no conflict of interest.
Appendix A
Table A1.
Rotated Component Matrix a.
References
- Gehlbach, S.; Wilkison, W.; Clapp, N.; Finn, A.; Taylor, W.; Rodell, M.S. Improving Drug Prescribing in a Primary Care Practice. Med. Care 1984, 22, 193–201. [Google Scholar] [CrossRef]
- James, C.; Peabody, J.; Solon, O.; Quimbo, S.; Hanson, K. An Unhealthy Public-Private Tension: Pharmacy Ownership, Prescribing, and spending in the Philippines. Health Affairs 2009, 28, 1022–1033. [Google Scholar] [CrossRef] [PubMed]
- Campbell, E.G.; Gruen, R.L.; Mountford, J.; Miller, L.G.; Cleary, P.D.; Blumenthal, D. A national survey of Physicians-Industry relationships. N. Engl. J. Med. 2007, 356, 1742–1750. [Google Scholar] [CrossRef] [PubMed]
- Moynihan, R. Who pays for the pizza? Redefining the relationships between and drug companies. BMJ 2003, 326, 1193–1196. [Google Scholar] [CrossRef] [PubMed]
- Ahmed, R.R.; Vveinhardt, J.; Štreimikienė, D.; Awais, M. Mediating and Marketing factors influence the prescription behavior of Physicians: An Empirical Investigation. Amfiteatru Econ. 2016, 18, 153–167. [Google Scholar]
- Lexchin, J. What information do physicians receive from pharmaceutical representatives? Can. Family Phys. 1997, 43, 941–945. [Google Scholar]
- Gonul, F.F.; Carter, F.; Petrova, E.; Srinivasan, K. Promotion of prescription drugs and its impact on physicians’ choice behaviour. J. Market. 2001, 65, 79–90. [Google Scholar] [CrossRef]
- Liu, S.S. A comparison of pharmaceutical promotional tactics between Hong Kong and China. J. Bus. Ind. Market. 1995, 10, 34–43. [Google Scholar] [CrossRef]
- Ahmed, R.R.; Veinhardt, J.; Štreimikienė, D. The direct and indirect impact of Pharmaceutical industry in Economic expansion and Job creation: Evidence from Bootstrapping and Normal theory methods. Amfiteatru Econ. 2018, 20, 454–469. [Google Scholar] [CrossRef]
- Hogerzeil, H. Promoting rational prescribing: An international perspective. Brit. J. Clin. Pharmacol. 1995, 39, 1–6. [Google Scholar] [CrossRef]
- Carthy, P.; Harvey, I.; Brawn, R.; Watkins, C.H. A study of factors associated with costs and variation in prescribing among GPs. Family Pract. 2000, 17, 36–41. [Google Scholar] [CrossRef] [PubMed]
- O’Mahony, D.; Galagher, P.F. Inappropriate prescribing in the older population: Need for new criteria. Age Ageing 2008, 37, 138–141. [Google Scholar] [CrossRef] [PubMed]
- Schumock, G.T.; Walton, S.M.; Park, H.Y.; Nutescu, E.A.; Blackburn, J.C.; Finley, J.M.; Lewis, R.K. Factors that influence prescribing decisions. Ann. Pharmacother. 2004, 38, 557–562. [Google Scholar] [CrossRef] [PubMed]
- Howie, J.G. Clinical judgment and antibiotic use in general practice. BMJ 1976, 2, 1061–1064. [Google Scholar] [CrossRef] [PubMed][Green Version]
- Theodorou, M.; Tsiantou, V.; Pavlakis, A.; Maniadakis, N.; Fragoulakis, V.; Pavi, E.; Kyriopoulos, J. Factors Influencing Prescribing Behavior of Physicians in Greece And Cyprus: Results From A Questionnaire Based Survey. BMC Health Serv. Res. 2009, 9, 150. [Google Scholar] [CrossRef]
- Vancelik, S.; Beyhun, N.E.; Acemoglu, H.; Calikoglu, O. Impact of pharmaceutical promotion on prescribing decisions of general practitioners in Eastern Turkey. BMC Public Health 2007, 7, 122. [Google Scholar] [CrossRef]
- Manchanda, P.; Honka, E. The effects and role of direct-to-physician marketing in the pharmaceutical industry: An integrative review. Yale J. Health Policy Law Ethics 2005, 5, 785–822. [Google Scholar]
- Ponnet, K.; Wouters, E.; Van Hal, G.; Heirman, W.; Walrave, M. Determinants of physicians’ prescribing behaviour of methylphenidate for cognitive enhancement. Psychol. Health Med. 2014, 19, 286–295. [Google Scholar] [CrossRef]
- Godin, G.; Bélanger-Gravel, A.; Eccles, M.; Grimshaw, J. Healthcare professionals’ intentions and behaviours: A systematic review of studies based on social cognitive theories. Implement. Sci. 2008, 3, 36. [Google Scholar] [CrossRef] [PubMed]
- Gallan, A. Factors that influence physicians’ prescribing of pharmaceuticals: A literature review. J. Pharm. Market. Manag. 2004, 16, 3–46. [Google Scholar] [CrossRef]
- Rashidian, A.; Miles, J.; Russell, D.; Russell, I. Sample size for regression analyses of theory of planned behaviour studies: Case of prescribing in general practice. Brit. J. Health Psychol. 2006, 11, 581–593. [Google Scholar] [CrossRef] [PubMed]
- Raisch, D.W. A model of methods for influencing prescribing: Part II. A review of educational methods, theories of human inference and delineation of a model. DICP 1990, 24, 537–542. [Google Scholar] [CrossRef] [PubMed]
- Hemminki, E. Review of literature on the d factors affecting drug prescribing. Soc. Sci. Med. 1975, 9, 111–116. [Google Scholar] [CrossRef]
- Ajzen, I. The theory of planned behaviour. Organ. Behav. Hum. Decis. Process. 1991, 50, 179–211. [Google Scholar] [CrossRef]
- Lee, H.J.; Yun, Z.S. Consumers’ perceptions of organic food attributes and cognitive and affective attitudes as determinants of their purchase intentions toward organic food? Food Qual. Prefer. 2015, 39, 259–267. [Google Scholar] [CrossRef]
- Conner, M.; Armitage, C.J. Extending the theory of planned behavior: A review and avenues for further research. J. Appl. Soc. Psychol. 1998, 28, 1429–1464. [Google Scholar] [CrossRef]
- Ahmed, R.R.; Hussain, S.; Pahi, M.H.; Usas, A.; Jasinskas, E. Social Media Handling and Extended Technology Acceptance Model (ETAM): Evidence from SEM-based Multivariate Approach. Transform. Bus. Econ. 2019, 18, 246–272. [Google Scholar]
- Prosser, H.; Almond, S.; Walley, T. Influences on GPs’ decision to prescribe new drugs—The importance of who says what. Family Pract. 2003, 20, 61–68. [Google Scholar] [CrossRef]
- Schommer, J.C.; Hansen, R.A. The study of direct-to-consumer advertising for prescription drugs. Res. Soc. Admin. Pharm. 2005, 1, 348–368. [Google Scholar] [CrossRef]
- Reyna, V.F.; Rivers, S.E. Current theories of risk and rational decision-making. Dev. Rev. 2008, 8, 1–11. [Google Scholar] [CrossRef]
- Janakiraman, R.; Dutta, S.; Sismeiro, C.; Stern, P. Physicians’ persistence and its implications for their response to promotion of prescription drugs. Manag. Sci. 2008, 54, 1080–1093. [Google Scholar] [CrossRef]
- Chen, C.; Dong, W.; Shen, J.J.; Cochran, C.; Wang, Y. Is the prescribing behavior of Chinese physicians driven by financial incentives? Soc. Sci. Med. 2014, 120, 40–48. [Google Scholar] [CrossRef] [PubMed]
- Adorka, M.; Dikokole, M.; Mitonga, K.H.; Allen, K. Healthcare providers’ attitudes and perceptions in infection diagnosis and antibiotic prescribing in public health institutions in Lesotho: A cross sectional survey? Afr. Health Sci. 2013, 13, 344–350. [Google Scholar] [CrossRef]
- Gokcekus, L.; Toklu, H.Z.; Demirdamar, R.; Gumusel, B. Dispensing practice in the community pharmacies in the Turkish Republic of Northern Cyprus. Int. J. Clin. Pharm. 2012, 34, 312–324. [Google Scholar] [CrossRef] [PubMed]
- Tan, E.C.; Stewart, K.; Elliott, R.; George, J. Pharmacist consultations in general practice clinics: The Pharmacists in Practice Study (PIPS). Res. Soc. Admin. Pharm. 2014, 10, 623–632. [Google Scholar] [CrossRef]
- Kotwani, A.; Wattal, C.; Katewa, S.; Joshi, P.C.; Holloway, K. Factors influencing primary care physicians to prescribe antibiotics in Delhi India. Family Pract. 2010, 27, 684–690. [Google Scholar] [CrossRef]
- Knight, A. Patient-centred prescribing. Austr. Prescrib. 2013, 6, 199–201. [Google Scholar] [CrossRef]
- Kyle, G.J.; Nissen, L.M.; Tett, S.E. Pharmaceutical company influences on medication prescribing and their potential impact on quality use of medicines. J. Clin. Pharm. Therap. 2008, 33, 553–559. [Google Scholar] [CrossRef]
- Stros, M.; Lee, N. Marketing dimensions in the prescription pharmaceutical industry: A systematic literature review. J. Strat. Market. 2015, 23, 318–336. [Google Scholar] [CrossRef]
- Singh, R. Network connectedness of pharmaceutical sales rep (FLE)-physician dyad and physician prescription behaviour: A conceptual model. J. Med. Market. 2008, 8, 257–268. [Google Scholar] [CrossRef]
- Knapp, D.E.; Oeltjen, P.D. Benefits-to-risk ratio in physicians use when prescribing. Am. J. Public Health 1972, 62, 1346–1347. [Google Scholar] [CrossRef] [PubMed]
- Murshid, M.A.; Mohaidin, Z. Models and theories of prescribing decisions: A review and suggested a new model. Pharm. Pract. 2017, 15, 990. [Google Scholar] [CrossRef] [PubMed]
- Groves, K. The influence of pharmaceutical marketing activity, practice characteristics and physician profile on physician prescribing behavior. Ph.D. Dissertation, Dalhousie University, Halifax, NS, Canada, 2006. [Google Scholar]
- Hartzema, A.; Christensen, D. Nonmedical Factors Associated with Prescribing Volume among Family Practitioners in an HMO. Med. Care 1983, 21, 990–1000. [Google Scholar] [CrossRef] [PubMed]
- Armstrong, D.; Reyburn, H.; Jones, R. A Study of General Practitioners Reasons for Changing Their Prescribing Behavior. BMJ 1996, 312, 949–952. [Google Scholar] [CrossRef]
- Kareem, A.W.; Jaleel, M.; Laeequddin, M. Prescription Loyalty Behaviour of Physicians: An Empirical Study in India. Int. J. Pharm. Healthcare Market. 2007, 5, 279–298. [Google Scholar]
- Rahmner, P.B.; Gustafsson, L.; Larsson, J.; Rosenqvist, U.; Tomson, G.; Holmstrom, I. Variations in Understanding the Drug Prescribing Process: A Qualitative Study among Swedish GP’s. Family Pract. 2008, 26, 121–127. [Google Scholar] [CrossRef]
- Taneja, G. Impact of Pharmaceutical Industry Promotion Mix on Doctors Prescribing Behaviour. Asia Pac. Bus. Rev. 2008, 4, 13–18. [Google Scholar]
- Tan, N.C.; Tay, I.H.; Ngoh, A.; Tan, M. Factors Influencing Family Physicians’ Drug Prescribing Behavior in Asthma Management in Primary Care. Singapore Med. J. 2009, 50, 312–319. [Google Scholar]
- Karayanni, D.A. Cluster Analysis of Physicians Values, Prescribing Behavior and Attitudes towards Firm Marketing Communications. Int. J. Customer Relat. Market. Manag. 2010, 3–26. [Google Scholar] [CrossRef]
- Neyaz, Y.; Qureshi, N.A.; Khoja, T.; Magzoub, M.A.; Haycox, A.; Walley, T. Physicians’ Medication Prescribing in Primary Care in Riyadh City, Saudi Arabia, Literature Review, Part 1: Variations In Drug Prescribing. East. Medit. Health J. 2011, 17, 126–131. [Google Scholar] [CrossRef]
- Mohanty, B.K.; Aswini, M.; Hasamnis, A.A.; Patil, S.S.; Murty, K.S.K.; Jena, S.K. Prescription Pattern In The Department Of Medicine Of A Tertiary Care Hospital In South India. J. Clin. Diagn. Res. 2010, 3, 2047–2051. [Google Scholar]
- Wazana, A. Doctors and the Pharmaceutical Industry Is A Gift Ever Just A Gift? J. Am. Med. Assoc. 2000, 283, 373–380. [Google Scholar] [CrossRef] [PubMed]
- Prosser, H.; Walley, T. Understanding Why GP’s See Pharmaceutical Representatives: A Qualitative Interview Study. Brit. J. Gen. Pract. 2003, 53, 305–311. [Google Scholar]
- Caudill, T.S.; Johnson, M.S.; Rich, E.C.; McKinney, W.P. Physicians, Pharmaceutical Sales Representatives, and the Cost of Prescribing. Arch. Family Med. 1996, 5, 201–206. [Google Scholar] [CrossRef] [PubMed]
- Lieb, K.; Brandtönies, S. A Survey of German Physicians in Private Practice about Contacts with Pharmaceutical Sales Representatives. Deutsch. Ärzteblatt Int. 2004, 107, 392–398. [Google Scholar] [CrossRef] [PubMed]
- Chimonas, S.; Brennan, T.A.; Rothman, D.J. Physicians and Drug Representatives: Exploring the Dynamics of The Relationship. Soc. Gen. Inter. Med. 2007, 22, 184–190. [Google Scholar] [CrossRef]
- Saito, S.; Mukohara, K.; Bito, S. Japanese Practicing Physicians’ Relationships with Pharmaceutical Representatives: A National Survey. PLoS ONE 2010, 5. [Google Scholar] [CrossRef]
- Watkins, C.; Moore, L.; Harvey, I.; Carthy, P.; Robinson, E.; Brawn, R. Attitudes and Behavior of General Practitioners and Their Prescribing Costs: A National Cross Sectional Survey. Qual. Saf. Health Care 2003, 12, 29–34. [Google Scholar] [CrossRef]
- Stros, M.; Hari, J.; Marriott, J. The Relevance of Marketing Activities in The Swiss Prescribing Drugs Market: Two Empirical Studies. Int. J. Pharm. Healthcare Market. 2009, 3, 323–346. [Google Scholar] [CrossRef]
- Jayakumar, P.B. Drug Firms May Stop Freebies to Doctors. Bus. Standard Newsp. 2013, 4. Available online: https://www.business-standard.com/article/companies/drug-firms-may-stop-freebies-to-doctors-108072301019_1.html (accessed on 15 July 2019).
- Shapiro, S.P. Agency theory. Annu. Rev. Sociol. 2005, 31, 263–284. [Google Scholar] [CrossRef]
- Jensen, M.C.; Meckling, W.H. Theory of the firm: Managerial behavior, agency costs and ownership structure. J. Financ. Econ. 1976, 3, 305–360. [Google Scholar] [CrossRef]
- Eisenhardt, M. Agency theory: And assessment review. Acad. Manag. Rev. 1989, 14, 57–74. [Google Scholar] [CrossRef]
- Mott, D.A.; Schommer, J.C.; Doucette, W.R.; Kreling, D.H. Agency theory, drug formularies, and drug product selection: Implications for public policy. J. Public Policy Market. 1998, 17, 287–295. [Google Scholar] [CrossRef]
- Epstein, A.J.; Ketcham, J.D. Information technology and agency in physicians’ prescribing decisions. RAND J. Econ. 2014, 45, 422–448. [Google Scholar] [CrossRef]
- O’keefe, D.J. Persuasion: Theory and Research; SAGE: Thousand Oaks, CA, USA, 2002. [Google Scholar]
- Bettinghaus, E.P. Persuasive Communication; Holt, Rinehart and Winston: New York, NY, USA, 1980. [Google Scholar]
- Storey, R. The Art of Persuasive Communication; Cambridge University Press: Cambridge, UK, 1997. [Google Scholar]
- Petty, R.; Cacioppo, J. The elaboration likelihood model of persuasion. Adv. Exp. Soc. Psychol. 1986, 19, 1–24. [Google Scholar]
- Xing, J.L.; Othman, M.H. Rational decision making models might suggest what people ought to do, they are a poor guide to what people actually do. Int. J. Biol. Macromol. 2015, 1, 1–5. [Google Scholar]
- Kotler, P. Marketing Management, 11th ed.; Pearson Education International—Prentice Hall marketing: London, UK, 2002. [Google Scholar]
- Kotler, P. According to Kotler: The World’s Foremost Authority on Marketing Answers your Questions; AMACOM: New York, NY, USA, 2005. [Google Scholar]
- Eccles, M.; Grimshaw, J.; Shekelle, P.; Schunemann, H.; Woolf, S. Developing clinical practice guidelines: Target audiences, identifying topics for guidelines, guideline group composition and functioning and conflicts of interest. Implement. Sci. 2012, 7, 60. [Google Scholar] [CrossRef] [PubMed]
- Perkins, M.B.; Jensen, P.S.; Jaccard, J.; Gollwitzer, P.; Oettingen, G.; Pappadopulos, E.; Hoagwood, K.E. Applying theory-driven approaches to understanding and modifying clinicians’ behavior: What do we know? Psychiat. Serv. 2007, 58, 342–348. [Google Scholar] [CrossRef]
- Kramer, L.; Hirsch, O.; Becker, A.; Donner-Banzhoff, N. Development and validation of a generic questionnaire for the implementation of complex medical interventions. German Med. Sci. 2014, 12, Doc08. [Google Scholar] [CrossRef]
- Basak, R.; Bentley, J.P.; Mccaffrey, D.J.; Bouldin, A.S.; Banahan, B.F. The role of perceived impact on relationship quality in pharmacists’ willingness to influence indication-based off-label prescribing decisions. Soc. Sci. Med. 2015, 132, 181–189. [Google Scholar] [CrossRef]
- Busch, P.; Wilson, D. An experimental analysis of a salesman’s expert and referent bases of social power in the buyer-seller dyad. J. Market. Res. 1976, 13, 3–11. [Google Scholar] [CrossRef]
- French, J.R.P.; Raven, B. The bases of social power. In Studies in Social Power; Cartwright, D., Ed.; University of Michigan Press: Ann Arbor, MI, USA, 1959. [Google Scholar]
- Rigby, D. Collaboration between doctors and pharmacists in the community. Austr. Prescr. 2010, 23, 191–193. [Google Scholar] [CrossRef]
- MacCallum, R.C.; Widaman, K.; Zhang, S.; Hong, S. Sample size in Factor Analysis. Psychol. Methods 1999, 4, 84–99. [Google Scholar] [CrossRef]
- Anderson, J.C.; Gerbing, D.W. Structural equation modeling in practice: A review and recommended two-step approach. Psychol. Bull. 1988, 103, 411–423. [Google Scholar] [CrossRef]
- Huang, J.H.; Lee, B.C.Y.; Ho, S.H. Consumer attitude toward grey market goods. Int. Market. Rev. 2004, 21, 598–614. [Google Scholar] [CrossRef]
- Ahmed, R.R.; Vveinhardt, J.; Štreimikienė, D.; Ashraf, M.; Channar, Z.A. Modified SERVQUAL Model and Effects of Customer Attitude and Technology on Customer Satisfaction in Banking Industry: Mediation, Moderation and Conditional Process Analysis. J. Bus. Econ. Manag. 2017, 18, 974–1004. [Google Scholar] [CrossRef]
- Byrne, B.M. Structural Equation Modelling with AMOS, Basic Concepts, Application and Programming, 2nd ed.; La Erlbaum Associates: Trenton, NJ, USA, 2009. [Google Scholar]
- Fornell, C.; Larcker, D.F. Evaluating structural equation models with unobservable variables and measurement error. J. Market. Res. 1981, 18, 39–50. [Google Scholar] [CrossRef]
- Emory, C.W.; Cooper, D.R. Business Research Methods, 4th ed.; Irwin: Boston, MA, USA, 1991. [Google Scholar]
- Hair, J.F.; Black, W.C.; Babin, B.J.; Anderson, R.E. Multivariate Data Analysis, 7th ed.; Prentice Hall: Upper Saddle River, NJ, USA, 2010. [Google Scholar]
- Kaiser, H.F. An index of factorial simplicity. Psychometrika 1974, 39, 31–36. [Google Scholar] [CrossRef]
- Bentler, P.M. EQS Structural Equations Program Manual; BMDP Statistical software: Los Angeles, CA, USA, 1989. [Google Scholar]
- Hayes, A.F. Introduction to Mediation, Moderation, and Conditional Process Analysis: A Regression-Based Approach; Guilford Press: New York, NY, USA, 2013. [Google Scholar]


© 2020 by the authors. Licensee MDPI, Basel, Switzerland. This article is an open access article distributed under the terms and conditions of the Creative Commons Attribution (CC BY) license (http://creativecommons.org/licenses/by/4.0/).