Article

Low-Copy Genes in Terpenoid Metabolism: The Evolution and Expression of MVK and DXR Genes in Angiosperms

by
Natacha Silva
1,†,
Suzana Tiemi Ivamoto-Suzuki
1,†,
Paula Oliveira Camargo
1,
Raíssa Scalzoni Rosa
1,
Luiz Filipe Protasio Pereira
2 and
Douglas Silva Domingues
1,*
1
Departamento de Biodiversidade, Instituto de Biociências, Universidade Estadual Paulista, UNESP, 13506-900 Rio Claro-SP, Brazil
2
Laboratório de Biotecnologia Vegetal, Empresa Brasileira de Pesquisa Agropecuária (Embrapa-Café), 86047-902 Londrina-PR, Brazil
*
Author to whom correspondence should be addressed.
These authors contributed equally to this work.
Plants 2020, 9(4), 525; https://doi.org/10.3390/plants9040525
Submission received: 7 December 2019 / Revised: 10 April 2020 / Accepted: 15 April 2020 / Published: 19 April 2020
(This article belongs to the Section Plant Molecular Biology)

Abstract

:
Terpenoids are a diverse class of metabolites that impact plant metabolism in response to environmental cues. They are synthesized either via a predominantly cytosolic (MVA) pathway or a plastidic pathway (MEP). In Arabidopsis, several enzymes from the MVA and MEP pathways are encoded by gene families, excluding MVK and DXR, which are single-copy genes. In this study, we assess the diversity, evolution and expression of DXR and MVK genes in selected angiosperms and Coffea arabica in particular. Evolutionary analysis revealed that DXR and MVK underwent purifying selection, but the selection effect for DXR was stronger than it was for MVK. Digital gene expression (DGE) profile analysis of six species revealed that expression levels of MVK in flowers and roots were high, whereas for DXR peak values were observed in leaves. In C. arabica, both genes were highly expressed in flowers, and CaDXR was upregulated in response to methyl jasmonate. C. arabica DGE data were validated by assessing gene expression in selected organs, and by plants treated with hexanoic acid (Hx) using RT-qPCR. MVK expression was upregulated in roots treated with Hx. CaDXR was downregulated in leaves by Hx treatment in a genotype-specific manner, indicating a differential response to priming.

1. Introduction

Terpenoids are a large and diverse class of metabolites that include compounds essential for cellular functions and environment interactions [1]. They are the largest and most diverse class of metabolites, containing over 40,000 substances. The molecules are industrially relevant and are used as flavors, pigments, polymers and drugs [1,2].
Terpenoids are produced in all living organisms, but they are most abundant and possess a greater degree of diversity in the plant kingdom [1]. Their biological functions affect plant membrane structure (sterols), respiration (ubiquinone), photosynthesis (chlorophylls, carotenoids, prenylquinones) and the regulation of plant development (cytokines, brassinosteroids, gibberellins, abscisic acid, strigolactones) [3].
They are derived from two precursor molecules: isopentenyl diphosphate (IPP) and its isomer, dimethylalyl diphosphate (DMAPP) [4]. There are two pathways used to produce IPP and DMAPP in higher plants: the mevalonate pathway (MVA) and methylerythritol phosphate (MEP) pathways. The MVA pathway is predominantly in the cytosol but is also distributed between the endoplasmic reticulum and peroxisomes [5,6], and the MEP pathway is located in plastids [7]. The key rate-limiting enzymes of the MEP pathway and the MVA pathway are, respectively, the extensively studied 1-deoxy-D-xylulose-5-phosphate synthase (DXS) and hydroxymethylglutaryl-CoA reductase (HMGR) [7,8,9,10]. However, there are enzymes in the MVA and MEP pathways that are still poorly addressed.
The mevalonate kinase (MVK) gene encodes one important biosynthetic enzyme in the MVA pathway [3]. It catalyzes the phosphorylation of mevalonate to produce 5-phosphate mevalonate [3]. MVK activity is involved in plant regeneration and growth, and it is also related to the frequency of shoot and root formation in white pine (reviewed in [7]).
1-deoxy-d-xylulose 5-phosphate reductoisomerase (DXR) is also an important enzyme involved in terpenoid biosynthesis via the MEP plastid pathway, and is responsible for catalyzing the second step of terpenoid biosynthesis in the chloroplast [1]. Inactivation of the 1-deoxy-D-xylulose-5-phosphate reductoisomerase (DXR) gene results in strong developmental arrest and albino plants in Arabidopsis [11].
Only plants are capable of simultaneously synthesizing terpenoids via MEP and MVA pathways in parallel, suggesting that genes involved in terpenoid biosynthesis in plants have adapted evolutionarily in basal to terrestrial plant lineages [12,13]. In this sense, it is important to understand the evolutionary relationships and duplication events that have occurred within these gene families [3]. Gene duplication, mutation and natural selection are essential processes that expand plant genetic diversity and facilitate biological adaptation [14,15]. Phylogenetic studies can provide important information needed to enhance our knowledge regarding the mechanism by which MVK and DXR genes influence terpenoid biosynthesis in higher plants. These genes are both single copy genes in the model plant Arabidopsis thaliana. Although previous studies report the phylogenetic analyses of MVK and DXR [16,17,18], these studies were focused in species-specific gene characterization and did not seek to further investigate the evolutionary aspects of MVK and DXR in plants.
The Coffea genus (Rubiaceae) is comprised of 124 species [19]. Coffea arabica and C. canephora are of the species of greatest economic importance and have garnered worldwide interest [20]. Few molecular studies have addressed the terpenoid biosynthesis pathways in coffee plants. Previously, researchers investigated the roles of the 3-hydroxy-3-methylglutaryl-CoA reductase (HMGR) gene, which is responsible for the third step of the MVA pathway, and their respective expression profiles in several organs [21]. Another study validated the function of three C. arabica monoterpene synthases (limonene, linalool and β-myrcene synthases), and studied the evolution of the genes, which affect the composition of coffee aroma [22]. Thus far, there have been no studies addressing the molecular responses of hub genes of these pathways.
Resistance inducers are known to modulate the expression pattern of genes involved in terpenoid synthesis [23]. Hexanoic acid (Hx) is a short, naturally occurring monocarboxylic acid that induces resistance to pathogens in several plant systems [24]. In Citrus plants, Hx has been shown to induce genes involved in the MVA pathway [25]. This prompted us to hypothesize that terpenoid pathway genes can be modulated by the application of Hx in coffee plants.
The main goal of this study was to enhance our understanding of the evolution of both DXR and MVK genes in angiosperm species, and to characterize the transcriptional profiles of these genes in C. arabica plants. Our results provide important knowledge regarding the evolutionary dynamics of the DXR and MVK gene families, and evaluate differences in expression via assessment of gene transcription. In addition, these genes can be further analyzed to verify whether they are involved in plant defense mechanisms aimed at enhancing the biosynthesis of terpenoids.

2. Results

2.1. Copy Number of MVK and DXR Genes in Plants

We used a diverse array of angiosperm species to perform genome-wide analysis of MVK and DXR genes and three species as outgroups: one basal angiosperm, one basal Viridiplantae and one Chlorophyta (Figure 1). Thirty-one MVK and 31 DXR sequences were identified in 24 species. We identified 22 MVK and 21 DXR genes in 16 eudicotyledonous species, while in monocotyledons we identified 7 MVK and 6 DXR sequences in five species. In the three outgroup species assessed, we identified 2 MVK and 4 DXR genes, except in the unicellular green algae, Chlamydomonas reinhardtii, which does not have a gene encoding MVK (Table 1). Chenopodium quinoa, Glycine max, Gossypium raimondii, Marchantia polymorpha, Populus trichocarpa, Ricinus communis, Musa acuminata and Setaria italica had between two and three genes encoding MVK and DXR (Table 1). As expected, predictions of the subcellular localization of MVK and DXR proteins for all 24 species revealed that MVK is likely located in the cytosol and DXR is likely located in chloroplasts.

2.2. Phylogenetic Analyses

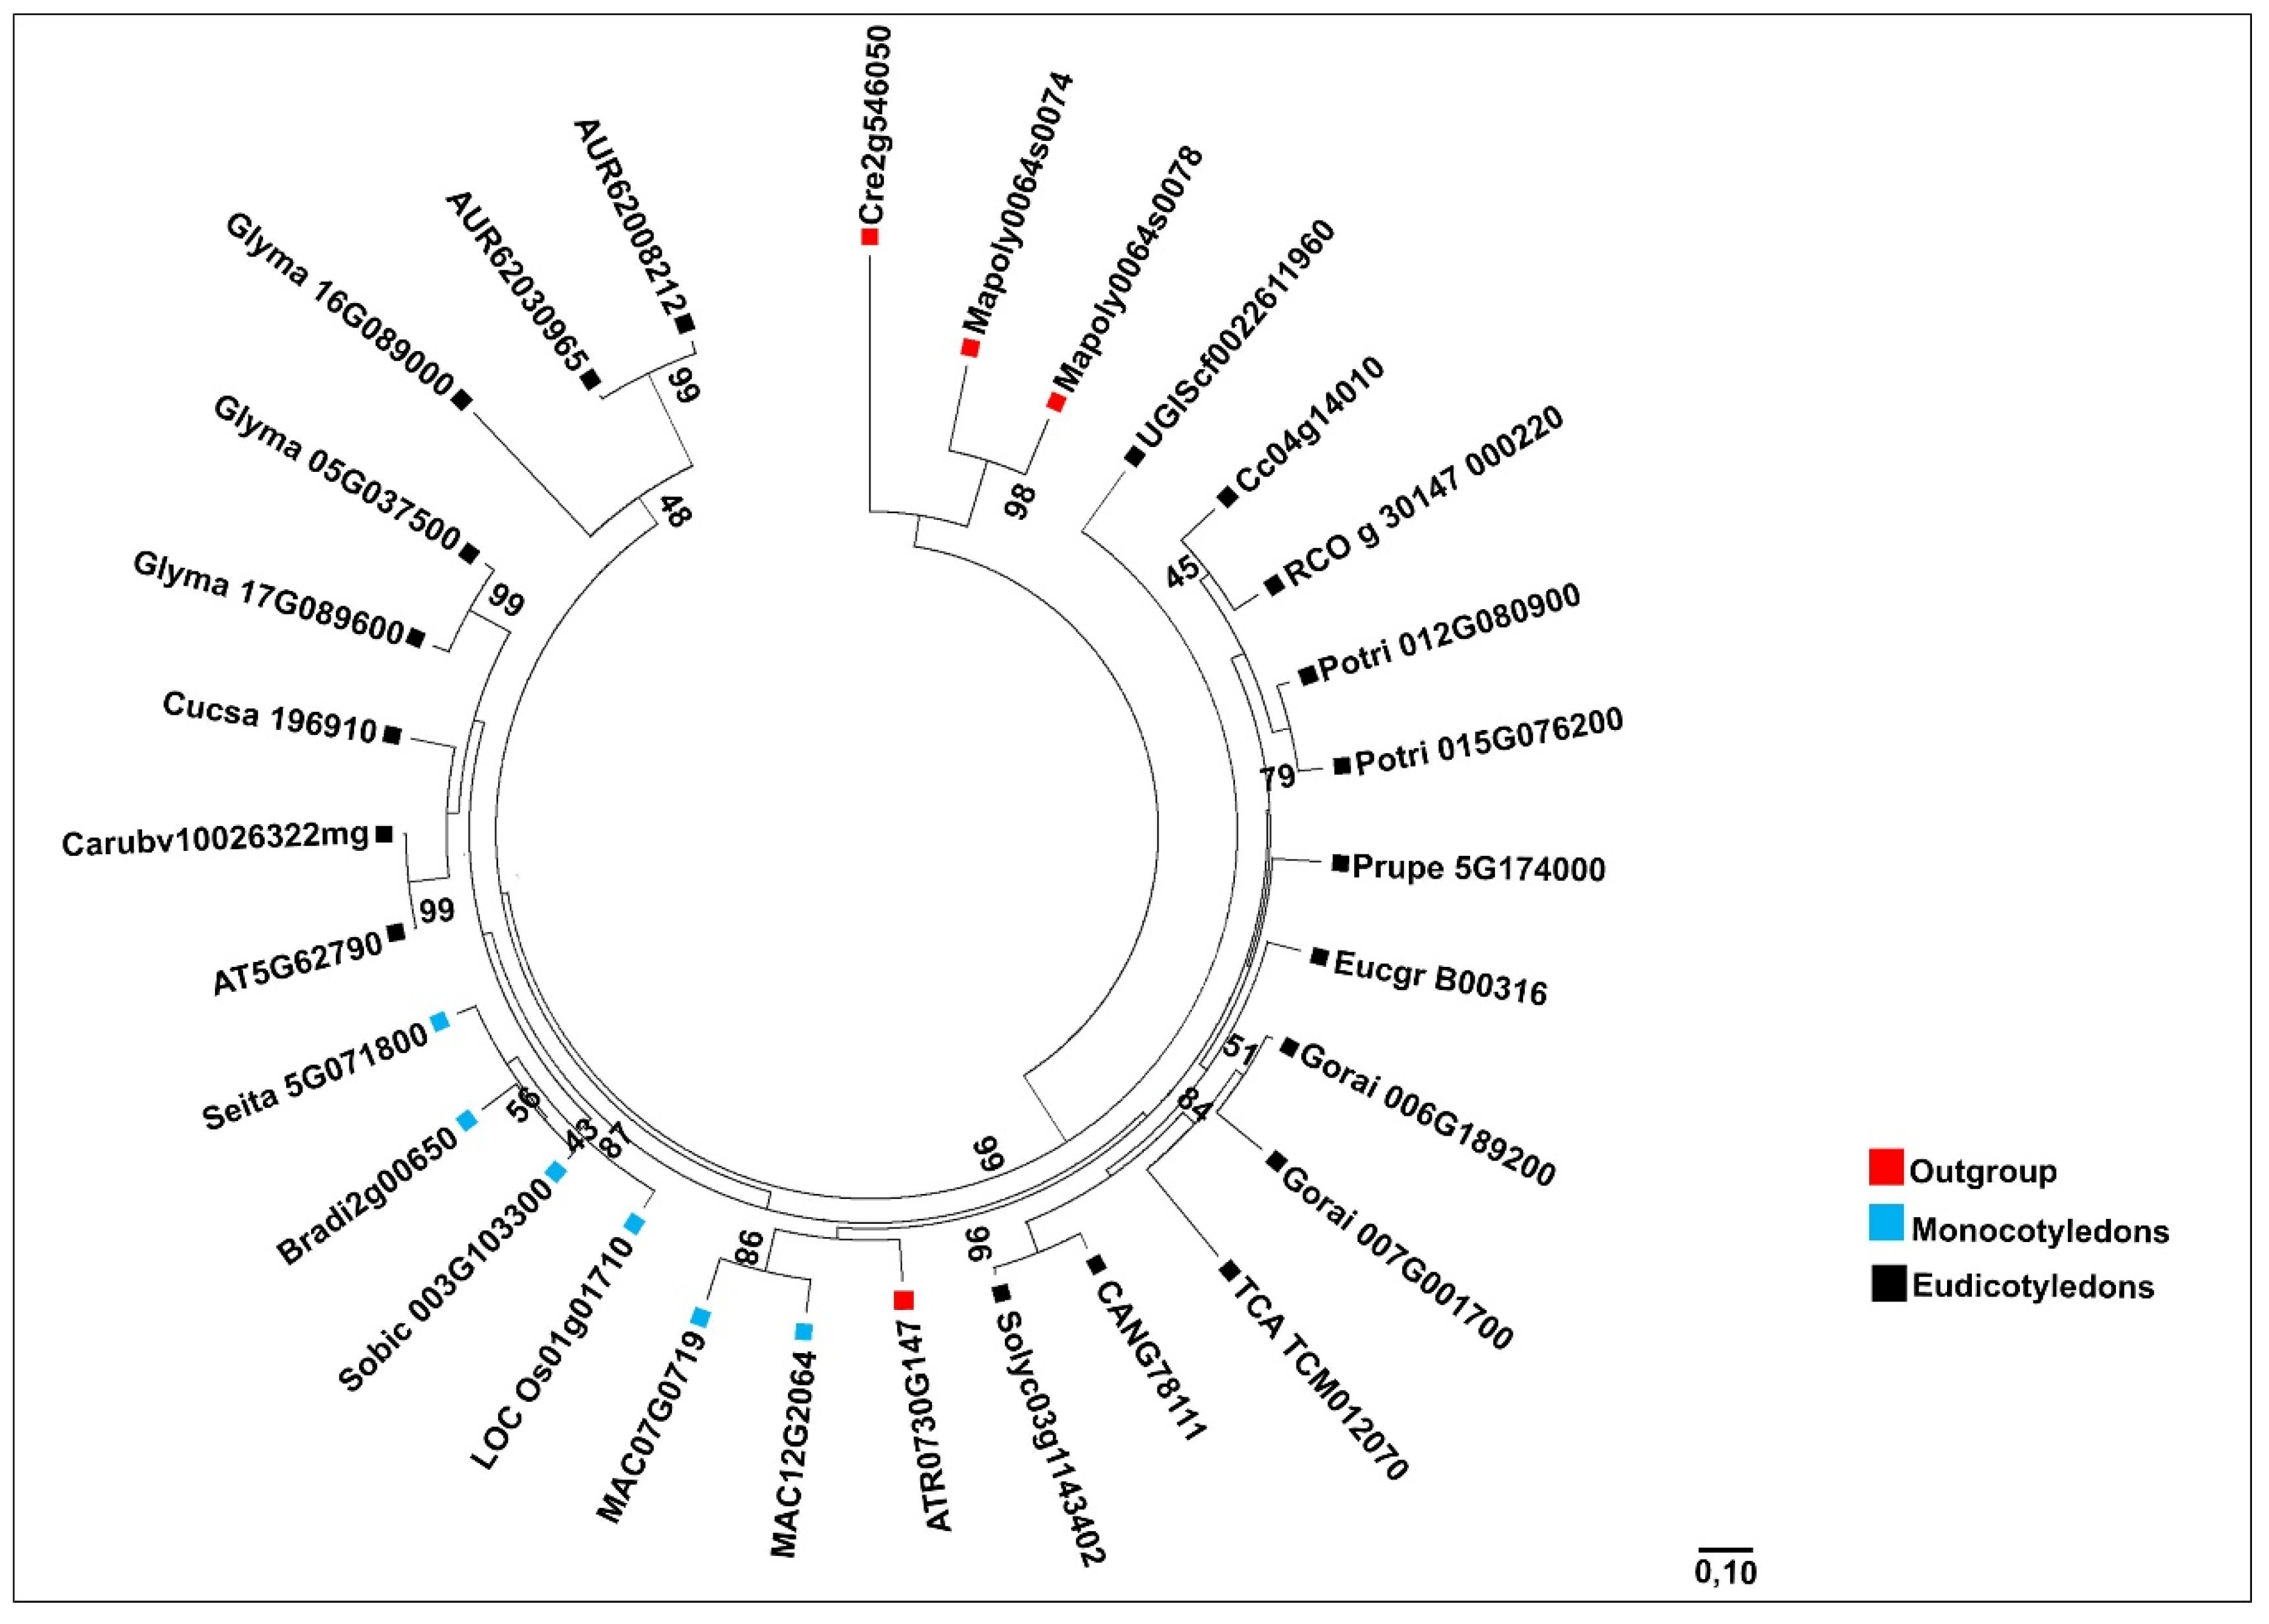
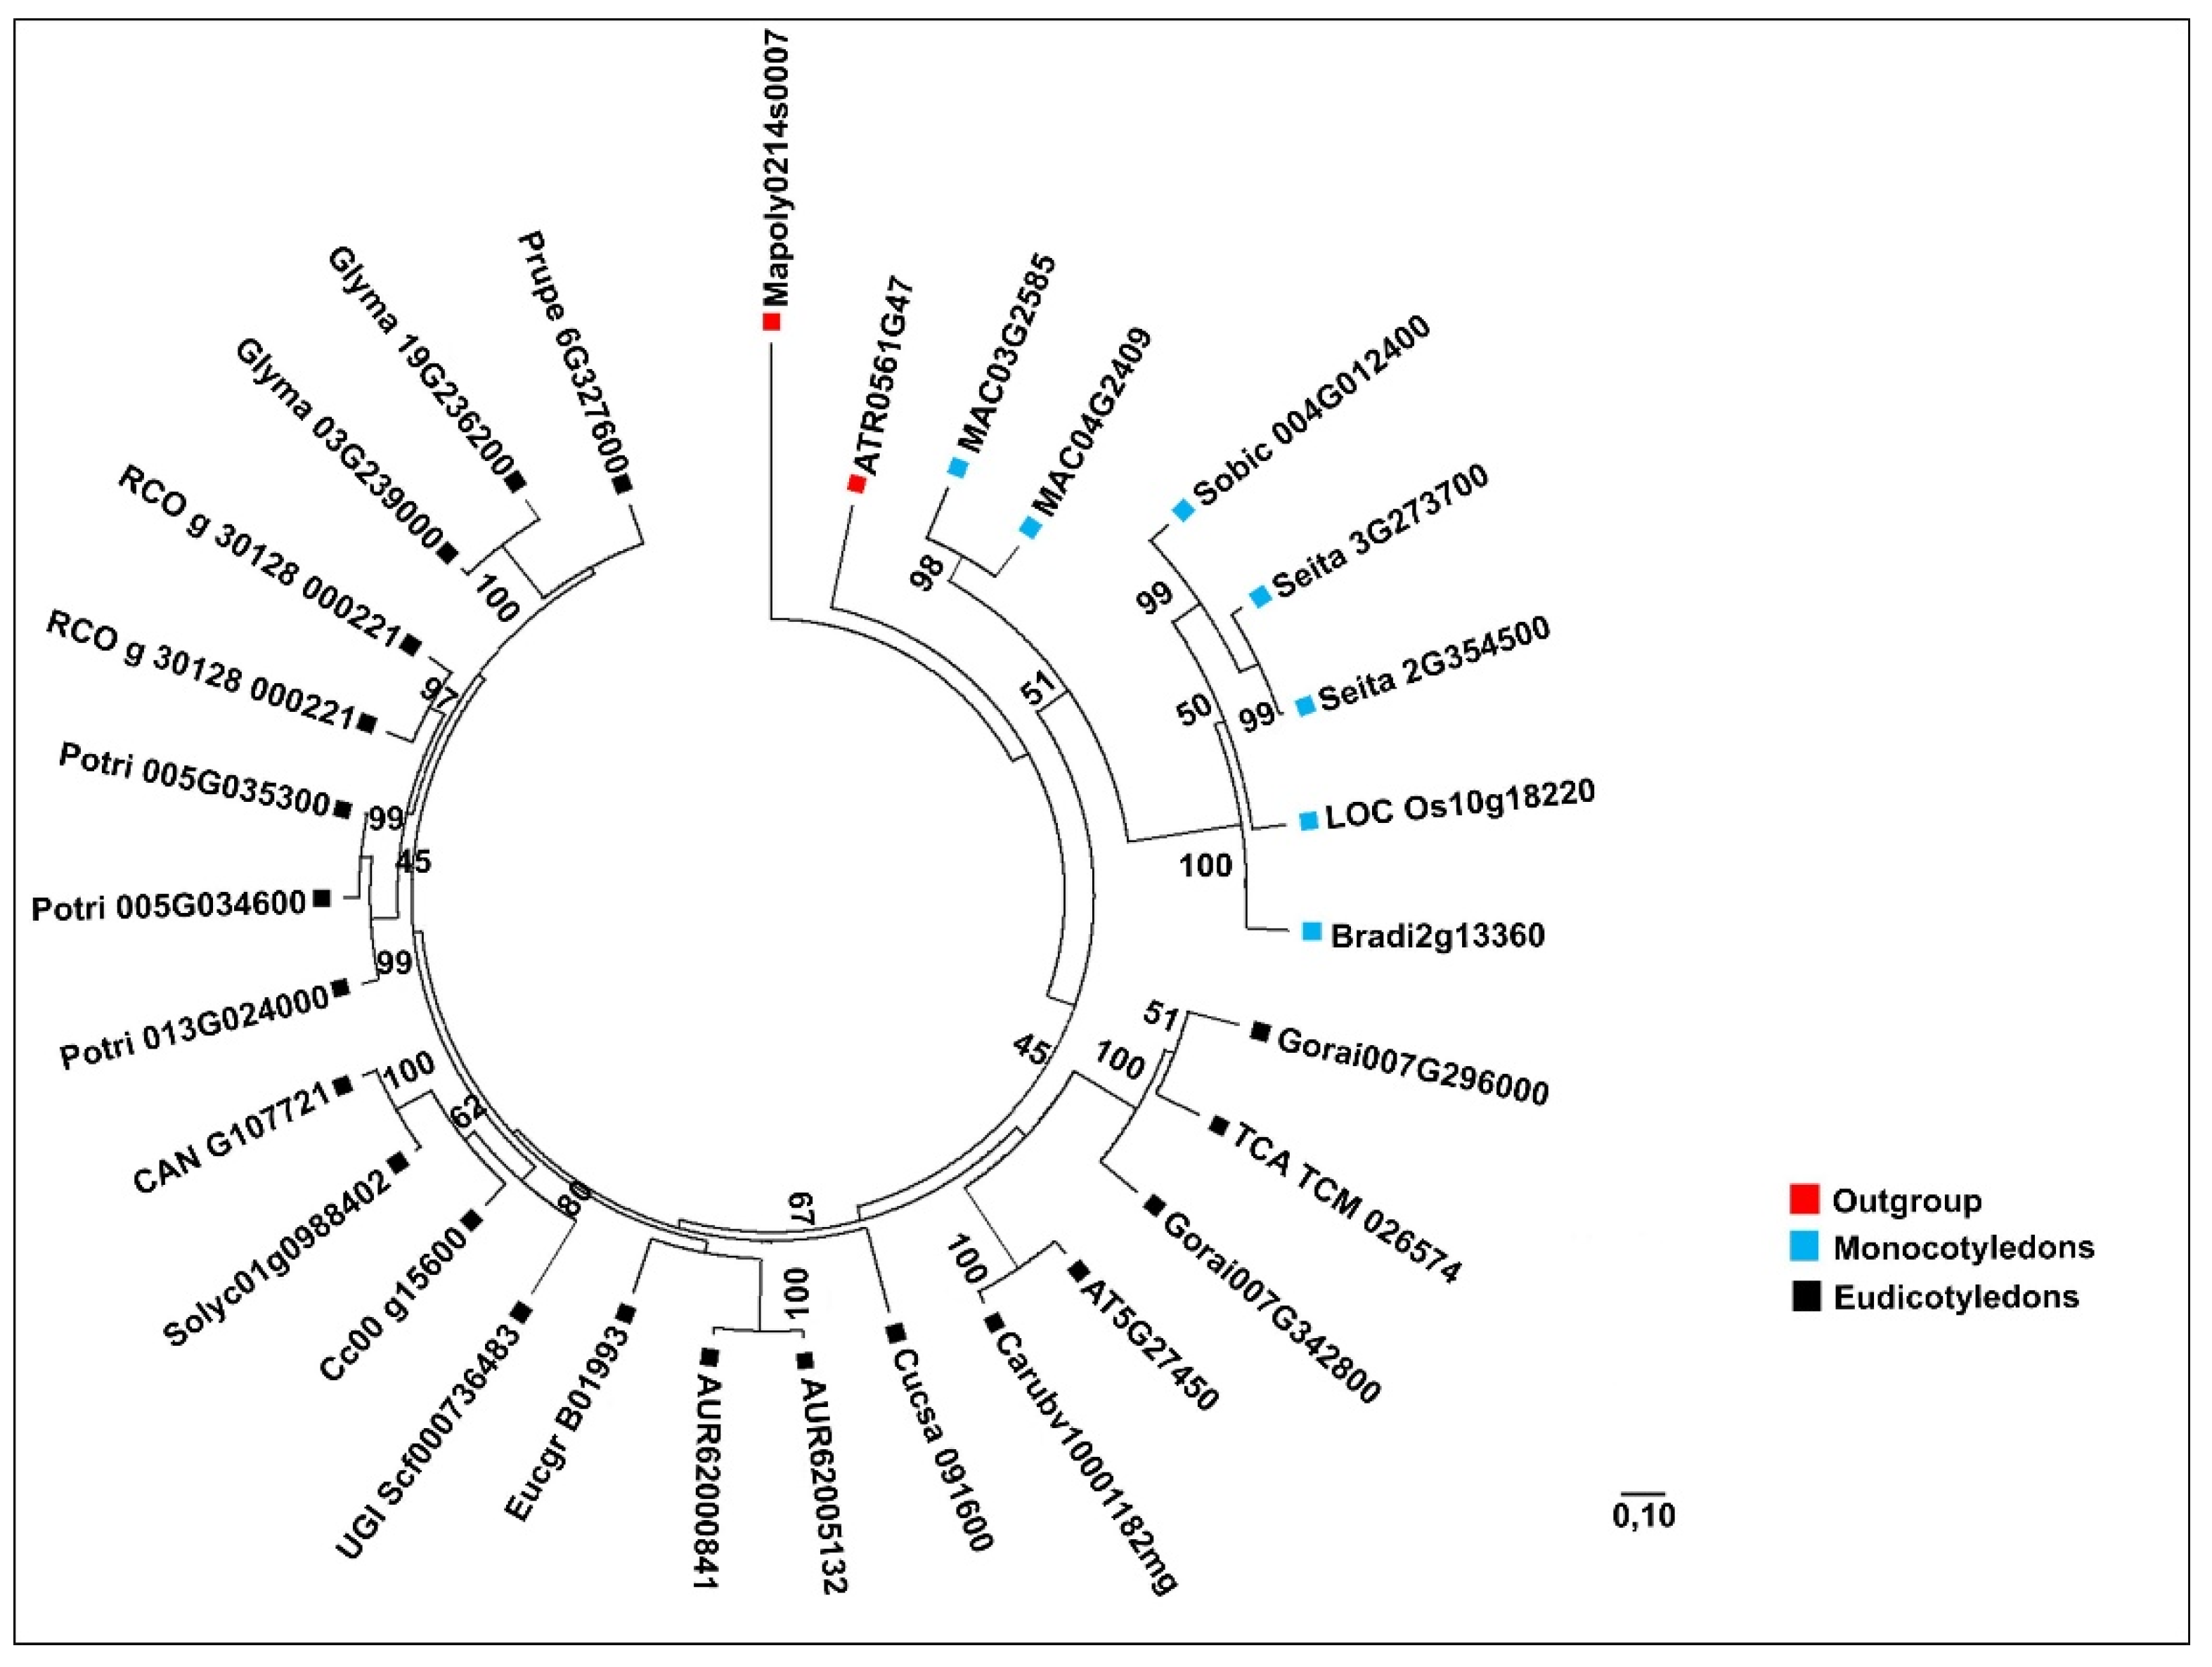
We focused our phylogenetic analysis on plant species whose complete genomes were available within the PLAZA 4.0 database (Figure 2 and Figure 3). The MVK gene family was divided into three groups (Figure 2). The first group was composed of outgroup species (red). The second group (blue) contained monocotyledon species and the last group (black) contained eudicotyledon species (Figure 2). The phylogenetic tree of DXR revealed a more complex division than MVK (Figure 3). We observed one group containing the outgroup species C. reinhardtii and M. polymorpha (red), while the monocotyledon genes were grouped into one major group (blue) and dicotyledons were divided into two groups (black), one of which was near the outgroup species A. trichopoda. In C. arabica, MVK (comp31934) and DXR (comp33448) sequences were retrieved from a transcriptome set previously developed by our group [28]. In this case, we demonstrate that these sequences are closely related to C. canephora genes (Figure 4).

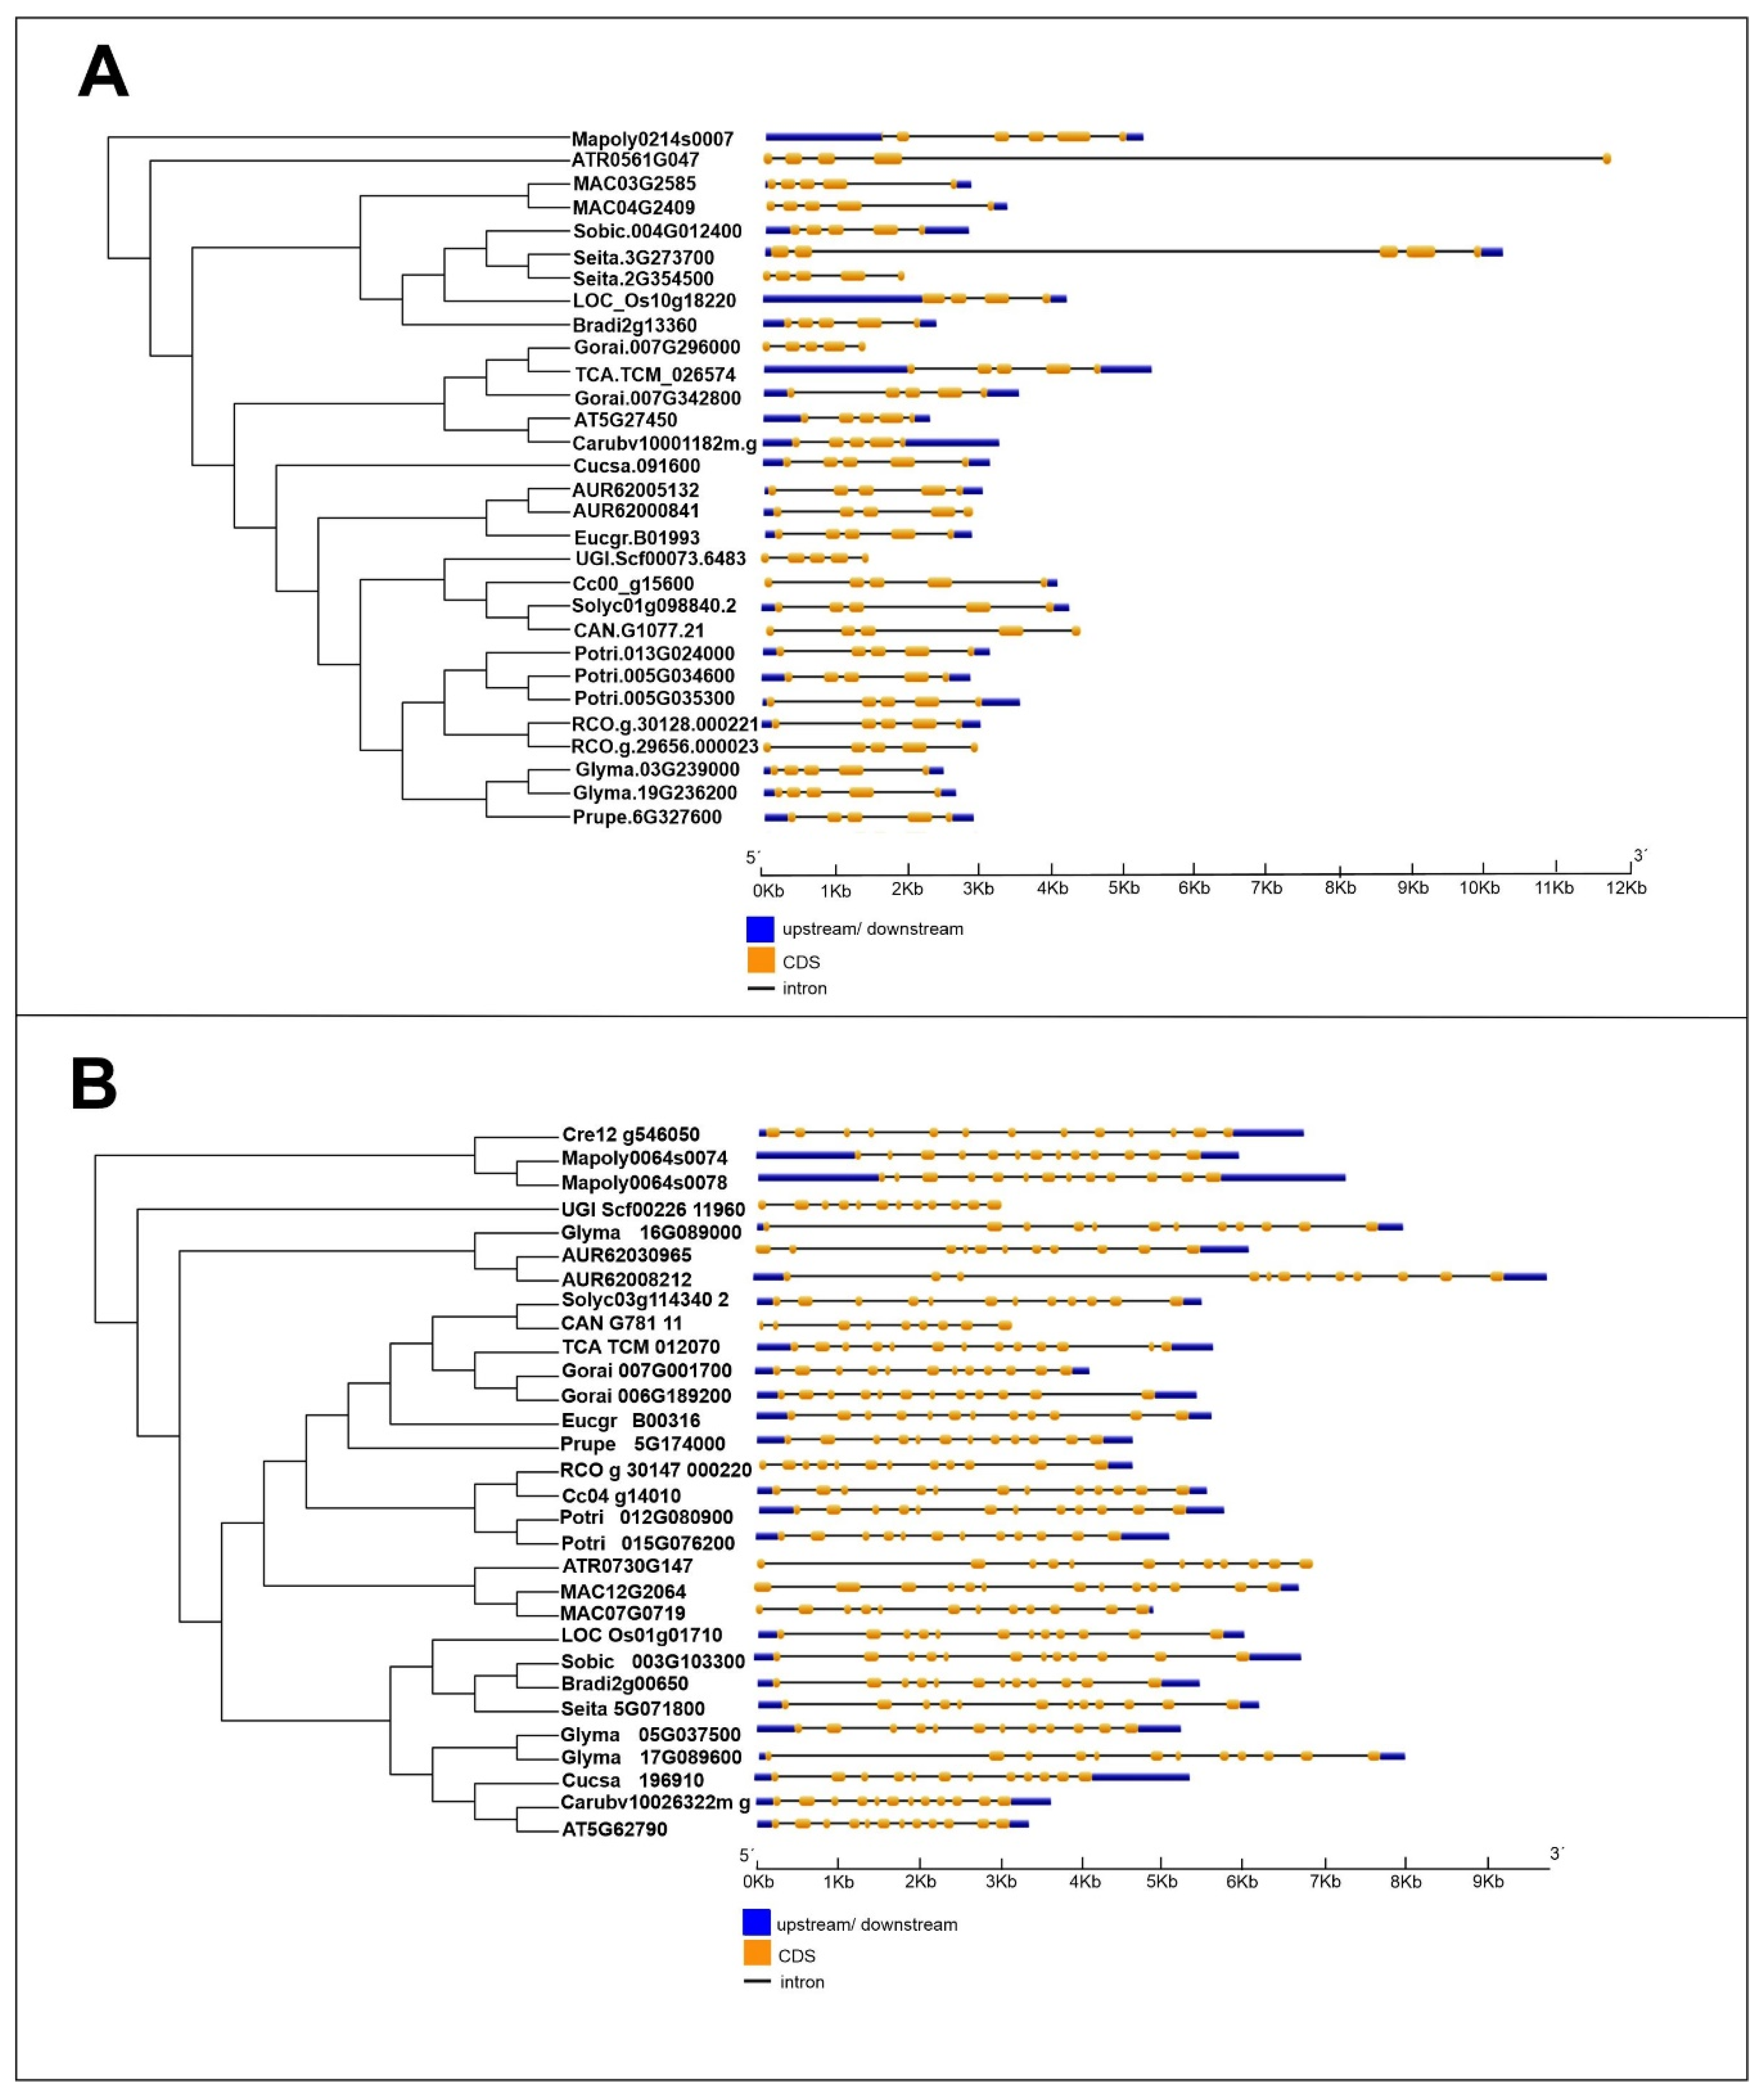
2.3. Exon–Intron Structure of MVK and DXR Genes

Exon–intron structures were analyzed to enhance our understanding of the structural diversity of the MVK and DXR genes of angiosperm species. To perform the analyses, publicly available genomic sequences from the PLAZA database (Figure 5A,B) were used. According to these analyses, the MVK gene from all species have five exons, except the LOC_Os10g18220 gene from O. sativa, which has four (Figure 5A). Further, most DXR genes have between 11 and 13 exons, but for the CAN.G1077.21 gene of C. annuum we observed only four exons (Figure 5B).
The shortest MVK and DXR full length gene occur in U. gibba (≅ 2Kb), while the longest ~12 kb MVK full length gene is from S. italica (Seita.3G273700) and the longest DXR full length gene (~10 kb) is in C. quinoa (AUR62008212) (Figure 5A,B).

2.4. Nucleotide Substitution and Selection in MVK and DXR Genes

To verify the possibility of distinct evolutionary pressures, we analyzed the individual selection profile of each amino acid, as well as the non-synonymous (dN) and synonymous (dS) substitutions in eudicotyledonous and monocotyledonous MVK and DXR genes. Our results showed that the dN/dS ratios of sequences among the MVK and DXR genes were distinct (Table 2). In addition, all estimated dN/dS values were substantially less than 1, suggesting that all MVK and DXR sequences within each group assessed are under strong purifying selection pressure. We observed lower dN/dS ratios in DXR than MVK (Table 2). Both genes had lower dN/dS ratios in eudicotyledons than in monocotyledons, except for DXR in model M5 (Table 2).
We found three positively selected sites in eudicots within the MVK gene using a Bayesian inference approach to calculate site-specific positive and purifying selection. We also evaluated the identification of sites of positive selection using three methods: SLAC (single likelihood ancestor counting), FEL (fixed-effects likelihood) and MEME (Mixed Effects Model of Evolution). FEL and SLAC software did not detect any positively selected codon sites. MEME analyses, however, did positively identify the selected sites (Table 3). In MVK, the MEME model detected three positively selected sites in eudicotyledons and four sites in monocotyledons. Site 42 was identified as a positively selected site in both angiosperm groups. With regard to the analysis of DXR using MEME, five positively selected sites in eudicotyledons and two in monocotyledons were identified.

2.5. Estimated Time of Duplication of MVK and DXR Genes

The duplication rates of the MVK and DXR genes were estimated for species with more than one gene copy (M. polymorpha, G. raimondii, P. trichocarpa, R. communis, M. acuminata, S. italica, C. quinoa and G. max). We used substitution data and inferred nucleotide substitution rates (Table 4 and Table 5). In order to clarify cases of tandem duplication, segmental duplication and whole-genome duplication, we also retrieved a synteny analysis from Plaza database 4.0 (Figure S1).
The MVK gene has been duplicated in seven angiosperm species (Table 4). Five species are eudicotyledons (C. quinoa, G. max, G. raimondii, P. trichocarpa and R. communis) and two species are monocotyledons (M. acuminata and S. italica). In MVK, the lowest dN/dS ratio and the most recent duplication event was identified in P. trichocarpa (Table 4), which corresponds to a tandem duplication (Figure S1) between two copies of MVK—Potri.005G034600 and Potri.005G035300—which occurred less than 1 million years ago (Figure S1 and Table 5). The oldest event was determined to occur in M. acuminata (Table 4). Among the species considered, only R. communis and S. italica had more than one copy of MVK and no recent genomic duplication events were identified [14], suggesting that a species-specific event generated these gene duplications. We identified that G. raimondii and P. trichocarpa that had undergone a recent whole-genome duplication also have duplicated MVK coding genes (Figure S1 and Table 4).
All species with duplicated MVK genes also have duplicated DXR, except for S. italica and R. comunnis. Thus, DXR duplication appears to be more genome duplication-dependent than MVK duplication. P. trichocarpha and G. max have an unusual profile of the genes in which each have three DXR genes and three MVK genes, respectively (Table 5).
The synteny analysis (Figure S1) corroborate that most observed duplications correspond to WGD with two cases of local gene duplication. It was not possible to calculate distance for DXR in M. polymorpha (Table 5).

2.6. Recombination Events of MVK and DXR Genes

We identified intragenic recombination events in MVK and DXR using Geneconv, RDP and MaxChi methods. Five MVK genes—in two eudicot species, two monocot species and one outgroup—experienced recombination events (Table 6). A total of eight DXR genes—in five eudicot species, two monocots and one outgroup—also had recombination events (Table 7). In the analysis of the MVK genes, Seita.3G273700 from S. italica had the highest number of recombinations (5). The lowest number (1) was observed in M. acuminta, in the gene MAC04G2409 (Table 7). For DXR, the highest number of recombinations (6) was observed in M. polymorpha, in the Mapoly0064s0074 gene, and the lowest number of recombination events (1) in T. cacao, in the TCA.TCM_01200 gene (Table 7).

2.7. RNA-seq-Based Expression Profiles

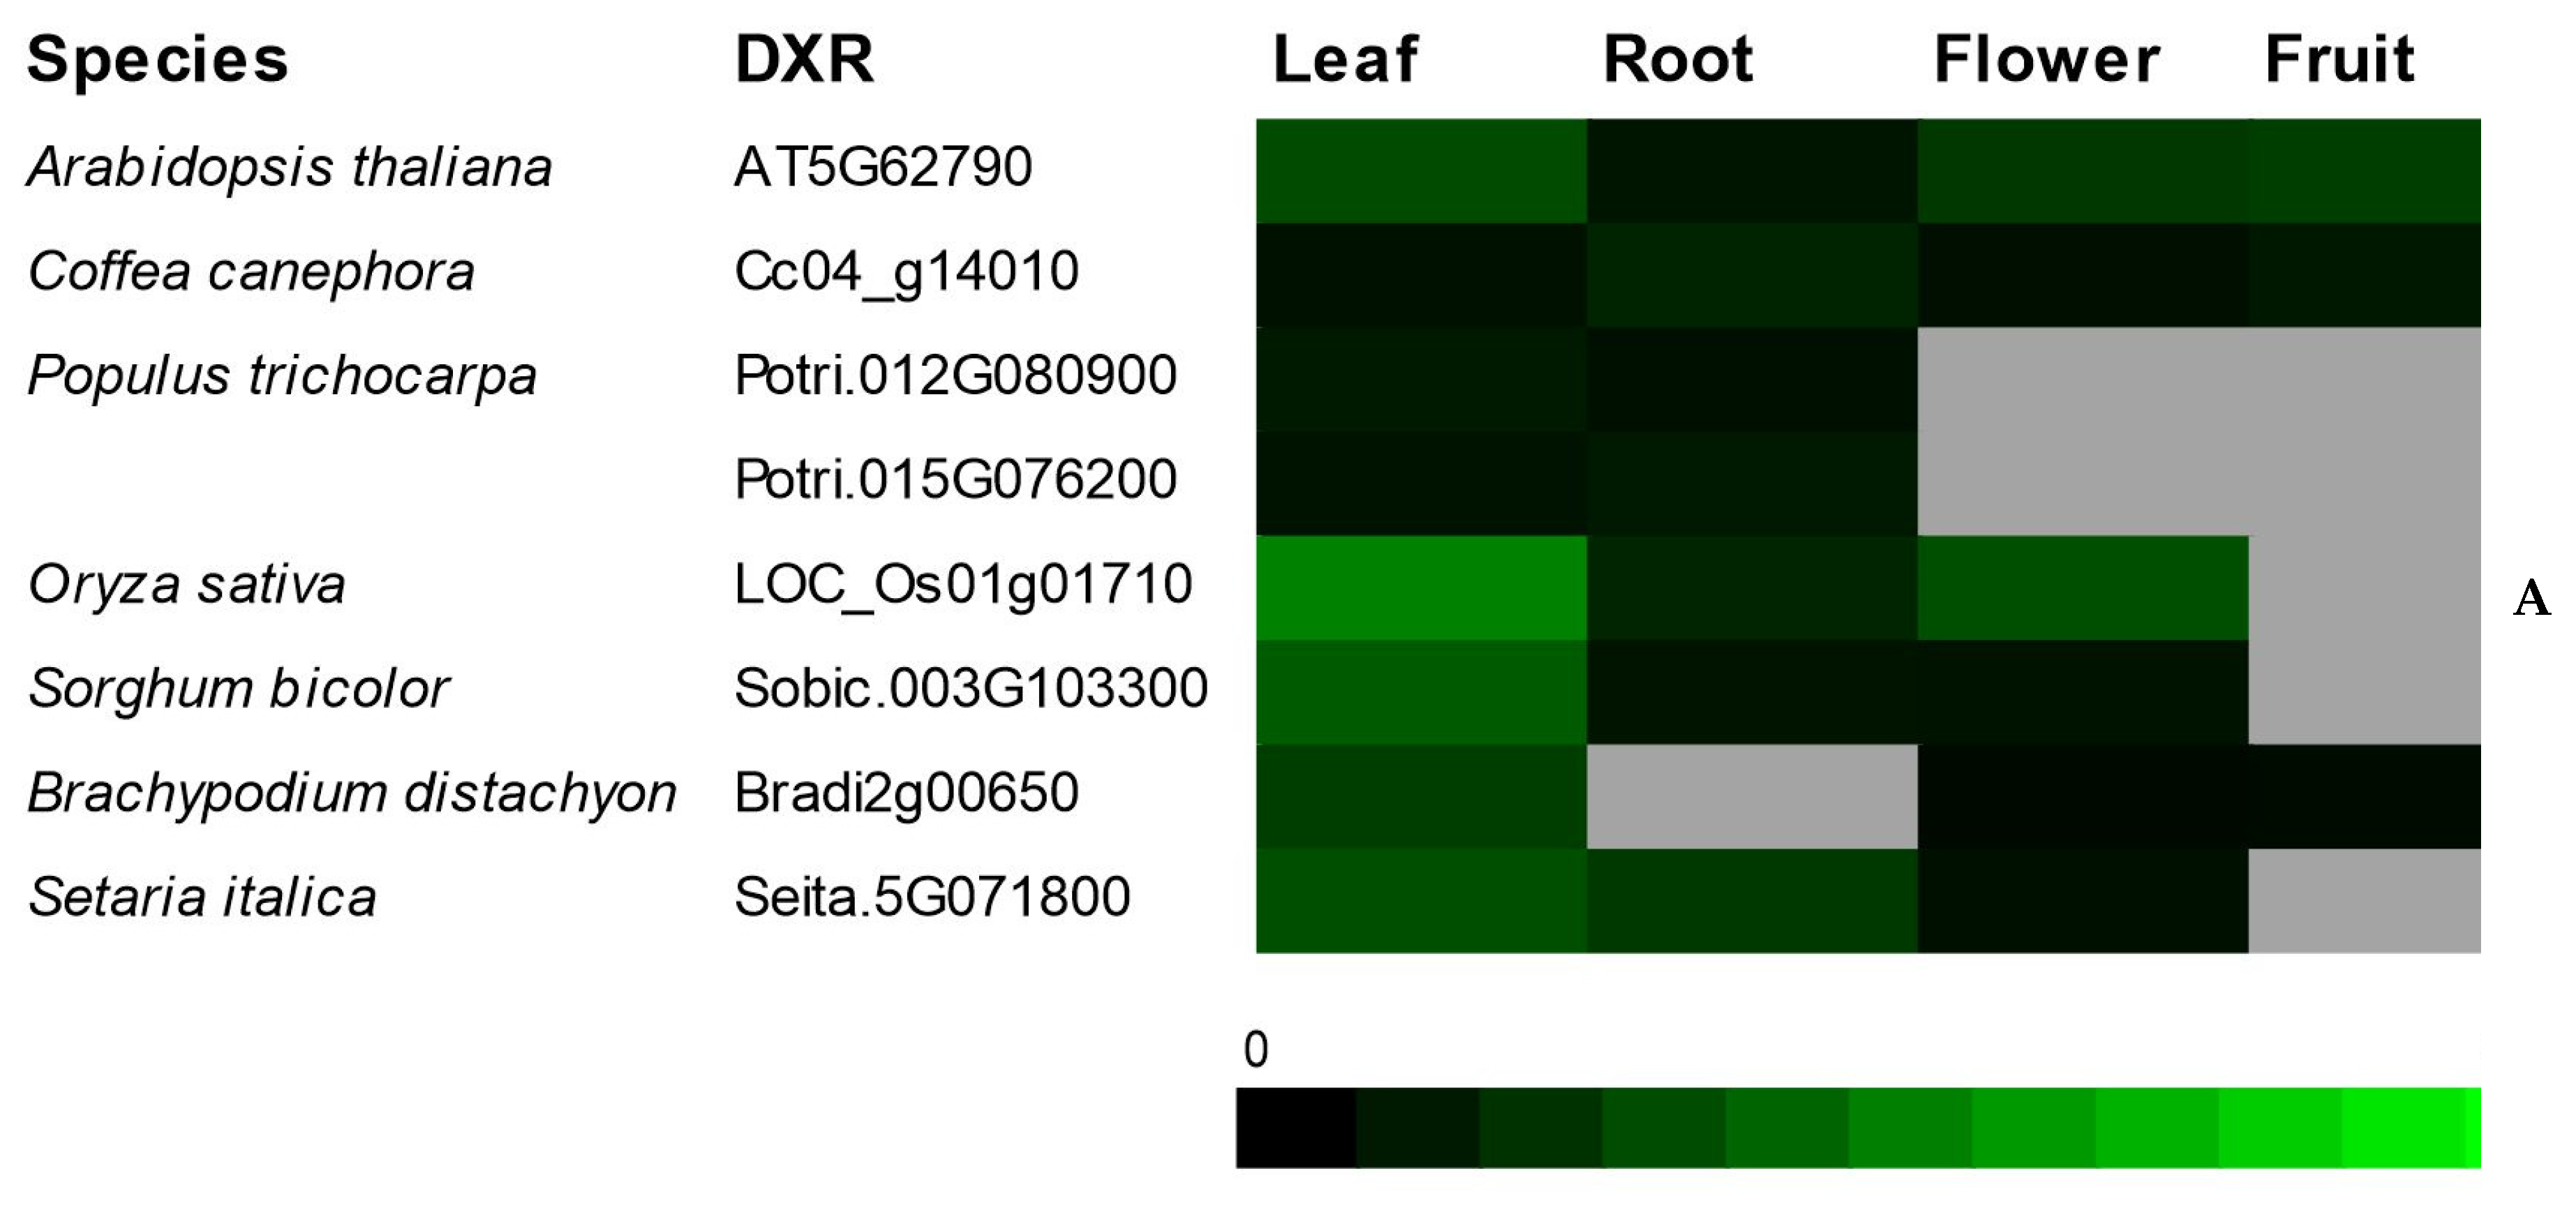
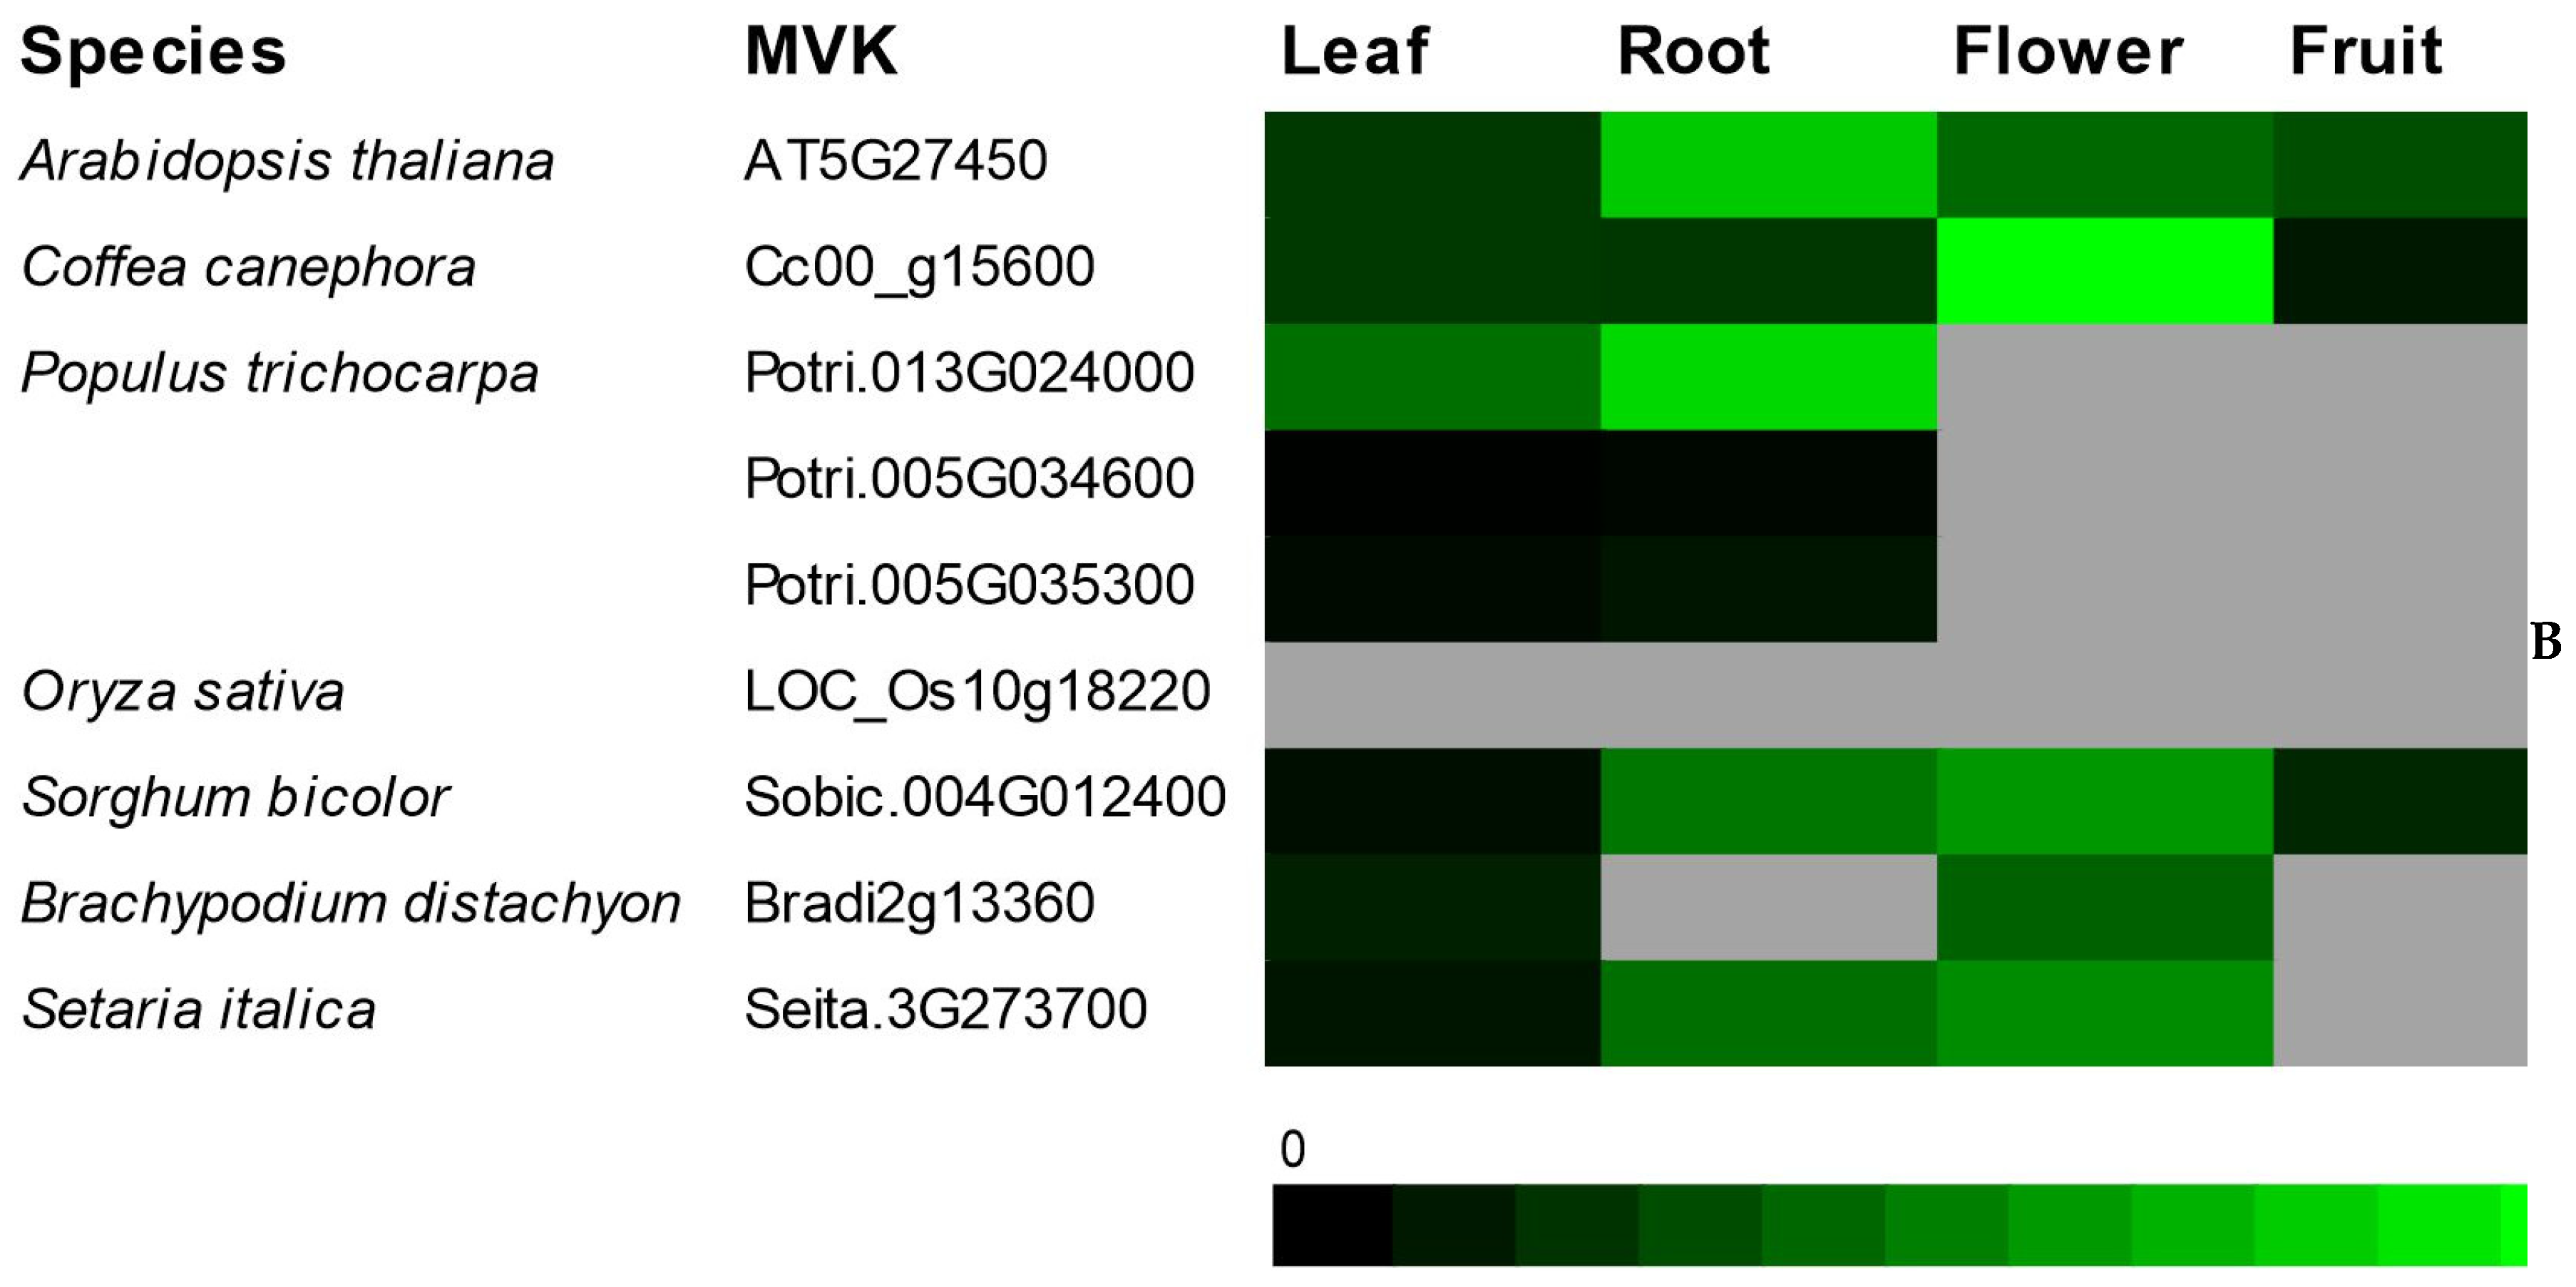
To determine the MVK and DXR gene expression profiles among angiosperms, we used public RNA-seq data from seven plant species (A. thaliana, C. canephora, P. trichocarpa, O. sativa, S. bicolor, B. distachyon and S. italica) and four tissues (leaves, roots, flowers and fruits) (Figure 6). MVK transcripts were expressed most highly in A. thaliana roots with 56 RPKM (At5g27450), P. trichocarpa roots with 60 RPKM (Potri.013g024000), C. canephora flowers (Cc00_g15600) with 70 RPKM and S. bicolor flowers with 42 RPKM (Sobic.004g012400) (Figure 6). DXR, on the other hand, was most highly expressed in A. thaliana leaves (At5g62790) with 181 RPKM C. canephora roots with 88 RPKM (Cc04_g14010), O. sativa leaves with 308 RPKM (Os01g01710), S. bicolor leaves with 215 RPKM (Sobic.003g103300) and S. lycopersicum flowers with 608 RPKM (Solyc03g114340.2). For both genes, the lowest levels of expression were observed in P. trichocarpa in most organs analyzed (Figure 6). Our results indicated that MVK is mostly expressed in roots and flowers, and DXR in leaves.
Digital gene expression (DGE) profile analysis of CaMVK (Figure 7A,B) and CaDXR (Figure 7C,D) from several organs of C. arabica was also analyzed. The CaDXR (Figure 7C) gene had higher transcript levels than CaMVK (Figure 7A) in leaves, flowers and fruits (30 to 150 DAF). However, while CaMVK steadily decreases its expression along fruit development, CaDXS is decreased only in the late stages of fruit development. In addition, we observed that application of methyl jasmonate upregulated the expression of CaMVK and CaDXR in fruits (Figure 7B,D).
In order to provide an overall picture of transcriptional responses of MVA and MEP pathways in coffee, we provide DGE analysis of 23 genes of these pathways after MJ application (Figure S2) and in several organs (Figure S3), including CaMVK and CaDXR. Eleven genes (52.3%) were upregulated similarly to CaMVK and CaDXR (CaDXS2, CaDXS4, CaMCT, CaCMK, CaHDS1, CaHDS2, CaIDI, CaGGPPS1, CaGGPPS2, CaAACT2, CaHMGS, CaMPDC and CaIDI), while six were downregulated (CaDXS1, CaDXS3, CaMECPS, CaGGPPS3, CaAACT1, CaPMK) and two genes (CaIDS and CaHMGR) did not show significant differences under MJ application (Figure S2). We observed in the fruit development DGE analysis (Figure S3) that 18 genes showed similar expression pattern with CaMVK and CaDXR—high transcript levels in flowers and low in leaves (CaDXS2, CaDXS4, CaCMK, CaMECPS, CaHDS1, CaHDS2, CaIDI, CaIDS, CaGGPPS1, CaAACCT1, CaAACCT2, CaHMGS, CaHMGR, CaPMK, CaMPDC and CaIDI).

2.8. RT-qPCR-Based Transcriptional Profile of MVK and DXR Genes in C. arabica

Levels of CaMVK and CaDXR gene expression in flowers, endosperm and the perisperm of fruits 120 days after flowering (DAF) were evaluated using RT-qPCR. Both genes were more active in flowers, followed by perisperm and endosperm (Figure 8A,B).
We also verified that exogenous application of hexanoic acid, a well-known natural priming substance, was capable of modulating CaMVK and CaDXR transcriptional profiles in leaves and roots. CaMVK was upregulated in the roots of Obatã cultivar (Figure 8D) post-Hx treatment. CaDXR was downregulated in leaves of Catuaí Vermelho (Figure 8E) treated with Hx.

3. Discussion

MVK and DXR are key genes involved in MVA and MEP terpenoid biosynthesis pathways. They produce several terpenoid precursors, however, little is known about their molecular evolution [3]. These genes are present in several plant kingdom lineages, such as algae, mosses, monocotyledons and eudicotyledons [9,10,29]. This study revealed that MVK and DXR are low copy number genes in all 24 species analyzed. In contrast to Arabidopsis, which only has one copy of each gene, several species have more than one copy of MVK and DXR.
We observed that the outgroup species, C. reinhardtii, does not have the MVK gene. A previous study has shown that another MVA pathway gene, HMGR, was also absent in the species [10]. These data suggest that throughout evolution the MVA terpene pathway may have been lost in Chlorophyta. Unusual patterns of MVA pathway has already been reported in a previous study in bacteria [29].
When analyzing the evolutionary relationships of MVK and DXR genes among angiosperm species, we observed that the phylogenetic trees displayed distinct clades, which divided outgroup species, monocotyledon and eudicotyledon lineages.
The MVK gene tree, clearly divided between monocots and eudicots, is highly similar to HMGR [10], suggesting a similar pattern of gene evolution among the MVA pathway. However, DXR in eudicotyledons have a reticulate pattern, which was not observed for MVK, suggesting differential evolutionary forces acting on the two genes. A reticulated pattern of gene evolution was also observed in DXS, the rate-limiting enzyme of the MEP pathway [9], suggesting that this pattern is common for genes related to the MEP pathway.
Previous studies have shown that DXR has a greater impact on carotenoid and steroid synthesis than MVK [30] and the drastic effect of DXR loss on plant development is well known [11]. In this sense, we can also speculate that these observations might be associated with a greater impact of DXR on terpenoid metabolism.
Most duplications of these genes were associated with recent WGD (whole-genome duplication) events detected in plant species [15], or to polyploid characteristics of species analyzed. In C. quinoa, duplication could be explained by the polyploid character of its genome [31]. In G. max, G. raimondii, P. trichocarpa and M. acuminata the identification of more than one copy of MVK can be also associated to recent genome duplication events [15]. Interestingly, R. communis (Table 4) and S. italica (Table 5) possessed more than one copy of MVK and did not experience any recent genome duplication events, but increased the number of genes nonetheless. They underwent a possible local gene species-specific duplication of MVK, which occurred less than 10 and 5 million years ago, respectively—an unusual occurrence in angiosperms.
Gene structure and organization analyses revealed that the number of introns and exons within these genes are similar among species. However, the DXR gene has a more complex exon/intron organization than MVK, which may also explain its distinct phylogenetic pattern. This observation is in accordance with our findings, indicating that a greater number of recombination events occurred within the DXR gene than the MVK gene (Table 6 and Table 7). Gene structure and organization analyses revealed that the number of introns and exons within these genes are similar among species.
We observed that the MVK and DXR gene families in angiosperms experienced a strong purifying pressure (dN/dS < 1). This fact highlights the functional importance of these genes during their evolutionary process [32]. Some positive sites indicate a possible diversification between strains of both genes in plants [32]. Thus, in sites under positive selection, duplication accelerated, which facilitated functional divergence and resulted in the formation of gene subgroups.
Throughout evolution, gene duplication events may be exposed to divergent selection pressure, which leads to non-functionalization (loss of original functions), neofunctionalization (acquisition of new functions) or sub-functionalization (partition of original functions) [9,10,14]. In this study, dN/dS ratios for duplicated MVK and DXR genes were less than 1, suggesting that genes were predominantly under strong purifying selection pressure.
To better understand selective pressure, we estimated the age of MVK and DXR gene duplications using dN/dS data. This confirmed the recent tandem duplication of MVK in P. trichocarpa and WGD duplications in G. max.
We also observed a direct relation between copy number among MVK and DXR with the respective rate-limiting genes from these pathways—HMGR and DXS. As examples of gene duplication in MVK, we can highlight G. raimondii, G. max and P. trichocarpa. These species were also the ones with higher number of copies of HMGR [10]. In DXR, Arabidopsis thaliana and Eucalyptus grandis are species with a single copy of DXR; both species have three copies of DXS [9]. Conversely, G. max, the species with the highest number of DXR copies, also harbored the highest number of DXS copies in a similar analysis [9].
Using MEME analysis, we identified amino acid sites that experienced episodic positive selection. We observed an opposite pattern of positively selected sites in MVK and DXR genes: while more positively selected sites were identified in monocot MVK genes, for DXR most positively selected sites were in dicot genes (Table 3). The amount of positively selected sites helped us to highlight natural selection effects on individual sites that are usually hindered by the low averaged dN/dS values.The analysis of dN/dS among individual amino acid residues in DXR (Figures S4 and S5) also indicated that higher values were in the N-terminal, where the protein has its targeting signal to organelles [33].
The transcriptional profile of genes involved in the initial steps of terpenoid biosynthesis in the Coffea genus has, thus far, been poorly investigated. However, the MVK and DXR transcriptional profiles in model plants were already extensively studied [8,34]. MVK was highly expressed in roots and flowers, while the transcript levels of DXR was more abundant in photosynthetic tissues [7,8,34].
We verified the expression levels of CaMVK and CaDXR genes in C. arabica organs using RNA-seq data and RT-qPCR. We observed higher transcript levels of these genes in flowers for both analyses. The high levels of expression observed in flowers can be explained by the fact that several terpenes are produced in this organ [34,35], most of which are plant volatile compounds, such as limonene, one of the main monoterpene compounds responsible for the aroma of coffee [22]. In addition, we observed in the RNA-seq data that CaMVK and CaDXR are upregulated in coffee fruits under MJ treatment compared to mock-control plants, including most of the genes involved in the MVA and MEP pathways. Several studies already described methyl jasmonate function as a potent elicitor of secondary metabolite production [36,37] and hexanoic acid as a plant resistance inductor by producing natural products [24,25].
Our RT-qPCR results showed that hexanoic acid is able to upregulate expression of CaMVK in C. arabica cv. Obatã roots, a result that is in agreement with previous reports investigating gene expression in Citrus plants [25]. In the same Hx experiment, the DXR gene was downregulated in the leaves of C. arabica cv. Catuaí Vermelho, suggesting that modulation of expression might be genotype-specific. The upregulation of transcription of the MVK gene in Hx-treated roots was detected only in the Obatã cultivar. Upregulation of the terpenoid pathway can provide protection against stresses, as previously observed in studies investigating tobacco [38], tomato [39] and maize [40]. In addition, it is important to highlight that Obatã and Catuaí Vermelho cultivars have distinct breeding stories, and they are classified in distinct genetic groups [41]. In this study, we provide insights to show that distinct genetic groups generated by coffee breeding might result in dissimilar transcriptional responses.

4. Materials and Methods

4.1. Identification and Annotation of MVK and DXR Gene Families in Plants

The coding sequences (CDSs) of MVK and DXR were retrieved for 24 plant species with sequenced genomes within the PLAZA 4.0 platform [42]. The coding sequences were translated into amino acids using TranslatorX [43]. Gene characterizations were based on characteristics observed in A. thaliana MVK and DXR genes (AT5G27450 and AT5G62790). Sequences on the PLAZA platform that contained the InterPro domains IPR006205 (Mevalonate kinase) and IPR013750 (GHMP kinase, C-terminal domain) were further selected as MVK genes. To identify DXR, we retrieved genes that simultaneously contained the InterPro domains IPR003821 (DXP_reductoisomerase), IPR013512 (DXP_reductoisomerase_N), and IPR026877 (DXP C-terminal domain reductoisomerase) for further analysis.

4.2. Multiple Sequence Alignments and Phylogenetic Analysis

Coding nucleotide sequences were aligned with MUSCLE [44] and TranslatorX software [43]. In TranslatorX, we were able to eliminate positions containing gaps and missing data with the Gblocks tool [45]. The evolutionary history of genes was inferred using the maximum likelihood method based on the LG model [46]. The consensus tree bootstrap inferred from 1000 replicates was used to represent the evolutionary history of genes analyzed. The percentages of the replicated trees in which the associated rates were grouped in the bootstrap test (1000 repetitions) were shown near the branches. Evolutionary analysis and final trees were performed using MEGAX [47]. To predict the cellular localization of proteins produced by MVK and DXR genes, we used the TargetP 1.1 Server [48], CELLO v.2.5 [49] and Plant-mPLoc [50].

4.3. Determination of Gene Structures

To analyze the exon–intron structure of MVK and DXR genes, we used the Gene Structure Display Server v2.0 program with its default parameters [51]. The genomic and CDS in FASTA format corresponding to genes of 24 plant species were inserted to generate gene structures.

4.4. Selection Pressure and Evolutionary Analyses

Non-synonymous (dN) and synonymous (dS) nucleotide substitutions within DXR and MVK genomic sequences were used to calculate dN/dS ratios. The indices dN/dS = 1, dN/dS < 1 and dN/dS > 1 represent neutral evolution, purifying selection or positive Darwininan selection, respectively. Individual dN/dS indices for each amino acid of predicted proteins for each gene were also determined using the statistical test suite available on the Selecton Server platform (http://selecton.tau.ac.il/) [52], using the following models: M8 (ωs ≥ 1), M7 (beta) and M5 (gamma). In addition, FEL, SLAC and MEME methods with default settings incorporated into the Datamonkey web interface [53] were also used to identify selection type.

4.5. Gene Duplication Analysis

The alignment of duplicate gene pairs of MVK and DXR in P. trichocarpa, G. raimondii, R. communis, M. acuminata, S. italica, C. quinoa and G. max species was performed using MUSCLE program implemented in MEGAX [47]. Then, pairwise synonymous (dS) and non-synonymous (dN) numbers of substitutions were calculated using MEGAX. Based on synonymous substitutions per year (λ) equal to 6.5 × 10⁻⁹ for monocotyledons [54] and 1.5 × 10⁻⁸ for dicotyledons [55], by substituting the calculated dS values, the approximate age of the duplicated events of the duplicate DXR or MVK gene pairs was estimated using the following Equation (1):
T  =  Ks/2λ × 10−6 mya.
Synteny information was retrieved from the PLAZA 4.0 platform [42].

4.6. Gene Recombination Analysis

Recombination events between divergent nucleotide sequences were investigated to detect recombination signals using RDP.v4 software with default parameters (http://web.cbio.uct.ac.za/~darren/rdp.html). In this study, we used the following methods: RDP [56], Geneconv [57] and MaxChi [58] and the p-value was set to 0.05.

4.7. RNA-seq-Based Expression Profile Analysis of MVK and DXR Genes

We analyzed the digital expression profile of A. thaliana, C. canephora, P. trichocarpa, O. stiva, S. bicolor and S. lycopersicum genes in leaf, root, fruit and flower tissues from the Gene Expression Atlas platform (http://www.ebi.ac.uk/gxa) [59]. C. arabica digital expression data from leaves, flowers, fruits and fruits treated with methyl jasmonate (2 mM) were obtained from previously published work [28]. Figures depicting expression maps were developed using Genesis software [60].

4.8. Transcriptional Profiles of MVK and DXR Genes in C. arabica by RT-qPCR

4.8.1. Plant Material

Samples were obtained from 20-year-old individual C. arabica cv. IAPAR59 plants grown at the Agronomic Institute of Paraná (Londrina—Brazil) under full-sun field conditions with standard irrigation and fertilization practices. We collected open flowers and fruits 120 DAF in January of 2013. Fruit tissues were separated into pulp, perisperm and endosperm, and only perisperm and endosperm tissues were selected for RT-qPCR analysis. All samples were collected between 9 and 11 a.m., transferred immediately to liquid nitrogen and stored at -80°C until RNA was extracted.

4.8.2. Hexanoic Acid Treatment: Experimental Procedures

Five-month-old plants of C. arabica cv. Catuaí Vermelho IAC 144 and Obatã IAC 1669-20 (4–5 leaf pairs) were used to assess treatment with hexanoic acid. Plants were selected based on size uniformity, and were transferred to dark pots containing 3 L of aerated nutrient solution (ANS), adapted from Clark (1975) by de Carvalho et al. (2013) [61,62]. The nutrition solution was composed of K2SO4 (1068 mM), MgSO4·7H2O (332.5 mM), KH2PO4 (266 mM), CaCl2H2O (66 mM) and NH4NO3 (5333 mM). Iron and micronutrients were supplied by using a commercial chelated salt mixture (ConMicros Standard, Conplant) at the following concentrations (in µg.L−1): Fe (363), Cu (91), Zn (37), Mn (91), B (91), Mo (18) and Ni (17). Experiments were carried out in a plant growth room, with the temperature set to 23 °C (ranging between 21 °C and 25 °C). Plants were maintained using a 12 h day/night cycle. LED panels with a photosynthetically active photon flux density of approximately 400 μmol.m−2.s−1 provided artificial lighting. The pH of the nutrient solution was adjusted and maintained between 5.5 and 5.6 daily using chloridric acid or sodium hydroxide. Plants were acclimatized approximately 96 h. After the acclimatization period, nutrient solutions were replaced. The following treatments were assessed: (a) ANS (control); (b) ANS + hexanoic acid (Merck, final concentration 0.55 mM) for 48 h. Plants were grown in 3 to 6 plastic pots in which three plants received each treatment. The potted plants were grouped in “pools” (made of 9 to 18 plants), which were considered a replicate. The experiments were repeated 3 times to obtain biological replicates. The mature leaves of the middle third and lateral roots of the plants were collected within the 3rd hour of the light period, macerated in liquid nitrogen and stored in a freezer at −80°C until RNA extraction was performed.

4.8.3. Transcriptional Profiles of MVK and DXR Genes using RT-qPCR and Statistical Analyses

Total RNA from C. arabica mature leaves, roots, flowers and fruits were extracted using the RNeasy Plant kit (Qiagen, Hilden, North Rhine-Westphalia, Germany). Total RNA samples were purified using the RNeasy Minielute Cleanup kit (Qiagen, Hilden, North Rhine-Westphalia, Germany). RNA integrities were verified via 1% agarose gel electrophoresis. The purity of RNA was determined using a NanoDrop ND-100 spectrophotometer (Thermo Scientific, San Jose, USA) and concentrations were obtained using Qubit fluorimeter (Thermo Fisher Scientific, Wilmington, DE, USA). Complementary DNAs (cDNAs) were synthesized using the High Capacity cDNA Reverse Transcriptase kit (Thermo Fisher Scientific, Wilmington, DE, USA) according to the manufacturer’s instructions. A final volume of 20 μL with 5 μg of total RNA was used. Primers were designed with Primer 3 software to amplify products ranging from 95 to 127 bp (Table S1). Primer efficiencies were calculated using LinRegPCR software v. 11.0 [63]. RT-qPCR reactions were performed using a QuantiStudio3 system (Applied Biosystems, Carlsbad, CA, USA) in accordance with basic procedures reported in a previous publication in coffee plants [28]. The reaction mixture contained 7.5 μL of GoTaq® Hot Start Polymerase (Promega, Madison, WI, USA), 0.3 μL of each primer (3 μM), 1 μL of cDNA (10 ng/μL) and 5.5 μL of Milli-Q water in a final volume of 15 μL. The RT-qPCR conditions began with an initiation step at 95 °C for 2 min; and were followed by 40 cycles at 94 °C for 30 s and 60 °C for 60 s. Melting curves were assessed to verify the presence of a single product and included a negative control. All reactions were performed with three biological and technical replicates, and we followed the MIQE guidelines for RT-qPCR experiments [64].
Relative expression was calculated using the following formula (Equation (2)):
(1 + E) −∆∆Ct
where E = primer efficiency, ΔCt = Ct target gene–Ct reference gene and ΔΔCt = ΔCt target–ΔCt internal calibrator, as previously described [62]. In all cases, GAPDH was the normalizer, as recommended for coffee plants [62,65]. Internal calibrators were endosperm for IAPAR59 and control samples (without application of hexanoic acid) for the hexanoic acid experiment. Data were analyzed via two-way ANOVA and the post-hoc Tukey test (p < 0.05) using XLSTAT.2014 software [66].

5. Conclusions

No MVK genes were identified in C. reinhardtii in the present study, suggesting a very specific evolution pattern for terpenoid biosynthesis in Chlorophyta. Seven species have more than one copy of the MVK gene, and six species had more than one copy of DXR. Most duplications are due to WGD and also happened with other genes of the pathway, except for R. communis and S. italica. The DXR gene was subjected to a stronger purifying selection pressure, producing lower dN/dS values compared to MVK. Our analyses still raise the need for further studies characterizing the impact that MVK knockdown could have on the phenotype and terpenoid production of model plants.
Furthermore, the DXR gene was shown to undergo a greater number of recombinations. We observed that DXR is more transcriptionally active than MVK in leaves, while MVK transcripts are more abundant in angiosperm roots and flowers. We finally observed that Hx is able to modulate the expression of these genes in coffee leaves and roots in a genotype-specific manner.

Supplementary Materials

The following are available online at https://www.mdpi.com/2223-7747/9/4/525/s1. Figure S1. Schematic representation of genomic regions containing MVK or DXR genes; Figure S2. RPKM values of C. arabica terpenoid pathway genes under methyl jasmonate application; Figure S3. RPKM values of C. arabica terpenoid pathway genes in flowers, leaves and along fruit development; Figure S4. Distribution of dN/dS over individual sites in MVK, based on Selecton statistics; Figure S5. Distribution of dN/dS over individual sites in DXR, based on Selecton statistics; Table S1. Primer sequences used for RT-qPCR analyses.

Author Contributions

Conceptualization, S.T.I.-S. and D.S.D.; data curation, N.S., S.T.I.-S., P.O.C., R.S.R. and D.S.D.; formal analysis, N.S., S.T.I.-S. and D.S.D.; funding acquisition, L.F.P.P. and D.S.D.; investigation, N.S. and S.T.I.-S.; methodology, N.S., S.T.I.-S., P.O.C. and R.S.R.; project administration, L.F.P.P. and D.S.D.; resources, L.F.P.P. and D.S.D.; supervision, S.T.I.-S., L.F.P.P. and D.S.D.; validation, L.F.P.P.; visualization, N.S. and S.T.I.-S.; writing—original draft, N.S., S.T.I.-S., L.F.P.P. and D.S.D.; writing—review and editing, N.S., S.T.I.-S., P.O.C., R.S.R., L.F.P.P. and D.S.D. All authors have read and agreed to the published version of the manuscript.

Funding

This research was funded by Fundação de Amparo à Pesquisa do Estado de São Paulo (FAPESP), grant number #2016/10896-0. N.S., P.O.C. and R.S.R. acknowledge the National Counsel of Technological and Scientific Development (CNPq) for providing fellowships. S.T.I.-S acknowledges FAPESP for providing a post-doctoral fellowship, grant number #2017/01455-2. D.S.D. also acknowledges CNPq for a research productivity fellowship (process number #312823/2019-3).

Conflicts of Interest

The authors declare that they have no competing political, personal, religious, ideological, academic, intellectual, and commercial or any other competing interests.

References

  1. Tholl, D. Biosynthesis and biological functions of terpenoids in plants. In Biotechnology of Isoprenoids; Schrader, J., Bohlmann, J., Eds.; Springer: Cham, Switzerland, 2015; Volume 148, pp. 63–106. [Google Scholar] [CrossRef]
  2. Nogueira, M.; Enfissi, E.M.; Almeida, J.; Fraser, P.D. Creating plant molecular factories for industrial and nutritional isoprenoid production. Curr. Opin. Biotechnol. 2018, 49, 80–87. [Google Scholar] [CrossRef]
  3. Rodríguez-Concepción, M.; Boronat, A. Breaking new ground in the regulation of the early steps of plant isoprenoid biosynthesis. Curr. Opin. Plant Biol. 2015, 25, 17–22. [Google Scholar] [CrossRef]
  4. Böttger, A.; Böttger, A.; Vothknecht, U.; Bolle, C.; Wolf, A. Terpenes and Terpenoids. In Lessons on Caffeine, Cannabis & Co; Böttger, A., Vothknecht, U., Bolle, C., Wolf, A., Eds.; Springer International Publishing: Cham, Switzerland, 2018; pp. 153–170. [Google Scholar] [CrossRef]
  5. Simkin, A.J.; Guirimand, G.; Papon, N.; Courdavault, V.; Thabet, I.; Ginis, O.; Bouzid, S.; Giglioli-Guivarc’h, N.; Clastre, M. Peroxisomal localisation of the final steps of the mevalonic acid pathway in planta. Planta 2011, 234, 903–914. [Google Scholar] [CrossRef]
  6. Pulido, P.; Toledo-Ortiz, G.; Phillips, M.A.; Wright, L.P.; Rodríguez-Concepción, M. Arabidopsis J-protein J20 delivers the first enzyme of the plastidial isoprenoid pathway to protein quality control. Plant Cell 2013, 25, 4183–4194. [Google Scholar] [CrossRef] [Green Version]
  7. Hemmerlin, A.; Harwood, J.L.; Bach, T.J. A raison d’être for two distinct pathways in the early steps of plant isoprenoid biosynthesis? Prog. Lipid Res. 2012, 51, 95–148. [Google Scholar] [CrossRef]
  8. Pichersky, E.; Raguso, R.A. Why do plants produce so many terpenoid compounds? New Phytol. 2016, 220, 692–702. [Google Scholar] [CrossRef]
  9. Hofberger, J.A.; Ramirez, A.M.; Van den Bergh, E.; Zhu, X.; Bouwmeester, H.J.; Schuurink, R.C.; Schranz, M.E. Large-scale evolutionary analysis of genes and supergene clusters from terpenoid modular pathways provides insights into metabolic diversification in flowering plants. PLoS ONE 2015, 10, e0128808. [Google Scholar] [CrossRef]
  10. Li, W.; Liu, W.; Wei, H.; He, Q.; Chen, J.; Zhang, B.; Zhu, S. Species-specific expansion and molecular evolution of the 3-hydroxy-3-methylglutaryl coenzyme A reductase (HMGR) gene family in plants. PLoS ONE 2014, 9, e94172. [Google Scholar] [CrossRef]
  11. Xing, S.; Miao, J.; Li, S. Disruption of the 1-deoxy-D-xylulose-5-phosphate reductoisomerase (DXR) gene results in albino, dwarf and defects in trichome initiation and stomata closure in Arabidopsis. Cell Res. 2010, 20, 688–700. [Google Scholar] [CrossRef] [Green Version]
  12. Kumari, S.; Priya, P.; Misra, G.; Yadav, G. Structural and biochemical perspectives in plant isoprenoid biosynthesis. Phytochem. Rev. 2013, 12, 255–291. [Google Scholar] [CrossRef]
  13. Priya, P.; Kumari, S.; Yadav, G. Quantification of the plant terpenome: Predicted versus actual emission potentials. Ind. J. Plant Physiol. 2016, 21, 569–575. [Google Scholar] [CrossRef] [Green Version]
  14. Panchy, N.; Melissa, L.; Shin-Han, S. Evolution of gene duplication in plants. Plant Physiol. 2016, 171, 2294–2316. [Google Scholar] [CrossRef] [PubMed] [Green Version]
  15. Qiao, X.; Li, Q.; Yin, H.; Qi, K.; Li, L.; Wang, R.; Zhang, S.; Paterson, A.H. Gene duplication and evolution in recurring polyploidization–diploidization cycles in plants. Genome Biol. 2019, 20, 38. [Google Scholar] [CrossRef] [Green Version]
  16. Sando, T.; Takaoka, C.; Mukai, Y.; Yamashita, A.; Hattori, M.; Ogasawara, N.; Fukusaki, E.; Kobayashi, A. Cloning and characterization of mevalonate pathway genes in a natural rubber producing plant, Hevea brasiliensis. Biosci. Biotechnol. Biochem. 2008. [Google Scholar] [CrossRef] [Green Version]
  17. Singh, S.; Pal, S.; Shanker, K.; Chanotiya, C.S.; Gupta, M.M.; Dwivedi, U.N.; Shasany, A.K. Sterol partitioning by HMGR and DXR for routing intermediates toward withanolide biosynthesis. Physiol. Plant. 2014, 152, 617–633. [Google Scholar] [CrossRef]
  18. Kumari, U.; Vishwakarma, R.K.; Sonawane, P.; Abbassi, S.; Khan, B.M. Biochemical characterization of recombinant mevalonate kinase from Bacopa monniera. Int. J. Biol. Macromol. 2015, 72, 776–783. [Google Scholar] [CrossRef]
  19. Davis, A.P.; Tosh, J.; Ruch, N.; Fay, M.F. Growing coffee: Psilanthus (Rubiaceae) subsumed on the basis of molecular and morphological data; implications for the size, morphology, distribution and evolutionary supplhistory of Coffea. Bot. J. Linn. Soc. 2011, 167, 357–377. [Google Scholar] [CrossRef] [Green Version]
  20. FAOSTAT. Exports/Commodities by Country. Available online: http://www.fao.org/faostat/en/?#data/TP (accessed on 17 November 2019).
  21. Tiski, I.; Marraccini, P.; Pot, D.; Vieira, L.G.E.; Pereira, L.F.P. Characterization and expression of two cDNA encoding 3-Hydroxy-3-methylglutaryl coenzyme A reductase isoforms in coffee (Coffea arabica L.). Omics A J. Integr. Biol. 2011, 15, 719–727. [Google Scholar] [CrossRef] [Green Version]
  22. Del Terra, L.; Lonzarich, V.; Asquini, E.; Navarini, L.; Graziosi, G.; Suggi Liverani, F.; Pallavicini, A. Functional characterization of three Coffea arabica L. monoterpene synthases: Insights into the enzymatic machinery of coffee aroma. Phytochemistry 2013, 89, 6–14. [Google Scholar] [CrossRef]
  23. Fitza, K.N.; Payn, K.G.; Steenkamp, E.T.; Myburg, A.A.; Naidoo, S. Chitosan application improves resistance to Fusarium circinatum in Pinus patula. S. Afr. J. Bot. 2013, 85, 70–78. [Google Scholar] [CrossRef] [Green Version]
  24. Aranega-Bou, P.; de la O Leyva, M.; Finiti, I.; García-Agustín, P.; González-Bosch, C. Priming of plant resistance by natural compounds. Hexanoic acid as a model. Front. Plant Sci. 2014, 5, 488. [Google Scholar] [CrossRef] [Green Version]
  25. Llorens, E.; Camañes, G.; Lapeña, L.; García-Agustín, P. Priming by hexanoic acid induce activation of mevalonic and linolenic pathways and promotes the emission of plant volatiles. Front. Plant Sci. 2016, 7, 495. [Google Scholar] [CrossRef] [Green Version]
  26. Letunic, I.; Bork, P. Interactive tree of life v2: Online annotation and display of phylogenetic trees made easy. Nucleic Acids Res. 2011, 39, 475–478. [Google Scholar] [CrossRef]
  27. Letunic, I.; Bork, P. Interactive tree of life (iTOL) v3: An online tool for the display and annotation of phylogenetic and other trees. Nucleic Acids Res. 2016, 44, 242–245. [Google Scholar] [CrossRef] [PubMed]
  28. Ivamoto, S.T.; Júnior, O.R.; Domingues, D.S.; Dos Santos, T.B.; De Oliveira, F.F.; Pot, D.; Leroy, T.; Vieira, L.G.E.; Carazzolle, M.F.; Pereira, G.A.G.; et al. Transcriptome analysis of leaves, flowers and fruits perisperm of Coffea arabica L. reveals the differential expression of genes involved in raffinose biosynthesis. PLoS ONE 2017, 12, e0169595. [Google Scholar] [CrossRef] [PubMed] [Green Version]
  29. Lombard, J.; Moreira, D. Origins and early evolution of the mevalonate pathway of isoprenoid biosynthesis in the three domains of life. Mol. Biol. Evol. 2010, 28, 87–99. [Google Scholar] [CrossRef] [PubMed] [Green Version]
  30. Lange, I.; Poirier, B.C.; Herron, B.K.; Lange, B.M. Comprehensive assessment of transcriptional regulation facilitates metabolic engineering of isoprenoid accumulation in Arabidopsis. Plant Physiol. 2015, 169, 1595–1606. [Google Scholar] [CrossRef] [Green Version]
  31. Walsh, B.M.; Adhikary, D.; Maughan, P.J.; Emshwiller, E.; Jellen, E.N. Chenopodium polyploidy inferences from Salt Overly Sensitive 1 (SOS1) data. Am. J. Bot. 2015, 102, 533–543. [Google Scholar] [CrossRef] [Green Version]
  32. Benderoth, M.; Textor, S.; Windsor, A.J.; Mitchell-Olds, T.; Gershenzon, J.; Kroymann, J. Positive selection driving diversification in plant secondary metabolism. Proc. Natl. Acad. Sci. USA 2006, 103, 9118–9123. [Google Scholar] [CrossRef] [Green Version]
  33. Bruce, B.D. The paradox of plastid transit peptides: Conservation of function despite divergence in primary structure. Biochim. Biophys. Acta 2001, 1541, 2–21. [Google Scholar] [CrossRef] [Green Version]
  34. Vranová, E.; Coman, D.; Gruissem, W. Network analysis of the MVA and MEP pathways for isoprenoid synthesis. Annu. Rev. Plant Biol. 2013, 64, 665–700. [Google Scholar] [CrossRef]
  35. Dudareva, N.; Klempien, A.; Muhlemann, J.K.; Kaplan, I. Biosynthesis, function and metabolic engineering of plant volatile organic compounds. New Phytol. 2013, 198, 16–32. [Google Scholar] [CrossRef] [PubMed]
  36. Singh, A.; Dwivedi, P. Methyl-jasmonate and salicylic acid as potent elicitors for secondary metabolite production in medicinal plants: A review. J Pharm. Phytochem. 2018, 7, 750–757. [Google Scholar]
  37. Pan, L.; Zhao, X.; Chen, M.; Fu, Y.; Xiang, M.; Chen, J. Effect of exogenous methyl jasmonate treatment on disease resistance of postharvest kiwifruit. Food Chem. 2020, 305, 125483. [Google Scholar] [CrossRef]
  38. Steppuhn, A.; Gaquerel, E.; Baldwin, I.T. The two alpha-dox genes of Nicotiana attenuata: Overlapping but distinct functions in development and stress responses. BMC Plant Biol. 2010, 10, 171. [Google Scholar] [CrossRef] [Green Version]
  39. Finiti, I.; de la O Leyva, M.; Vicedo, B.; Gómez-Pastor, R.; López-Cruz, J.; García-Agustín, P.; Real, M.D.; González-Bosch, C. Hexanoic acid protects tomato plants against Botrytis cinerea by priming defence responses and reducing oxidative stress. Mol. Plant Pathol. 2014, 15, 550–562. [Google Scholar] [CrossRef]
  40. Block, A.K.; Vaughan, M.M.; Schmelz, E.A.; Christensen, S.A. Biosynthesis and function of terpenoid defense compounds in maize (Zea mays). Planta 2019, 249, 21–30. [Google Scholar] [CrossRef]
  41. Maluf, M.P.; Sivestrini, M.; de Campos Ruggiero, L.M.; Filho, O.G.; Colombo, C.A. Genetic diversity of cultivated Coffea arabica inbred lines assessed by RAPD, AFLP and SSR marker systems. Sci. Agric. 2005, 62, 366–373. [Google Scholar] [CrossRef] [Green Version]
  42. Van Bel, M.; Diels, T.; Vancaester, E.; Kreft, L.; Botzki, A.; Van de Peer, Y.; Coppens, F.; Vandepoele, K. PLAZA 4.0: An integrative resource for functional, evolutionary and comparative plant genomics. Nucleic Acids Res. 2017, 46, 1190–1196. [Google Scholar] [CrossRef]
  43. Abascal, F.; Zardoya, R.; Telford, M.J. TranslatorX: Multiple alignment of nucleotide sequences guided by amino acid translations. Nucleic Acids Res. 2010, 38, W7–W13. [Google Scholar] [CrossRef] [Green Version]
  44. Edgar, R.C. MUSCLE: Multiple sequence alignment with high accuracy and high throughput. Nucleic Acids Res. 2004, 32, 1792–1797. [Google Scholar] [CrossRef] [Green Version]
  45. Castresana, J. Selection of conserved blocks from multiple alignments for their use in phylogenetic analysis. Mol. Biol. Evol. 2000, 17, 540–552. [Google Scholar] [CrossRef] [Green Version]
  46. Le, S.Q.; Gascuel, O. An improved general amino acid replacement matrix. Mol. Biol. Evol. 2008, 25, 1307–1320. [Google Scholar] [CrossRef] [Green Version]
  47. Kumar, S.; Stecher, G.; Li, M.; Knyaz, C.; Tamura, K. MEGA X: Molecular evolutionary genetics analysis across computing platforms. Mol. Biol. Evol. 2018, 35, 1547–1549. [Google Scholar] [CrossRef]
  48. Emanuelsson, O.; Nielsen, H.; Brunak, S.; Von Heijne, G. Predicting subcellular localization of proteins based on their N-terminal amino acid sequence. J. Mol. Biol. 2000, 300, 1005–1016. [Google Scholar] [CrossRef] [PubMed] [Green Version]
  49. Yu, C.S.; Chen, Y.C.; Lu, C.H.; Hwang, J.K. Prediction of protein subcellular localization. Proteins Struct. Funct. Bioinform. 2006, 64, 643–651. [Google Scholar] [CrossRef]
  50. Chou, K.C.; Shen, H.B. Plant-mPLoc: A top-down strategy to augment the power for predicting plant protein subcellular localization. PLoS ONE 2010, 5, 11335. [Google Scholar] [CrossRef] [Green Version]
  51. Hu, B.; Jin, J.; Guo, A.Y.; Zhang, H.; Luo, J.; Gao, G. GSDS 2.0: An upgraded gene feature visualization server. Bioinformatics 2014, 31, 1296–1297. [Google Scholar] [CrossRef] [Green Version]
  52. Stern, A.; Doron-Faigenboim, A.; Erez, E.; Martz, E.; Bacharach, E.; Pupko, T. Selecton 2007: Advanced models for detecting positive and purifying selection using a Bayesian inference approach. Nucleic Acids Res. 2007, 35, W506–W511. [Google Scholar] [CrossRef]
  53. Weaver, S.; Shank, S.D.; Spielman, S.J.; Li, M.; Muse, S.V.; Kosakovsky Pond, S.L. Datamonkey 2.0: A modern web application for characterizing selective and other evolutionary processes. Mol. Biol. Evol. 2018, 35, 773–777. [Google Scholar] [CrossRef] [Green Version]
  54. Gaut, B.S.; Morton, B.R.; McCaig, B.C.; Clegg, M.T. Substitution rate comparisons between grasses and palms: Synonymous rate differences at the nuclear gene Adh parallel rate differences at the plastid gene rbcL. Proc. Natl. Acad. Sci. USA 1996, 93, 10274–10279. [Google Scholar] [CrossRef] [Green Version]
  55. Koch, M.A.; Haubold, B.; Mitchell-Olds, T. Comparative evolutionary analysis of chalcone synthase and alcohol dehydrogenase loci in Arabidopsis, Arabis, and related genera (Brassicaceae). Mol. Biol. Evol. 2000, 17, 1483–1498. [Google Scholar] [CrossRef] [Green Version]
  56. Martin, D.; Rybicki, E. RDP: Detection of recombination amongst aligned sequences. Bioinformatics 2000, 16, 562–563. [Google Scholar] [CrossRef]
  57. Padidam, M.; Sawyer, S.; Fauquet, C.M. Possible emergence of new geminiviruses by frequent recombination. Virology 1999, 265, 218–225. [Google Scholar] [CrossRef] [Green Version]
  58. Smith, J.M. Analyzing the mosaic structure of genes. J. Mol. Evol. 1992, 34, 126–129. [Google Scholar] [CrossRef]
  59. Kapushesky, M.; Emam, I.; Holloway, E.; Kurnosov, P.; Zorin, A.; Malone, J.; Rustici, G.; Williams, E.; Parkinson, H.; Brazma, A. Gene expression atlas at the European Bioinformatics Institute. Nucleic Acids Res. 2010, 38, 690–698. [Google Scholar] [CrossRef] [Green Version]
  60. Sturn, A.; Quackenbush, J.; Trajanoski, Z. Genesis: Cluster analysis of microarray data. Bioinformatics 2002, 18, 207–208. [Google Scholar] [CrossRef] [Green Version]
  61. Clark, R.B. Differential Magnesium Efficiency in Corn Inbreds: I. Dry-Matter Yields and Mineral Element Composition 1. Soil Sci. Soc. Am. J. 1975, 39, 488–491. [Google Scholar] [CrossRef]
  62. de Carvalho, K.; Bespalhok Filho, J.C.; Dos Santos, T.B.; de Souza, S.G.H.; Vieira, L.G.E.; Pereira, L.F.P.; Domingues, D.S. Nitrogen starvation, salt and heat stress in coffee (Coffea arabica L.): Identification and validation of new genes for qPCR normalization. Mol. Biotechnol. 2013, 53, 315–325. [Google Scholar] [CrossRef]
  63. Ramakers, C.; Ruijter, J.M.; Deprez, R.H.; Moorman, A.F. Assumption-free analysis of quantitative real-time polymerase chain reaction (PCR) data. Neurosci. Lett. 2003, 339, 62–66. [Google Scholar] [CrossRef]
  64. Taylor, S.; Wakem, M.; Dijkman, G.; Alsarraj, M.; Nguyen, M. A practical approach to RT-qPCR—Publishing data that conform to the MIQE guidelines. Methods 2010, 50, S1–S5. [Google Scholar] [CrossRef]
  65. Cruz, F.; Kalaoun, S.; Nobile, P.; Colombo, C.; Almeida, J.; Barros, L.; Romano, E.; Grossi-de-sa, M.F.; Vaslin, M.F.S.; Alves-Ferreira, M. Evaluation of coffee reference genes for relative expression studies by quantitative real-time RT-PCR. Mol. Breed. 2009, 23, 607–616. [Google Scholar] [CrossRef] [Green Version]
  66. XLSTAT Version 2014.5.03 Copyright Addinsoft 1995–2014, 2014 XLSTAT and Addinsoft are Registered Trademarks of Addinsoft. Available online: https://www.xlstat.com (accessed on 1 December 2019).
Figure 1. Phylogenetic tree of the analyzed species based on NCBI species taxonomy. This tree was constructed with PhyloT [26] and edited using iTOL [27]. An asterisk (*) indicates that the species lacks an MVK gene.
Plants 09 00525 g001
Figure 2. Phylogenetic tree of MVK genes from 23 plant species analyzed in this study. Outgroup species genes are indicated in red, while monocotyledon and eudicotyledon genes are indicated in blue and black, respectively. Evolutionary history was inferred using 30 MVK amino acid sequences. The tree was made using the maximum likelihood method, based on the LG model, with 1000 bootstraps (shown as percentages). All positions containing missing data and gaps were deleted using Gblocks. There were a total of 360 positions in the final dataset. The evolutionary analysis and tree design were performed using MEGAX software.
Plants 09 00525 g002
Figure 3. Phylogenetic tree of DXR genes from 24 plant species considered in this study. Outgroup species genes, monocotyledon genes and eudicotyledon genes are indicated using red, blue and black boxes, respectively. Evolutionary history was inferred using 30 DXR amino acid sequences. The tree was drawn using the maximum likelihood method, based on the LG model, with 1000 bootstraps (shown as a percentage). All positions containing missing data and gaps were deleted using Gblocks. There were a total of 374 positions in the final dataset. The evolutionary analysis and tree design were performed using MEGAX software.
Plants 09 00525 g003
Figure 4. Phylogenetic analysis of MVK and DXR C. arabica transcripts using five selected species (A. thaliana, C. arabica, C. canephora, R. communis and S. lycopersicum). The tree was drawn using the maximum likelihood method, which was based on the LG model.
Plants 09 00525 g004
Figure 5. Exon–intron structure of MVK (A) and DXR (B) genes.
Plants 09 00525 g005
Figure 6. Digital expression profile of MVK (A) and DXR (B) genes in organs of A. thaliana (AT5G27450 and AT5G62790), C. canephora (Cc00_g15600 and Cc04_g14010), P. trichocarpa (Potri.013g024000, Potri.005g034600, Potri.005g035300, Potri.012g080900 and Potri.015g076200), O. sativa (Os10g18220 and Os01g01710), S. bicolor (Sobic.004G012400 and Sobic.003G103300) and S. italica (Seita.3G273700 and Seita.5G071800). The black color indicates that there were no transcripts detected, and the gray color indicates that no data were available. The intensity of the green color is proportional to the number of transcripts observed in reads per kilo base per million mapped reads (RPKM) values.
Plants 09 00525 g006aPlants 09 00525 g006b
Figure 7. Digital expression profiles of CaMVK (blue) and CaDXR (red) genes in leaves, flowers and fruits (30 to 150 days after flowering, DAF) in C. arabica (A,C) and under the application of 2mM methyl jasmonate (MJ) (B,D). Transcript levels are expressed in reads per kilo base per million mapped reads (RPKM) values.
Plants 09 00525 g007
Figure 8. Transcriptional profile of CaMVK and CaDXR genes in C. arabica cv. Iapar 59 (A,B), C. arabica cv. Catuaí Vermelho (C,E) and C. arabica cv. Obatã (D,F). Experiments were performed using three biological and technical replicates each. Bars indicate standard deviation, and significant differences in which p < 0.05 (ANOVA followed by Tukey test) have been indicated with an asterisk (*). Abbreviations: Hexanoic acid application (Hx). Controls represent samples without Hx application.
Plants 09 00525 g008
Table 1. Identification of MVK and DXR genes in 24 plant species.
LineageSpeciesGene ID
MVKDXR
OutgroupsAmborella trichopodaATR0561G047ATR0730G147
Chlamydomonas reinhardtii Cre12.g546050
Marchantia polymorphaMapoly0214s0007Mapoly0064s0074
Mapoly0034s0078
EudicotyledonsArabidopsis thalianaAT5G27450AT5G62790
Capsella rubellaCarubv10001182m.gCarubv10026322m.g
Capsicum annuumCAN.G1077.21CAN.G781.11
Chenopodium quinoaAUR62005132AUR62030965
AUR62000841AUR62008212
Coffea arabicaCaMVK_comp31934CaDXR_comp33448
Coffea canephoraCc00_g15600Cc04_g14010
Cucumis sativusCucsa.091600Cucsa.196910
Eucalyptus grandisEucgr.B01993Eucgr.B00316
Glycine maxGlyma.03G239000Glyma.16G08900
Glyma.19G236200Glyma.17G089600
Glyma.05G037500
Gossypium raimondiiGorai.007G296000Gorai.007G001700
Gorai.007G342800Gorai.006G189200
Populus trichocarpaPotri.013G024000Potri.012G080900
Potri.005G034600Potri.015G076200
Potri.005G035300
Prunus persicaPrupe.6G327600Prupe.5G174000
Ricinus communisRCO.g.30128.000221RCO.g.30147.000220
RCO.g.29656.000023
Solanum lycopersicumSolyc01g098840.2Solyc03g114340.2
Theobroma cacaoTCA.TCM_026574TCA.TCM_01200
Utricularia gibbaUGI.Scf00073.6483UGI.Scf00226.11960
MonocotyledonsBrachypodium distachyonBradi2g13360Bradi2g00650
Musa acuminataMAC03G2585MAC12G2064
MAC04G2409MAC07G0719
Oryza sativaOs10g18220Os01g01710
Setaria italicaSeita.3G273700Seita.5G071800
Seita.2G354500
Sorghum bicolorSobic.004G012400Sobic.003G103300
Table 2. Average non-synonymous (dN) and synonymous (dS) substitution ratios for MVK and DXR genes in eudicotyledonous and monocotyledonous plants.
Gene dN/dS Positive Sites * Selection
MVKModelsEudycotsMonocotsEudycotsMonocotsEudycotsMonocots
M8(beta+w>=1)0.198310.29343112, 206, 2130PurifyingPurifying
M7(beta)0.227510.3552800PurifyingPurifying
M5(gamma)0.189860.2664900PurifyingPurifying
DXRM8(beta+w>=1)0.111360.1404300PurifyingPurifying
M7(beta)0.118770.1458900PurifyingPurifying
M5(gamma)0.162330.1305200PurifyingPurifying
* Calculations were performed using a Bayesian inference approach in Selecton Server (p < 0.05) using three distinct selection models.
Table 3. Predicted number and location of codons under positive selection in MVK and DXR.
Gene Positive Selection Sites * Selection
MVKMethodsEudicot.Monocot.Eudycot.Monocot.
FEL00PurifyingPurifying
SLAC00PurifyingPurifying
MEME42, 129, 33042, 115, 122, 317PurifyingPurifying
DXRFEL00PurifyingPurifying
SLAC00PurifyingPurifying
MEME12, 48, 52, 332, 409142, 145PurifyingPurifying
* Calculations were performed using the Datamonkey platform (p < 0.05).
Table 4. Duplication time estimated by dN/dS analysis in MVK genes of seven plant species.
SpeciesDuplicated MVK GenesdNdSdN/dSTime (mya)
Populus trichocarpaPotri.005G034600Potri.005G0353000.020.021.000.67
Potri.005G034600Potri.013G0240000.050.200.256.67
Potri.005G035300Potri.013G0240000.040.190.216.33
Gossypium raimondiiGorai.007G296000Gorai.007G3428000.110.460.2415.33
Ricinus communisRCO.g.30128.000221RCO.g.29656.0000230.060.270.229.00
Musa acuminataMAC03G2585MAC04G24090.100.460.2235.38
Setaria italicaSeita.3G273700Seita.2G3545000.020.060.334.62
Chenopodium quinoaAUR62005132AUR620008410.020.080.252.67
Glycine maxGlyma.03G239000Glyma.19G2362000.030.170.185.67
Abbreviation: mya, million years ago.
Table 5. Duplication time estimated by dN/dS analysis for DXR genes in six plant species.
SpeciesDuplicated DXR GenesdNdSdN/dSTime (mya)
Gossypium raimondiiGorai.007G001700Gorai.006G1892000.060.340.1811.33
Marcanthia polymorphaMapoly0064s0074Mapoly0034s00780.15n/c--
Populus trichocarpaPotri.012G080900Potri.015G0762000.020.160.135.33
Musa acuminataMAC12G2064MAC07G07190.050.460.1115.33
Chenopodium quinoaAUR62030965AUR620082120.040.090.443.00
Glycine maxGlyma.16G08900Glyma.17G0896000.140.60.2320.00
Glyma.16G08900Glyma.05G0375000.150.580.2619.33
Glyma.17G089600Glyma.05G0375000.020.070.292.33
Abbreviations: mya, million years ago; n/c, not calculated.
Table 6. Recombination events predicted for the MVK gene family using the RDP, GENECONV and MAXCHI recombination methods.
SpeciesRDPGENECONVMAXCHIGene ID
E. grandis104Eucgr.B01993
C. rubella002Carubv10001182m.g
M. polymorpha003Mapoly0214s0007
M. acuminata001MAC04G2409
S. italica005Seita.3G273700
Table 7. Recombination events predicted for the DXR gene family using the RDP, GENECONV and MAXCHI recombination methods.
SpeciesRDPGENECONVMAXCHIGene ID
C. sativus200Cucsa.196910
T. cacao011TCA.TCM_01200
G. raimondii030Gorai.007G001700
R. communis002RC30147G06220
C. annuum005CANG781.11
S. bicolor003Sobic.003G103300
M. acuminata004MAC07G0719
M. polymorpha006Mapoly0064s0074