EEG Based Classification of Long-Term Stress Using Psychological Labeling

 and
and
Abstract
:1. Introduction
Our Contributions
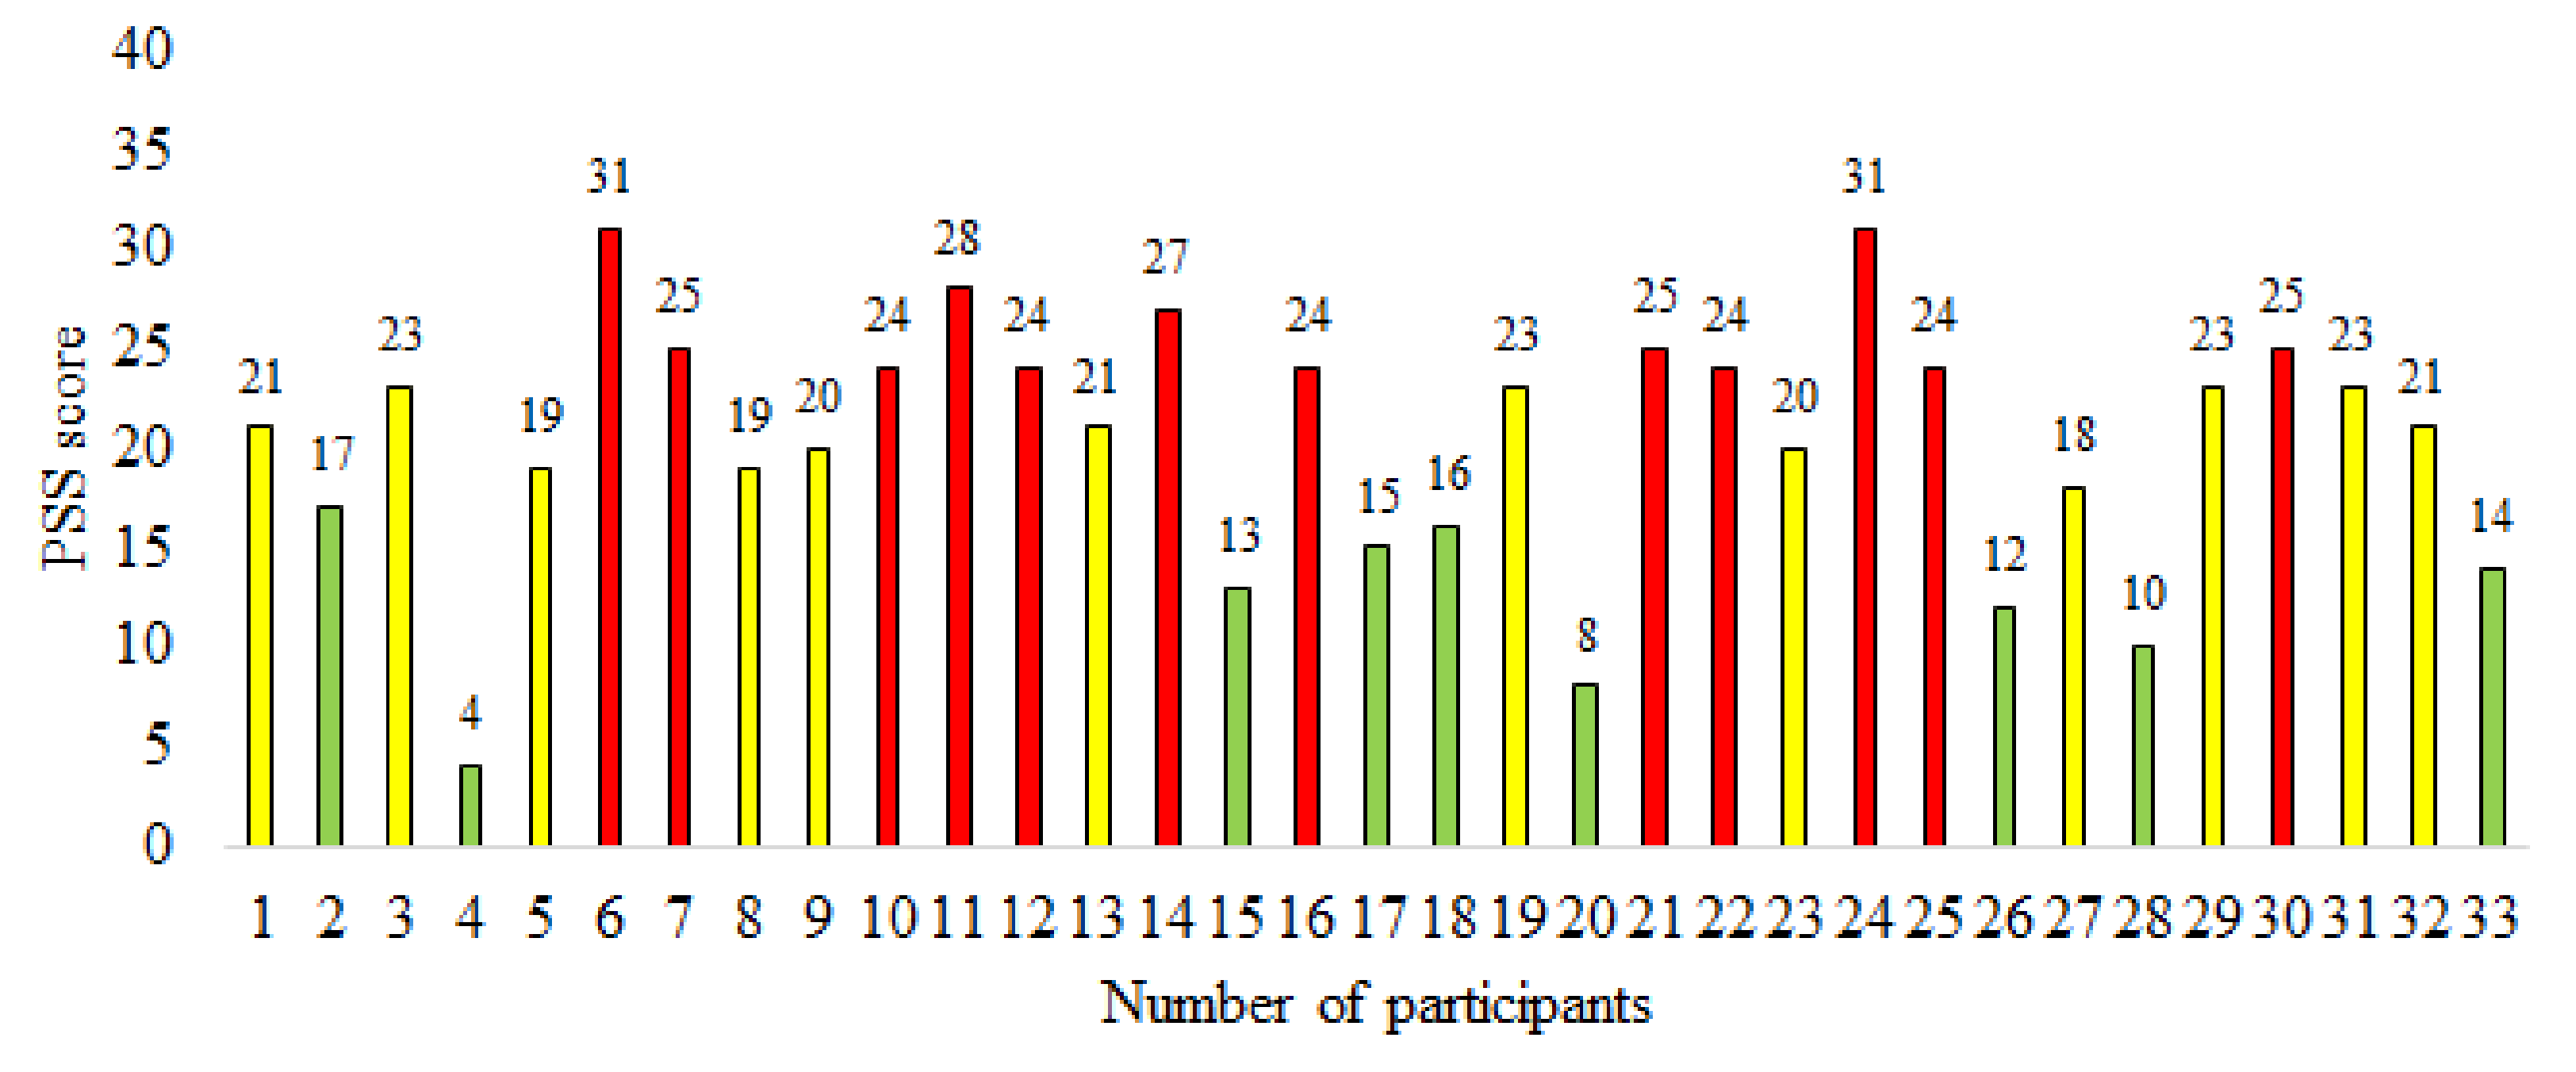
- We used EEG signals acquired from 33 participants in closed eye conditions using a five-channel EEG headset for long term stress classification (no stimuli used to induce stress) and found that among different feature, three frequency domain features were statistically significant in stress and control groups.
- To the best of our knowledge, this is the first that the stress level of participants was labeled by a psychology expert in an EEG-based study. We showed its feasibility with a validated set of experiments.
- The conventional machine learning classifiers suite well to long-term human stress classification and give better performance using psychological expert labeling.
2. Related Work
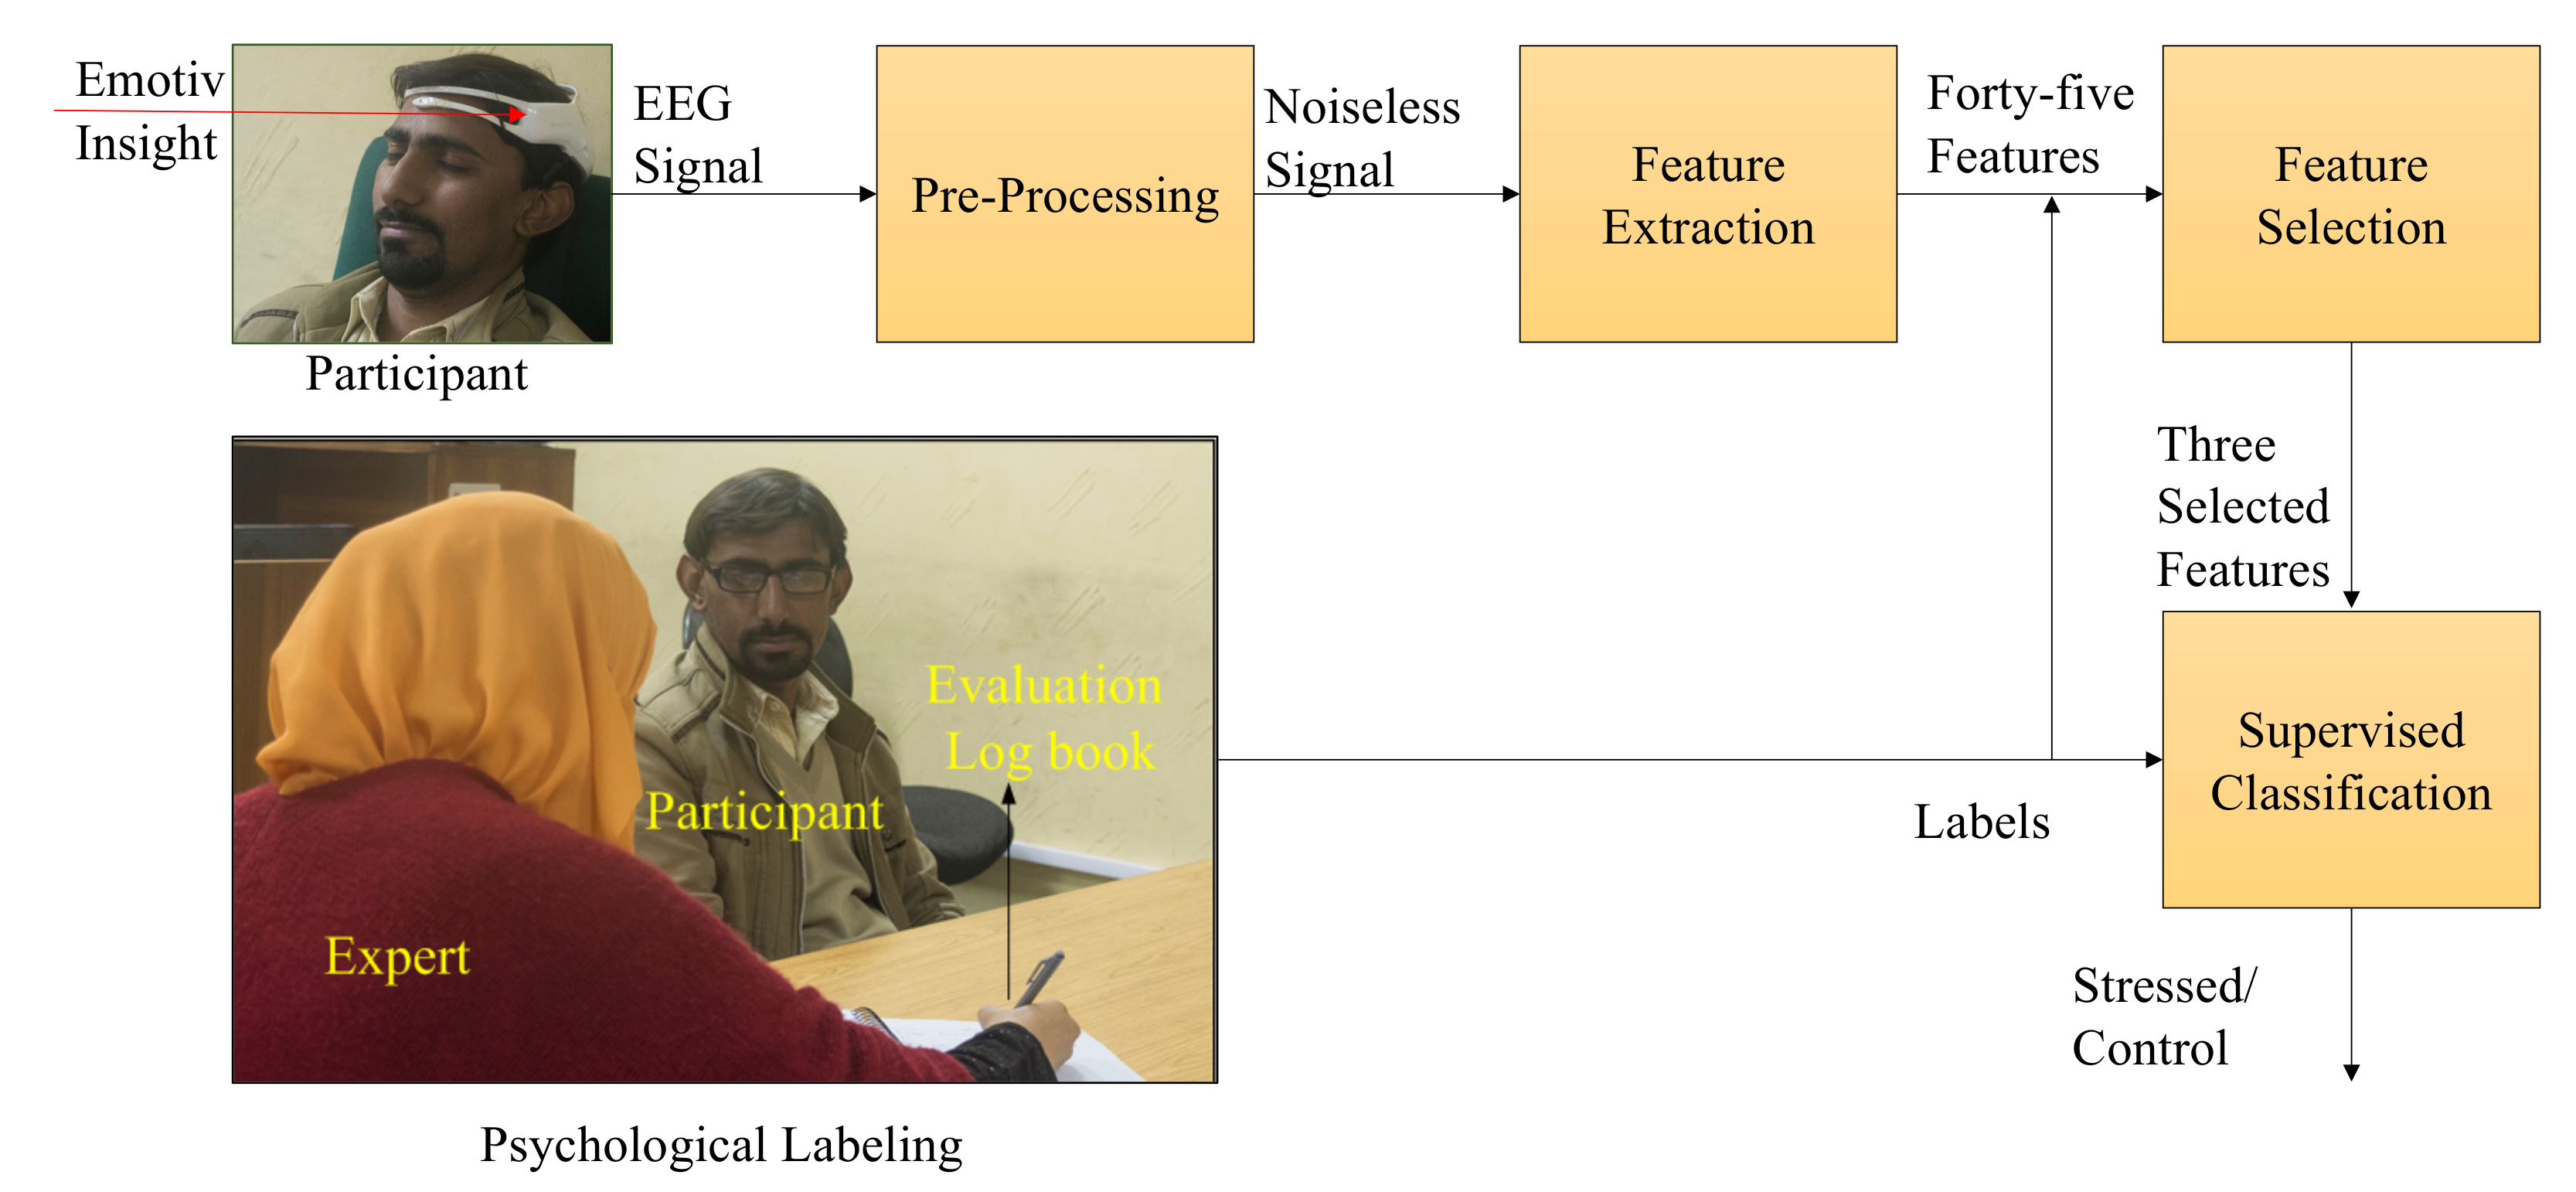
3. Methodology
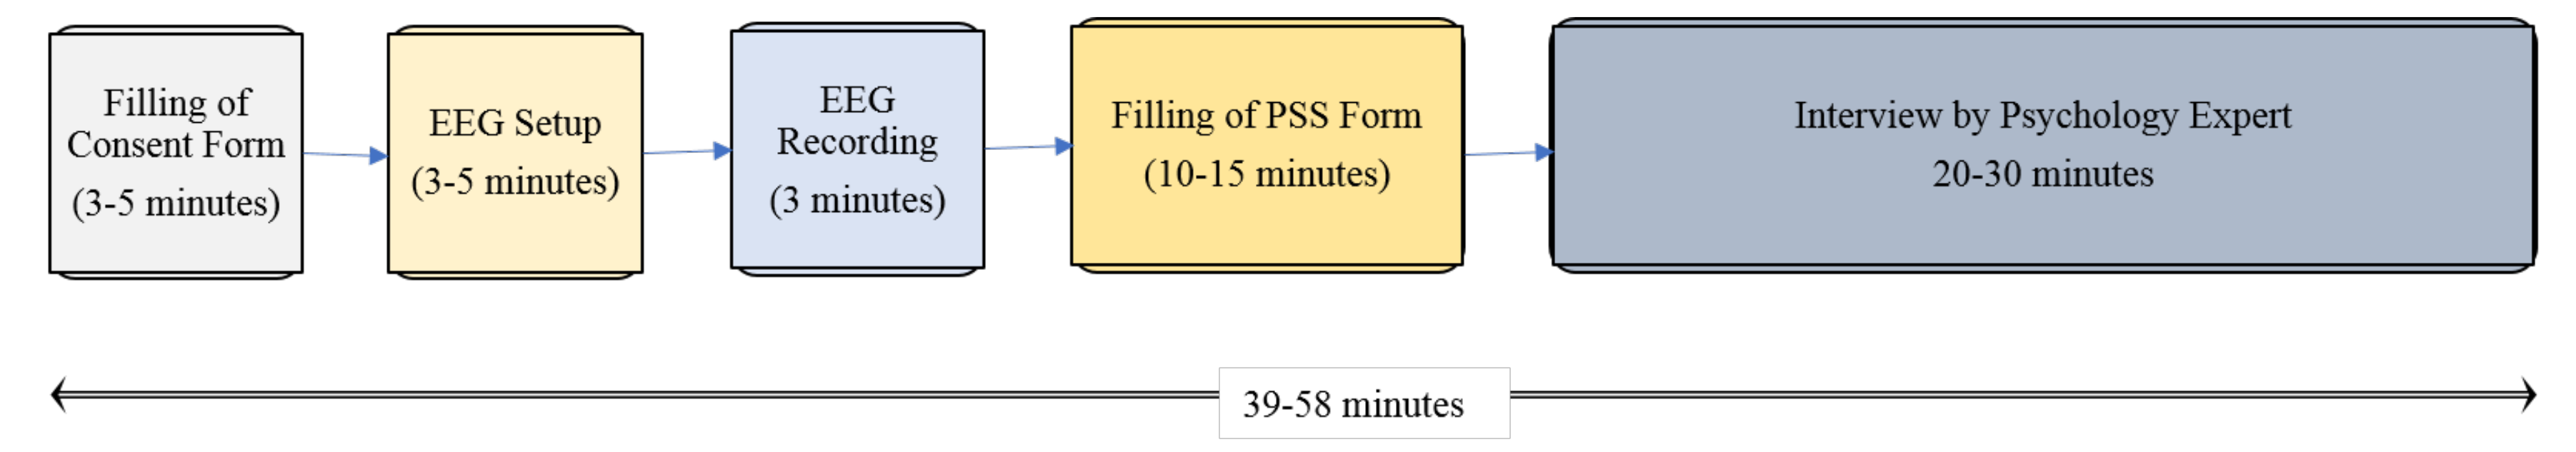
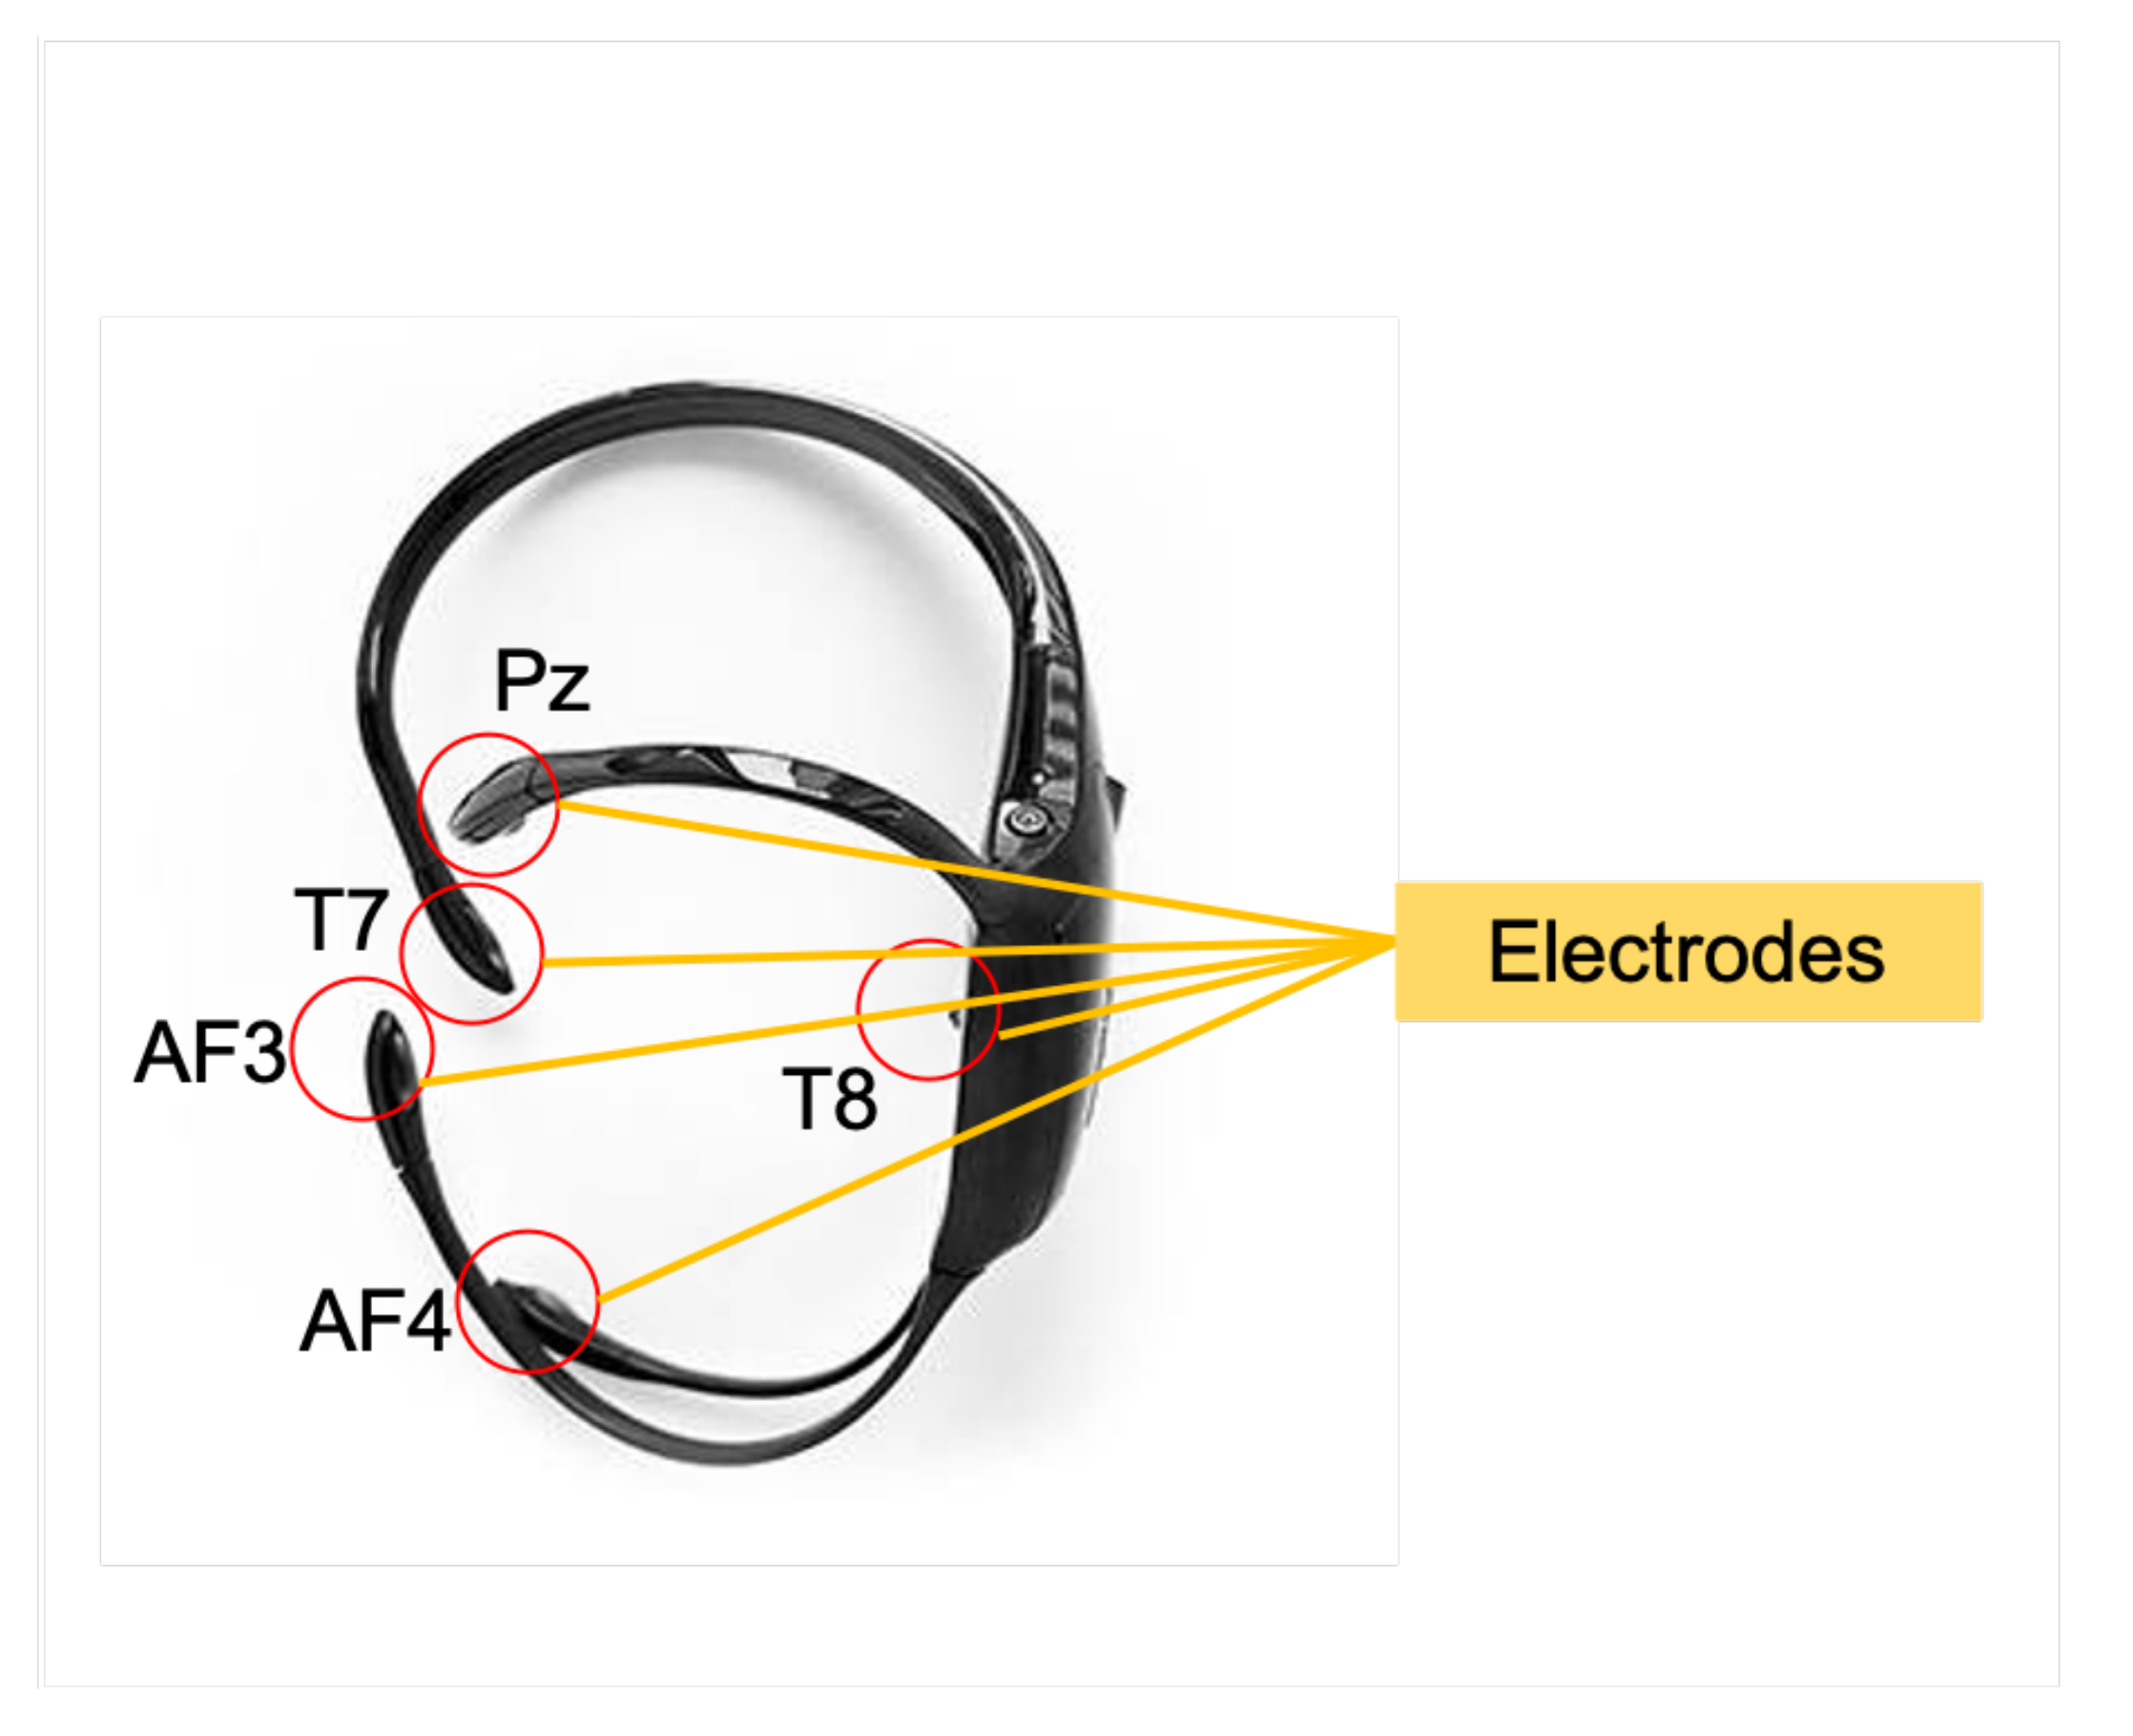
3.1. Data Acquisition
3.2. Pre-Processing
3.3. Feature Extraction and Selection
3.4. Subject Labeling
3.5. Stress Classification
3.5.1. Support Vector Machine
3.5.2. The Naive Bayes
3.5.3. K-Nearest Neighbors
3.5.4. Logistic Regression
3.5.5. Multi-Layer Perceptron
4. Results and Discussion
4.1. Dataset
4.2. Performance Parameters
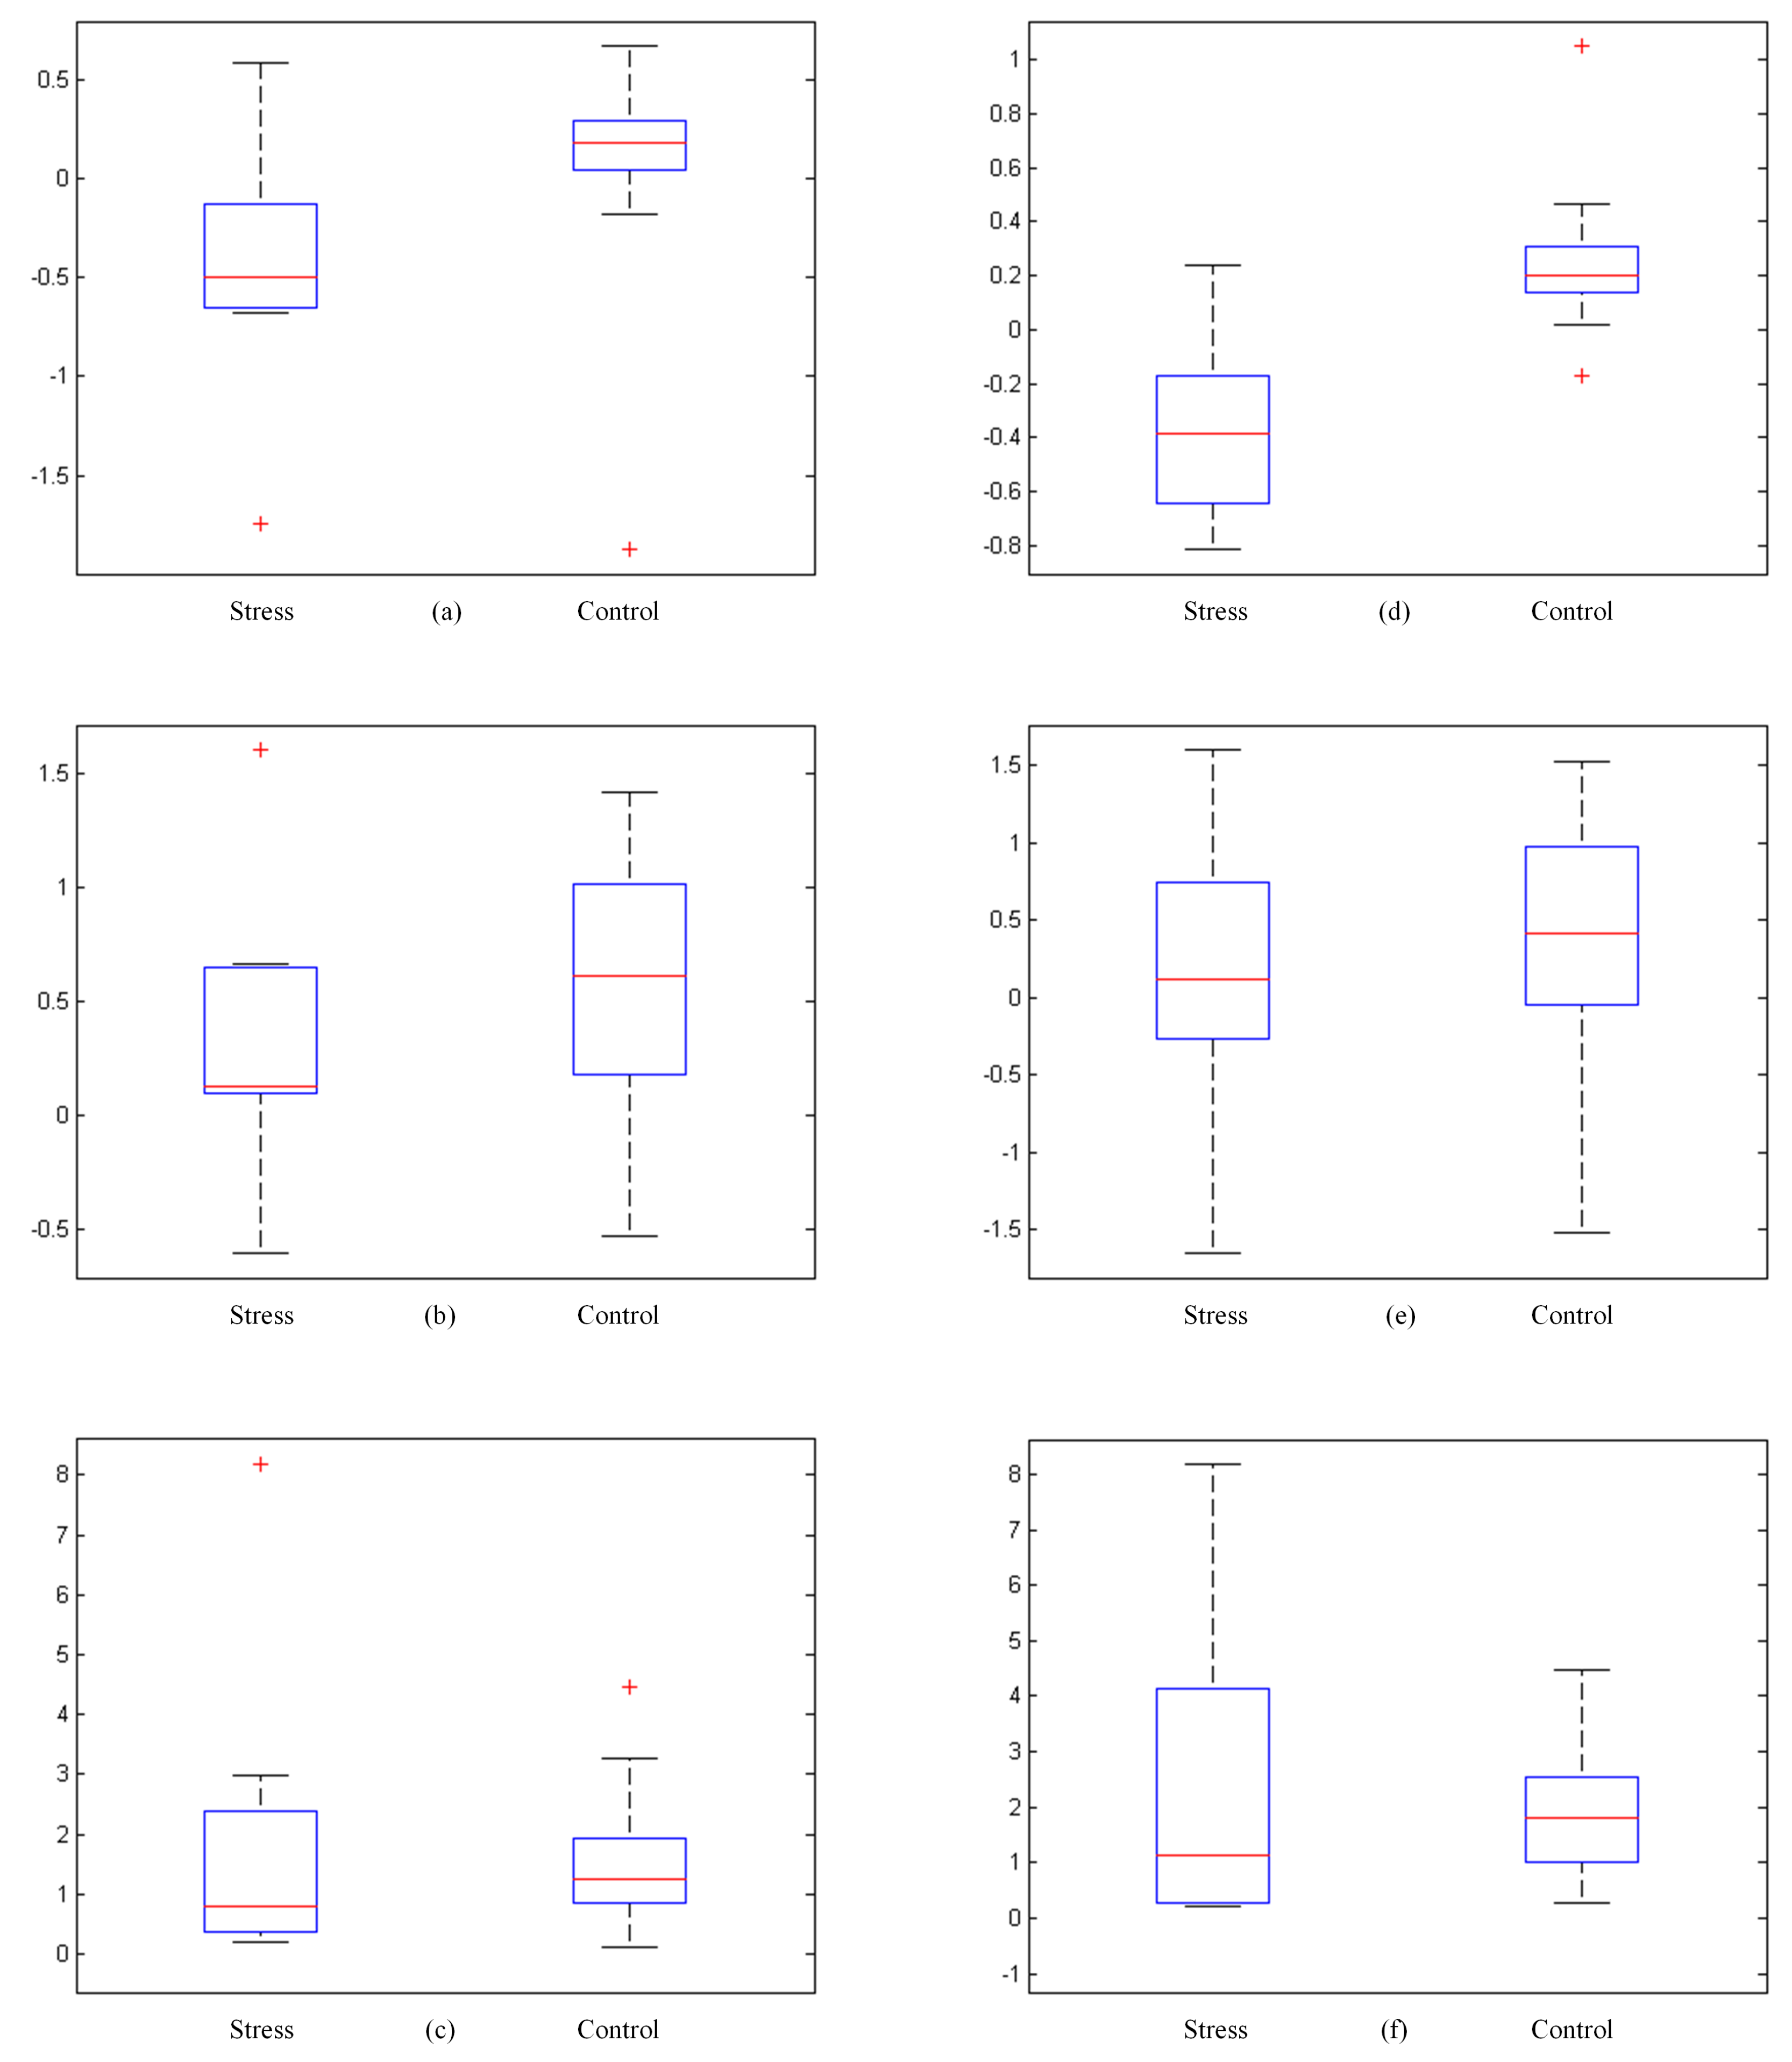
4.3. Stress and Control Group
4.4. Feature Selection Using t-Test
4.5. Classification
4.6. Discussion
5. Conclusions
Author Contributions
Funding
Conflicts of Interest
References
- Selye, H. The stress syndrome. Am. J. Nurs. 1965, 65, 97–99. [Google Scholar]
- Heim, C.; Nemeroff, C.B. Neurobiology of early life stress: Clinical studies. Semin. Clin. Neuropsychiatry 2002, 7, 147–159. [Google Scholar] [CrossRef] [PubMed]
- McGonagle, K.A.; Kessler, R.C. Chronic stress, acute stress, and depressive symptoms. Am. J. Commun. Psychol. 1990, 18, 681–706. [Google Scholar] [CrossRef] [PubMed]
- Cohen, S.; Janicki-Deverts, D.; Miller, G.E. Psychological stress and disease. JAMA 2007, 298, 1685–1687. [Google Scholar] [CrossRef]
- Steptoe, A.; Kivimäki, M. Stress and cardiovascular disease. Nat. Rev. Cardiol. 2012, 9, 360. [Google Scholar] [CrossRef]
- Van Praag, H. Can stress cause depression? Prog. Neuro-Psychopharmacol. Biol. Psychiatry 2004, 28, 891–907. [Google Scholar] [CrossRef]
- Hammen, C.; Dalton, E.D.; Thompson, S.M. Measurement of chronic stress. Encycl. Clin. Psychol. 2014, 1–7. [Google Scholar] [CrossRef]
- Sobell, L.C.; Toneatto, T.; Sobell, M.B.; Schuller, R.; Maxwell, M. A procedure for reducing errors in reports of life events. J. Psychosom. Res. 1990, 34, 163–170. [Google Scholar] [CrossRef]
- McQuaid, J.R.; Monroe, S.M.; Roberts, J.R.; Johnson, S.L.; Garamoni, G.L.; Kupfer, D.J.; Frank, E. Toward the standardization of life stress assessment: Definitional discrepancies and inconsistencies in methods. Stress Med. 1992, 8, 47–56. [Google Scholar] [CrossRef]
- Peng, H.; Hu, B.; Zheng, F.; Fan, D.; Zhao, W.; Chen, X.; Yang, Y.; Cai, Q. A method of identifying chronic stress by EEG. Pers. Ubiquitous Comput. 2013, 17, 1341–1347. [Google Scholar] [CrossRef]
- Zheng, R.; Yamabe, S.; Nakano, K.; Suda, Y. Biosignal analysis to assess mental stress in automatic driving of trucks: Palmar perspiration and masseter electromyography. Sensors 2015, 15, 5136–5150. [Google Scholar] [CrossRef] [PubMed] [Green Version]
- Ahn, J.W.; Ku, Y.; Kim, H.C. A Novel Wearable EEG and ECG Recording System for Stress Assessment. Sensors 2019, 19, 1991. [Google Scholar] [CrossRef] [PubMed] [Green Version]
- Mehreen, A.; Anwar, S.M.; Haseeb, M.; Majid, M.; Ullah, M.O. A Hybrid Scheme for Drowsiness Detection using Wearable Sensors. IEEE Sens. J. 2019, 19, 5119–5126. [Google Scholar] [CrossRef]
- Asif, A.; Majid, M.; Anwar, S.M. Human stress classification using EEG signals in response to music tracks. Comput. Biol. Med. 2019. [Google Scholar] [CrossRef] [PubMed]
- Saeed, U.; Muhammad, S.; Anwar, S.M.; Majid, M.; Awais, M.; Alnowami, M. Selection of Neural Oscillatory Features for Human Stress Classification with Single Channel EEG Headset. BioMed Res. Int. 2018, 2018, 1049257. [Google Scholar] [CrossRef] [Green Version]
- Raheel, A.; Anwar, S.M.; Majid, M. Emotion recognition in response to traditional and tactile enhanced multimedia using electroencephalography. Mult. Tools Appl. 2018, 78, 1–15. [Google Scholar] [CrossRef]
- Anwar, S.; Saeed, S.; Majid, M.; Usman, S.; Mehmood, C.; Liu, W. A Game Player Expertise Level Classification System Using Electroencephalography (EEG). Appl. Sci. 2018, 8, 18. [Google Scholar] [CrossRef] [Green Version]
- Sanei, S.; Chambers, J.A. EEG Signal Processing; Wiely: Hoboken, NJ, USA, 2007. [Google Scholar]
- Al-shargie, F.; Tang, T.B.; Badruddin, N.; Kiguchi, M. Towards multilevel mental stress assessment using SVM with ECOC: An EEG approach. Med. Biol. Eng. Comput. 2018, 56, 125–136. [Google Scholar] [CrossRef]
- Fisch, B. Fisch and Spehlmann’s EEG Primer: Basic Principles of Digital and Analog EEG, 3rd ed.; Elsevier: Amsterdam, The Netherlands, 1999; p. 642. [Google Scholar]
- Davidson, R.J. What does the prefrontal cortex “do” in affect: Perspectives on frontal EEG asymmetry research. Biol. Psychiatry 2004, 67, 219–234. [Google Scholar] [CrossRef]
- Papousek, I.; Schulter, G. Covariations of EEG asymmetries and emotional states indicate that activity at frontopolar locations is particularly affected by state factors. Psychophysiology 2002, 39, 350–360. [Google Scholar] [CrossRef]
- Lobo, I.; Portugal, L.C.; Figueira, I.; Volchan, E.; David, I.; Pereira, M.G.; de Oliveira, L. EEG correlates of the severity of posttraumatic stress symptoms: A systematic review of the dimensional PTSD literature. J. Affect. Disord. 2015, 183, 210–220. [Google Scholar] [CrossRef] [PubMed]
- Goncharova, I.I.; Barlow, J.S. Changes in EEG mean frequency and spectral purity during spontaneous alpha blocking. Electroencephalogr. Clin. Neurophysiol. 1990, 76, 197–204. [Google Scholar] [CrossRef]
- Subhani, A.R.; Mumtaz, W.; Saad, M.N.B.M.; Kamel, N.; Malik, A.S. Machine learning framework for the detection of mental stress at multiple levels. IEEE Access 2017, 5, 13545–13556. [Google Scholar] [CrossRef]
- Cai, H.; Han, J.; Chen, Y.; Sha, X.; Wang, Z.; Hu, B.; Yang, J.; Feng, L.; Ding, Z.; Chen, Y.; et al. A Pervasive Approach to EEG-Based Depression Detection. Complexity 2018, 2018, 5238028. [Google Scholar] [CrossRef]
- Baghdadi, A.; Aribi, Y.; Alimi, A.M. Efficient Human Stress Detection System Based on Frontal Alpha Asymmetry. In Proceedings of the 24th International Conference, ICONIP 2017, Guangzhou, China, 14–18 November 2017; pp. 858–867. [Google Scholar]
- Aspinall, P.; Mavros, P.; Coyne, R.; Roe, J. The urban brain: analysing outdoor physical activity with mobile EEG. Br. J. Sports Med. 2015, 49, 272–276. [Google Scholar] [CrossRef] [Green Version]
- Düsing, R.; Tops, M.; Radtke, E.L.; Kuhl, J.; Quirin, M. Relative frontal brain asymmetry and cortisol release after social stress: The role of action orientation. Biol. Psychiatry 2016, 115, 86–93. [Google Scholar] [CrossRef]
- Kaiser, A.K.; Doppelmayr, M.; Iglseder, B. Electroencephalogram alpha asymmetry in geriatric depression. Zeit. Für Geront. Und Ger. 2018, 51, 200–205. [Google Scholar] [CrossRef]
- Seo, S.H.; Lee, J.T. Stress and EEG. In Convergence and Hybrid Information Technologies; InTech: Rijeka, Croatia, 2010. [Google Scholar]
- Gärtner, M.; Grimm, S.; Bajbouj, M. Frontal midline theta oscillations during mental arithmetic: Effects of stress. Front. Behav. Neurosci. 2015, 9, 96. [Google Scholar] [CrossRef] [Green Version]
- Saeed, S.M.U.; Anwar, S.M.; Majid, M. Quantification of human stress using commercially available single channel EEG Headset. IEICE Trans. Inf. Syst. 2017, 100, 2241–2244. [Google Scholar] [CrossRef] [Green Version]
- Minguillon, J.; Lopez-Gordo, M.A.; Pelayo, F. Stress assessment by prefrontal relative gamma. Front. Comput. Neurosci. 2016, 10, 101. [Google Scholar] [CrossRef] [Green Version]
- Arsalan, A.; Majid, M.; Butt, A.R.; Anwar, S.M. Classification of Perceived Mental Stress Using a Commercially Available EEG Headband. IEEE J. Biomed. Health Inform. 2019, 23, 2257–2264. [Google Scholar] [CrossRef] [PubMed]
- Kotsiantis, S.B.; Zaharakis, I.; Pintelas, P. Supervised machine learning: A review of classification techniques. Emerg. Artif. Intell. Appl. Comput. Eng. 2007, 160, 3–24. [Google Scholar]
- Association, W.M. World Medical Association Declaration of Helsinki: Ethical principles for medical research involving human subjects. J. Am. Coll. Dent. 2014, 81, 14. [Google Scholar]
- Knaus, J.; Wiese, R.; Janßen, U. The processing of word stress: EEG studies on task-related components. In Proceedings of the 16th International Congress of Phonetic Sciences, Saarbrücken, Germany, 6–10 August 2007; pp. 709–712. [Google Scholar]
- Matsunami, K.; Homma, S.; Han, X.Y.; Jiang, Y.F. Generator sources of EEG large waves elicited by mental stress of memory recall or mental calculation. Jpn. J. Phys. 2001, 51, 621–624. [Google Scholar] [CrossRef]
- Lewis, R.S.; Weekes, N.Y.; Wang, T.H. The effect of a naturalistic stressor on frontal EEG asymmetry, stress, and health. Biol. Psychiatry 2007, 75, 239–247. [Google Scholar] [CrossRef]
- Seo, S.; Gil, Y.; Lee, J. The relation between affective style of stressor on EEG asymmetry and stress scale during multimodal task. In Proceedings of the Third International Conference on Convergence and Hybrid Information Technology, CCIT’08, Busan, Korea, 11–13 November 2008; Volume 1, pp. 461–466. [Google Scholar]
- Miller, P.F.; Light, K.C.; Bragdon, E.E.; Ballenger, M.N.; Herbst, M.C.; Maixner, W.; Hinderliter, A.L.; Atkinson, S.S.; Koch, G.G.; Sheps, D.S. Beta-endorphin response to exercise and mental stress in patients with ischemic heart disease. J. Psychiatr. Res. 1993, 37, 455–465. [Google Scholar] [CrossRef]
- Hassellund, S.S.; Flaa, A.; Sandvik, L.; Kjeldsen, S.E.; Rostrup, M. Long-term stability of cardiovascular and catecholamine responses to stress tests: An 18-year follow-up study. Hypertension 2010, 55, 131–136. [Google Scholar] [CrossRef] [Green Version]
- Khosrowabadi, R.; Quek, C.; Ang, K.K.; Tung, S.W.; Heijnen, M. A Brain-Computer Interface for classifying EEG correlates of chronic mental stress. In Proceedings of the 2011 International Joint Conference on Neural Networks, San Jose, CA, USA, 31 July–5 August 2011; pp. 757–762. [Google Scholar]
- Lin, C.T.; Ko, L.W.; Chiou, J.C.; Duann, J.R.; Huang, R.S.; Liang, S.F.; Chiu, T.W.; Jung, T.P. Noninvasive neural prostheses using mobile and wireless EEG. IEEE 2008, 96, 1167–1183. [Google Scholar]
- Vijean, V.; Hariharan, M.; Saidatul, A.; Yaacob, S. Mental tasks classifications using S-transform for BCI applications. In Proceedings of the 2011 IEEE Conference on Sustainable Utilization and Development in Engineering and Technology (STUDENT), Selangor Darul Ehsan, Malaysia, 20–21 October 2011; pp. 69–73. [Google Scholar]
- Jun, G.; Smitha, K. EEG based stress level identification. In Proceedings of the 2016 IEEE International Conference on Systems, Man, and Cybernetics (SMC), Budapest, Hungary, 9–12 October 2016; pp. 3270–3274. [Google Scholar]


| Sr. No. | Symptom | Type of Symptom |
|---|---|---|
| 1 | Aches and pains | Physical |
| 2 | Diarrhea or constipation | Physical |
| 3 | Nausea & Physical pain | Physical |
| 4 | Dizziness | Physical |
| 5 | Chest pain | Physical |
| 6 | Rapid heart beat | Physical |
| 7 | Depression or general happiness | Emotional |
| 8 | Anxiety or Agitation | Emotional |
| 9 | Moodiness | Emotional |
| 10 | Irritability | Emotional |
| 11 | Feeling overwhelmed | Emotional |
| 12 | Loneliness and isolation | Emotional |
| 13 | Memory problems | Behavioral and Cognitive |
| 14 | Inability to concentrate | Behavioral and Cognitive |
| 15 | Poor judgment | Behavioral and Cognitive |
| 16 | Seeing only the negative | Behavioral and Cognitive |
| 17 | Anxious or racing thoughts | Behavioral and Cognitive |
| 18 | Constant worrying | Behavioral and Cognitive |
| Participant No. | Gender | Age | PSS Score | PSS Label | Expert Label |
|---|---|---|---|---|---|
| 1 | M | 28 | 21 | X | X |
| 2 | M | 29 | 17 | A | X |
| 3 | M | 23 | 23 | X | X |
| 4 | M | 32 | 4 | A | A |
| 5 | F | 19 | 19 | X | A |
| 6 | F | 18 | 31 | B | B |
| 7 | M | 24 | 25 | B | X |
| 8 | M | 33 | 19 | X | A |
| 9 | M | 21 | 20 | X | B |
| 10 | M | 22 | 24 | B | X |
| 11 | F | 20 | 28 | B | B |
| 12 | M | 19 | 24 | B | B |
| 13 | M | 24 | 21 | X | A |
| 14 | F | 20 | 27 | B | B |
| 15 | M | 23 | 13 | A | X |
| 16 | M | 21 | 24 | B | X |
| 17 | F | 19 | 15 | A | A |
| 18 | M | 25 | 16 | A | A |
| 19 | F | 21 | 23 | X | B |
| 20 | M | 34 | 8 | A | A |
| 21 | M | 33 | 25 | B | X |
| 22 | F | 21 | 24 | B | B |
| 23 | M | 31 | 20 | X | B |
| 24 | F | 24 | 31 | B | B |
| 25 | F | 20 | 24 | B | B |
| 26 | M | 19 | 12 | A | A |
| 27 | M | 21 | 18 | X | A |
| 28 | M | 21 | 10 | A | X |
| 29 | F | 21 | 23 | X | X |
| 30 | F | 23 | 25 | B | X |
| 31 | M | 20 | 23 | X | X |
| 32 | M | 40 | 21 | X | X |
| 33 | F | 20 | 14 | A | A |
| Labeling Method | Neural Oscillations | ||||||||
|---|---|---|---|---|---|---|---|---|---|
| Channel | delta () | theta () | slow | alpha () | beta () | gamma () | RG | ||
| PSS | AF3 | 0.12 | 0.09 | 0.13 | 0.28 | 0.30 | 0.21 | 0.32 | 0.53 |
| T7 | 0.89 | 0.81 | 0.61 | 0.21 | 0.58 | 0.85 | 0.52 | 0.36 | |
| Pz | 0.15 | 0.16 | 0.16 | 0.19 | 0.29 | 0.46 | 0.64 | 0.30 | |
| T8 | 0.89 | 0.97 | 0.95 | 0.87 | 0.49 | 0.97 | 0.90 | 0.26 | |
| AF4 | 0.14 | 0.12 | 0.13 | 0.22 | 0.20 | 0.15 | 0.23 | 0.79 | |
| Expert | AF3 | 0.65 | 0.50 | 0.51 | 0.08 | 0.95 | 0.04 | 0.03 | 0.23 |
| T7 | 0.92 | 0.60 | 0.51 | 0.15 | 0.99 | 0.42 | 0.54 | 0.99 | |
| Pz | 0.91 | 0.89 | 0.90 | 0.90 | 0.93 | 0.69 | 0.34 | 0.40 | |
| T8 | 0.54 | 0.51 | 0.55 | 0.48 | 0.85 | 0.96 | 0.85 | 0.56 | |
| AF4 | 0.11 | 0.12 | 0.12 | 0.35 | 0.25 | 0.21 | 0.28 | 0.61 | |
| Features | |||||
|---|---|---|---|---|---|
| PSS | 0.23 | 0.39 | 0.91 | 0.45 | 0.11 |
| Expert | 0.21 | 0.07 | 0.49 | 0.73 | 0.0005 |
| Features | SVM | NB | KNN | LR | MLP |
|---|---|---|---|---|---|
| 85.20 | 80.11 | 65.32 | 85.15 | 80.12 | |
| 70.32 | 50.21 | 50.43 | 50.33 | 50.17 | |
| 55.07 | 50.01 | 50.51 | 50.48 | 50.70 | |
| , | 70.45 | 50.65 | 50.09 | 50.65 | 50.02 |
| , | 85.15 | 80.02 | 65.38 | 85.04 | 85.01 |
| , | 80.91 | 80.79 | 65.55 | 85.08 | 85.05 |
| , , | 80.83 | 80.77 | 65.96 | 85.09 | 85.13 |
| Classifier | Average Accuracy | Kappa | F-Measure | MAE | RMAE |
|---|---|---|---|---|---|
| LR | 85.15 | 0.70 | 0.85 | 0.22 | 0.36 |
| SVM | 85.20 | 0.71 | 0.87 | 0.15 | 0.39 |
| Related Work | Stress Inducer | Participants | Classifier | Accuracy |
|---|---|---|---|---|
| Lin et. al. [45] | Driving simulator | 6 | KNN and NBC | 71.77 |
| Vijean et. al. [46] | Mental arithmetic task | 5 | NN | 91.17 |
| Khosrowabadi et. al. [44] | Examination | 26 | KNN and SVM | 90.00 |
| Jun et. al. [47] | Arithmetic task and stroop test | 10 | SVM | 96.00 |
| Al-Shargie et. al. [19] | Mental arithmetic task | 18 | SVM and ECoC | 95.37 |
| Subhani et. al. [25] | MIST | 42 | LR, SVM and NB | 94.60 |
| Saeed et. al. [33] | None | 28 | NB | 71.43 |
| Proposed | None | 33 | SVM | 85.20 |
© 2020 by the authors. Licensee MDPI, Basel, Switzerland. This article is an open access article distributed under the terms and conditions of the Creative Commons Attribution (CC BY) license (http://creativecommons.org/licenses/by/4.0/).
Share and Cite
Saeed, S.M.U.; Anwar, S.M.; Khalid, H.; Majid, M.; Bagci, U. EEG Based Classification of Long-Term Stress Using Psychological Labeling. Sensors 2020, 20, 1886. https://doi.org/10.3390/s20071886
Saeed SMU, Anwar SM, Khalid H, Majid M, Bagci U. EEG Based Classification of Long-Term Stress Using Psychological Labeling. Sensors. 2020; 20(7):1886. https://doi.org/10.3390/s20071886
Chicago/Turabian StyleSaeed, Sanay Muhammad Umar, Syed Muhammad Anwar, Humaira Khalid, Muhammad Majid, and Ulas Bagci. 2020. "EEG Based Classification of Long-Term Stress Using Psychological Labeling" Sensors 20, no. 7: 1886. https://doi.org/10.3390/s20071886
APA StyleSaeed, S. M. U., Anwar, S. M., Khalid, H., Majid, M., & Bagci, U. (2020). EEG Based Classification of Long-Term Stress Using Psychological Labeling. Sensors, 20(7), 1886. https://doi.org/10.3390/s20071886