Exclusion of Estrogenic and Androgenic Steroid Hormones from Municipal Membrane Bioreactor Wastewater Using UF/NF/RO Membranes for Water Reuse Application


Abstract
:
1. Introduction
2. Materials and Methods
2.1. Full-Scale MBR
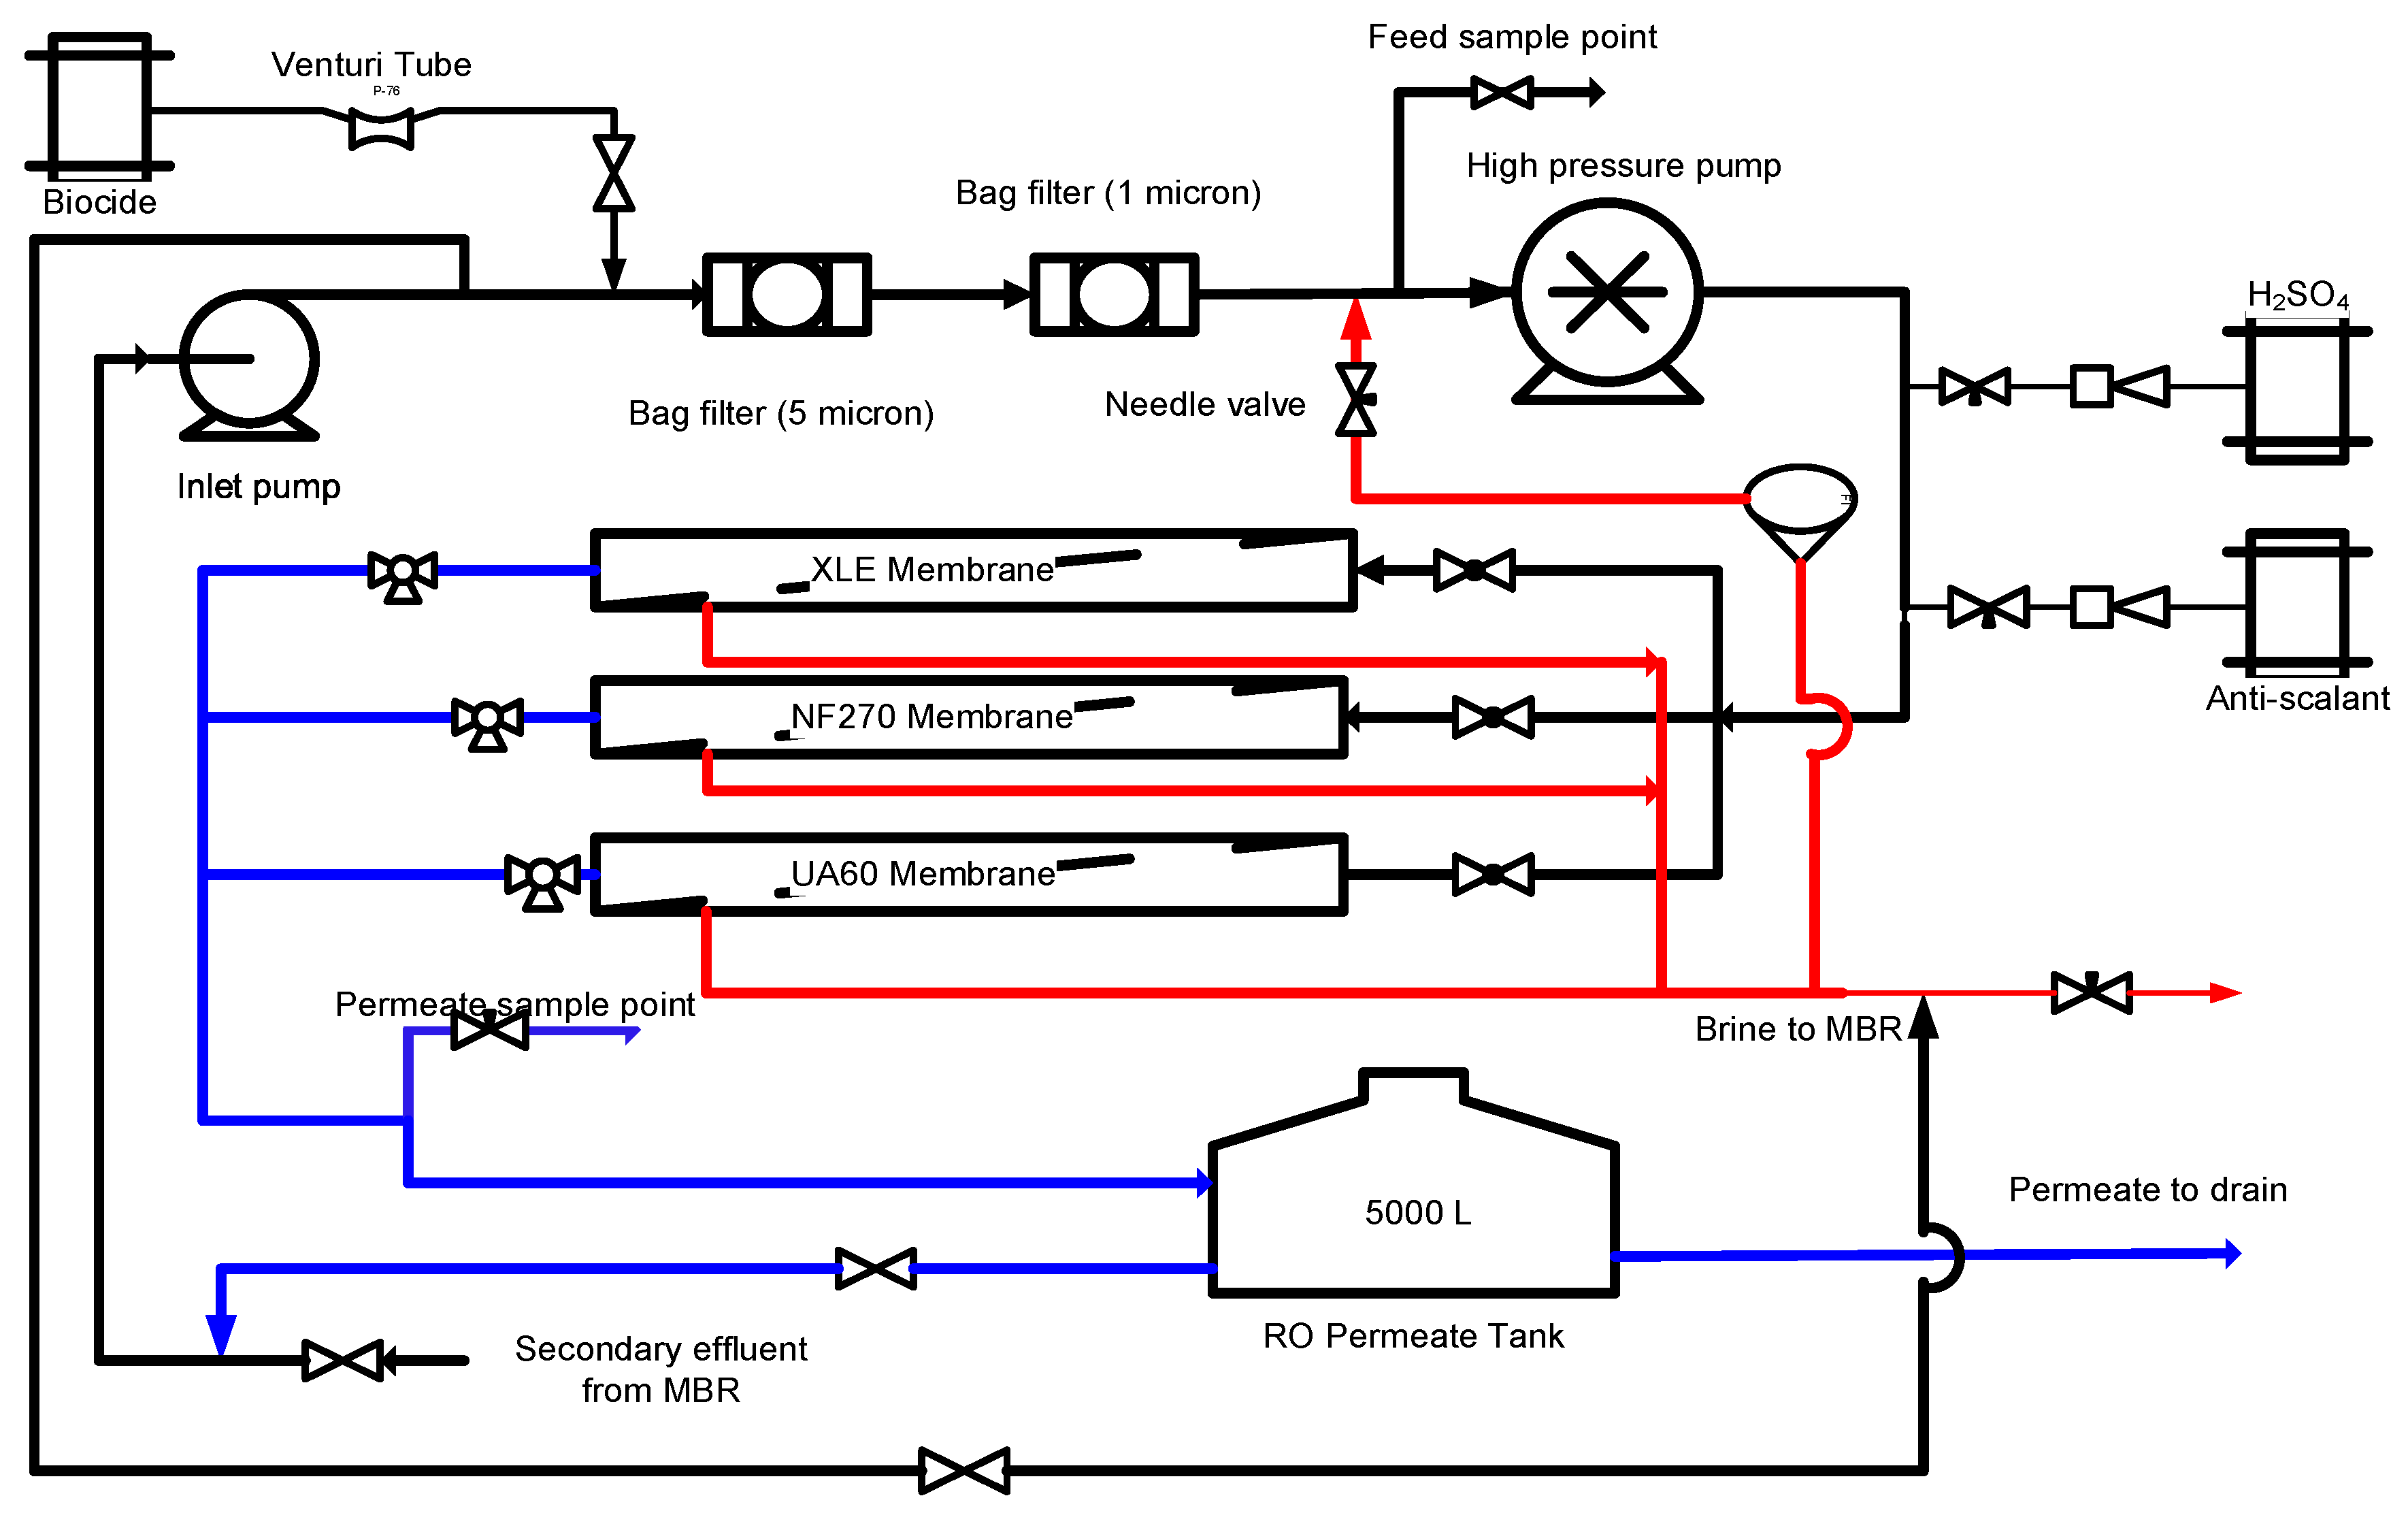
2.2. RO Pilot Plant
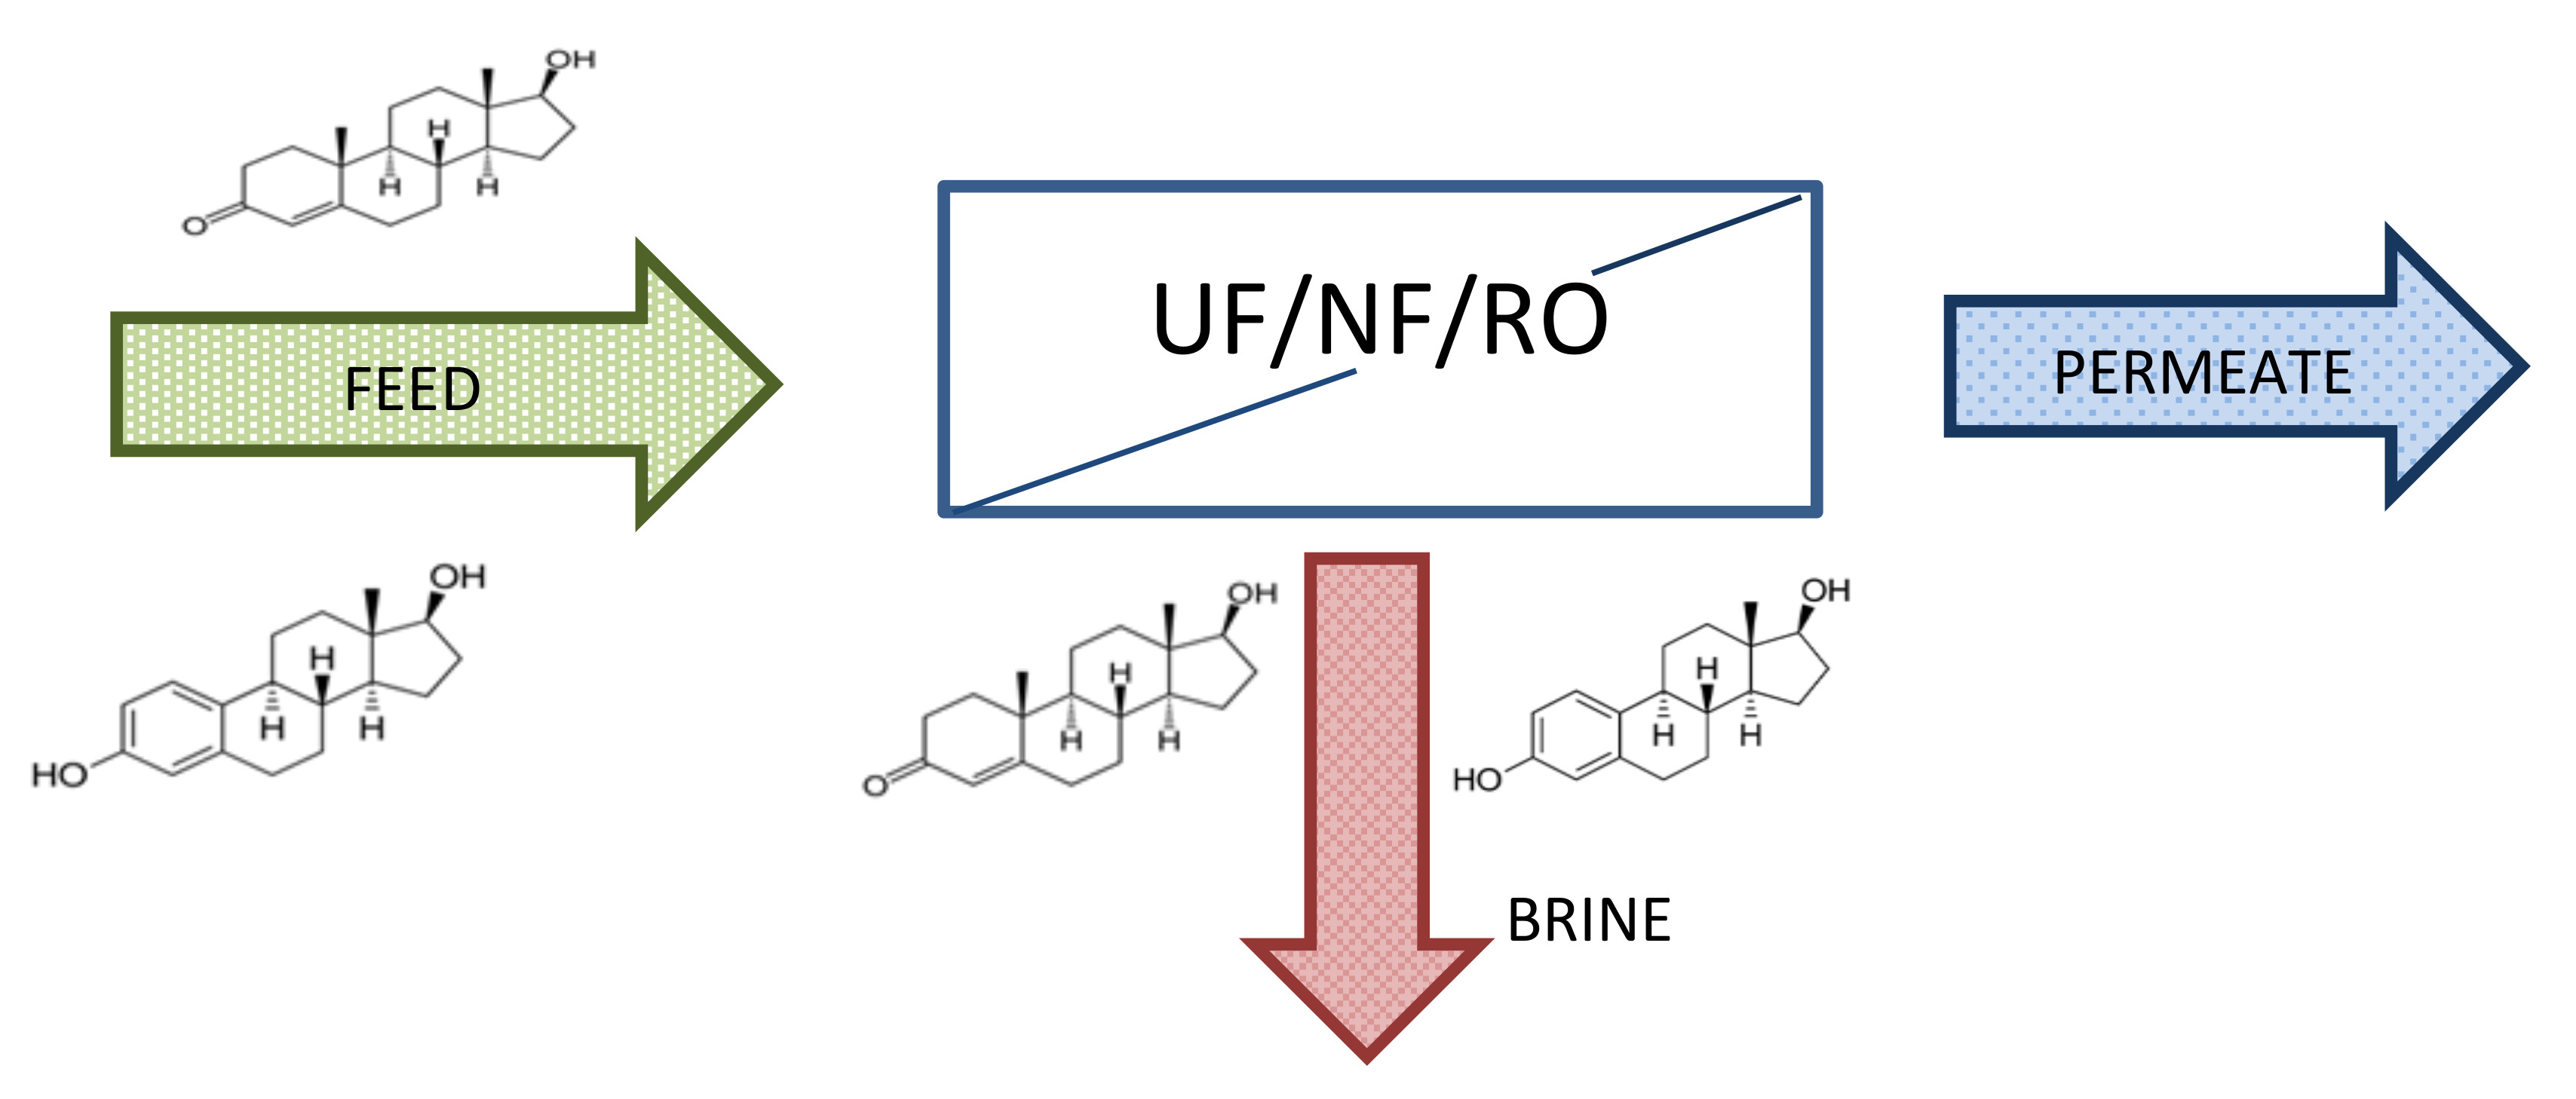
2.3. UF/NF/RO Membranes
2.4. Estrogenic and Androgenic Steroid Hormones
2.5. Sample Collection and Solid Phase Extraction (SPE)
2.6. Enzyme-Linked Immunosorbent Assays (ELISAs)
2.7. In Vitro Recombinant Yeast Estrogen Screen (YES)
2.8. Statistical Analysis
3. Discussion
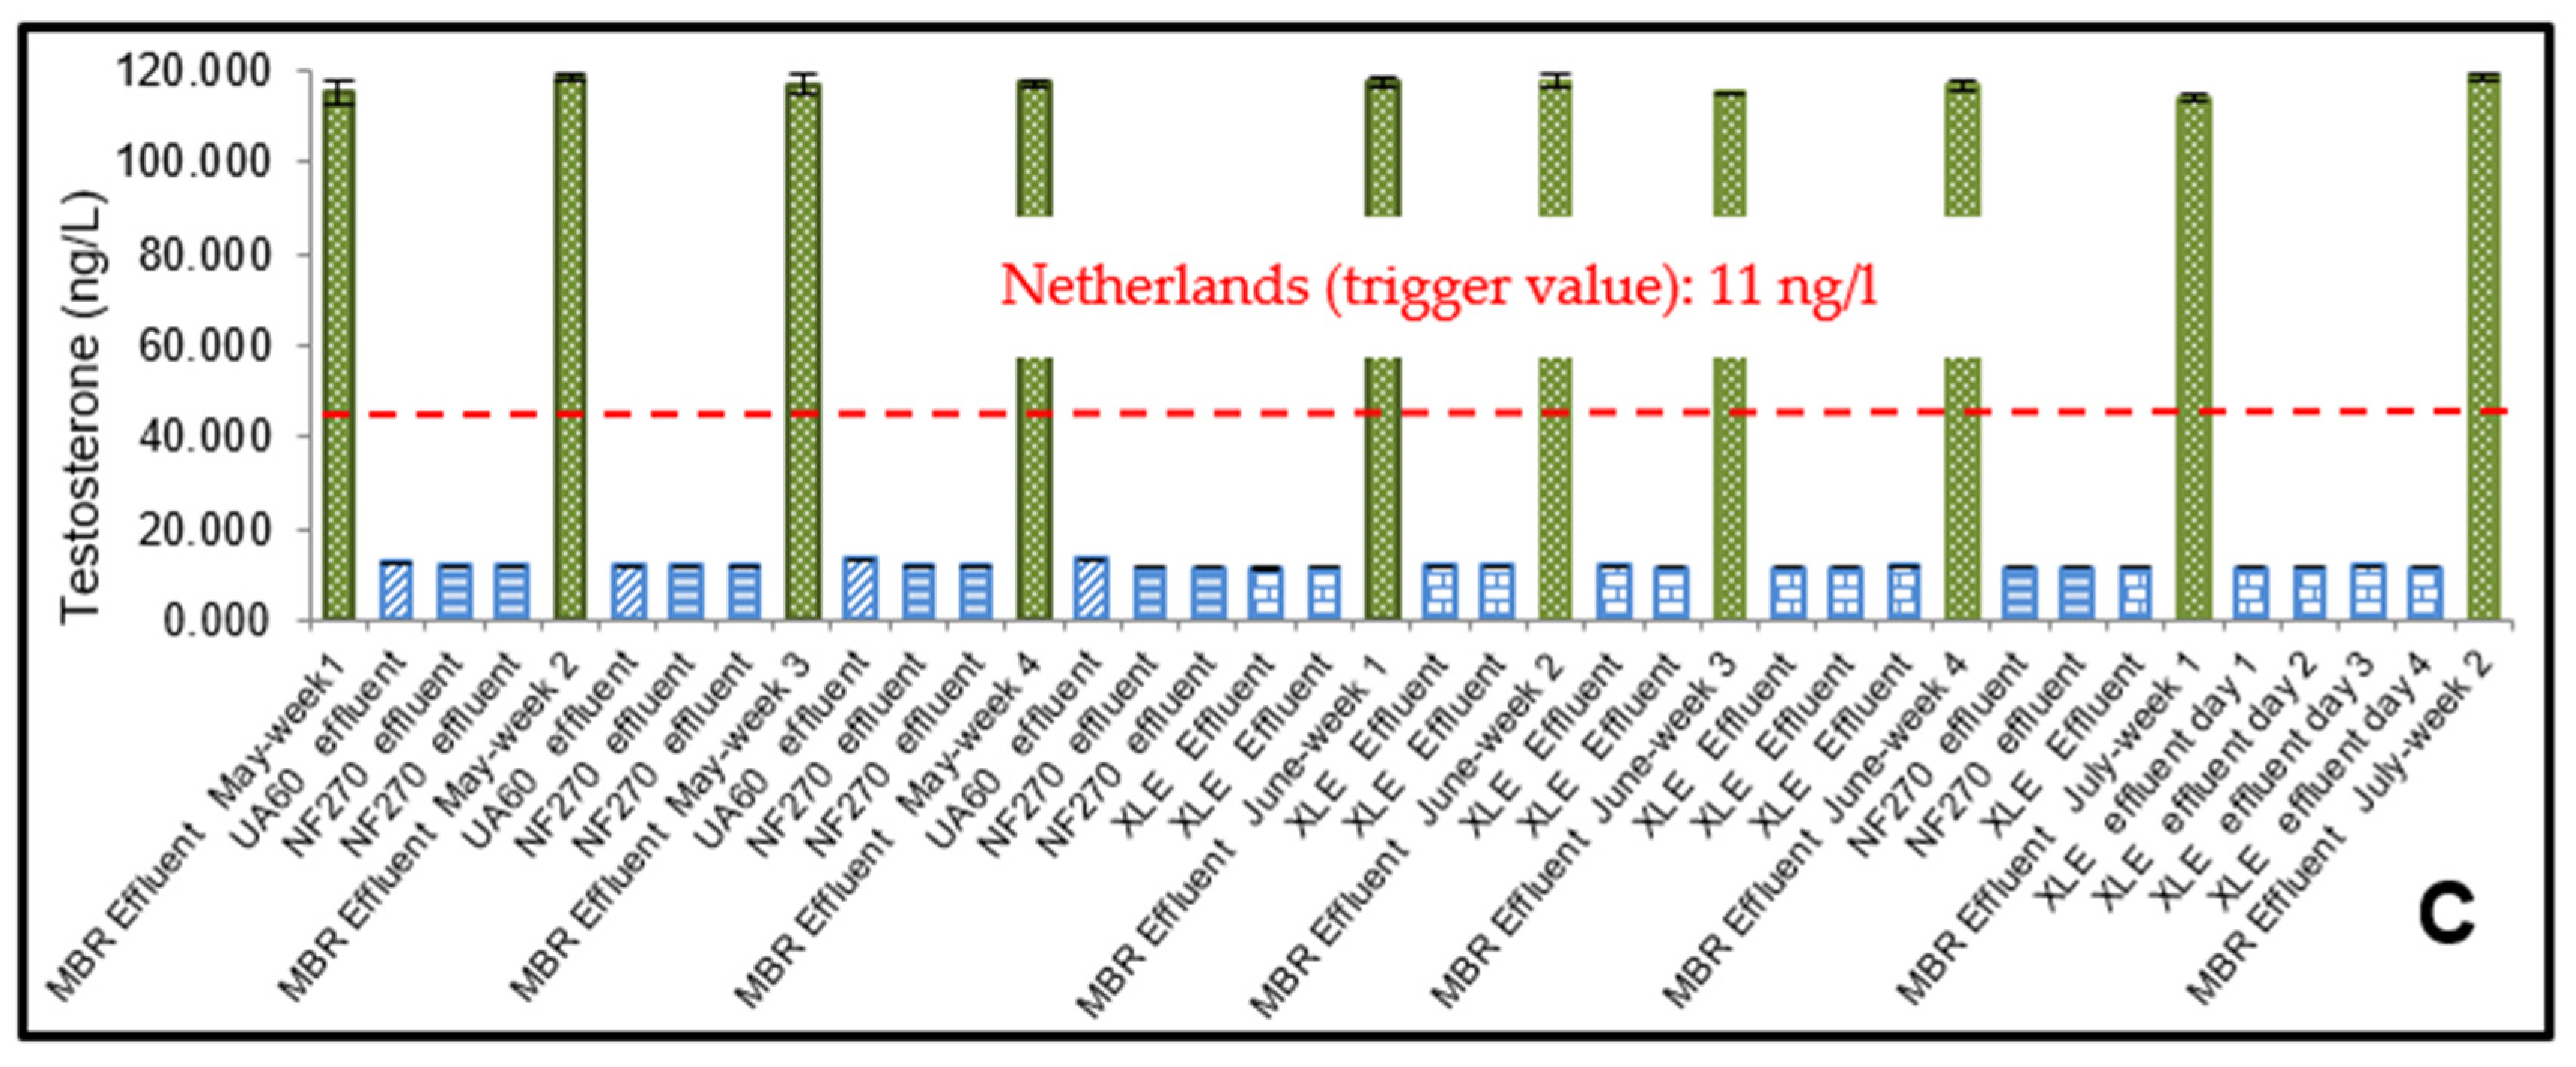
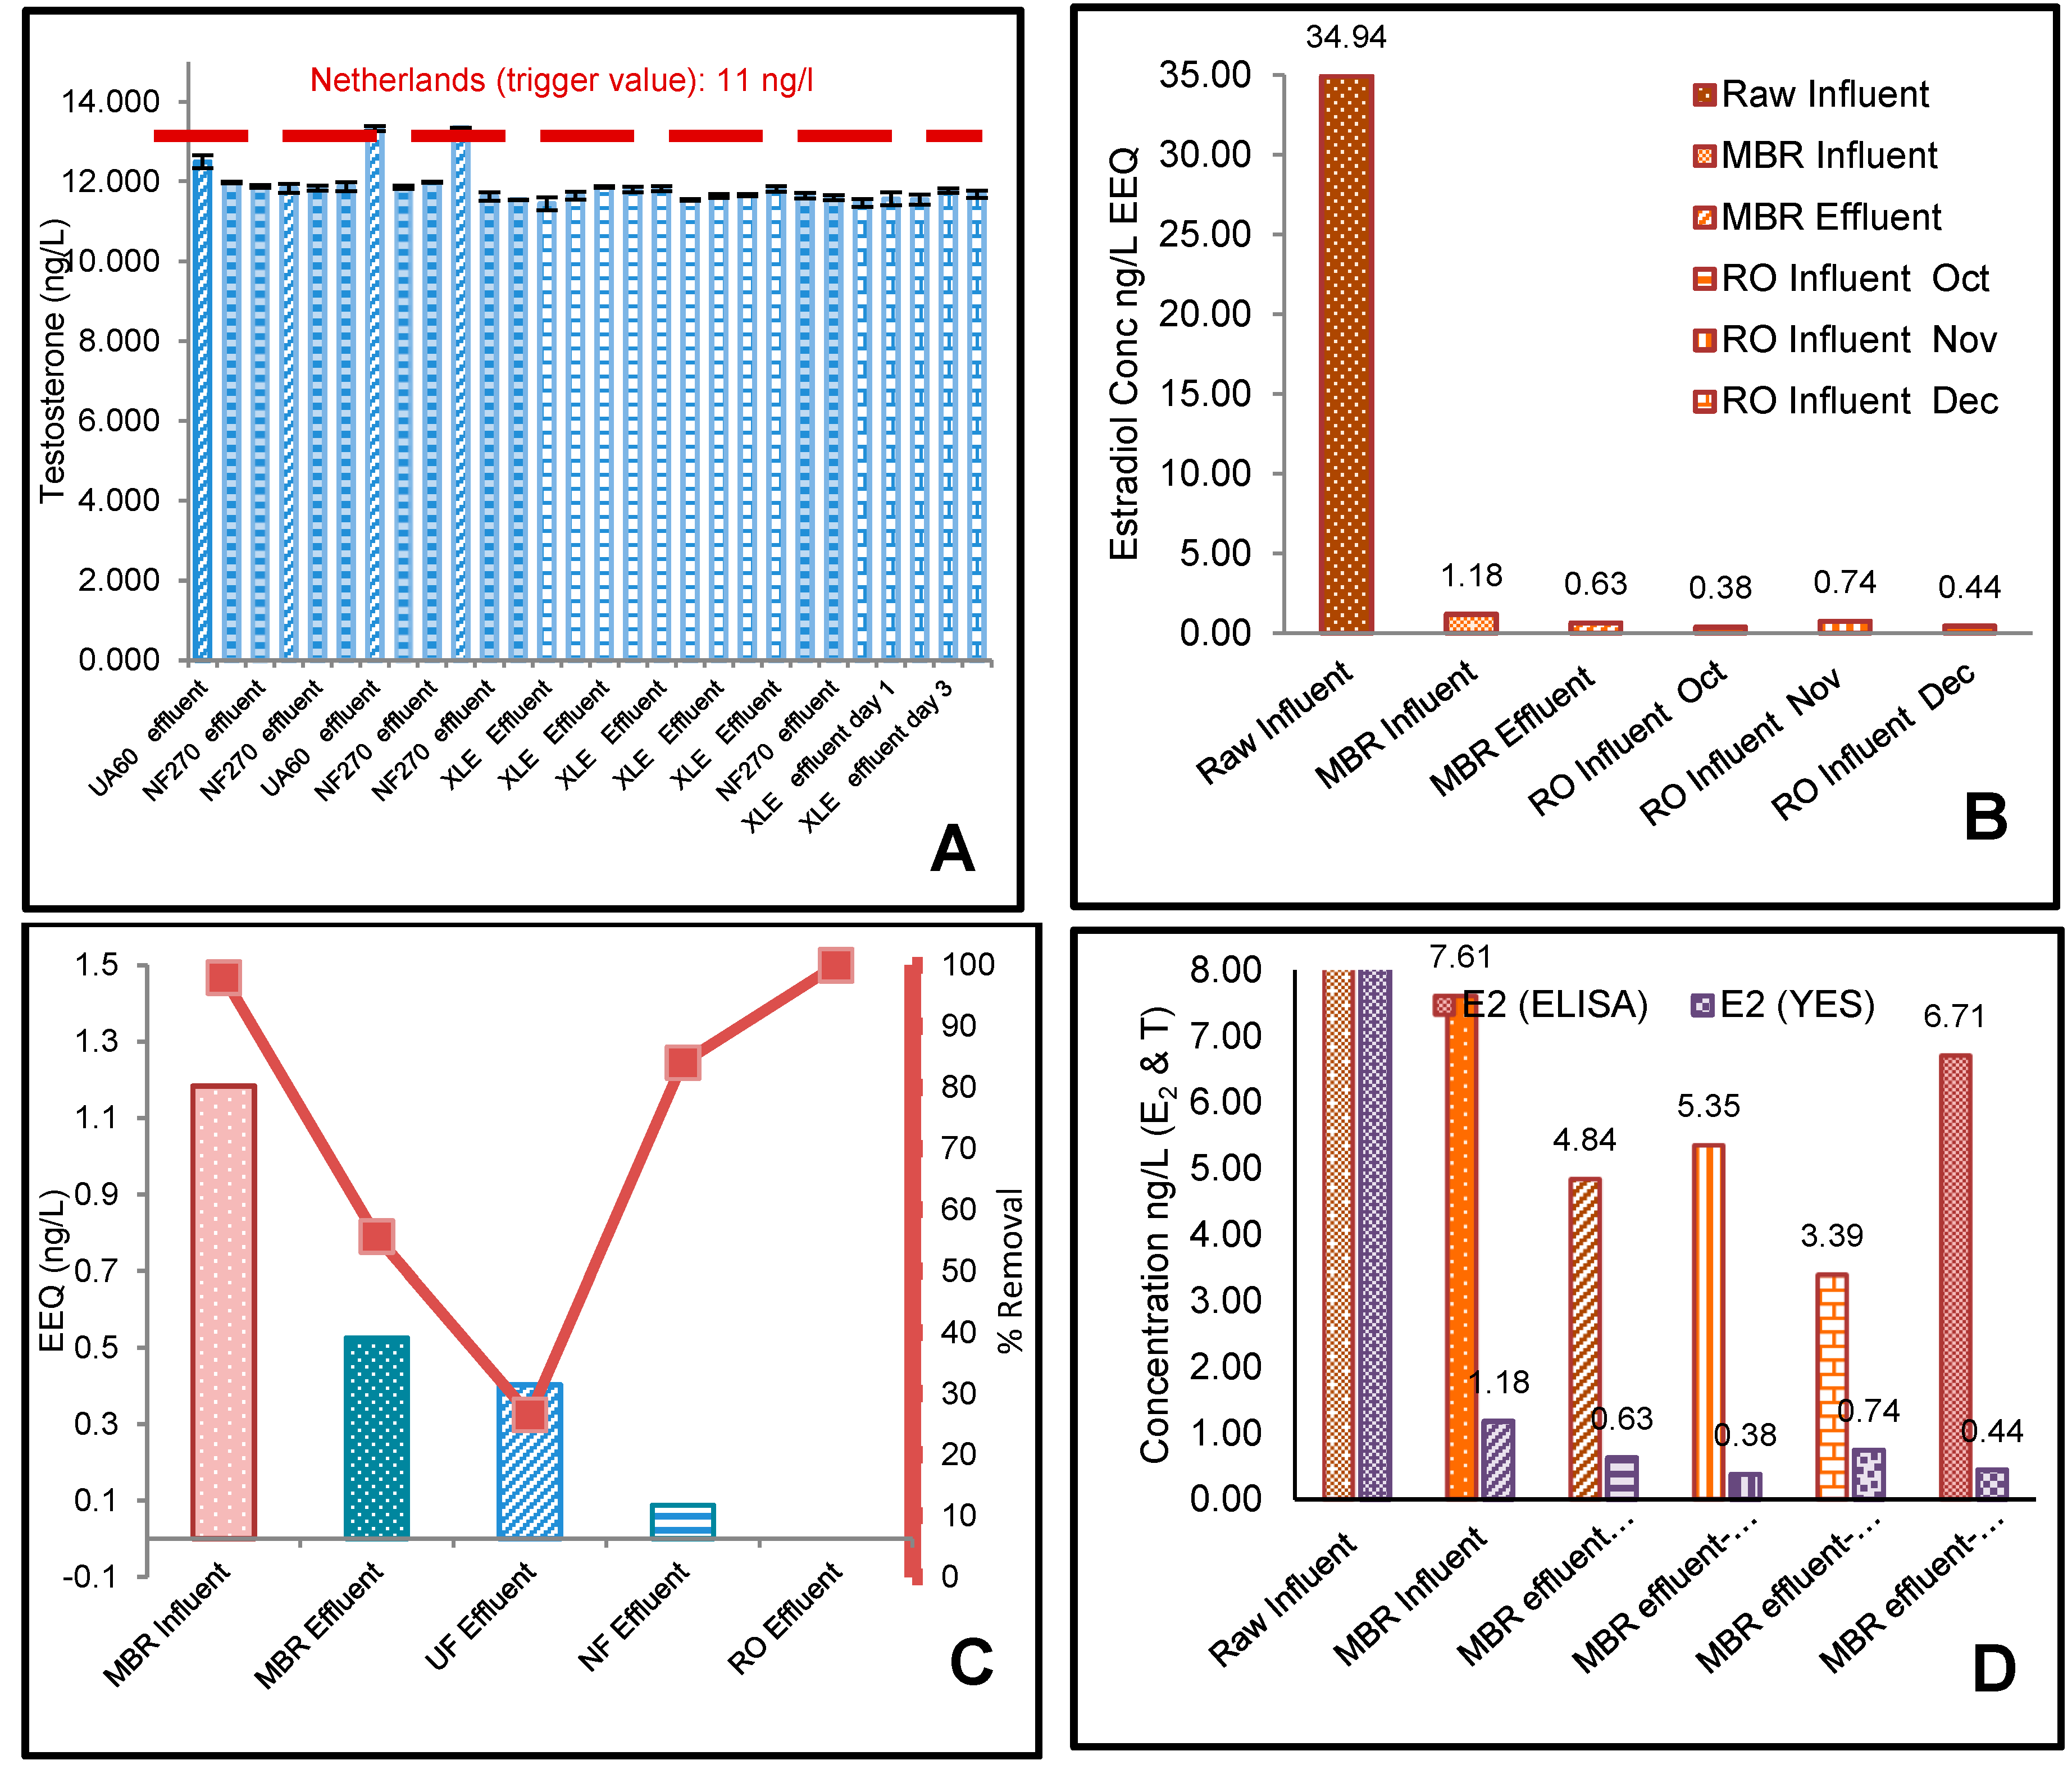
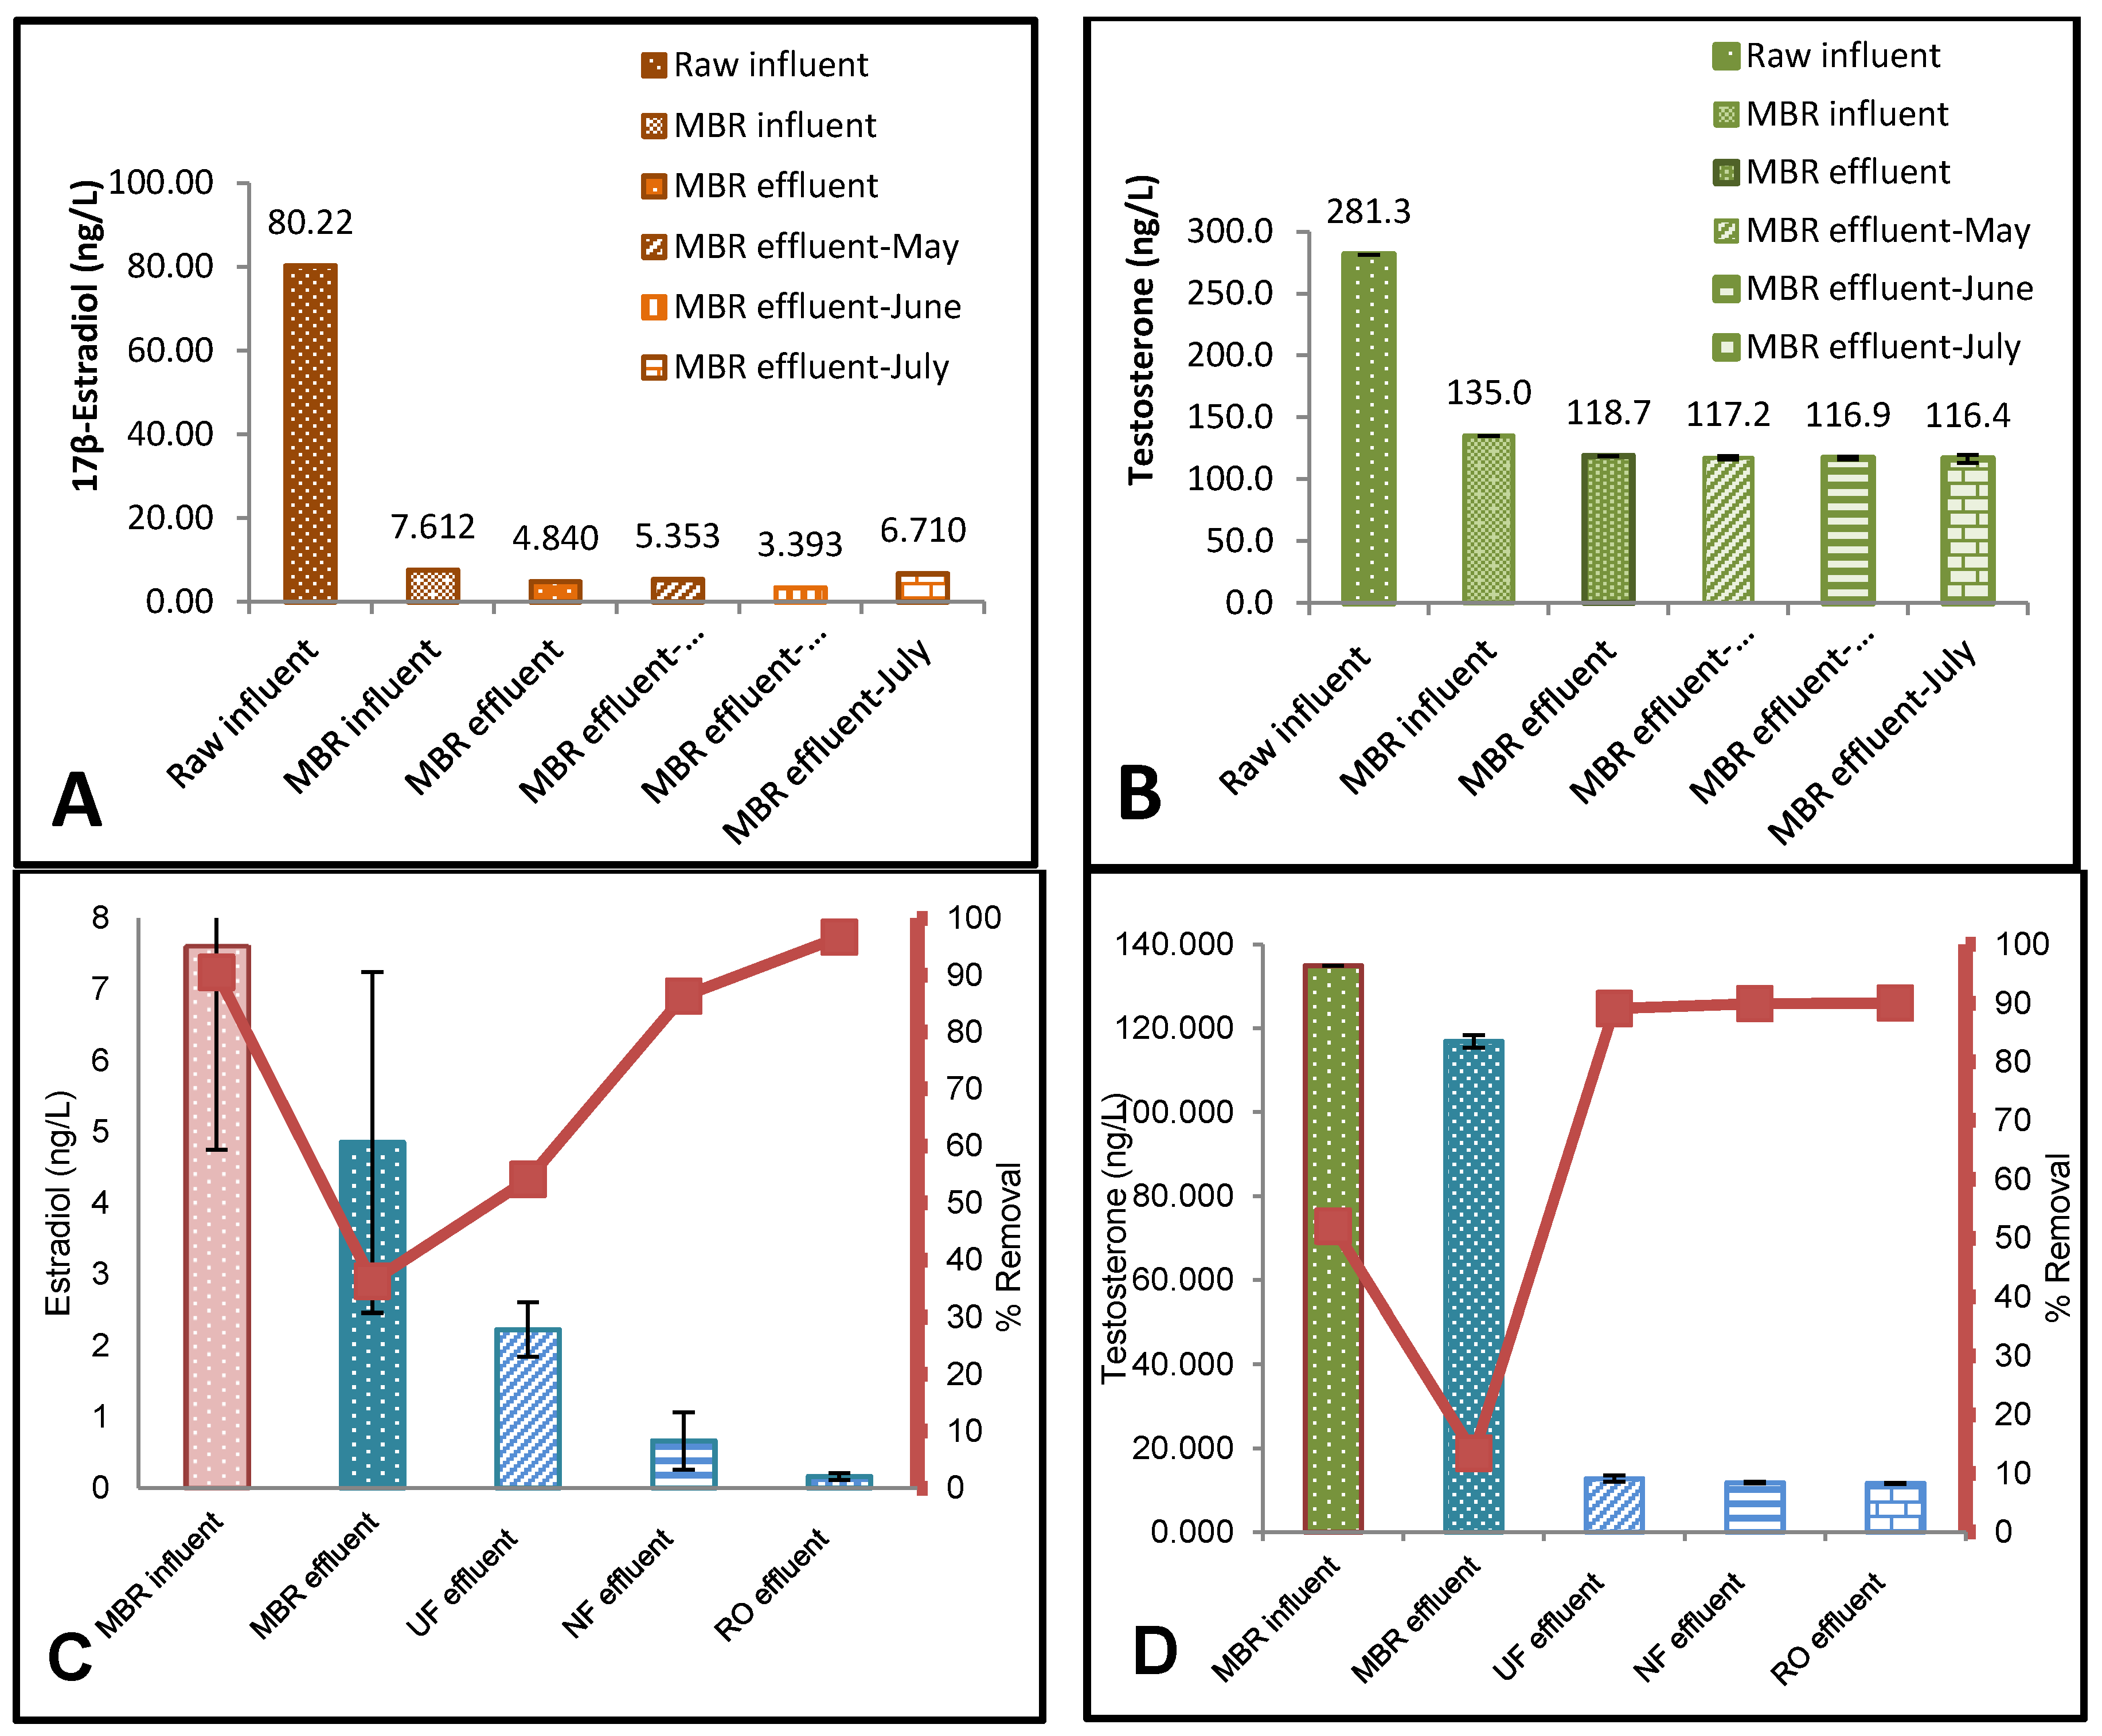
3.1. ELISA Analysis of 17β-Estradiol (E2) and Testosterone (T)
3.2. The Effect of Flux on Testosterone
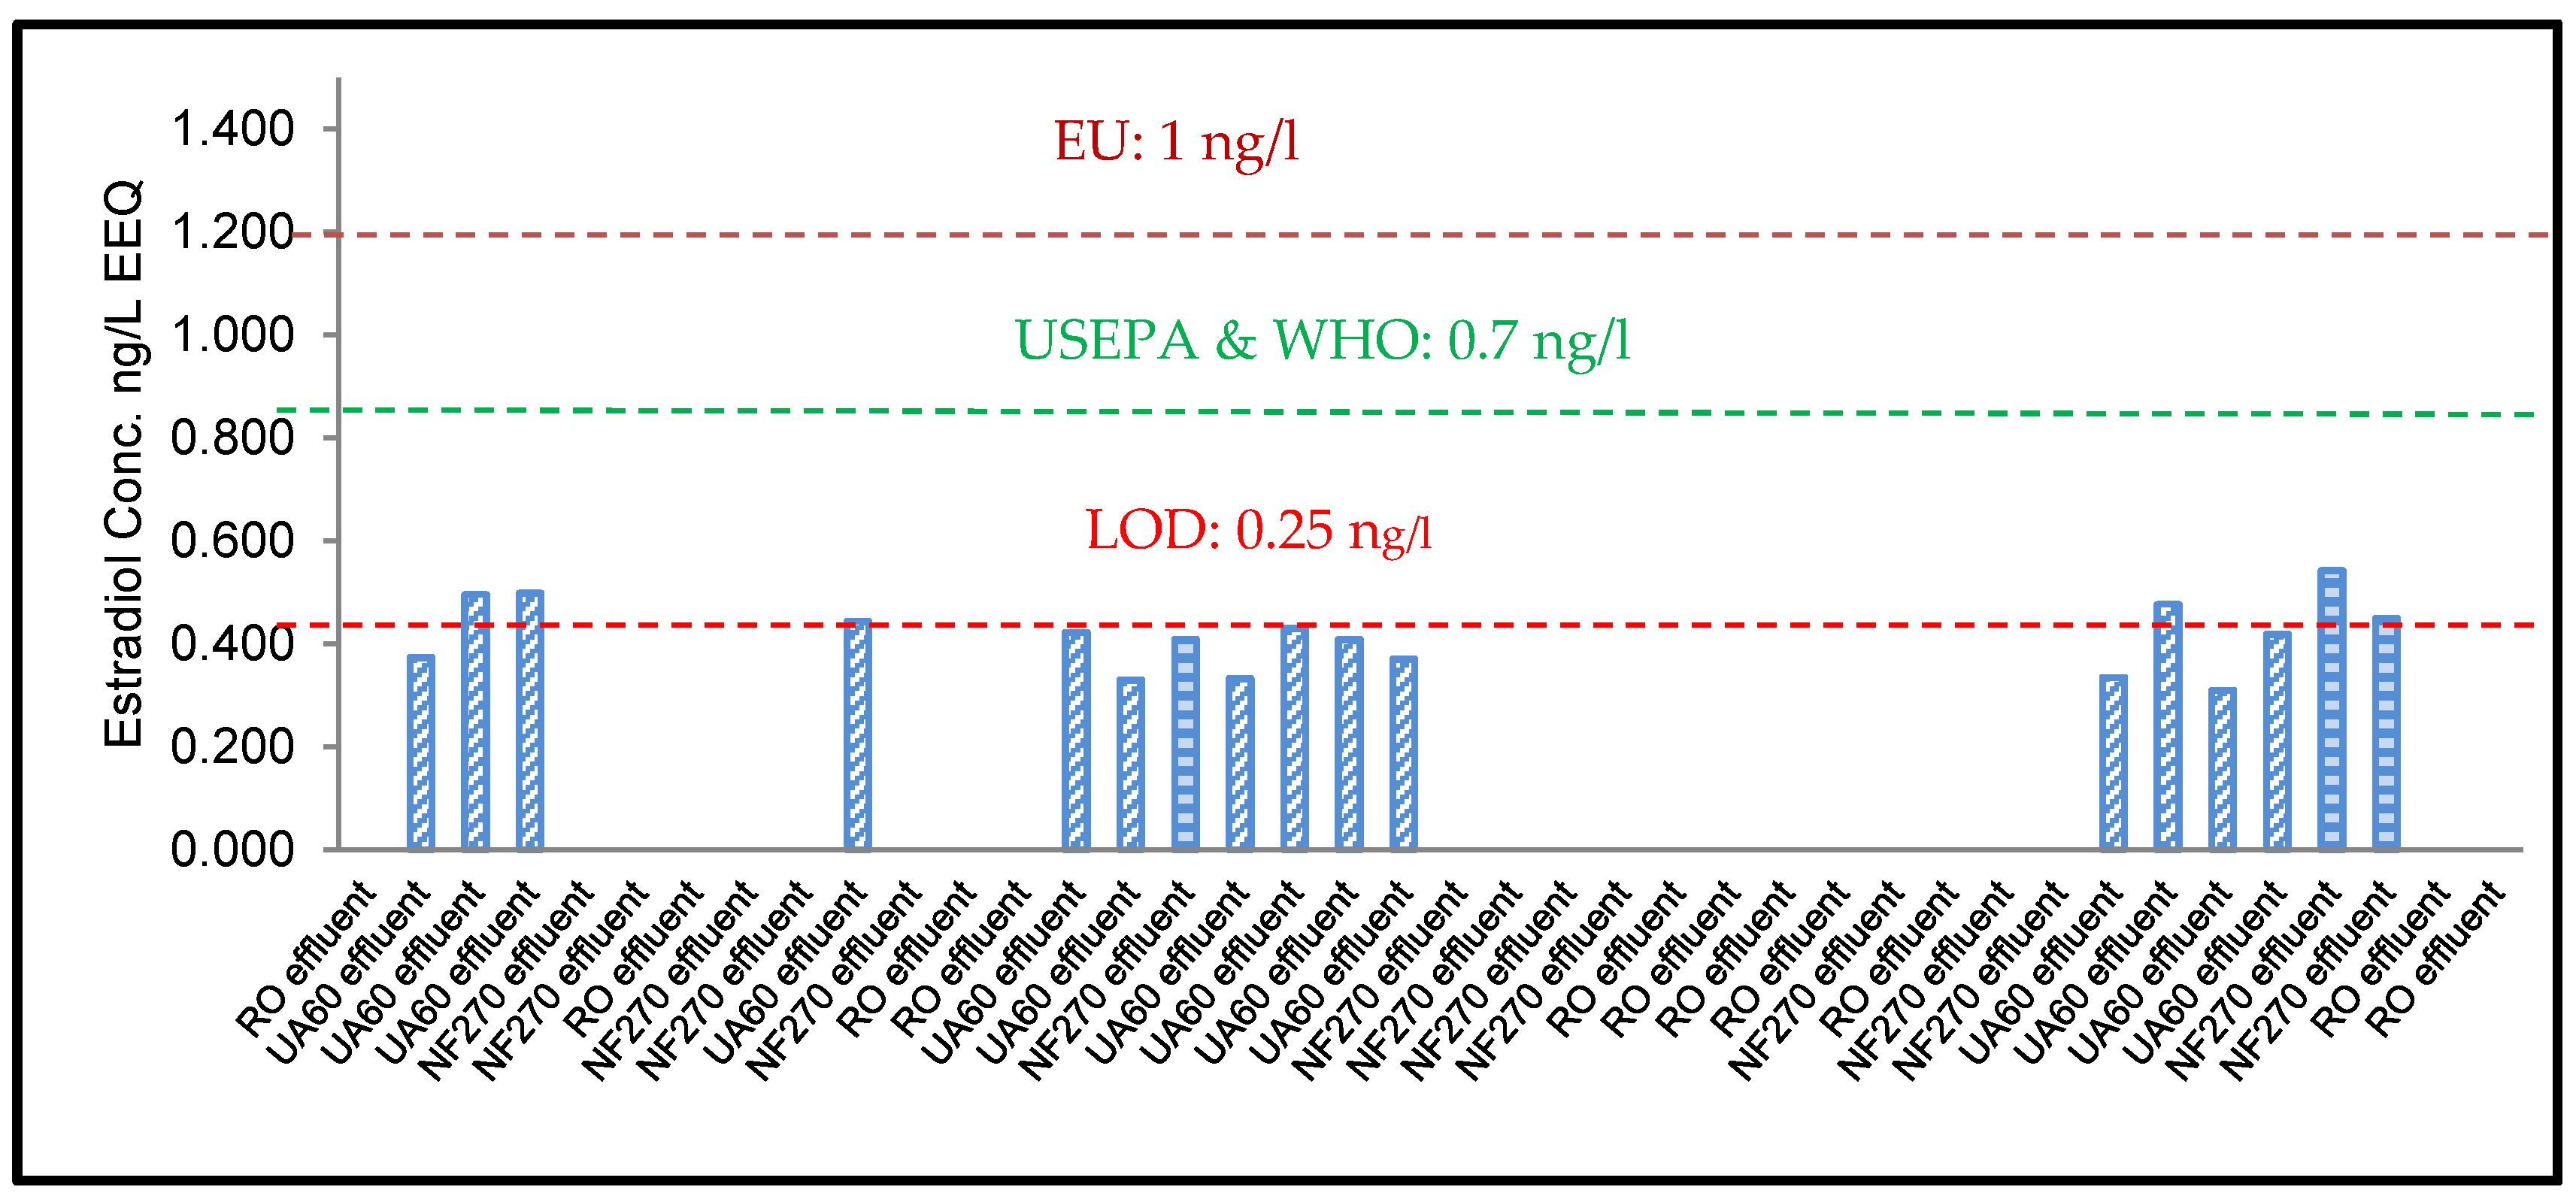
3.3. YES Analysis of 17β-Estradiol (E2)
4. Results
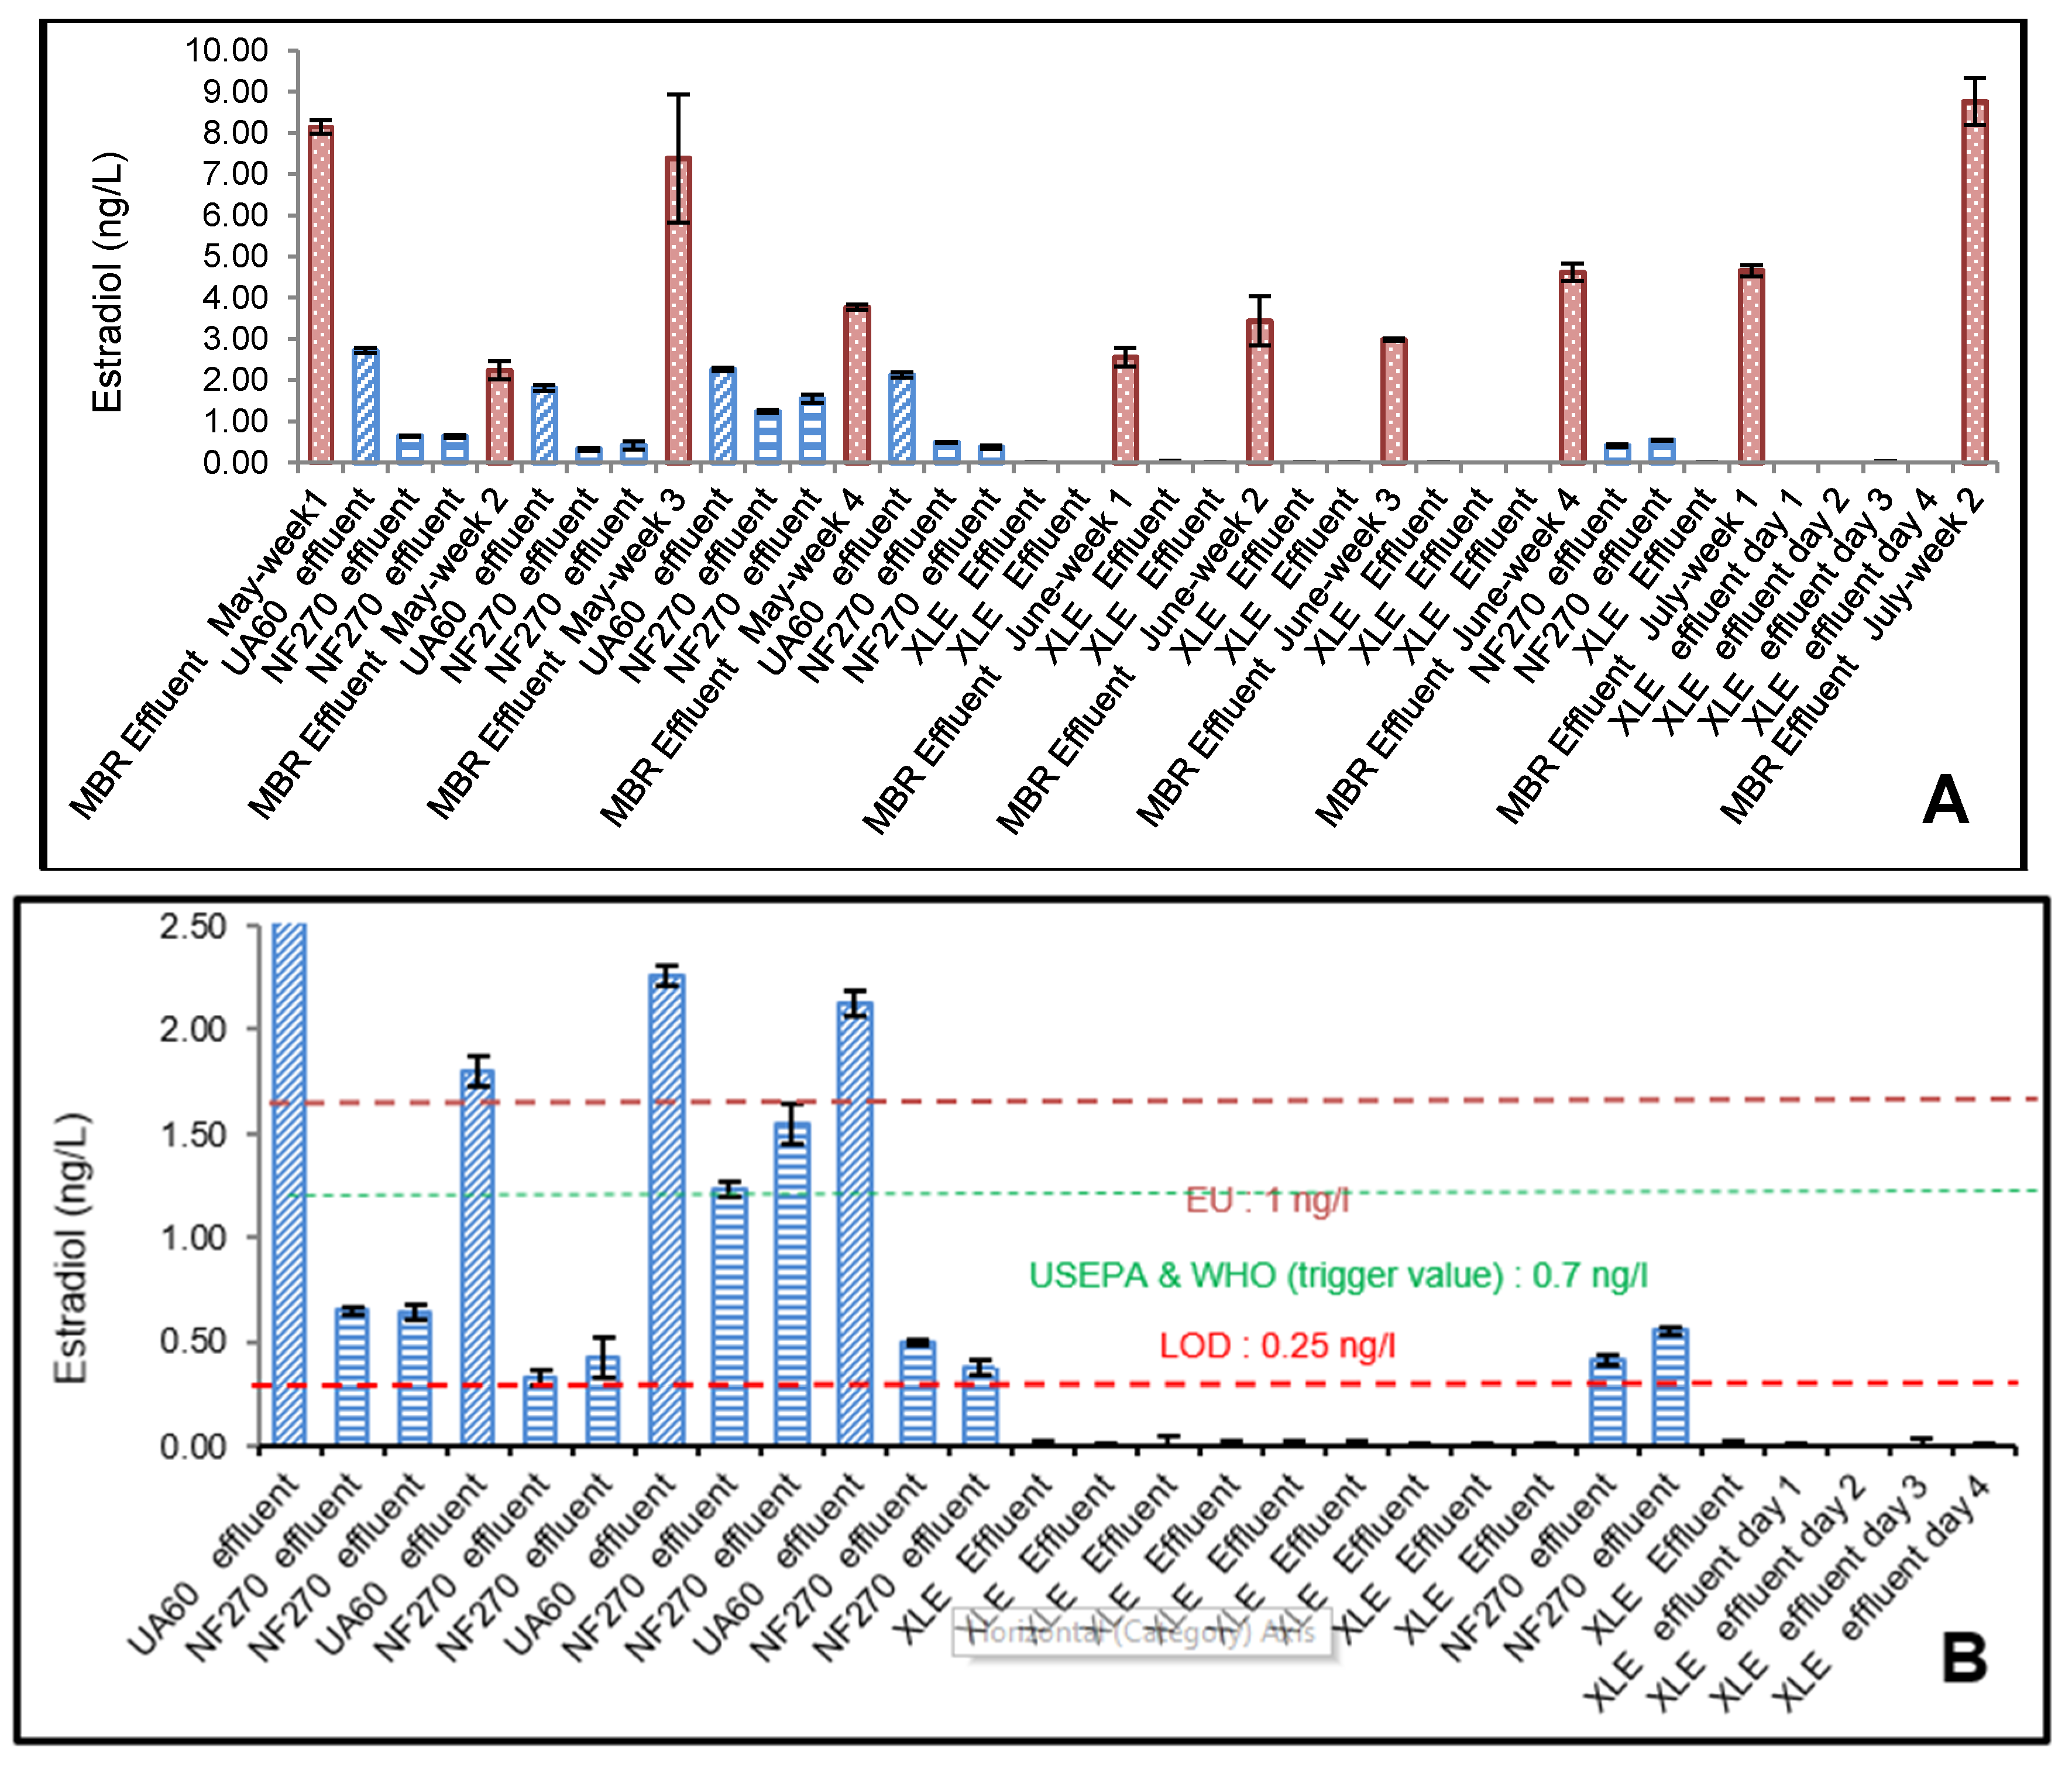
4.1. Effect of Membrane Properties on the Rejection
4.2. Risk Assessment of 17β-Estradiol (E2) and Testosterone (T)
5. Conclusions
Author Contributions
Funding
Acknowledgments
Conflicts of Interest
References
- Abbas, A.; Schneider, I.; Bollmann, A.; Funke, J.; Oehlmann, J.; Prasse, C.; Schulte-Oehlmann, U.; Seitz, W.; Ternes, T.; Weber, M.; et al. What you extract is what you see: Optimising the preparation of water and wastewater samples for in vitro bioassays. Water Res. 2019, 152, 47–60. [Google Scholar] [CrossRef] [PubMed]
- Kase, R.; Javurkova, B.; Simon, E.; Swart, K.; Buchinger, S.; Könemann, S.; Escher, B.I.; Carere, M.; Dulio, V.; Ait-Aissa, S.; et al. Screening and risk management solutions for steroidal estrogens in surface and wastewater. TrAC Trends Anal. Chem. 2018, 102, 343–358. [Google Scholar] [CrossRef]
- Vethaak, A.D.; Lahr, J.; Schrap, S.M.; Belfroid, A.C.; Rijs, G.B.J.; Gerritsen, A.; De Boer, J.; Bulder, A.S.; Grinwis, G.C.M.; Kuiper, R.V.; et al. An integrated assessment of estrogenic contamination and biological effects in the aquatic environment of The Netherlands. Chemosphere 2005, 59, 511–524. [Google Scholar] [CrossRef] [PubMed]
- Hu, X.; Shi, W.; Cao, F.; Hu, G.; Hao, Y.; Wei, S.; Wang, X.; Yu, H. Chemosphere Bioanalytical and instrumental analysis of estrogenic activities in drinking water sources from Yangtze River Delta. Chemosphere 2013, 90, 2123–2128. [Google Scholar] [CrossRef]
- Silva, L.L.S.; Moreira, C.G.; Curzio, B.A.; da Fonseca, F.V. Micropollutant Removal from Water by Membrane and Advanced Oxidation Processes—A Review. J. Water Resour. Prot. 2017, 9, 411–431. [Google Scholar] [CrossRef] [Green Version]
- Gillesby, B.E.; Zacharewski, T.R. Exoestrogens: Mechanisms of action and strategies for identification and assessment. Environ. Toxicol. Chem. 1998, 17, 3–14. [Google Scholar] [CrossRef]
- Liu, Z.H.; Kanjo, Y.; Mizutani, S. Removal mechanisms for endocrine disrupting compounds (EDCs) in wastewater treatment—Physical means, biodegradation, and chemical advanced oxidation: A review. Sci. Total Environ. 2009, 407, 731–748. [Google Scholar] [CrossRef]
- Elliott, B.; Muir, C.; deCatanzaro, D. Sources of variance within and among young men in concentrations of 17β-estradiol and testosterone in axillary perspiration. Physiol. Behav. 2017, 173, 23–29. [Google Scholar] [CrossRef]
- Kim, S.D.; Cho, J.; Kim, I.S.; Vanderford, B.J.; Snyder, S.A. Occurrence and removal of pharmaceuticals and endocrine disruptors in South Korean surface, drinking, and waste waters. Water Res. 2007, 41, 1013–1021. [Google Scholar] [CrossRef]
- Swart, N.; Pool, E. Rapid detection of selected steroid hormones from sewage effluents using an ELISA in the Kuils River water catchment area, South Africa. J. Immunoass. Immunochem. 2007, 28, 395–408. [Google Scholar] [CrossRef]
- Myburgh, D.P.; Aziz, M.; Roman, F.; Jardim, J.; Chakawa, S. Removal of COD from Industrial Biodiesel Wastewater Using an Integrated Process: Electrochemical-Oxidation with IrO2-Ta2O5/Ti Anodes and Chitosan Powder as an Adsorbent. Environ. Process. 2019, 6. [Google Scholar] [CrossRef]
- Kasongo, G.; Steenberg, C.; Morris, B.; Kapenda, G.; Jacobs, N.; Aziz, M. Surface grafting of polyvinyl alcohol (PVA) cross-linked with glutaraldehyde (GA) to improve resistance to fouling of aromatic polyamide thin film composite reverse osmosis membranes using municipal membrane bioreactor effluent. Water Pract. Technol. 2019, 14, 614–624. [Google Scholar] [CrossRef]
- Bellona, C.; Drewes, J.E.; Oelker, G.; Luna, J.; Filteau, G.; Amy, G. Comparing nanofiltration and reverse osmosis for drinking water augmentation. J. Am. Water Works Assoc. 2008, 100. [Google Scholar] [CrossRef]
- Hacıfazlıoğlu, M.C.; Parlar, İ.; Pek, T.; Kabay, N. Evaluation of chemical cleaning to control fouling on nanofiltration and reverse osmosis membranes after desalination of MBR effluent. Desalination 2019, 466, 44–51. [Google Scholar] [CrossRef]
- Silva, B.; Tuuguu, E.; Costa, F.; Rocha, V.; Lago, A.; Tavares, T. Permeable Biosorbent Barrier for Wastewater Remediation. Environ. Process. 2017, 4, 195–206. [Google Scholar] [CrossRef] [Green Version]
- Sert, G.; Bunani, S.; Yörüko, E.; Kabay, N.; Egemen, Ö.; Yüksel, M. Performances of some NF and RO membranes for desalination of MBR treated wastewater. J. Water Process Eng. 2017, 16, 193–198. [Google Scholar] [CrossRef]
- Qin, J.J.; Kekre, K.A.; Tao, G.; Oo, M.H.; Wai, M.N.; Lee, T.C.; Viswanath, B.; Seah, H. New option of MBR-RO process for production of NEWater from domestic sewage. J. Membr. Sci. 2006, 272, 70–77. [Google Scholar] [CrossRef]
- Tay, M.F.; Liu, C.; Cornelissen, E.R.; Wu, B.; Chong, T.H. The feasibility of nanofiltration membrane bioreactor (NF-MBR)+reverse osmosis (RO) process for water reclamation: Comparison with ultrafiltration membrane bioreactor (UF-MBR)+RO process. Water Res. 2018, 129, 180–189. [Google Scholar] [CrossRef]
- Racz, L.; Goel, R.K. Fate and removal of estrogens in municipal wastewater. J. Environ. Monit. 2010, 12, 58–70. [Google Scholar] [CrossRef]
- Escher, B.I.; Aїt-Aїssa, S.; Behnisch, P.A.; Brack, W.; Brion, F.; Brouwer, A.; Buchinger, S.; Crawford, S.E.; Du Pasquier, D.; Hamers, T.; et al. Effect-based trigger values for in vitro and in vivo bioassays performed on surface water extracts supporting the environmental quality standards (EQS) of the European Water Framework Directive. Sci. Total Environ. 2018, 628–629, 748–765. [Google Scholar] [CrossRef]
- Aziz, M.; Kasongo, G. Scaling prevention of thin film composite polyamide Reverse Osmosis membranes by Zn ions. Desalination 2019, 464, 76–83. [Google Scholar] [CrossRef]
- Agoro, M.A.; Okoh, O.O.; Adefisoye, M.A.; Okoh, A.I. Physicochemical Properties of Wastewater in Three Typical South African Sewage Works. Pol. J. Environ. Stud. 2018, 27, 491–499. [Google Scholar] [CrossRef] [Green Version]
- Nguyen, L.N.; Hai, F.I.; Kang, J.; Price, W.E.; Nghiem, L.D. Removal of emerging trace organic contaminants by MBR-based hybrid treatment processes. Int. Biodeterior. Biodegrad. 2013, 85, 474–482. [Google Scholar] [CrossRef] [Green Version]
- Nghiem, L.D.; Schäfer, A.I.; Elimelech, M. Removal of Natural Hormones by Nanofiltration Membranes: Measurement, Modeling and Mechanisms. Environ. Sci. Technol. 2004, 38, 1888–1896. [Google Scholar] [CrossRef]
- Nghiem, L.D.; Manis, A.; Soldenhoff, K.; Schäfer, A.I. Estrogenic hormone removal from wastewater using NF/RO membranes. J. Membr. Sci. 2004, 242, 37–45. [Google Scholar] [CrossRef]
- Krzeminski, P.; Tomei, M.C.; Karaolia, P.; Langenhoff, A.; Almeida, C.M.R.; Felis, E.; Gritten, F.; Andersen, H.R.; Fernandes, T.; Manaia, C.M.; et al. Performance of secondary wastewater treatment methods for the removal of contaminants of emerging concern implicated in crop uptake and antibiotic resistance spread: A review. Sci. Total Environ. 2019, 648, 1052–1081. [Google Scholar] [CrossRef] [Green Version]
- Faul, A.K.; Julies, E.; Pool, E.J. Steroid hormone concentrations and physiological toxicity of water from selected dams in Namibia. Afr. J. Aquat. Sci. 2014, 39, 189–198. [Google Scholar] [CrossRef]
- Truter, J.C.; van Wyk, J.; Newman, B.K. In vitro screening for endocrine disruptive activity in selected South African harbours and river mouths. Afr. J. Mar. Sci. 2015, 37, 567–574. [Google Scholar] [CrossRef]
- Sohoni, P.; Sumpter, J.P. Several environmental oestrogens are also anti-androgens. J. Endocrinol. 1998, 158, 327–339. [Google Scholar] [CrossRef] [Green Version]
- Archer, E.; Petrie, B.; Kasprzyk-Hordern, B.; Wolfaardt, G.M. The fate of pharmaceuticals and personal care products (PPCPs), endocrine disrupting contaminants (EDCs), metabolites and illicit drugs in a WWTW and environmental waters. Chemosphere 2017, 174, 437–446. [Google Scholar] [CrossRef]
- Faul, A.K.; Julies, E.; Pool, E.J. Oestrogen, testosterone, cytotoxin and cholinesterase inhibitor removal during reclamation of sewage to drinking water. Water SA 2013, 39, 499–506. [Google Scholar] [CrossRef] [Green Version]
- Lee, J.; Lee, B.C.; Ra, J.S.; Cho, J.; Kim, I.S.; Chang, N.I.; Kim, H.K.; Kim, S.D. Comparison of the removal efficiency of endocrine disrupting compounds in pilot scale sewage treatment processes. Chemosphere 2008, 71, 1582–1592. [Google Scholar] [CrossRef]
- Comerton, A.M.; Andrews, R.C.; Bagley, D.M.; Hao, C. The rejection of endocrine disrupting and pharmaceutically active compounds by NF and RO membranes as a function of compound and water matrix properties. J. Membr. Sci. 2008, 313, 323–335. [Google Scholar] [CrossRef]
- Méndez, E.; González-Fuentes, M.A.; Rebollar-Perez, G.; Méndez-Albores, A.; Torres, E. Emerging pollutant treatments in wastewater: Cases of antibiotics and hormones. J. Environ. Sci. Health Part A Toxic/Hazard. Subst. Environ. Eng. 2017, 52, 235–253. [Google Scholar] [CrossRef]
- Stalter, D.; Magdeburg, A.; Wagner, M.; Oehlmann, J. Ozonation and activated carbon treatment of sewage effluents: Removal of endocrine activity and cytotoxicity. Water Res. 2011, 45, 1015–1024. [Google Scholar] [CrossRef]
- Manickum, T.; John, W. Occurrence, fate and environmental risk assessment of endocrine disrupting compounds at the wastewater treatment works in Pietermaritzburg (South Africa). Sci. Total Environ. 2014, 468–469, 584–597. [Google Scholar] [CrossRef]
- Fernandez, M.P.; Ikonomou, M.G.; Buchanan, I. An assessment of estrogenic organic contaminants in Canadian wastewaters. Sci. Total Environ. 2007, 373, 250–269. [Google Scholar] [CrossRef]
- Chang, H.; Wan, Y.; Wu, S.; Fan, Z.; Hu, J. Occurrence of androgens and progestogens in wastewater treatment plants and receiving river waters: Comparison to estrogens. Water Res. 2011, 45, 732–740. [Google Scholar] [CrossRef]
- Leusch, F.D.L.; Chapman, H.F.; van den Heuvel, M.R.; Tan, B.L.L.; Gooneratne, S.R.; Tremblay, L.A. Bioassay-derived androgenic and estrogenic activity in municipal sewage in Australia and New Zealand. Ecotoxicol. Environ. Saf. 2006, 65, 403–411. [Google Scholar] [CrossRef]
- Yangali-Quintanilla, V.; Maeng, S.K.; Fujioka, T.; Kennedy, M.; Li, Z.; Amy, G. Nanofiltration vs. reverse osmosis for the removal of emerging organic contaminants in water reuse. Desalin. Water Treat. 2011, 34, 50–56. [Google Scholar] [CrossRef]
- Shappell, N.W.; Billey, L.O.; Forbes, D.; Matheny, T.A.; Poach, M.E.; Reddy, G.B.; Hunt, P.G. Estrogenic activity and steroid hormones in swine wastewater through a lagoon constructed-wetland system. Environ. Sci. Technol. 2007, 41, 444–450. [Google Scholar] [CrossRef]
- Genthe, B.; Steyn, M.; Aneck-Hahn, N.; Van Zijl, C.; De Jager, C. The Feasibility of a Health Risk Assessment Framework to Derive Guidelines for Estrogen Activity in University of Pretoria; Water Research Commission: Pretoria, South Africa, 2010; ISBN 9781770059214. [Google Scholar]
- Brand, W.; de Jongh, C.M.; van der Linden, S.C.; Mennes, W.; Puijker, L.M.; van Leeuwen, C.J.; van Wezel, A.P.; Schriks, M.; Heringa, M.B. Trigger values for investigation of hormonal activity in drinking water and its sources using CALUX bioassays. Environ. Int. 2013, 55, 109–118. [Google Scholar] [CrossRef]
- Sahar, E.; David, I.; Gelman, Y.; Chikurel, H.; Aharoni, A.; Messalem, R.; Brenner, A. The use of RO to remove emerging micropollutants following CAS/UF or MBR treatment of municipal wastewater. Desalination 2011, 273, 142–147. [Google Scholar] [CrossRef]
- Rasak, A.R.A.; Ujang, Z.; Ozaki, H. Removal of endocrine disrupting chemicals (EDCs) using low pressure reverse osmosis membrane (LPROM). Water Sci. Technol. 2007, 56, 161–168. [Google Scholar] [CrossRef] [Green Version]
- Ozaki, H.; Li, H. Rejection of organic compounds by ultra-low pressure reverse osmosis membrane. Water Res. 2002, 36, 123–130. [Google Scholar] [CrossRef]
- Ihara, M.; Ihara, M.O.; Kumar, V.; Narumiya, M.; Hanamoto, S.; Nakada, N.; Yamashita, N.; Miyagawa, S.; Iguchi, T.; Tanaka, H. Co-occurrence of estrogenic and antiestrogenic activities in wastewater: Quantitative evaluation of balance by in vitro ERα reporter gene assay and chemical analysis. Environ. Sci. Technol. 2014, 48, 6366–6373. [Google Scholar] [CrossRef]
- Van der Bruggen, B.; Braeken, L.; Vandecasteele, C. Evaluation of parameters describing flux decline in nanofiltration of aqueous solutions containing organic compounds. Desalination 2002, 147, 281–288. [Google Scholar] [CrossRef]
- Freger, V.; Gilron, J.; Belfer, S. TFC polyamide membranes modified by grafting of hydrophilic polymers: An FT-IR/AFM/TEM study. J. Membr. Sci. 2002, 209, 283–292. [Google Scholar] [CrossRef]
- Nghiem, L.D.; Schäfer, A.I. Trace contaminant removal with nanofiltration. Nanofiltr. Princ. Appl. 2004, 479–520. [Google Scholar]
- Silva, C.P.; Otero, M.; Esteves, V. Processes for the elimination of estrogenic steroid hormones from water: A review. Environ. Pollut. 2012, 165, 38–58. [Google Scholar] [CrossRef]
- McCallum, E.A.; Hyung, H.; Do, T.A.; Huang, C.H.; Kim, J.H. Adsorption, desorption, and steady-state removal of 17β-estradiol by nanofiltration membranes. J. Membr. Sci. 2008, 319, 38–43. [Google Scholar] [CrossRef]
- Neale, P.A.; Escher, B.I.; Schäfer, A.I. pH dependence of steroid hormone-organic matter interactions at environmental concentrations. Sci. Total Environ. 2009, 407, 1164–1173. [Google Scholar] [CrossRef] [PubMed]
- Yoon, Y.; Westerhoff, P.; Snyder, S.A.; Wert, E.C.; Yoon, J. Removal of endocrine disrupting compounds and pharmaceuticals by nanofiltration and ultrafiltration membranes. Desalination 2007, 202, 16–23. [Google Scholar] [CrossRef]
- Archer, E. Interaction of Pharmaceutical & Personal Care Products (PPCPs) and Endocrine Disrupting Contaminants (EDCs) with Microbial Communities in South African Wastewater Treatment Works and Environmental Waters. Ph.D. Thesis, Stellenbosch University, Stellenbosch, South African, 2018; p. 224. [Google Scholar]
- Archer, E.; Wolfaardt, G.M.; van Wyk, J.H. Pharmaceutical and personal care products (PPCPs) as endocrine disrupting contaminants (EDCs) in South African surface waters. Water SA 2017, 43, 684–706. [Google Scholar] [CrossRef] [Green Version]
- Bandelj, E.; van den Heuvel, M.R.; Leusch, F.D.L.; Shannon, N.; Taylor, S.; McCarthy, L.H. Determination of the androgenic potency of whole effluents using mosquitofish and trout bioassays. Aquat. Toxicol. 2006, 80, 237–248. [Google Scholar] [CrossRef]
- Cai, K.; Elliott, C.T.; Phillips, D.H.; Scippo, M.L.; Muller, M.; Connolly, L. Treatment of estrogens and androgens in dairy wastewater by a constructed wetland system. Water Res. 2012, 46, 2333–2343. [Google Scholar] [CrossRef]
- Choi, K.; Kim, Y.; Park, J.; Park, C.K.; Kim, M.Y.; Kim, H.S.; Kim, P. Seasonal variations of several pharmaceutical residues in surface water and sewage treatment plants of Han River, Korea. Sci. Total Environ. 2008, 405, 120–128. [Google Scholar] [CrossRef]
- Caldwell, D.J.; Mastrocco, F.; Anderson, P.D.; Länge, R.; Sumpter, J.P. Predicted-no-effect concentrations for the steroid estrogens estrone, 17β-estradiol, estriol, and 17α-ethinylestradiol. Environ. Toxicol. Chem. 2012, 31, 1396–1406. [Google Scholar] [CrossRef]
- Jiang, W.; Yan, Y.; Ma, M.; Wang, D.; Luo, Q.; Wang, Z.; Satyanarayanan, S.K. Assessment of source water contamination by estrogenic disrupting compounds in China. J. Environ. Sci. 2012, 24, 320–328. [Google Scholar] [CrossRef]
- Stephan, C.E.; Mount, D.I.; Hansen, D.J.; Gentile, J.H.; Chapman, G.A.; Brungs, W.A. Guidelines for deriving numerical national water quality criteria for the protection of aquatic organisms and their uses. PB85-227049. Environ. Prot. 1985, 105. [Google Scholar]
- Wu, B.; Kitade, T.; Haur, T.; Uemura, T.; Fane, A.G. Impact of membrane bioreactor operating conditions on fouling behavior of reverse osmosis membranes in MBR–RO processes. DES 2013, 311, 37–45. [Google Scholar] [CrossRef]
- Jarošová, B.; Bláha, L.; Giesy, J.P.; Hilscherová, K. What level of estrogenic activity determined by in vitro assays in municipal waste waters can be considered as safe? Environ. Int. 2014, 64, 98–109. [Google Scholar] [CrossRef] [PubMed]


| Parameters | Operating Conditions | ||
|---|---|---|---|
| Membrane module | XLE | NF270 | UA60 |
| Recovery (%) | 50; 75 | 75 | 75 |
| Flux (L/m2hr1) | 25; 30 | 30 | 30 |
| pH | uncontrolled; 6.5 | uncontrolled | uncontrolled |
| Parameter | Units | Average MBR Effluent | Limit * |
|---|---|---|---|
| Electron conductivity (EC) | mS/m | 56 | 75 * |
| pH | 6.9 | 5.5–9.5 * | |
| Chemical oxygen demand (COD) | mg/L | <20 | 75 * |
| Ammonium (NH42−) | mg/L | <0.4 | 1.0 * |
| Phosphate (PO4) | mg/L | 2.6 | 10 * |
| Nitrate (NO3) | mg/L | 13 | 15 * |
| Chloride (Cl−) | mg/L | 73 | 10 0 * |
| 17β-Estradiol (E2) | ng/L | <5 | - |
| Testosterone (T) | ng/L | 120 | - |
| Membrane Component | Texture | Type | Rejection % | Effective Area (m2) | MWCO (Da) | Maximum Pressure (bar) | Maximum Temperature (°C) | Maximum Permeate Flowrate (m3/hr) |
|---|---|---|---|---|---|---|---|---|
| RO | TFC Polyamide | Filmtec XLE-4040 | 99% NaCl | 8.1 | <200 | 6.9 | 45 | 9.8 |
| NF | TFC Polyamide | Filmtec NF270-4040 | >97% MgSO4 | 7.6 | 400 | 4.8 | 45 | 9.5 |
| UF | TFC Piperazine | TriSep 4040-UA60-TSA | 80% MgSO4 | 8.2 | 1000 | 7.6 | 45 | 11.4 |
| Analytes | MW (g/mol) | Formula | CAS Number | Solubility (mg/L) | Dissociation Constant pKa | Classification | Partition. Coefficient (log Kow) | Chemical Structure |
|---|---|---|---|---|---|---|---|---|
| 17β-Estradiol (E2) | 272.38 | C18H24O2 | 50-28-2 | 13 | 10.4 | natural hormone (estrogen) | 4.01 |  |
| Testosterone (T) | 288.42 | C19H28O2 | 58-22-0 | 23.4 | 17.4 | natural hormone (androgen) | 3.32 |  |
© 2020 by the authors. Licensee MDPI, Basel, Switzerland. This article is an open access article distributed under the terms and conditions of the Creative Commons Attribution (CC BY) license (http://creativecommons.org/licenses/by/4.0/).
Share and Cite
Aziz, M.; Ojumu, T. Exclusion of Estrogenic and Androgenic Steroid Hormones from Municipal Membrane Bioreactor Wastewater Using UF/NF/RO Membranes for Water Reuse Application. Membranes 2020, 10, 37. https://doi.org/10.3390/membranes10030037
Aziz M, Ojumu T. Exclusion of Estrogenic and Androgenic Steroid Hormones from Municipal Membrane Bioreactor Wastewater Using UF/NF/RO Membranes for Water Reuse Application. Membranes. 2020; 10(3):37. https://doi.org/10.3390/membranes10030037
Chicago/Turabian StyleAziz, Mujahid, and Tunde Ojumu. 2020. "Exclusion of Estrogenic and Androgenic Steroid Hormones from Municipal Membrane Bioreactor Wastewater Using UF/NF/RO Membranes for Water Reuse Application" Membranes 10, no. 3: 37. https://doi.org/10.3390/membranes10030037