Abstract
This paper presents a simple method for determination of synergism in binary surfactant mixtures. A homologous series of cationic alkyltrimethylammonium bromides (CnTAB, with n = 8, 12, 16, 18) mixed with three non-ionic surfactants (n-octanol, methyl isobutyl carbinol, tri(propylene glycol) butyl ether) was chosen as a model system. In addition to the cationic-non-ionic system, the mixture of anionic-non-ionic surfactants (sodium dodecyl sulphate and tri(propylene glycol) butyl ether) was investigated. The foam behavior of one-component solutions and binary mixtures was characterized as a function of surfactant concentration, number of carbons (n) in alkyl chain of CnTAB as well as type of surfactant. It was shown that synergism in foamability could be produced by the ionic-non-ionic systems, and the concentration below the synergism occurs, called the critical synergistic concentration (CSC), that can be easily predicted based on the surface tension data on individual components.
1. Introduction
Surfactants are commonly used in our daily life and industrial applications. Surfactant blends can form mixed micellar aggregates that are usually superior in achieving better technical and economic advantages from those of individual components [1,2,3,4]. Mixtures of surfactants with a synergistic effect are commonly used because they are effective at much lower concentrations than individual surfactants, which means smaller amounts of chemical are used and consequently smaller amounts of waste products should be removed from industrial processes. The synergism between surfactants is mostly determined based on the surface tension and froth stability measurements of individual components and their mixtures. Surface tension measurements are relatively simple, but determination of the synergistic effect of binary surfactant mixtures causes many problems. The synergistic effect is usually determined empirically based on the value of critical micelle concentration (CMC) of individual surfactants and CMC of the mixed surfactants solution, which depends on a molar fraction of each component in the mixture [5,6]. It requires time-consuming laboratory tests. Moreover, in most industrial applications the concentration of chemical used is much lower than CMC.
Thus, the goal of our paper is to present and validate a simple method for determination of the critical synergistic concentration (CSC), that is the concentration below which the synergism between binary surfactants in their foamability occurs [7]. Values of CSC can be easily predicted based on the surface tension data on individual components, which can be either found in a myriad of published papers or easily determined.
2. Materials and Methods
2.1. Materials
Alkyltrimethylammonium bromides (CnTAB, n = 8, 12, 16, 18) purchased from Sigma-Aldrich (St. Louis, MO, USA), were used as cationic surfactants. Sodium dodecyl sulphate (Sigma-Aldrich, ≥99%) was used as an anionic surfactant. Methyl isobutyl carbinol (MIBC, Sigma-Aldrich, ≥98%), n-octanol (VWR, ≥98%), tri(propylene glycol) butyl ether (C4P3, Sigma-Aldrich, ≥98%) were used as non-ionic surfactants. All surface-active substances (SAS) were used without further purification. Characteristics of the SAS used is provided in Table 1. Mill-Q water (ca. 18 MΩ.cm, 2 ppb TOC) was used for cleaning and for preparation of one-component and mixed SAS solutions.

Table 1.
Properties of ionic and non-ionic surface-active substances (SAS) used.
In all experiments the concentration of the ionic SAS (CnTAB, SDS) were changed gradually and those compounds were treated as the main solution components. The non-ionic SAS were treated as additives and their concentrations were kept constant, independent of the ionic SAS concentration.
2.2. Surface Tension Measurements
Equilibrium values of surface tension in one-component solutions of C8TAB, C12TAB, C16TAB, and n-octanol were determined via a pendant drop profile analysis technique (KRÜSS DSA 100). The values of surface tension of other SAS (in one-component solutions) were taken from the literature: C18TAB (Du Noüy ring method [10]), SDS (drop profile analysis [13]), C4P3 (Du Noüy ring method [14]), MIBC (Wilhelmy plate method [15]).
The parameters of adsorption isotherms of the studied SAS were evaluated by fitting the theoretical curves to the experimental points (below critical micelle concentration–CMC), according to the Frumkin model (Equation (1)). In the fitting procedure, the IsoFit software and numerical approach described elsewhere [16] were applied. The theoretical curves, presented in Figure 1 as solid lines, were obtained on the basis of the following equations:
where c is the SAS concentration, b is the adsorption constant, is the surface pressure, Γ is the surface concentration, ω is the area per adsorbed molecule in the close-packed monolayer (equal to 1/Γ∞, where Γ∞ is maximum surface concentration), and α is the parameter related to the interaction between adsorbed molecules. The parameter α is related to the characteristic interaction energy:
where R is universal gas constant and T is temperature (here 295.15 K). The parameters of the fitted Frumkin isotherms are listed in Table 2.
Es = αRT
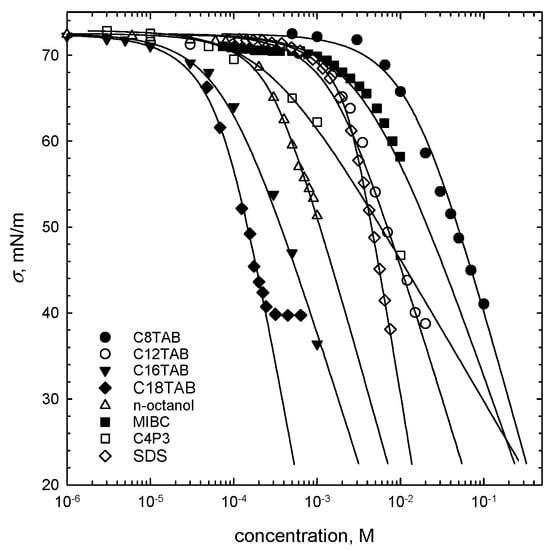
Figure 1.
Surface tension isotherms (points) with the Frumkin model (Equation (1)) fitted to the experimental data (solid lines). The parameters of the fitted Frumkin isotherms are listed in Table 2.
Table 2.
Parameters of the Frumkin isotherm (Equation (1)) fitted to experimental data.
2.3. Foamability Tests
Foamability of pure and mixed solutions of the SAS listed in Table 1 were studied using a Dynamic Foam Analyzer apparatus (DFA100, KRÜSS GmbH, Hamburg, Germany). The experimental set-up consisted of a cylindrical glass column, mounted in a stand and two vertical rows of photodiodes as a light source and a light scanner for automatic measurement of foam height (Hf) as a function of time. A filter paper roundel (pore size 12–15 μm) fixed at the bottom of the column was used as the air disperser. Before each experimental series, the column was carefully washed with diluted Mucasol® solution (commercially available laboratory glass cleaning liquid, purchased from Sigma-Aldrich), rinsed with large quantity of Milli-Q water, and dried under ambient pressure. During each experiment the column of the DFA apparatus was filled with 50 mL of the studied solution. The air was pumped through the filter paper with a constant flowrate of 0.5 L/min for a specific time (foaming time—tf), equal to 20 s, and the evolution of the foam height was measured by photodiode modules (blue—λ = 469 nm, structure illumination 20%, height illumination 20%) and recorded by the PC, employed with ADVANCE Software (KRÜSS GmbH). In addition, the liquid content in the formed foam (Φ) was measured at seven different levels by two parallel electrodes. Foamability tests were performed 3–5 times and final results were calculated as an average. The experiments were focused on determination of foamability performance of the cationic CnTAB and anionic SDS pure solutions of various concentrations and their mixtures with non-ionic SAS additives (n-octanol, MIBC and C4P3).
The foamability tests were performed at room temperature (22 ± 1 °C).
3. Results and Discussion
3.1. Foamability Tests
The foam height values, determined for tf = 20 s are presented in Figure 2, as a function of CnTAB solution concentrations. In all cases the results for one-component solutions are represented by full circles. In addition, foam height values for binary mixtures with n-octanol (red full squares), MIBC (green triangles), and C4P3 (blue inverted triangles) are added. Concentrations of non-ionic additives in mixtures were constant and equal to 5 × 10⁻⁴ M for n-octanol and C4P3, and 5 × 10⁻³ M for MIBC. These specific concentrations of non-ionic additives to the ionic SAS (main mixture component) were chosen on the basis of systematic studies, as those having the smallest concentration yielding relatively significant changes in the foam height of mixed solutions. The analysis of this phenomenon is presented below.
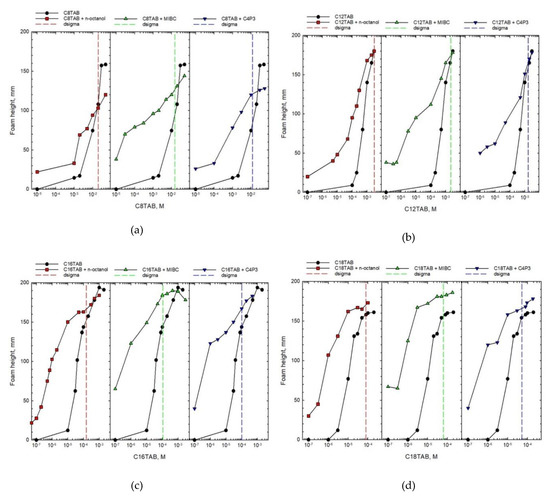
Figure 2.
Foam height as a function of concentration of one-component solution and mixture of CnTAB (main component) with different non-ionic additives. The dσ (dsigma) values determined for each system are marked with vertical dashed lines.
As seen in Figure 2, the height of formed foam increases with increasing the SAS solution concentration both for one-component and blended solutions, what is obvious and expected. However, the comparison of magnitude of this effect shows completely different trends. It is clear that in the case of blends, the concentration of the main solution component (CnTAB) necessary to obtain similar foam height is significantly shifted towards smaller values. This shift is the highest for smaller concentrations, where similar foam heights were observed for concentrations of CnTAB that differed even by two orders of magnitude. It is also evident that differences in the foam heights observed for pure and mixed solutions diminish with increasing concentration of the main component. Above a certain concentration the height of foam is practically identical or, as can be observed for CnTAB with n = 8, 12, and 16, even smaller for binary mixtures. The results presented in Figure 2 directly indicate that the non-ionic SAS addition to the CnTAB solutions caused a strong synergistic effect—foamability in binary mixtures is much higher compared to the one-component solution. However, this conclusion holds below the threshold concentration, which was called as critical synergistic concentration (CSC) [7].
A similar picture can be observed for foamability performance of solutions of anionic SDS with 5 × 10⁻⁴ M of C4P3 as the non-ionic additive, presented in Figure 3. Here the synergistic effect starts in mixed solutions at very small SDS concentrations (of order of 10−8 M), where there was no foam formation in the one-component system. In mixed solutions foamability increased remarkably and the synergistic effect in this case is very strong. The vertical lines shown in Figure 2 and Figure 3 for each of the studied systems indicate the value of dσ, expressed as a difference between the surface tension of water (σwater) and the surface tension of solution of given concentration (σc). This parameter is crucial for discussion on the mechanism of synergistic effect existence and will be explained and analyzed in detail below.
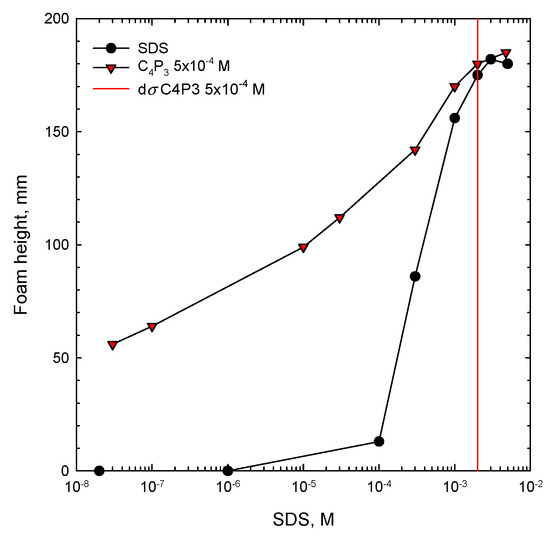
Figure 3.
Foam height as a function of concentration of SDS one-component solution and its mixture with C4P3 as the non-ionic additive. The determined value of the dσ critical synergistic concentration (CSC) is marked with a vertical line.
3.2. Analysis of Synergistic Effect Origin
An analysis of the liquid content (Φ) values for foams formed in each of the considered solutions (one-component or blended) revealed that we were dealing with so-called wet (transient) foams, which were relatively unstable and ruptured before the draining liquid films were able to reach the dry state. The liquid content measured in the DFA100 apparatus during foam formation and decay stages varied between 10% and 30% depending on the SAS type, solution concentration, and investigated foam level. These Φ values directly indicated that the foams were in a transient form [17,18,19,20].
In the case of the wet foams, the critical thicknesses of rupture of the foam films are usually within a range of 1–10 μm [21], where the forces of disjoining pressure (specific forces of interaction between liquid/gas interfaces) do not yet start to operate. As a result, disjoining pressure forces, significant for well-drained quasi-static polyhedral foams (characterized by Φ < 1%), do not play any significant role in the mechanism of the wet foam stability. It is well-established that for wet foams, which are dynamic and highly non-equilibrium systems, this mechanism is governed by elasticity forces [21,22]. The surface dilational modulus E, which is closely related to the Gibbs elasticity of thin liquid films, is expressed as [21,22]:
where σ is the solution surface tension and A is the area of the liquid/gas interface. The E is a measure of resistance against creation of surface tension gradient as well as a rate at which these gradients disappear, when the dynamic system shifts towards more equilibrium conditions. It is, therefore, a measure of forces opposing foam films drainage [20]. As seen in Equation (4), the E is directly proportional to the changes in the liquid/gas interfacial tension (dσ).
The values of dσ are calculated as:
where σwater is the water surface tension and σ(c) is the surface tension of SAS of a given concentration [7,21]. Calculated dσ values for each studied SAS (one-component system) are presented in Figure 4 as a function of their solution concentration. There are additionally plotted (as horizontal lines) dσ values for non-ionic SAS solutions of given concentrations used as the additives for preparation of the binary mixtures. As seen, these lines delimit two dσ regimes, which are crucial for determination of the CSC value and was discussed in detail in our previous paper for n-octanol [7]. It was concluded there that n-octanol as the non-ionic additive to the cationic surfactant solution in a binary mixture, participates in the mixed adsorption layer formation at the rising bubbles surface and causes an increase in the E value of the liquid/gas interface. As a consequence, the solution foamability is enhanced. This effect, however, is significant only for the dσ lying below the threshold value, indicated by the horizontal line, above which the n-octanol molecules start to be a minor component of the adsorption layer [7], and where E values are determined mainly by the mixture main constituent. The way of determining the CSC values on the basis of dσ is presented in Figure 4b. A similar procedure was applied for two other non-ionic SAS with their mixtures with CnTAB solutions of various concentrations. From the intersection of the dσ vs. concentration dependence plotted for the main solution component and the dσ value calculated for non-ionic additive of given concentration, the CSC values were determined. These values indicated the threshold concentration of the mixed solution main component, for which, in the presence of specific non-ionic SAS of a given concentration, the synergistic effect on solution foamability was observed. The CSC values calculated according to this approach are listed in Table 3.
dσ = σwater − σ(c)
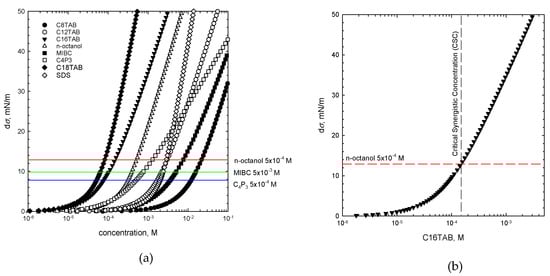
Figure 4.
(a) The values of dσ calculated for one-component solutions, (b) way of determination of the CSC values on the basis of the dσ value (Equation (5)).
Table 3.
Values of critical synergistic concentrations (CSC) calculated from dσ values (see Figure 4b).
Figure 5 shows a correlation between CSC values taken directly from the Figure 2 (Hf CSC) and dσ CSC values determined for alkyltrimethylammonium bromides homologs (CnTAB, n = 8, 12, 16, 18). The solid lines are the linear regressions fitted to the determined CSC data. As seen, Hf CSC and dσ CSC stay in quite a good agreement, confirming correctness of the postulated mechanism about the additive character of the E parameter and crucial role of concentration-dependent contribution of the non-ionic additive into the mixed adsorption layer. The dependence of the CSC vs. concentration can be described by the following linear relations:
where (n) is the number of carbon atoms in the alkyl chain of CnTAB. Such relations can be used as a very useful tool for determination of the CSC values for foamability performance of the CnTAB/non-ionic SAS binary mixtures. Moreover, a good correlation between Hf CSC and dσ CSC values implies that the CSC can be calculated also for other ionic/non-ionic SAS blends, using only the data on surface tension of solutions main component and non-ionic additive as a foamability enhancer (as already shown for SDS in Figure 3). Therefore, solution foamability predictions and the approximate CSC value can be achieved without performing time-consuming foamability tests. Certainly, the relations shown in Figure 5 and described by Equations (6)–(8) hold only for n-alkyltrimethylammonium bromides homologs and non-ionic additives listed in Table 1. Nevertheless, a similar analysis can be very easily performed for other ionic surfactants (even on the basis of literature surface tension isotherms), which can be further used for preparation of proper surfactant blends, having a desired foamability performance. This is especially important for all separation techniques where foam is a crucial and necessary separation prerequisite—for example in the froth flotation, where foam should be stable enough to assure concentration of a floated particulate matter in a foam layer at the top of flotation vessel, and simultaneously should be unstable enough to decay quickly outside of a flotation machine.
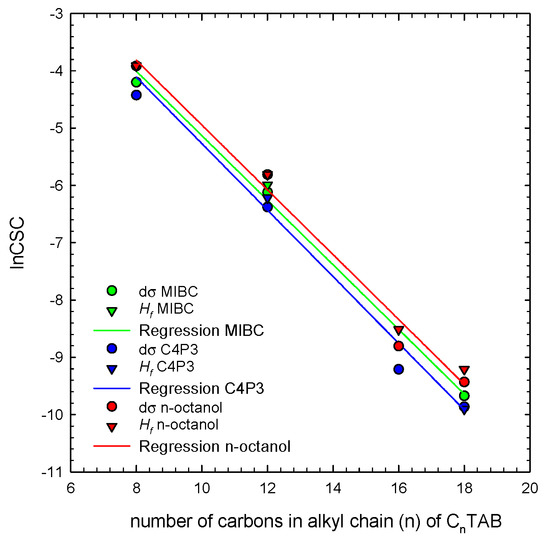
Figure 5.
Correlation between Hf lnCSC and dσ lnCSC values determined for n-alkyltrimethylammonium bromides homologs (CnTAB) in mixture with non-ionic SAS.
4. Conclusions
Synergism in foamability could be produced by the cationic-non-ionic systems, where concentrations of mixtures’ components are properly adjusted. For such mixtures two molecular arrangements at adsorbed zones can be formed, that is one influenced by non-ionic surfactant and the other dominated by ionic surfactant. The shift between these two mechanisms can be now easily estimated by the critical synergistic concentration (CSC) value, that is the concentration below which the synergism occurs. The value of CSC can be easily predicted based on the surface tension data on individual components which can be either found in a myriad of published papers or easily determined.
Author Contributions
Conceptualization, J.Z., A.W.-P., P.B.K.; methodology, J.Z., A.W.-P., P.B.K.; investigation, J.Z., A.W.-P., P.B.K.; writing—original draft preparation, J.Z., A.W.-P., P.B.K.; writing—review and editing, J.Z., A.W.-P., P.B.K.; visualization, P.B.K.; supervision, J.Z., P.B.K. All authors have read and agreed to the published version of the manuscript.
Funding
This research was funded by Polish National Science Centre (grant No. 2017/27/N/ST4/01187) and statutory research found of ICSC PAS.
Acknowledgments
The authors wish to thank the Department of Geosciences and Petroleum (IGP, NTNU) for the use of its laboratory facilities.
Conflicts of Interest
The authors declare no conflict of interest.
References
- Rosen, M.J. Surfactants and Interfacial Phenomena; Wiley: New York, NY, USA, 1989. [Google Scholar]
- Chen, Z.; Deng, S.; Li, X. Micellization and synergistic interaction of binary surfactant mixtures based on sodium nonylphenol polyoxyethylene ether sulfate. J. Colloid Interface Sci. 2008, 318, 389–396. [Google Scholar] [CrossRef] [PubMed]
- Le, T.N.; Phan, C.M.; Nguyen, A.V.; Ang, H.M. An unusual synergistic adsorption of MIBC and CTAB mixture at the air-water interface. Miner. Eng. 2012, 39, 255–261. [Google Scholar] [CrossRef]
- Dey, S.; Pani, S.; Singh, R. Study on interactions of frother blends and its effect on coal flotation. Powder Technol. 2014, 260, 78–83. [Google Scholar] [CrossRef]
- Rosen, M.J. Predicting synergism in binary mixtures of surfactants. Prog. Colloid Polym. Sci. 1994, 95, 39–47. [Google Scholar]
- Jost, F.; Leiter, H.; Schwuger, M.J. Synergisms in binary surfactant mixtures. Colloid Polym. Sci. 1998, 266, 554–561. [Google Scholar] [CrossRef]
- Zawala, J.; Wiertel-Pochopien, A.; Larsen, E.; Kowalczuk, P.B. Synergism between cationic alkyltrimethylammonium bromides (CnTAB) and nonionic n-octanol in foamability of their mixed solutions. Ind. Eng. Chem. Res. 2020, 59, 1159–1167. [Google Scholar] [CrossRef]
- Zielinski, R. Effect of Temperature on micelle formation in aqueous NaBr solutions of octyltrimethylammonium bromide. J. Colloid Interface Sci. 2001, 235, 201–209. [Google Scholar] [CrossRef] [PubMed]
- Stubenrauch, C.; Fainerman, V.B.; Aksenenko, E.V.; Miller, R. Adsorption behavior and dilational rheology of the cationic alkyl trimethylammonium bromides at the water/air interface. J. Phys. Chem. B 2005, 109, 1505–1509. [Google Scholar] [CrossRef] [PubMed]
- Lu, J.R.; Simister, E.A.; Thomas, R.K.; Penfold, J. Structure of an octadecyltrimethylammonium bromide layer at the air/water interface determined by neutral reflection: Systematic errors in reflectivity measurements. J. Phys. Chem. 1993, 97, 6024–6033. [Google Scholar] [CrossRef]
- Benito, I.; Garcia, M.A.; Monge, C.; Saz, J.M.; Marina, M.L. Spectrophotometric and conductimetric determination of the critical micellar concentration of sodium dodecyl sulfate and cetyltrimethylammonium bromide micellar systems modified by alcohols and salts. Colloids Surf. A 1997, 125, 221–224. [Google Scholar] [CrossRef]
- Wang, J.; Li, G.; Li, S.; Wang, Y.; Xing, Y.; Ma, Z.; Cao, Y. Investigation on properties of aqueous foams stabilized by aliphatic alcohols and polypropylene glycol. J. Dispers. Sci. Technol. 2019, 40, 728–736. [Google Scholar] [CrossRef]
- Kairaliyeva, T.; Mucic, N.; Spasojevic, L.; Bucko, S.; Katona, J.; Aksenenko, E.; Aidarova, S.; Fainerman, V.; Makievski, A.; Tarasevich, Y.; et al. Surface tension measurements with the drop profile analysis tensiometry—Consideration of the surfactant mass balance in a single drop. Colloids Interfaces 2017, 1, 1. [Google Scholar] [CrossRef]
- Szczerkowska, S.; Wiertel-Pochopien, A.; Zawala, J.; Larsen, E.; Kowalczuk, P.B. Kinetics of froth flotation of naturally hydrophobic solids with different shapes. Miner. Eng. 2018, 121, 90–99. [Google Scholar] [CrossRef]
- Phan, C.M.; Nakahara, H.; Shibata, O.; Moroi, Y.; Le, T.N.; Ang, H.M. Surface potential of methyl isobuthyl carbinol adsorption layer at the air/water interface. J. Phys. Chem. B 2012, 116, 980–986. [Google Scholar] [CrossRef] [PubMed]
- Fainerman, V.B.; Aksenenko, E.V.; Miller, R.; Makievski, A.V. Surfactants Chemistry, Interfacial Properties, Applications; Fainerman, V.B., Mobius, D., Miller, R., Eds.; Elsevier: Amsterdam, The Netherlands, 2001; pp. 189–286. [Google Scholar]
- Khakalo, K.; Baumgarten, K.; Tighe, B.P.; Puisto, A. Coarsening and mechanics in the bubble model for wet foams. Phys. Rev. 2018, 98, 012607. [Google Scholar] [CrossRef] [PubMed]
- Drenckhan, W.; Hutzler, S. Structure and energy of liquid foams. Adv. Colloid Interface Sci. 2015, 224, 1–16. [Google Scholar] [CrossRef] [PubMed]
- Furuta, Y.; Oikawa, N.; Kurita, R. Close Relationship between a dry-wet transition and a bubble rearrangement in two-dimensional foam. Sci. Rep. 2016, 6, 37506. [Google Scholar] [CrossRef] [PubMed]
- Langevin, D. Aqueous foams and foam films stabilised by surfactants. gravity-free studies. C. R. Méc. 2017, 345, 47–55. [Google Scholar] [CrossRef]
- Malysa, K. Wet foams: Formation, properties and mechanism of stability. Adv. Colloid Interface Sci. 1992, 40, 37–83. [Google Scholar] [CrossRef]
- Exerowa, D.; Kruglyakov, P.M. Foam and Foam Films: Theory, Experiment, Application; Elsevier: Amsterdam, The Netherlands, 1997. [Google Scholar]


© 2020 by the authors. Licensee MDPI, Basel, Switzerland. This article is an open access article distributed under the terms and conditions of the Creative Commons Attribution (CC BY) license (http://creativecommons.org/licenses/by/4.0/).