1. Introduction
With increasing environmental pollution and fossil fuel depletion, electric vehicles are gradually appearing in the automotive market, as they produce no pollution and use electricity instead of fuel [
1,
2]. As the power source of electric vehicles, Li-ion batteries are characterized by high energy density, low self-discharge rate, no memory effect, and a small size, so they are favored by automobile manufacturers [
3,
4,
5]. However, electric vehicles are at risk of spontaneous combustion, attributed to the high surface temperature of the Li-ion battery used in electric vehicles, causing thermal runaway where the temperature of the batteries rises constantly, even causing fire. As a result, the battery does not work normally [
6]. During the Li-ion battery charging and discharging process, complex chemical reactions occur in its interior and heat is generated, so the temperature of the battery continuously rises [
7]. If the heat cannot be dissipated in time, thermal runaway of the Li-ion battery may occur [
6]. Therefore, a battery thermal management system (BTMS) to control the temperature of the battery is essential to ensure the normal working and the safety of electric vehicles.
Some studies have been conducted on BTMS, and various cooling methods for Li-ion batteries have been proposed. For an air-cooling system (ACS), where air is used as the cooling medium, the battery pack is primarily cooled by heat convection. However, the ACS is unable to meet the cooling demands of the battery [
8]. A liquid cooling system (LCS) for batteries was also developed to cool or heat the battery pack. Rao et al. [
9] designed a BTMS based on liquid cooling for a cylindrical Li-ion battery pack and researched the change of in-battery contact surface to determine the length of pack block when the flowing rate of cooling liquid is at the optimal efficiency. Under a battery heat generation of 30 W, Pesaran et al. [
10] tested oil and air as cooling media. Their results showed that the surface temperature of the battery in the oil cooling system is nearly 10 °C lower than in ACS under the same working conditions.
Versatile materials have gradually been developed. Researchers explored materials with special characteristics that can be used in BTMS and applied phase change heat transfer media to BTMS. The principle involves using the characteristics of phase change materials (PCMs) to store or release energy through a phase change without significantly changing the temperature. At high discharge rates, Sabbah et al. [
11] conducted experiments using 18,650 batteries to demonstrate that the thermal management effect of PCM cooling is better than that of air. Rao and Zhang et al. [
12,
13,
14] studied different models and concluded that by allowing batteries to be in direct contact with the PCM, the surface temperature of the battery can be reduced by 18 °C. Wu et al. [
15] constructed a new type of reinforced composite phase change material (CPCM) based on copper mesh, paraffin, and expanded graphite for BTMS. The heat dissipation and temperature uniformity of the CPCM were better than that of the traditional air convection and PMC.
In addition to the above studies, a heat pipe (HP) with high thermal conductivity in the longitudinal direction and isothermal properties in heat conductive direction, and a thermoelectric cooler (TEC) characterized by refrigeration ability, rapidly transferring heat, small size, and high reliability, were both investigated [
16,
17,
18]. Joshua et al. [
19] applied the HP to BTMS, and found it can better control the temperature of the Li-ion battery than the traditional liquid cooling system. Deng et al. [
20] combined an L-style HP with an aluminum plate to build a BTMS and showed that with ambient temperature increasing, the heat dissipation from HP increases and the increasing rate of battery temperature reduces. Wang [
18] selected the optimal working current of the TEC and built a BTMS based on it. The results showed the advantage of controlling the temperature of the TEC. High-temperature environments have no significant effect on the performance of the TEC. Lu et al. [
21] verified that the TEC is highly effective for heating or cooling the battery pack. Shashank et al. [
22] arranged battery cells in an inverted position within a battery pack filled with a PCM, which improved the performance of the BTMS. Further research found that a TEC connected with one side of the battery pack can improve the reliability of the system.
However, at a high discharge rate, the HP cannot sufficiently dissipate battery heat. Though the heat of the battery can be dissipated quickly by the cold side of TEC, the heat produced on the hot side is hard to be dissipated under natural conditions. Therefore, this paper proposes a BTMS combining an HP with TEC. With this system, the heat produced on the hot side of the TEC can be quickly transferred to the device dissipating heat by the HP. Both numerical simulations and discharging experiments were conducted to research the surface temperature rising characteristics of the battery with different discharge rates. To reduce the energy consumption but maintain the surface temperature of the battery within the optimal temperature, we performed experiments during which the TEC began to work at different temperatures.
2. Theoretical Analysis
A TAFEL-LAE895 100 Ah ternary Li-ion battery, which was produced by TAFEL company of Jiangsu province, China, was selected for analysis in this research. Its main parameters are provided in
Table 1.
The heat generated by the battery includes electrochemical reaction heat, joule heat, polarized heat, and side reaction heat [
23], which can be calculated by
where
Q is the total heat generated by the battery;
Qr is the electrochemical reaction heat, which refers to the heat generated by the electrochemical reaction when lithium ions are intercalated and deintercalated between the anode and cathode materials in the process of charging and discharging;
Qj represents joule heat generated by joule internal resistance;
Qp represents polarized heat, which refers to the heat generated by the polarized internal resistance due to the polarization of the battery during the charging and discharging process; and
Qs is side reaction heat, which is the heat generated in the process of the decomposition and reaction of the electrolyte, the thermal decomposition of the anode and cathode materials, and the decomposition of the separator.
Due to the influence of the environment and heat loss of transmission, directly measuring the heat generated by a Li-ion battery in the experiment was difficult. In this work, the calculation method proposed by Bernardi et al. [
24] was adopted. Under the assumption that the heat generation inside the Li-ion battery is uniform, a theoretical formula of the heat generation rate was proposed [
25,
26]. The formula is simplified as
where
I represents the charging and discharging current of the Li-ion battery;
E and
U are the open and closed circuit voltages, respectively; and
T represents the surface temperature of the battery, the unit of which is kelvins. The first term on the right side of the equation represents the irreversible reaction heat, such as joule heat and electrochemically polarized heat, which can be represented by
I2R, where
R is the total internal resistance of the Li-ion battery. The second term represents the heat generated by the reversible reaction, and the Li-ion battery generally takes a reference value of 0.042 [
25]. After the values are inserted into the formula, we have
The value of
R can be tested using a Hybrid Pulse Power Characteristic (HPPC) experiment. The value of
R is calculated in
Table 2.
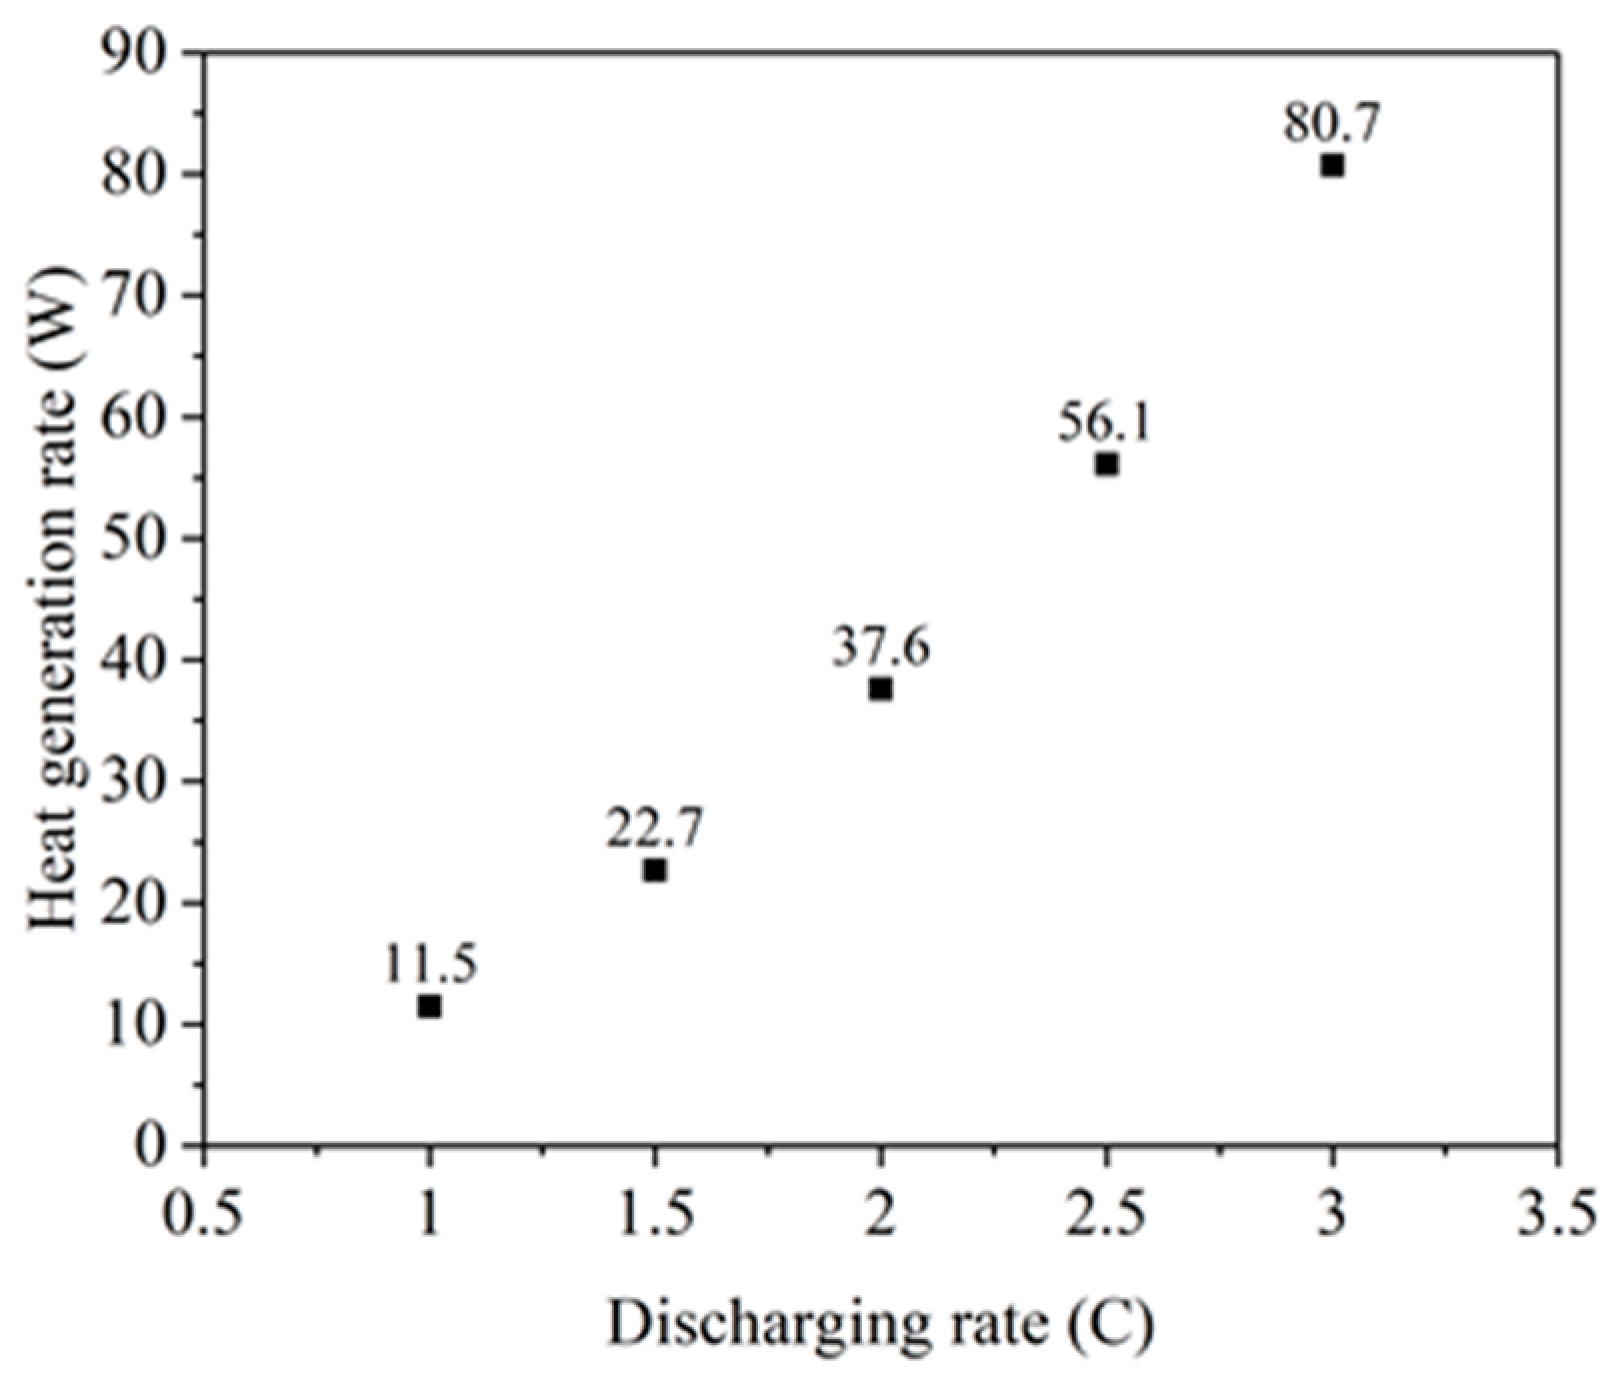
The heat generated by the Li-ion battery at different discharge rates can be calculated as shown in
Figure 1.
Note that the battery discharge rate is measured in C, which means that battery discharges its rated capacity within the specified time (C = current/rated capacity).
As shown in
Figure 1, with increasing discharge rate, the heat-generating rate rises in an accelerated manner, from 11.5 W at a 1 C discharge rate to 80.7 W at a 3 C discharge rate.
3. Numerical Simulations
Analyzing the temperature of a battery is a prerequisite for designing a highly efficient battery thermal management system. Numerical simulations were used to examine battery surface temperature change at different discharge rates to verify the effect of the theoretical model and help design the experimental BTMS model.
3.1. Simulation Model Design
3D design software, that is, Solidworks of Dassault Systemes S.A company, was used to build models of the battery, the BTMS based on an HP, and the combined HP and TEC system. The sizes of the models were designed as experimental devices. To achieve a more uniform temperature distribution and to accelerate heat dissipation, aluminum sheets were added to the surface of the battery, and grooved aluminum sheets were fixed to the HP. Heat sinks and fans were added. The model is shown in
Figure 2.
The 3D model was imported into Fluent, the computational fluid dynamics (CFD) software. For simulation, the following assumptions were made:
- (1)
Since the fluidity of the electrolyte inside the Li-ion battery is weak, we assumed that the heat transfer inside the battery could be ignored.
- (2)
The battery was considered as an ideal whole and its internal heat generation was uniform.
- (3)
The complex internal structure of the HP was regarded as a solid piece with equivalent thermal conductivity [
27].
In the transient simulation model, first-order upwind and laminar flow method were adopted, and then the energy equation was turned on. The environmental temperature was set to ambient room temperature, which is 298 K. The boundary conditions of the battery were set to natural convection. The convective heat transfer coefficient was set to 3.5 Wm−2K−1, adding a wind speed of 7 m s−1 to the heat sink to simulate the airflow speed generated by the fan. The heat sink was composed of aluminum, so the parameters of the heat sink, aluminum sheet, and grooved aluminum sheet were the same: density of 2719 kg m−3, specific heat capacity of 871 J kg−1K−1, and thermal conductivity of 202.4 Wm−1K−1.
During the calculation, the residuals of the conservation equations, temperature of characteristics, and the characteristic plane were detected. When the residual was less than 10−6 and the temperature change at the detection point was less than 0.1%, the calculation was considered to reach convergence.
3.2. Simulation Results and Analysis
3.2.1. Simulation of Surface Temperature Rise of Battery in Natural State
For the natural working state of the battery pack, without any additional device to help dissipate heat, the model was meshed with 216,448 elements. The rate of generating heat is provided in
Figure 1 and the simulation results of the battery pack are shown in
Figure 3.
Figure 3c shows the highest and lowest surface temperatures of the battery and the percentage of difference in surface temperature at the end of discharging. In
Figure 3, with the increase in the discharge rate, the surface temperature shows an upward trend, as does the temperature difference ratio. The difference in temperature was moderate at less than 1.2%; thus, it was regarded as uniformly distributed. The temperature was 316.1 K at a 1 C discharge rate, which is within the range of optimal working temperature between 293 K to 318 K. However, at 2.5 and 3 C discharge rates, the surface temperatures all exceeded 323 K. Working for a long time at such a high temperature will have an irreversible impact on battery performance and cycle life. The heat generated by the battery will accumulate, causing thermal runaway and may lead to battery fire or explosion.
3.2.2. Simulation with an Added HP
With an HP, a heat sink, and a fan attached to the surface of the battery, the model was modeled with 292,605 elements with the same assumptions applied. The heat generation rate of the Li-ion battery selected in this paper was 80.7 W at the maximum 3 C discharge rate. Therefore, the HP with a power of 80 W, a length of 240 mm, a width of 11 mm, and a thickness of 2 mm was selected in this study. The wick material of the selected HP was copper, and the heat pipe was regarded as special copper with high thermal conductivity. The thermal conductivity of the HP is shown in
Table 3, which was measured by an experimental method previously reported [
27,
28].
The density and specific heat capacity of the HP were 4000 kg m
−3 and 400 J kg
−1K
−1, respectively [
27]. The results of the simulation are shown in
Figure 4.
Figure 4 shows that the surface temperatures were significantly lower than in the previous natural state at different discharge rates. The maximum temperatures were 337.1 K at a 3 C discharge rate and 315 K at 1.5 C, which are 9.1 and 7.7 K lower than those in the natural state shown in
Figure 3, respectively. However, the difference in surface temperature was substantially larger than that under the natural state because the width of the HP was narrower than that of the battery, and the surface heat of the battery near the HP was more quickly dissipated. The effectiveness of the HP was limited. At a 3 C discharge rates, the surface temperature still exceeded 323 K, indicating that additional measures were needed to further lower the temperature.
3.2.3. Simulations for Combined HP and TEC
As shown in
Figure 5, the TEC was mainly composed of a series of N- and P-type thermo-elements, which were connected to each other using a metal conductor. When current passes through the unit, the energy transfers through the circuit and forms the cold and hot sides of the TEC [
16].
When a TEC is used for refrigeration, the cold side is attached to the power source and the hot side is attached to the dissipating device. Therefore, TEC was regarded as a cuboid for simulation. The side of the cuboid with negative power simulated the cold side of the TEC to absorb heat, and the other side, with positive power, simulated the hot side to dissipate heat [
29]. The power was calculated by the optimal working current, the corresponding voltage, and the coefficient of performance (COP). The optimal working current of the TEC selected was 3.96 A, and the corresponding voltage was 7.8 V. The power was 17.92 W = 3.96 A × 7.8 V × 0.58. The other part of the cuboid was regarded as particular material, whose thermal conductivity was 1.5 Wm
−2K
−1. With the added TEC, the model was meshed into 296,569 elements. The simulation results are shown in
Figure 6.
Figure 6 shows that the surface temperatures of the battery were significantly lower than that with only the HP at different discharge rates. The maximum temperature was 325.4 K at a 3 C discharge rate and 316.4 K at a 2 C discharge rate, which are 11.7 and 9 K lower, respectively, than that in the HP alone case shown in
Figure 4. This combined BTMS can reduce the surface temperature of the battery pack and basically keep the battery working within a reasonable temperature range.
4. Experiment
The three discussed BTMS models analyzed by the simulations were tested to verify the practicality of the design and the simulation results.
4.1. Experimental Design
To avoid being influenced by the environmental temperature during the experiment, the battery pack was placed in a thermotank. The thermotank was set to 298 K to simulate the ambient environmental temperature; the battery pack was charged and discharged by a charging tester. The first constant current and then constant voltage (CC-CV) method was adopted to charge the battery. High accuracy and low-cost Omega T-type thermocouples were used as temperature sensors and were connected to a data acquisition instrument to acquire the temperature of the battery over time. A micro temperature control module was used to operate the TEC according to the surface temperature of the battery pack. Four Li-ion batteries were connected in series into a battery pack, and its working voltage was 11.2–16.8 V. Four temperature measuring points were selected on the front and back sides of each battery, and two more measuring points were arranged on opposite sides of each battery. Data obtained from the six measuring points were then averaged to represent the temperature characteristics of this battery. The measuring points of the battery are shown in
Figure 7.
4.2. BTMS Experiment and Results Analysis
4.2.1. Surface Temperature Rise of Battery in Natural State
Four batteries were connected in series with a distance of 2 Cm and placed in the thermotank for 1 h to stabilize the surface temperature of the battery at 298 K. Then, the experiments were conducted at different discharge rates. To ensure the same discharging capacity each time and avoid damage to the battery, a discharge capacity of 90 Ah was used. After each charging and discharging cycle, the battery was kept for 7 h in the thermotank to stabilize the surface temperature of the battery at 298 K again. The experimental results are shown in
Figure 8.
As shown in
Figure 8, the surface temperature of the battery continued to rise during the discharging period. The drop near the end of each curve indicates that the discharge was over and the battery had begun to cool down. The maximum surface temperature of the battery was 313.2 K at a 1 C discharge rate, and the battery worked within the optimal temperature range throughout the process. As the discharge rate increased, the discharging time shortened and the surface temperature of the battery increased. The maximum surface temperature of the battery reached 343 K at a 3 C discharge rate. A battery operating at this high temperature for a prolonged duration will undergo thermal runaway, which reduces battery capacity and shortens its service life. Therefore, this is not normally permitted and is the key reason to apply a BTMS to battery packs.
4.2.2. Surface Temperature Rise of Battery with BTMS and HP
Figure 9 shows the structure of the BTMS with the HP. One side of the aluminum sheet was in contact with the surface of the battery; the other side was in contact with the evaporation section of HP, which was fixed by a grooved aluminum sheet. The HP condensation section was connected with one side of the heat sink, and the other side of the heat sink with the fan.
The environmental temperature was set to 298 K, and the fan started to work at 298 K. The experimental results are shown in
Figure 10. With this system, we did not study the surface temperature rising characteristics of the battery at a 1 C discharge rate as the temperature remained within the optimal range without the HP.
As seen in
Figure 10, the temperature for discharging at 1.5 C remained within the optimal range, and the maximum temperature was 319.7 K at a 2 C discharge rate and 328.2 K at a 2.5 C discharge rate, above the upper limit, but 5.6 and 4.6 K lower, respectively, than that in the natural state shown in
Figure 8. Thus, it was necessary to take additional measures to further reduce temperature.
4.2.3. Surface Temperature Rise of Battery in BTMS Using Both HP and TEC
Figure 11 shows the structure with a TEC installed between the aluminum sheet and the HP. The cold side of the TEC was connected to the aluminum sheet, which can accelerate heat loss. The hot side was connected to the HP, and the heat generated by the hot side of TEC was transmitted to the heat sink through the HP, and then the fan accelerated the loss of heat.
The two kinds of limits on the working conditions of the TEC are the maximum cooling capacity and the maximum COP. The maximum cooling capacity is when the TEC works at maximum current, but then it consumes a larger amount of power and the obtained COP is also smaller. Although the working condition at maximum COP is better economically as it consumes less power, the cooling capacity is very low. Therefore, the optimal working current must be selected to increase the cooling capacity of the TEC and consume less power. The TEC used in this study was TCE1-12705, which has an optimal working current of 3.96 A according to Wang [
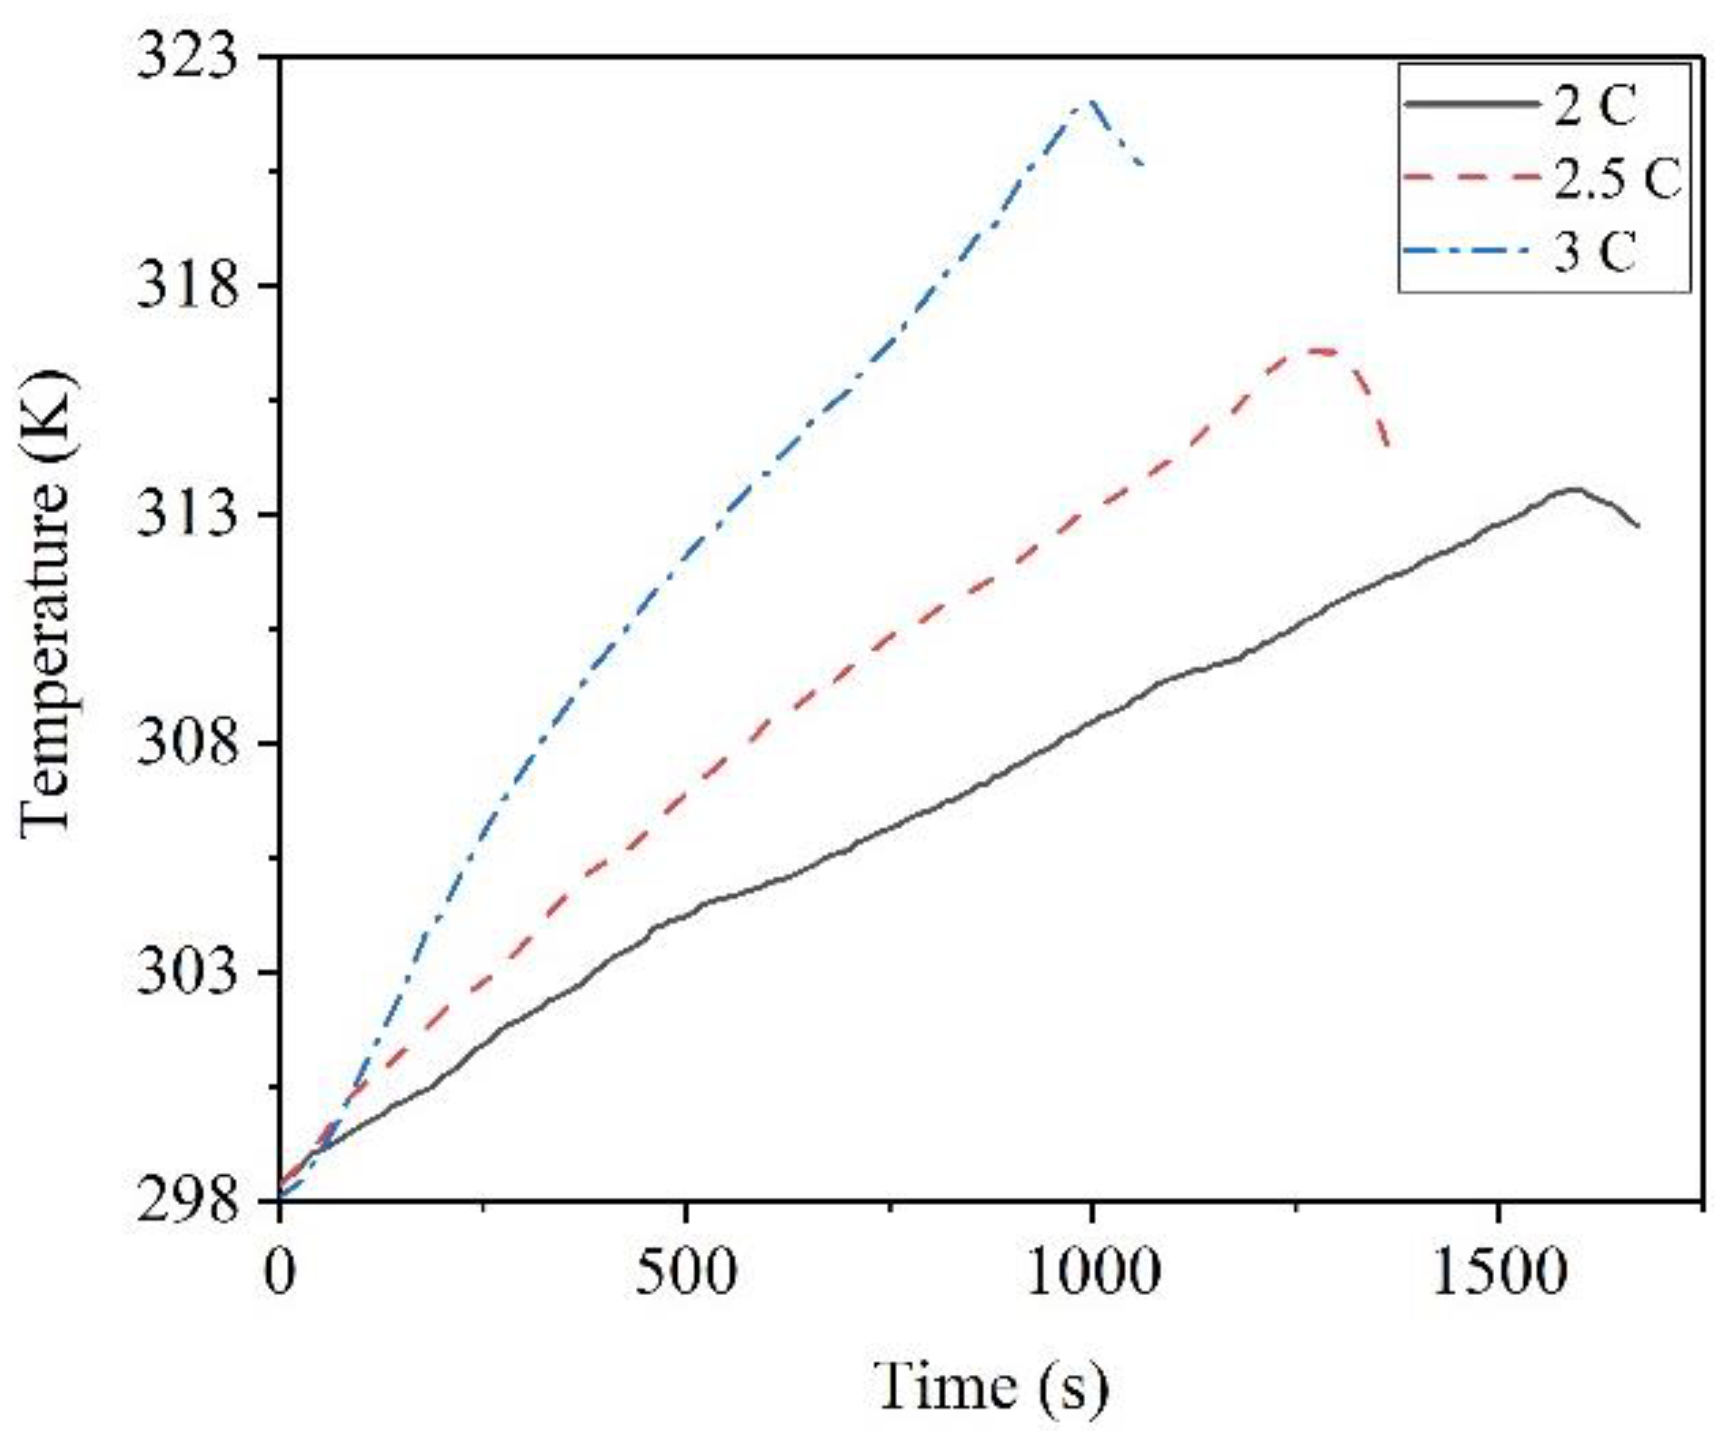
19]. The environmental temperature was set to 298 K, and the TEC and the fan begin to work at 298 K. The experimental results are shown in
Figure 12.
Figure 12 shows that at 2 C and 2.5 C discharge rates, the maximum surface temperature of the battery reached 313.5 K and 316.6 K, respectively, within the optimal working temperature range. At 3 C, the surface temperature of the battery reached 318 K in about 800 s, and 322 K at the end of discharging, which is 11.8 K lower than that of the BTMS based on an HP alone, shown in
Figure 10. According to the experimental results analyzed above, this combined BTMS can effectively control the surface temperature of the battery pack.
4.3. Optimal Working Temperature of TEC
When the BTMS based on HP and TEC was applied to the battery, the surface temperature of the battery was lower than 318 K at the 2 C and 2.5 C discharge rates. To reduce energy consumption, the optimal working temperature of the TEC was selected, and the surface temperature of the battery was still under 318 K. The environmental temperature was 298 K, and the upper limit of the optimal working temperature of the battery was 318 K. Therefore, the TEC worked when the surface temperature of battery reached 298 K, 303 K, 308 K, 313 K, and 318 K. At the 3 C discharge rate, the surface temperature of the battery exceeded 318 K, and we did not study the surface temperature rise characteristics of the battery at the 3 C discharge rate.
As the environmental temperature was set to 298 K, the fan was turned on at 298 K, and the TEC began to work at 298 K, 303 K, 308 K, 313 K, and 318 K. The experimental results of the discharge rates of 2 C and 2.5 C are shown in
Figure 13.
As shown in
Figure 13, with increasing TEC working temperature, the surface temperature of the battery also rose. When the TEC began to work at 308 K, 313 K, and 318 K, the temperature curve tended to decrease at the start of TEC working. At that moment, the cold side of the TEC accelerated the loss of surface temperature of the battery, and the heat generated from the hot side was transferred to the heat sink through the HP.
At the 2 C discharge rate, when the TEC began to work at 318 K, the surface temperature of the battery remained near 318 K until discharge was over. At a 2.5 C discharge rate, when the TEC began to work at 303 K, the surface temperature of the battery remained near 318 K until discharge was over. Therefore, the optimal working temperature for TEC to begin working is 318 K at a 2 C discharge rate and 303 K at a 2.5 C discharge rate.


 ,
, 


