Article

LCA Analysis of Grafted Tomato Seedling Production in Turkey

by
Makbule Nisa Mencet Yelboğa
Department of Agricultural Economics, Akdeniz University, Agriculture Faculty, 07070 Antalya, Turkey
Sustainability 2020, 12(1), 25; https://doi.org/10.3390/su12010025
Submission received: 13 November 2019 / Revised: 13 December 2019 / Accepted: 16 December 2019 / Published: 18 December 2019
(This article belongs to the Section Sustainable Agriculture)

Abstract

:
Seedling grafting is an essential technique that is often expressed as the fusion of two different small plants to make an organism with superior properties. Grafted seedlings have strategic and economic importance because they affect the yield of other agricultural products and final product quality. However, grafted seedling production consumes more resources than normal seedlings; therefore, its environmental effects carry great importance for sustainable agricultural production whilst in life-cycle assessment (LCA) literature, little research exists about this subject. This cradle-to-farm-gate LCA study focuses on grafted tomato seedling production in Antalya, Turkey and original data compiled by face-to-face surveys with seedling producers are used. It aims to analyze and discuss the environmental impacts of energy, fertilizers, pesticides, disinfectants, peat, perlite, vermiculite, inserts, trays, grafting sticks, clips, plastic sheeting, packaging used in production. Findings reveal that coal for greenhouse heating in the energy category and expanded polystyrene (EPS) trays in supporting materials category have higher impacts. Therefore, rigid plastic alternatives of EPS with higher recycling potential are discussed. After creating a scenario to compare EPS and high-density polyethylene (HDPE) as raw materials, the results indicate that HDPE has lower damage potential than EPS in the human health, ecosystems, and resources categories.

1. Introduction

In Turkey, the first greenhouse activities began in the 1940s [1], and greenhouse cultivation increased significantly after the 1980s in terms of cultivated areas. The seedling sector, which has the most important input share in greenhouse production, started its activities in Antalya province in the 1980s and increased its commercial activities with modern greenhouses in the 1990s [2].
Tomato is the most produced seedling variety both in Turkey and the Antalya province. According to the official data of 2017, total vegetable seedling production is approximately 2.9 billion plants and tomato seedling has the highest share with 36.9%. The total amount of grafted seedling produced in 2017 was 54 million plants and 92.3% of this quantity was produced in the Antalya province [3]. Seedlings, especially grafted seedlings, have strategic and economic importance because they affect the yield of other agricultural products and final product quality.
Being a diverse field, the agriculture sector supplies many vitally important products to society. The pressure on agricultural production as food, use of energy, and various high-value by-products will increase due to the competition for limited natural resources while the world population grows [4]. As a result of the ongoing increase in the human population, agricultural production, and the frequent usage of intensive technology, the impact assessment of these processes has become an important issue to be examined.
Impact assessments are divided into subgroups, which are mainly environmental impact assessments, strategic environmental assessments, social impact assessments, health impact assessments, risk impact assessments, and life-cycle assessments (LCA) [5]. According to the bibliometric study made by [5], who analyzed articles published within the journal “Environmental Impact Assessment Review” between 1980 and 2018, the keyword co-occurrences score of LCA is high when compared to other environmental assessments.
The LCA concept was first developed in Europe and the USA in the late 1960s to conduct wide-ranging environmental impact assessments in the early 1970s [6]. Today, LCA is a popular approach for identification, quantification, and environmental impact evaluation of production processes from cradle-to-grave and for finding solutions to minimize the environmental damages caused by these impacts [7]. As a production process and having a high economic role in agriculture, vegetable seedling production poses a potential risk due to the high consumption of resources that cannot be easily replenished like peat, coal, and water [8].
While normal agricultural inputs such as pesticides, fertilizers, water, peat, and coal are used in the production of grafted seedlings, support materials such as expanded polystyrene (EPS), plastics, and silicone are used extensively too. This is because the production of a grafted seedling requires a separate production technique with more input and processing than a normal seedling. The aim of the grafting technique is to briefly increase the strength and yield of a plant by grafting it on another seedling. Thus, after grafting, the grafted seedling will have superior properties to a normal seedling.
Although there are environmental studies on vegetable seedlings in the literature, those relevant to grafted tomato seedling production are rare. The number of studies having a title that contains both “LCA” and “Seedling” terms is 4 in Google Scholar [9] while it is 3 in Science Direct [10]. Furthermore, we could not find any LCA study about grafted tomato seedlings.
The main objective of this study is to make an environmental impact analysis of a single grafted tomato seedling produced in Turkey by using LCA methodology. It aims to determine the inputs related to the grafted tomato seedling production during the cycle, starting from pre-production to the post-harvest process, and to analyze the environmental impacts of the input materials, processes, and methods used. Thus, by making this analysis, the inputs having the highest environmental impact can be detected and alternate input or method suggestions can be given. Additionally, it is desired that we contribute to the literature by using the LCA approach. This study can also be considered as an agricultural reference on grafted seedling production since it also covers the contents not directly related to LCA.

2. Materials and Methods

2.1. The Importance of the Study Region Antalya for Seedling Production in Turkey

Antalya province ranks first in seedling production in Turkey [3]. Besides, the center of the “Fidebirlik” (Sub-Union of Seedling Producers), which, legally, all seedling producers have to be a member of, is located in Antalya. Table A1 shows the distribution of nurseries based on location [3]; thus, we can also see the predominance of Antalya for the relevant study and objectives.

2.2. The Differences Between Grafted Seedlings and Normal Seedlings

Grafted seedlings have many advantages when compared to normal seedlings. These are resistance to soil-borne diseases, salinity, excessive moisture, drought, low soil and air temperature tolerance or endurance, effective use of water and plant nutrients in the soil due to its strong root structure, strong plant structure, and, accordingly, a long harvest period. On the other hand, the disadvantages are extra time, place, and production material needs for grafting, being well equipped with experienced staff requirements during and after grafting, occasional dispute problems, increased production costs with hybrid rootstock use, and product quality variability depending on rootstock selection [11]. When we consider these advantages and disadvantages, it is obvious that the parameters of an LCA study on grafted seedlings will be different when compared to normal seedlings.

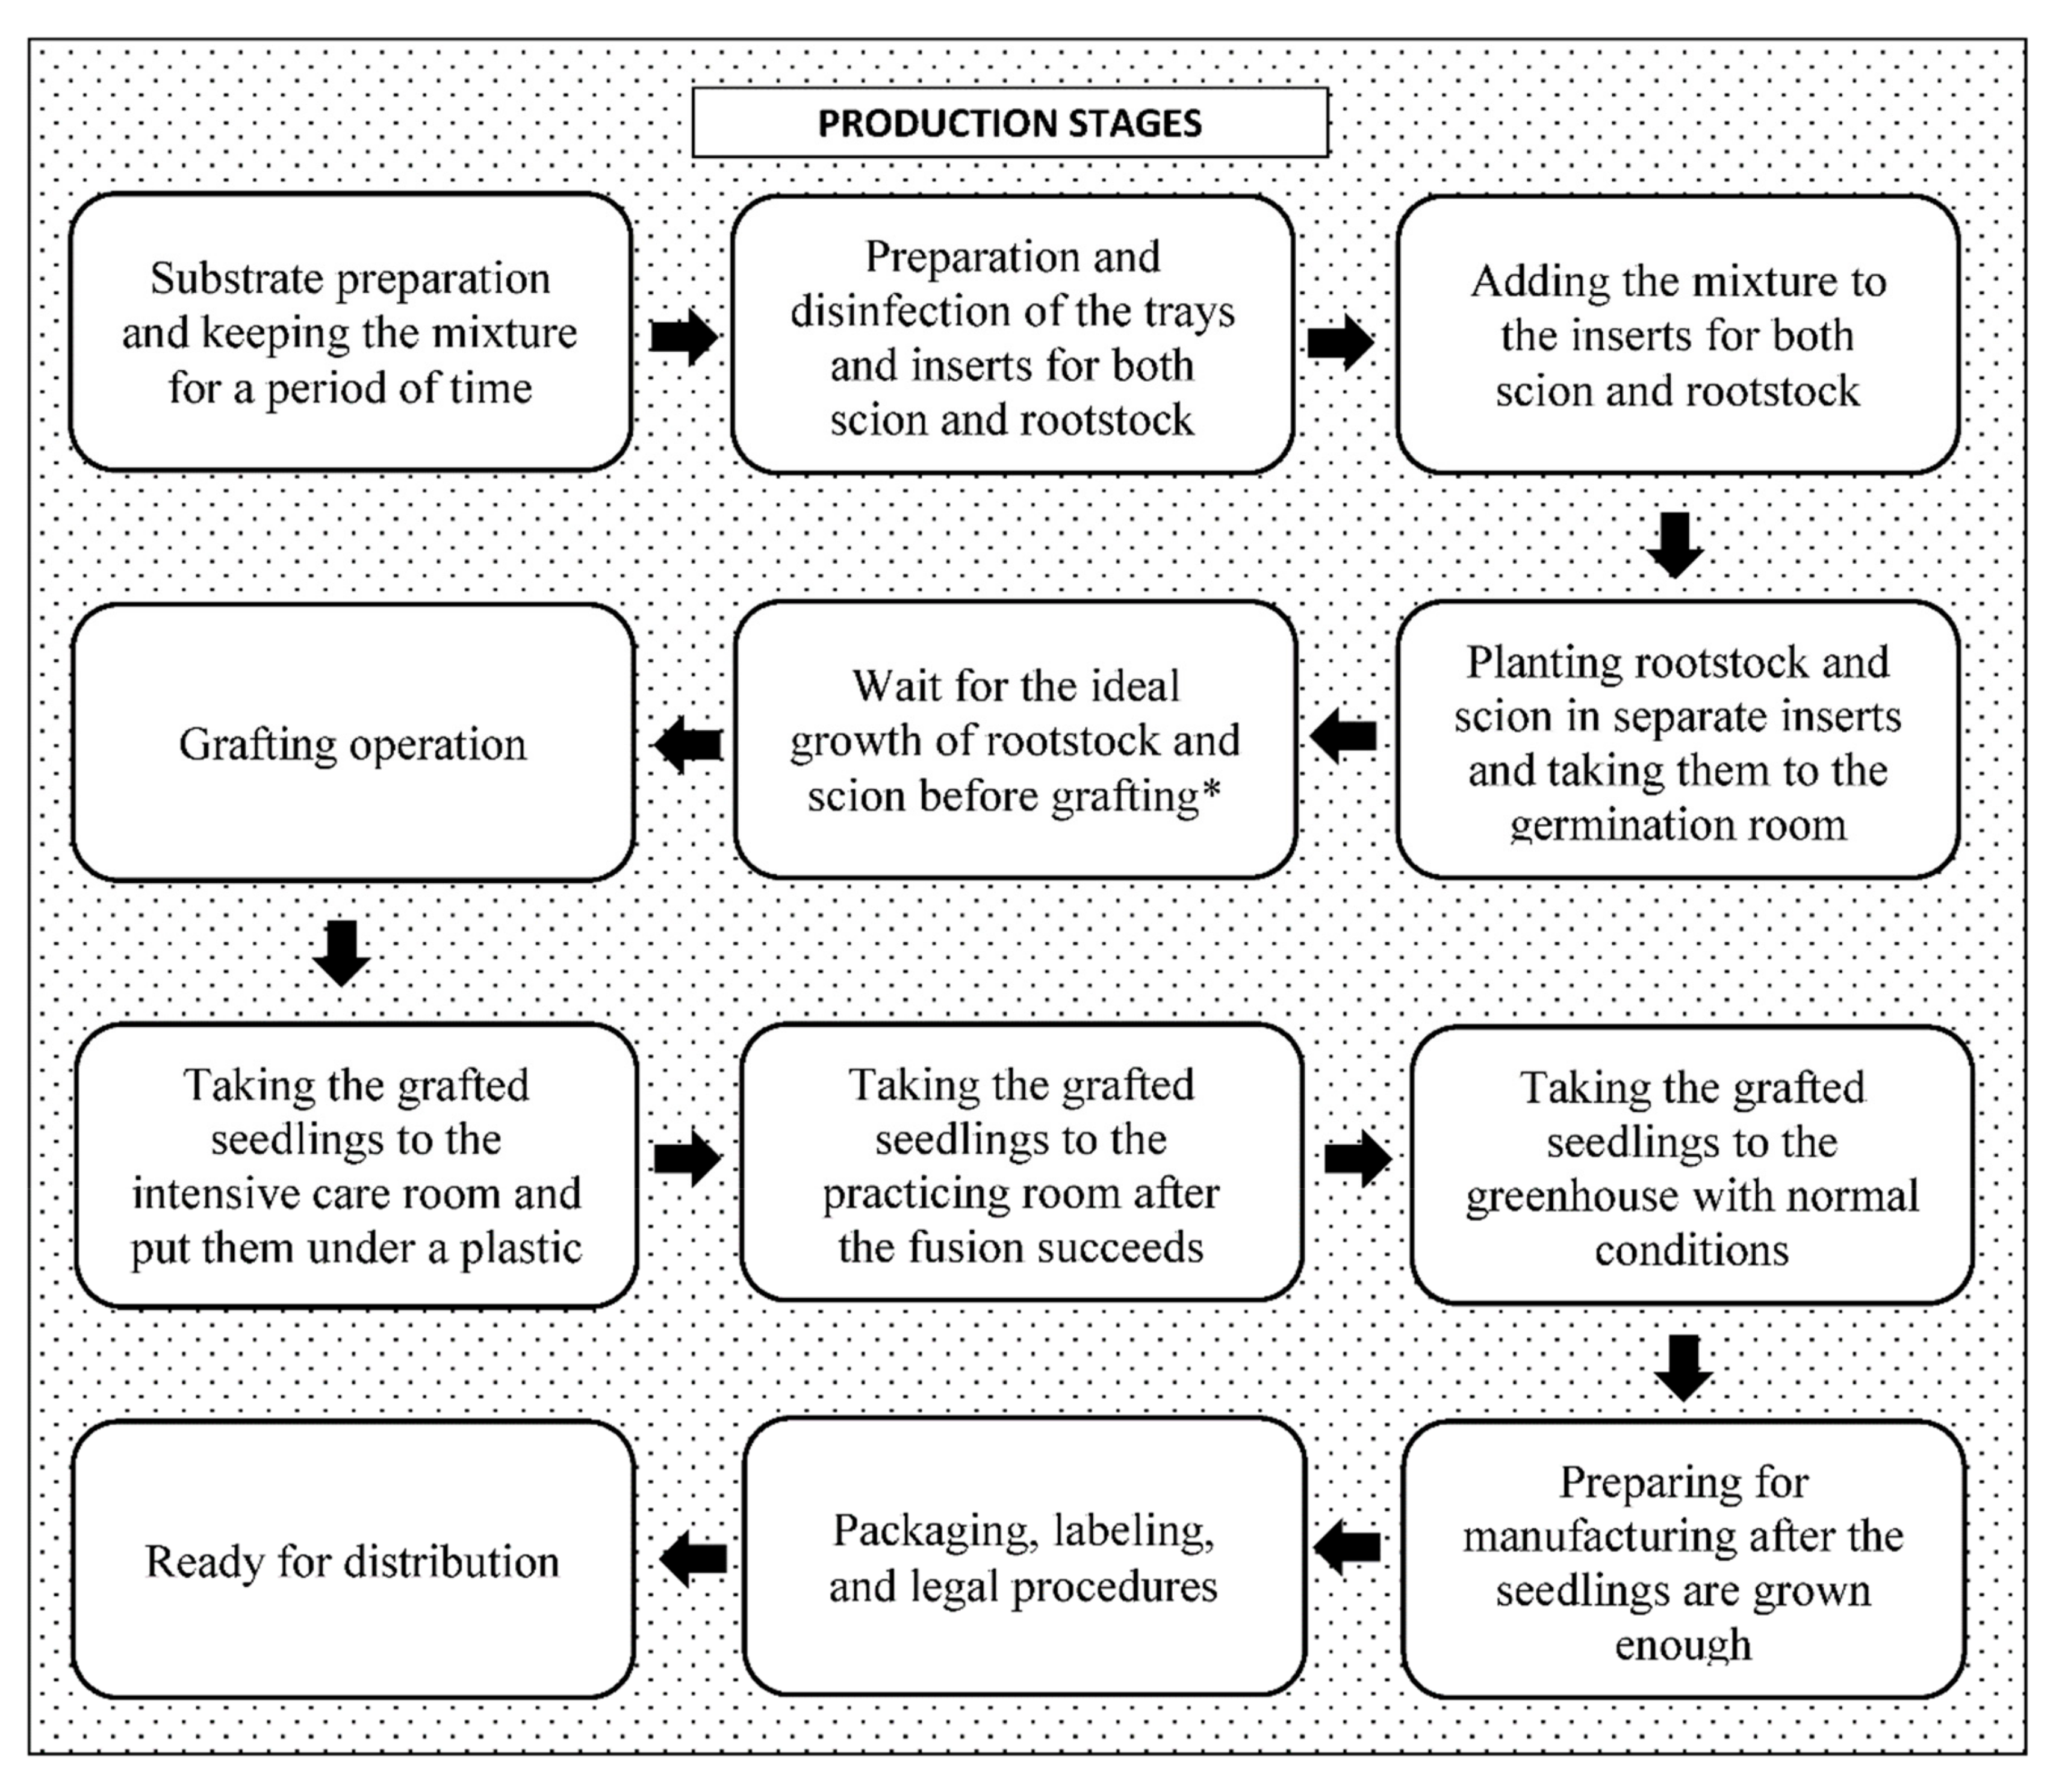
2.3. Production Stages of Grafted Seedlings

Because grafted seedling production differs from normal seedling production, the production stages also differ from normal seedlings, as seen in Figure 1. We also need to say that fertilization, irrigation, and pesticide application are involved in all stages of seedling production.

2.4. Materials of the Study

The main material of the study is composed of primary and secondary data. As a secondary data source, the indicators related to nurseries in Antalya province were obtained from Fidebirlik and relevant scientific researches. The total production area of the nurseries, which are close to Antalya city center, is 318,000 m2 [3]. The study was conducted in 49% of this area and the selected nurseries used similar production inputs and methods. The primary data source is based on the data obtained from the survey done by face-to-face interviews with the authorities in the nurseries. Within the scope of the study, accounting, administration, production, and marketing departments of the establishments were contacted separately. The first part of the survey consists of questions about the general characteristics of the nurseries; the second part consists of questions about production inputs, processes, and methods.

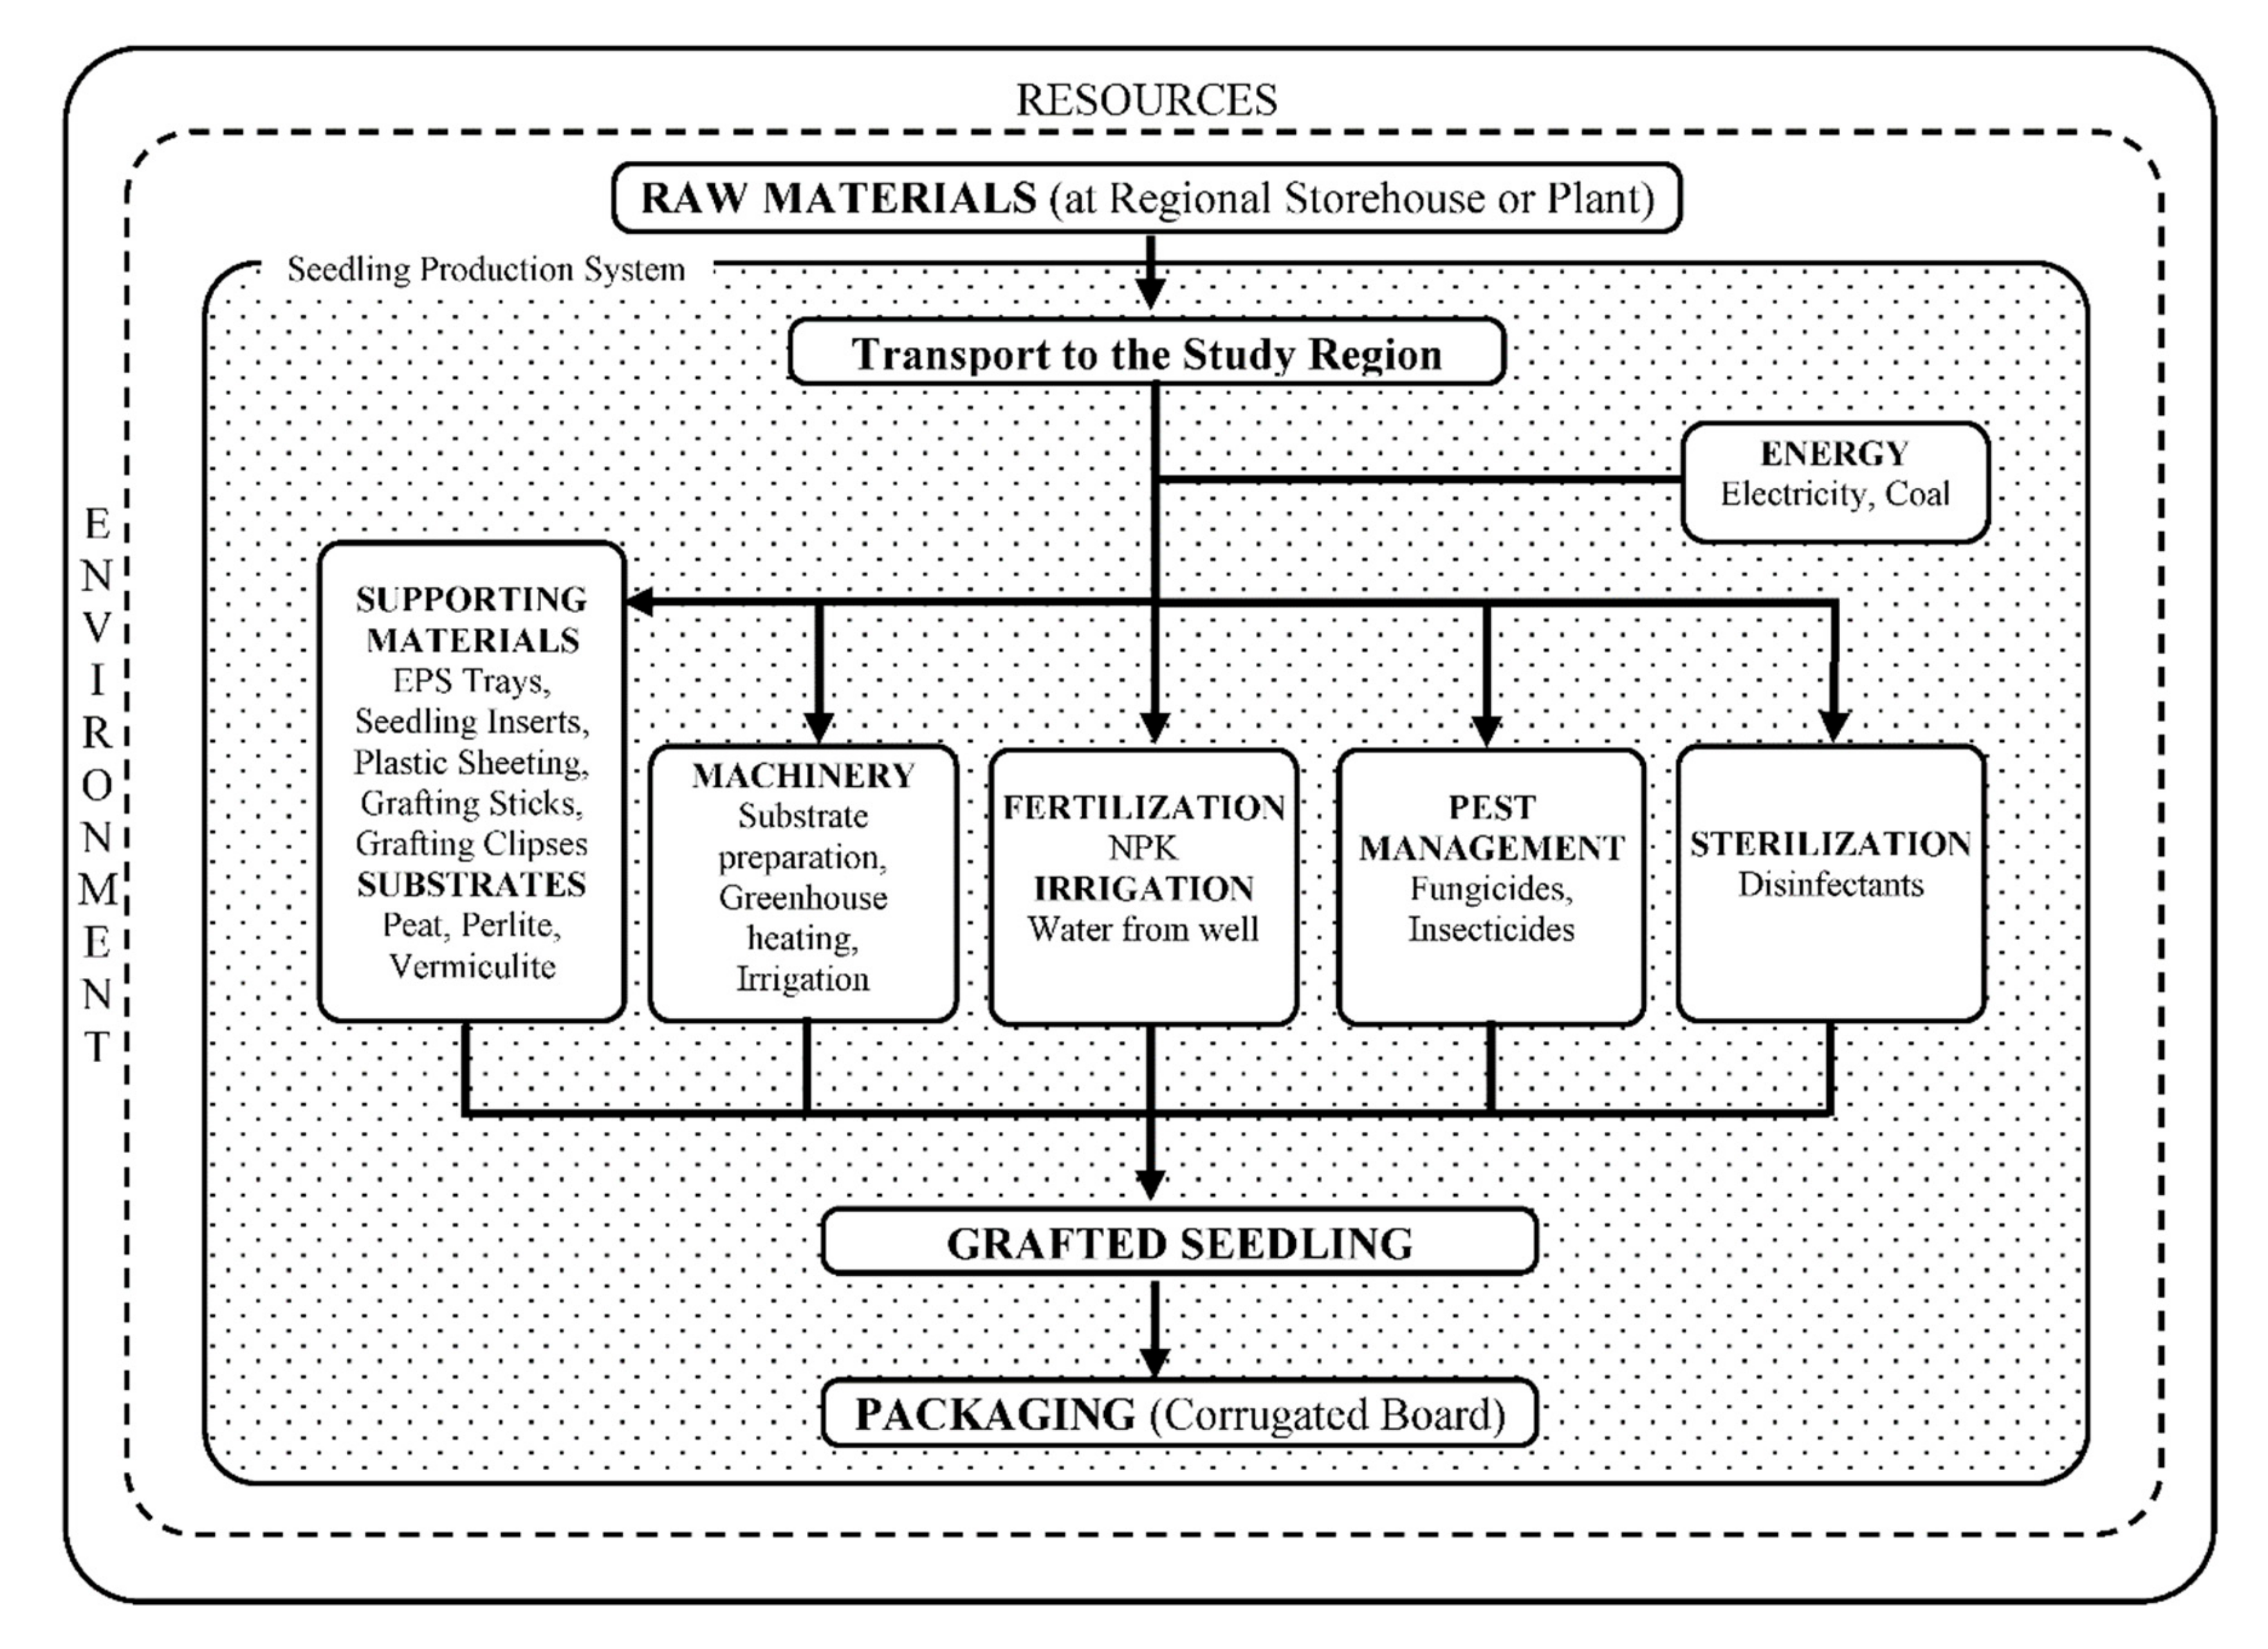
2.5. System Boundary and the Definition Criteria

The system boundary (dotted background) of the study, which is cradle-to-farm-gate according to the definition by [12], is represented in Figure 2. Thus, Table A2 shows the processes that are included and excluded in the system boundary. Excluded processes are shown with explanations of why they were not included.

2.6. The Functional Unit Chosen for the Study

The functional unit chosen in this study was determined as a single grafted tomato seedling produced during one production season in 2019. For some materials, data obtained from nurseries (e.g., energy, fertilizers, pesticides, disinfectants, plastic sheeting) were compared to the total number of seedlings, and the amount of input per unit seedling was calculated. For some materials (e.g., EPS tray, seedling insert, grafting sticks, grafting clips, peat, perlite, vermiculite, water, packaging) the amount of inputs are either calculated by measuring the weight of specific materials used per grafted tomato seedling or applying formulas according to the statements of nursery authorities.

2.7. Life Cycle Inventory Categories and Processes

In the study, input materials were divided into sub-headings such as energy, fertilizers, pesticides, disinfectants, horticultural substrates, supporting materials, irrigation and transport, and LCA analysis was performed under both general and sub-headings. However, we should also mention that horticultural substrates and supporting materials are also analyzed in the same table because of their relationship. Table 1 shows the life cycle inventory categories with input material or process names and usage amounts.

2.7.1. Transportation of Materials

The amount of materials used in nurseries and the average distance from the suppliers to the production area was entered into the LCA program and the Ecoinvent process “Transportation, Lorry > 16t, Fleet Average” was selected. Processes within the scope include the transportation of coal, fertilizers, pesticides, disinfectants, horticultural substrates, and other materials from suppliers to the production area.

2.7.2. Irrigation Method

In the nurseries, the main irrigation source is the water drawn from well. The process of water extraction and distribution to seedlings is provided by electrically operated devices. The amount of water used per seedling was determined as 0.950 liters (including both for rootstock and scion when preparing the substrate).

2.7.3. Energy

The energy sources used in the nurseries can be examined in two categories, which are electricity and coal. Unlike [13], coal is used for greenhouse heating on days with low temperatures. By combustion of the coal, water is heated and it circulates through the pipes placed in the bottom for regulating the heat in the greenhouse. Electricity received from the grid is supplied to electrically operated devices (e.g., production-related devices, computers, lighting, air conditioning). Production-related devices are electrically operated devices such as horticultural substances mixing and dispensing machines, fertilizer dosing devices, water pumps attracting well water, seed drills, and water spraying machines.

2.7.4. Fertilizers

It is thought that population growth in the world is related to the development of technologies used in agriculture. Especially with the synthesis of mineral fertilizers, an increase in fertilizer usage was observed. Considering that almost half of the world’s population is fed with food grown using artificial fertilizers [7], the environmental impacts of fertilizers used in the production of seedlings, which is the main focus of this study, is of great importance.
In the nurseries, water-soluble solid fertilizers are mixed with water with the help of a fertilizer dosing device and sprayed into the cells where seedlings grow. According to the survey, nitrogen, phosphorus, and potassium (NPK) ratios of fertilizers applied to the tomato seedlings are 20-10-20 and 13-0-46 (potassium nitrate).

2.7.5. Pesticides

At the first stage of analysis, information about the pesticides used by nurseries was retrieved. The active ingredients were calculated as weight and distributed to the categories. Some trademarks contain more than one active ingredient, and these are included in separate pesticide categories.
The compounds used in the “Unspecified Compounds" category are tetramic acid compounds, tetronic acid compounds, and macrocyclic lactone compounds, but in the Ecoinvent life cycle inventory (LCI) database, the “Pesticides Unspecified” category was selected because no specific data on these compounds were found in the inventory. Table 1 also shows the pesticide compound category names, types, and usage amounts. The compound category names of active ingredients were retrieved from [14].

2.7.6. Disinfectants

In addition to the pesticides, disinfectants are also indispensable and prevent the spread of possible pests in the cultivation environment since it may adversely affect the production. Hydrogen peroxide, alcohol-based chemicals, and peracetic acid are used as disinfectants. Continuous sterilization of the place of production and materials are made. For instance, EPS trays are disinfected and used two times on average. The workers also use disinfectants in cleaning their clothes to avoid the spreading of possible diseases that may affect seedling health.

2.8. LCA Software and Database

In the study, SimaPro 7.1.8 was used as LCA software, and Ecoinvent 2.0 was used as the LCI database. There are many databases in the literature and they can be used within the same project but using the same database ensures a more consistent analysis. Some of the missing or non-existing materials in the Ecoinvent database were redefined using the existing processes.

2.9. Impact Assessment Method

The methods used in LCA studies can be divided into two groups as midpoint or endpoint. There is no uniform approach within the current literature about which methods to use. Although endpoint methods known to have a higher uncertainty level than midpoint methods [15], they are more advantageous in terms of concatenation and interpretation of results.
In this study, the “ReCiPe 2008 v.11 Hierarchist Version / Average Weighting Set” endpoint method based on the European normalization values was used. This method expresses the effects of LCA flow on human health, ecosystem, and resource scarcity as disability-adjusted life year (DALY), loss of species during a year (hereinafter “Species.yr”) and US Dollars (USD) [16]. Table 2 shows the impact categories used in the ReCiPe 1.11 method, showing which type of environmental damage they caused and which units were used.

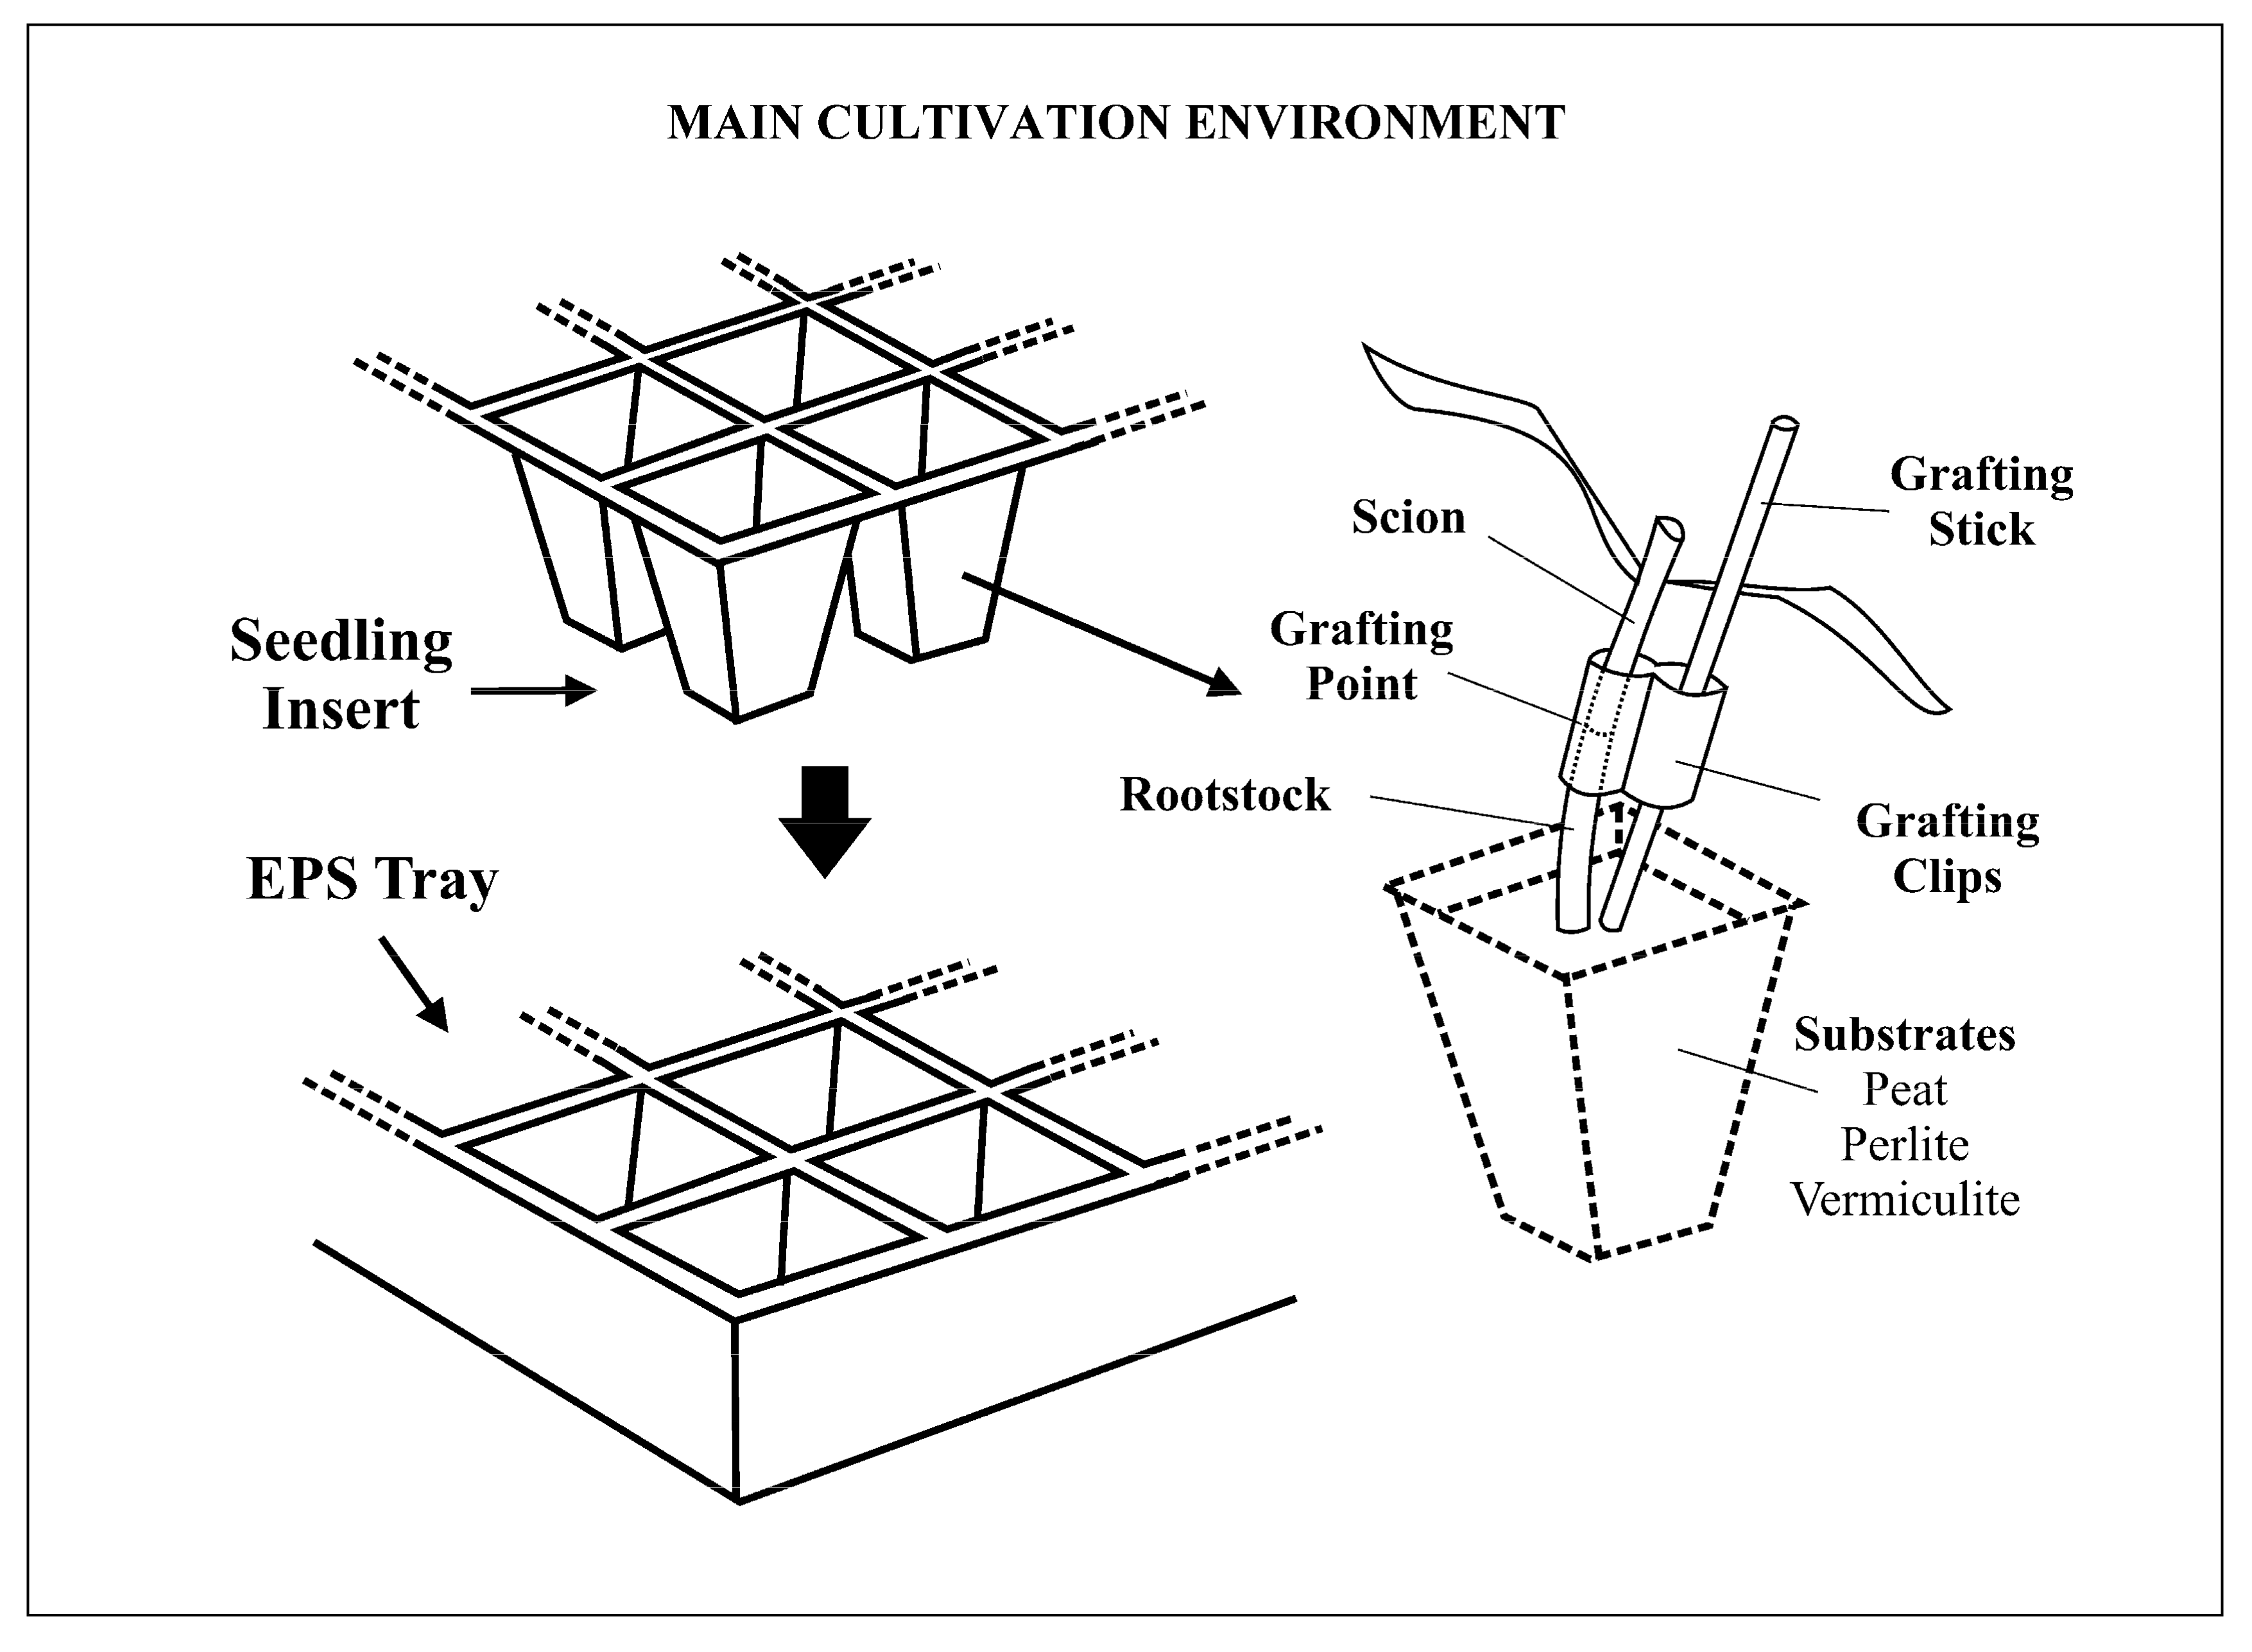
2.10. Cultivation Environment and Terminology

The main cultivation environment of seedlings changes according to certain factors (e.g., the type of vegetable, grafted or normal, grafting method). Figure 3 represents the common cultivation environment of grafted tomato seedlings in the nurseries, where the splice grafting method is used.
Grafting: Grafting is the fusion of two plant parts (rootstock and scion) to retrieve a genetically composite organism as a single plant (grafted seedling) by establishing vascular continuity between them [18,19]. As a result of the fusion, the scion gains the superior properties of the rootstock.
Splice grafting method: The most common grafting method for tomato [20] is done by joining the scion onto the rootstock’s stem [21]. It is the grafting method used in the studied nurseries and both rootstock and scion should be sliced carefully with 45 degrees before the fusion.
Seedling insert: The material produced from polyethylene (PE) and is the main part where the grafted seedlings grow in its cells.
EPS tray: The material produced from EPS foam which is placed under the seedling insert. It isolates the seedling insert and allows the insert to remain stationary.
Rootstock: The root system of the grafted plant supporting and fusing with the scion [18].
Scion: The splice cut from the donor plant, forming the upper portion of the grafted plant [18].
Grafting clips: The supporting material produced from silicone which helps to fix and hold the place where the grafting is made.
Grafting stick: The supporting material produced from PE, which fixes grafting clips vertically.

2.11. Supporting Materials and Horticultural Substrates

Seedlings are grown in inserts placed on EPS trays as a backdrop. In grafted seedling production, different EPS trays and seedling inserts are used, which have different cell volumes and cell counts. In the nurseries studied, the cells where the grafted tomato seedlings (rootstock) grow are 50 cc in volume, and the cells where the scions grow is 32 cc, according to authorities interviewed. Also, the scion should not be thicker than the rootstock.
In the horticultural substrates category, peat is used in modern establishments as the main growth medium for seedlings. The variety of peat in seedling production, which is called sphagnum moss peat, is widely used in nurseries across Turkey. However, as a non-renewable resource, sphagnum moss peat is imported from Northern European countries and has no alternatives due to its structural features.
The main horticultural substrate for seedlings consists of peat, perlite, and vermiculite with certain proportions. Peat and perlite are first mixed with water and kept for a while. Peat mixed with water absorbs up to 10 times the weight of peat [22]. The ratios of the mixture used by the nurseries and the amount of substrate usage per seedling were obtained according to the following equations.
V S u b s t r a t e = V p t + V p r + V v t ,   V p t 10 = V p r 1.5 = V v t 2.5 d p t = 0.09 g / c c ,   d p r = 0.13 g / c c ,   M w = M p t × 10 d v t = 0.31 g / c c ,   d w = 1 g / c c
where pt: peat, vt: vermiculite, pr: perlite, w: water, V: volume, d: density, M: mass.
Perlite and peat mixture is placed in the cells through machines and covered with a vermiculite layer to keep moisture. Besides, the top of the seedlings after the grafting operation is partially covered with plastic sheeting for the success of the operation. Grafting sticks and clips are used additionally in grafted seedlings when compared to normal seedlings. Scions are grown in a different environment, apart from rootstocks, and use separate sizes of trays and inserts. In the nurseries studied, tomato rootstocks grow in inserts with 150 cells having 50 cc cell volume each. EPS trays suitable for the insert size are placed to the bottom of the inserts. Scions are grown in inserts having 32 cc cell volume and containing 216 cells. When rootstocks and scions reach the expected maturity stage, the grafting process is performed in cells where rootstocks are grown. In this case, the inserts are not used again, but the trays are disinfected and used once more on average. After a certain time following grafting operation, grafted seedlings are separated by a special separation method to be put on different inserts (number of cells used per unit seedling doubles). However, before packaging, the empty cells are filled with separated seedlings. When all the separation methods and disinfections were considered, it was calculated that only the scion consumes a half-tray cell as weight while the others (rootstock tray, rootstock insert, scion insert) consume one.

3. Results and Discussion
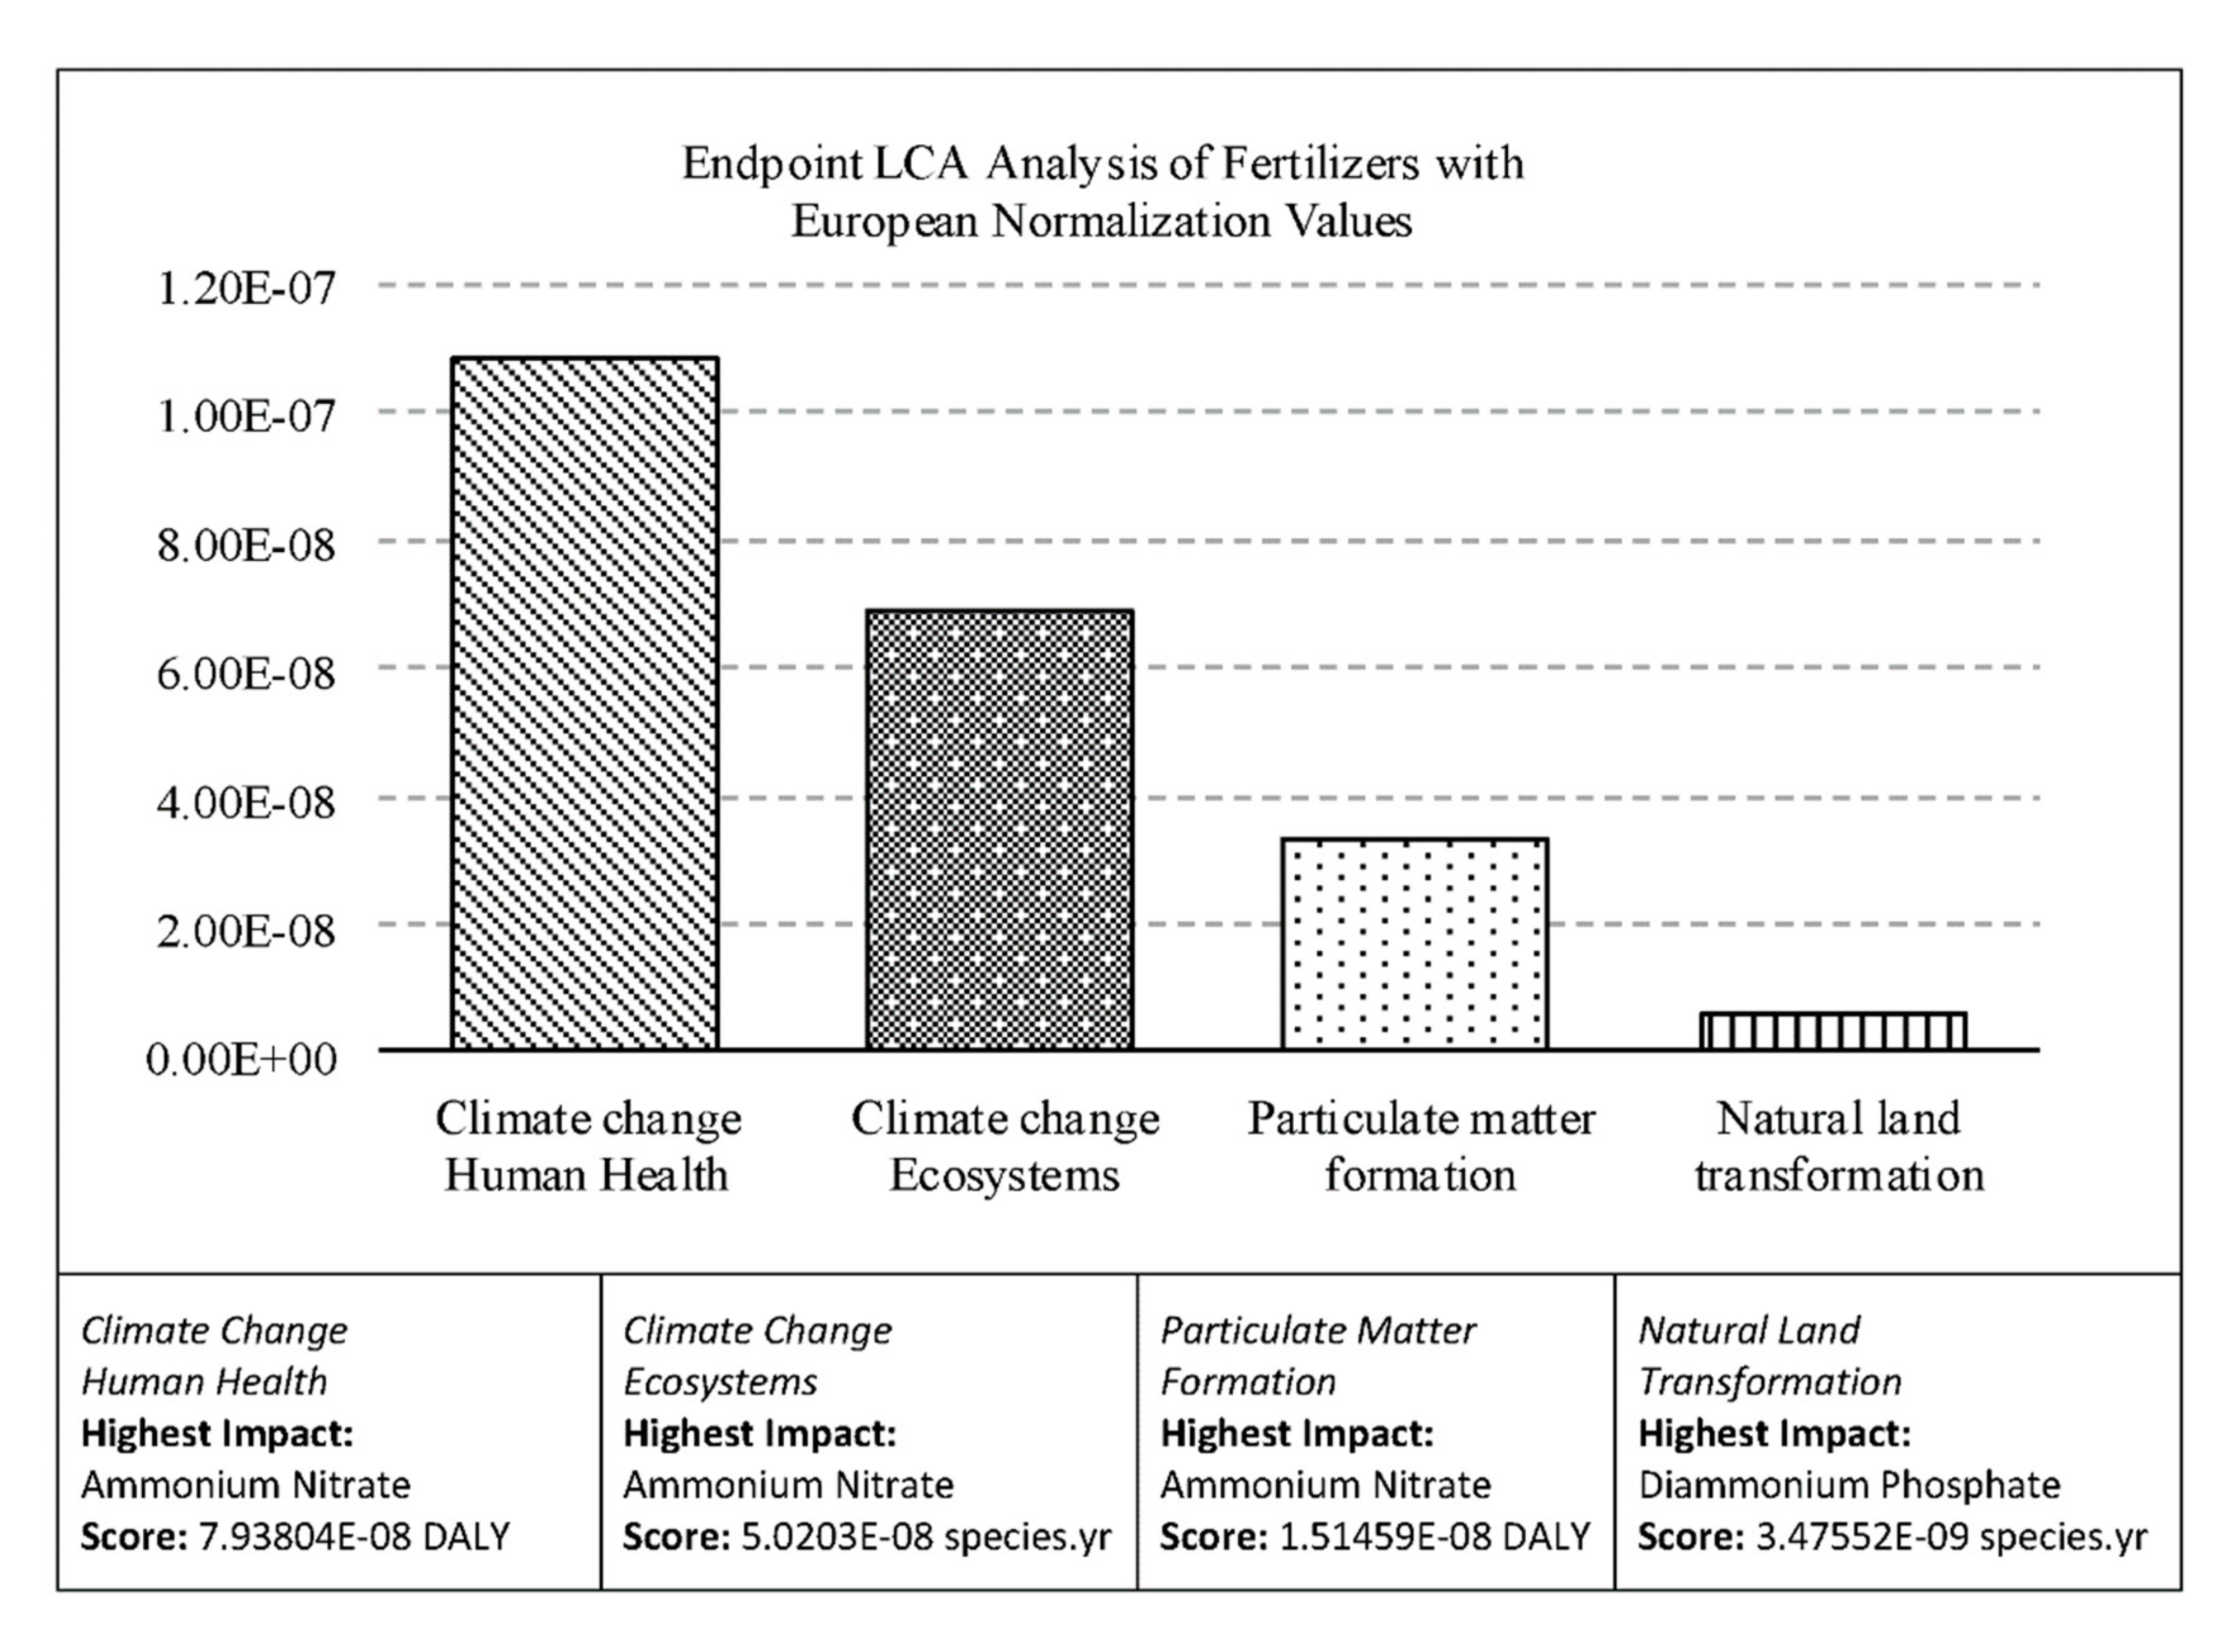
3.1. LCA Analysis

3.1.1. An Overview of the Production Processes

In Table 3, a damage assessment analysis was performed by using the ReCiPe Endpoint v1.11 method. As seen in the table, the energy category has the highest impact while the pesticide category has the lowest. Other categories were examined separately in the study. First of all, presenting such a table from a general point of view is the result of the conclusion that the energy category has the highest damage ratio.

3.1.2. Energy Analysis

In Table 4, the percentage of coal (greenhouse heating), including toxicological effects, was found to be highest, similar to [23]. According to [13] conducted in OntarioCanada, greenhouse heating has the highest impact although central heating is used instead of coal. Electricity, which has a lower damage assessment ratio than coal, comes second. Additionally, photovoltaic (PV) technologies are not used as an energy source in the studied area, whereas as an alternative to coal, energy from PV has a lower impact in terms of power plant technologies and greenhouse gas emissions during combustion. However, these emissions are dominant in materials and module manufacturing in PV plants [24].
Government programs supporting renewable energy resources such as solar energy are also available in Turkey. A program proposed by the Western Mediterranean Development Agency in 2018 can be given as an example [25]. Through this project, financial support is given to public institutions to carry out studies in agricultural establishments to increase the use of renewable energy resources [25]. However, no financial support is given directly to enterprises.

3.1.3. Fertilizer Analysis

After the amount of raw materials making up the fertilizers were calculated and entered into the LCA program, an endpoint analysis was conducted by using European normalization values, and the results of the top 4 categories which have the highest impact are presented in the following chart with the raw material names and scores.
Figure 4 shows the environmental impact of raw materials used in fertilizer production. The score of ammonium nitrate is the highest in climate change human health, climate change ecosystems, particulate matter formation while diammonium phosphate has the highest in the natural land transformation category.
During the interviews with the fertilizer manufacturers near the study area, it was stated that they use raw materials that guarantee the desired NPK ratio without considering the environmental impacts. In other words, the same ratio can be obtained by different fertilizer manufacturers by using different raw materials. The amount of materials as source data for Figure 4 was obtained without considering any production cost criteria. Therefore, if a fertilizer manufacturer obtains the same ratio considering production costs, raw material prices, and other criteria, LCA analysis results of the fertilizers may differ when compared with other fertilizers giving the same ratio.
In the nurseries, a fertilizer dosing device is used, which arranges the NPK ratio correctly during the fertilization process of seedlings. The importance of NPK dosing was also mentioned in [26] and it comes from the prevention of nutrient losses. Authorized staff in the establishments also indicated that the use of excess or less fertilizer due to the dosing device directly affects the healthy development of the plant. Therefore, it may cause seedling loss and will naturally increase the amount of fertilizer used per plant. The effects of nitrogen fertilization (changing biomass chemical composition) was also studied in [27].

3.1.4. Pesticide Analysis

As shown in Table 5, it was found that the pyrethroid compounds had the highest effect and the triazine compounds had the least effect in the damage assessment analysis.
Pyrethroid compounds are not only used in agriculture but also other sectors. Over the years, pyrethroid usage has increased due to the decrease in organophosphorus usage, which has more toxic effects on birds and mammals; however, this increase in pyrethroid usage has brought other problems (such as endangering water life) [28].
Although the use of dithiocarbamate (DTC) fungicides in the world is widespread, certain active substances in this category are prohibited in the European Union. Despite these compounds have little toxicity, their negative effects on human health have been reported [29].
About the direct exposure of the personnel working in the greenhouse to the pesticides in the nurseries, it has been observed that sufficient workers’ safety was ensured. Compulsory occupational safety procedures are also applied in the establishments under registration and are audited by the relevant authorities. However, the same inspection is not carried out in informal nurseries.
The use of pesticides in seedling production is of vital importance, but some diseases may also be detected during vegetable production from the seedlings. Therefore, according to Fidebirlik, establishing a good analysis laboratory demanded by the nurseries would enable early detection and isolation of the diseases and minimize the plant loss. Undoubtedly, it will affect the environmental impact of seedling production.

3.1.5. Analysis of the Supporting Materials and the Horticultural Substrates

In the LCA analysis results demonstrated in Table 6, the EPS tray has the highest impact ratio in all impact categories except for ozone depletion, agricultural land occupation, urban land occupation, and natural land transformation. Additionally, the ratio of packaging is the lowest except for agricultural land occupation.
As mentioned in the ReCiPe methodology we used with the Ecoinvent database [17], the endpoint characterization factors for land use are determined by the differences in the time required to restore the land before and after the transformation. In light of this information, it is expected that peat used in nurseries will get the highest value in the natural land transformation category in the endpoint damage assessment analysis because it can take thousands of years to regenerate the peat resources consumed.
Having the highest environmental impact in the majority of supporting materials and horticultural substrates category, EPS foam, which is also the raw material of the seedling trays, is a white hard foam produced from styrene (a hydrocarbon monomer) used in many industries mostly as a packaging or shock absorber material [30]. EPS foam and then rigid plastics are widely used in seedling production in the world; however, EPS material is cheaper and carries strong isolation properties although it has many disadvantages in terms of hygiene and environment [31]. The air vents inside the EPS tray are very clear to moisture and thus to bacterial growth, the internal air spaces cannot be cleaned even if sterilized, and, furthermore, it is breakable. So its re-use count is lower than the rigid plastic. In spite of this, the EPS trays can be sterilized and used two times. On the other hand, in the rigid plastics category, high-density polyethylene (HDPE) and polyethylene terephthalate (PET) are the most widely used materials [32]. Table 7 shows the environmental impact of three different polymers and their effectiveness in recycling processes [33].

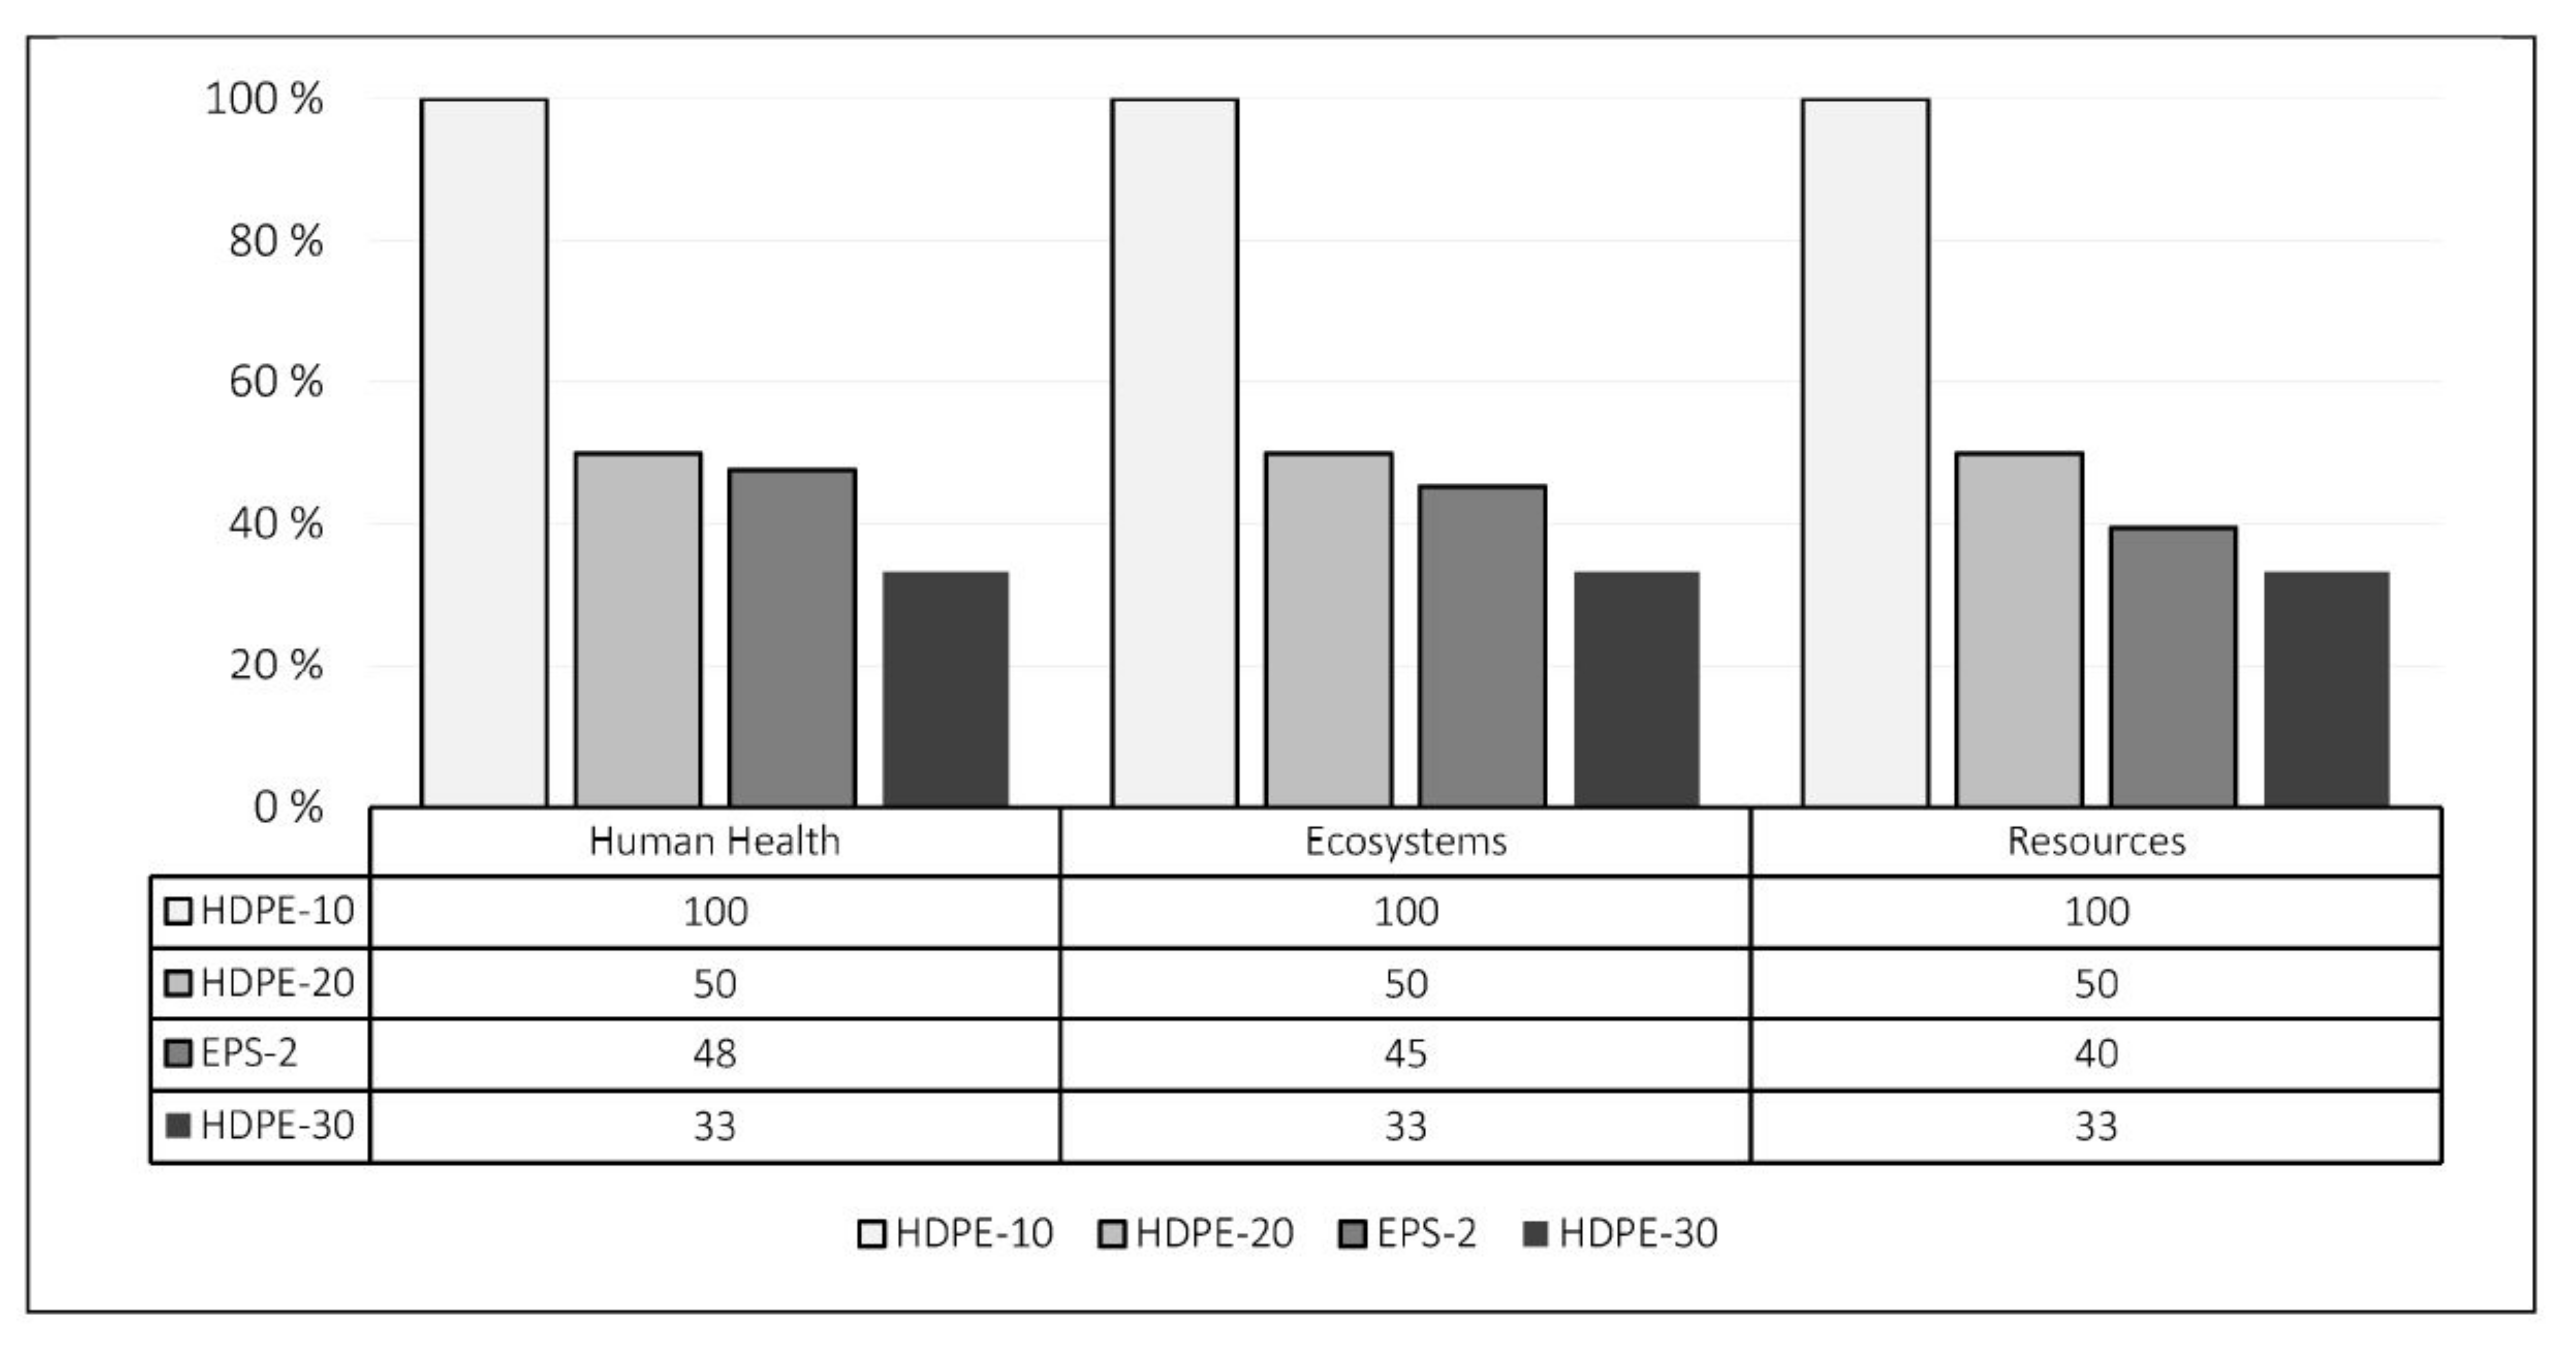
3.1.6. EPS and HDPE Comparison Scenarios

As an alternative to EPS Foam, which can be re-used no more than 2–3 times, HDPE trays have an advantage in terms of re-usable capacity by sterilizing. A scenario is created that includes four possibilities: EPS-2 (disposed of after two usages), HDPE-10 (disposed of after ten usages), HDPE-20 (disposed of after 20 usages), and HDPE-30 (disposed of after 30 usages). Figure 5 demonstrates the damage assessment results of this scenario in the human health, ecosystems, and resources categories.
As seen in Figure 5, scenario results show the HDPE-30 has less environmental impact ratio in human health, ecosystems, and resources categories when compared to other alternatives.

3.2. The Use of Seedlings by the Vegetable Producers

Although the use of the seedlings by vegetable producers was not included within the scope of this study, certain problems related to this usage process are important for the yield of the seedlings. According to Fidebirlik, the biggest dilemma between the seedling producers and vegetable producers is the occurrence of diseases during the usage of the grafted seedlings. It is one of the issues discussed—whether these diseases occur during production or usage.
Generally, in greenhouse cultivation, it is accepted that many diseases can occur from seeds to the final products. In the study area, it was determined that the need for a reliable laboratory with advanced devices for the origin and diagnosis of these diseases is indisputable. It was observed that the current laboratories in Antalya, where 75% of Turkey’s seedling production and 55% of greenhouse farming occurs, are far from meeting the current need [34]. The establishment of a more advanced laboratory may eliminate dilemmas and debates, increasing the yield of the seedlings by the necessary measures taken on time, and making a positive contribution to the environmental impact of seedling production.
Another important point that is not within the system boundaries but included in the scope of LCA is the usage of empty polypropylene inserts by greenhouse farmers to ensure easy ignition of coal and wood used in greenhouse heating, which will result in CO2 release during the combustion process.

4. Conclusions

Covering the cradle-to-farm-gate period, this study was conducted in nurseries near Antalya province city center, and an LCA analysis of one grafted tomato seedling from the production stage to the packaging phase was made. In this context, according to the results of the analysis, it was found that the highest environmental impact belongs to coal used for greenhouse heating. Secondly, our findings showed that the EPS trays used for cultivation have significant environmental effects.
In the study area, no PV usage as an energy source was found. It was considered that this is due to the fact that the government incentives are not directly given to the producers who adopt PV technologies or other renewable energy sources; instead, incentives are given to public institutions to make nurseries feasible. However, direct incentives (decreasing the installation costs) may result in the adoption of solar energy as a sustainable energy source by the producers.
According to fertilizer analysis results, it was found that ammonium nitrate has the highest effect in three impact categories (CCHH, CCE, PMF) when compared to other fertilizer raw materials used to make an NPK fertilizer. In the fertilizer application phase, it has been found that the presence and proper use of a good fertilizer dosing device contribute to the healthy development of the seedlings by preventing the excess or deficit use of fertilizer so that it prevents nutrient loss which lead to plant loss, and increases the average fertilizer used per plant.
According to pesticide analysis results, it was found that the pesticides in the pyrethroid compounds category have the highest impact on the environment in all categories except freshwater eutrophication. However, direct exposure of personnel to pesticides is also important in terms of human toxicity although sufficient workers’ safety had been ensured in the nurseries where the study was carried out. However, it would not be right to say that the same safety measures are taken in informal nurseries. This informal nursery problem is also underlined by Fidebirlik about the seedling production sector in Turkey.
Regarding the materials used in production, EPS trays have the highest environmental impact in 12 out of 16 categories, and after comparison with other rigid plastic alternatives in terms of production and recycling efficiency, it was determined that HDPE usage is relatively advantageous in several categories including CO2 emissions and recycling. Furthermore, a scenario was created to compare EPS usage with HDPE usage as a tray material. It was found that HDPE tray usage by sterilization (minimum 30 times) has a smaller environmental impact ratio than EPS tray usage (2 times) in terms of human health, ecosystems, and resources impact categories.

Conflicts of Interest

The authors declare no conflict of interest.

Appendix A

Table A1. The distribution of nurseries according to their location in Turkey [35].
Provinces in TurkeyNum. of NurseriesAntalya TownsNum. of Nurseries
Antalya64Serik14
İzmir16Kumluca13
Mersin12Demre2
Ankara9Kaş1
Adana7Close to Antalya City Centre34
Bursa5
Other39
Total152Total64
Table A2. System boundary definition criteria of the study. Table layout: [36].
Processing CategoryIncluded?Why Excluded?
Insignificant Environmental ImpactDifficult to Obtain Representative DataNot Directly Relevant to the Scope and Goal of the Study
Production, maintenance, and replacement of capital equipmentno--
Electricity for equipment utilized
(water pump, machinery, etc.)
yes---
Coal for greenhouse heatingyes---
Transportation and production of germinated seedsno--
Transportation of raw materials
(fertilizers, pesticides, disinfectants,
supporting materials, substrates)
yes---
Production and appliance of fertilizersyes---
Production and appliance of pesticidesyes---
Production and appliance of disinfectantsyes---
Production and appliance of horticultural substratesyes---
Production of support materialsyes---
Water supplyyes---
Establishment’s land occupationno-

References

  1. Yilmaz, I.; Sayin, C.; Ozkan, B. Turkish greenhouse industry: Past, present, and future. N. Z. J. Crop Hortic. Sci. 2005, 33, 233–240. [Google Scholar] [CrossRef] [Green Version]
  2. TÜRKTOB. Tohumculuk Sektörü Ulusal Strateji Raporu; TÜRKTOB: Ankara, Turkey, 2017. [Google Scholar]
  3. Fidebirlik. Fidebirlik Annual Statistics; Fidebirlik: Antalya, Turkey, 2018. [Google Scholar]
  4. Caffrey, K.R.; Veal, M.W. Conducting an agricultural life cycle assessment: Challenges and perspectives. Sci. World J. 2013, 2013, 13. [Google Scholar] [CrossRef] [PubMed] [Green Version]
  5. Nita, A. Empowering impact assessments knowledge and international research collaboration—A bibliometric analysis of environmental impact assessment review journal. Environ. Impact Assess. Rev. 2019, 78, 106283. [Google Scholar] [CrossRef]
  6. Russell, A.; Ekvall, T.; Baumann, H. Life cycle assessment introduction and overview. J. Clean. Prod. 2005, 13, 1207–1210. [Google Scholar] [CrossRef] [Green Version]
  7. Skowrońska, M.; Filipek, T. Life cycle assessment of fertilizers: A review. Int. Agrophys. 2014, 28, 101–110. [Google Scholar] [CrossRef]
  8. Beccaro, G.L.; Cerutti, A.K.; Vandecasteele, I.; Bonvegna, L.; Donno, D.; Bounous, G. Assessing environmental impacts of nursery production: Methodological issues and results from a case study in Italy. J. Clean. Prod. 2014, 80, 159–169. [Google Scholar] [CrossRef]
  9. Google Scholar. Seedling lca Article Search. Available online: https://scholar.google.com/scholar?q=life+cycle+seedling (accessed on 12 December 2019).
  10. Science Direct. Seedling lca Paper Search. Available online: https://www.sciencedirect.com/search/advanced?qs=Life%20cycle%20seedling (accessed on 12 December 2019).
  11. Fert, C. Antalya Ili Merkez İlçede Aşılı ve Aşısız Fide Ile Cam Serada Tek Ürün Domates Üretiminin Ekonometrik Analizi; Akdeniz University: Antalya, Turkey, 2012. [Google Scholar]
  12. Page, G.; Ridoutt, B.; Bellotti, B. Carbon and water footprint tradeoffs in fresh tomato production. J. Clean. Prod. 2012, 32, 219–226. [Google Scholar] [CrossRef]
  13. Hendricks, P. Life Cycle Assessment of Greenhouse Tomato (Solanum lycopersicum L.) Production in Southwestern Ontario; McLaughlin Library University of Guelph: Guelph, ON, Canada, 2012. [Google Scholar]
  14. Wood, A. Compendium of Pesticide Common Names. Available online: http://www.alanwood.net/pesticides/class_insecticides.html (accessed on 11 May 2019).
  15. Bare, J.; Hofstetter, P.; Pennington, D.W.; de Haes, H.A.U. Midpoints versus endpoints: The sacrifices and benefits. Int. J. Life Cycle Assess. 2000, 5, 319–326. [Google Scholar] [CrossRef] [Green Version]
  16. Manzo, S.; Dong, Y.; Miraglia, S.; Salling, K.B. How the inclusion of life cycle impacts affects transport cost-benefit analysis. Eur. J. Transp. Infrastruct. Res. 2018, 18, 372–388. [Google Scholar]
  17. Goedkoop, M.; Heijungs, R.; Huijbregts, M.; De Schryver, A.; Struijs, J.; Van Zelm, R. Recipe 2008: A life cycle impact assessment method which comprises harmonised category indicators at the midpoint and the endpoint level. Int. J. Life Cycle Assess. 2013, 18, 683–697. [Google Scholar]
  18. Mudge, K.; Janick, J.; Scofield, S.; Goldschmidt, E.E. A History of Grafting. In Horticultural Reviews; Janick, J., Ed.; John Wiley and Sons, Inc: New York, NY, USA, 2009. [Google Scholar]
  19. Pina, A.; Errea, P. A review of new advances in mechanism of graft compatibility–incompatibility. Sci. Hortic. 2005, 106, 1–11. [Google Scholar] [CrossRef]
  20. Guan, W.; Hallett, S. Vegetable Grafting: Techniques for Tomato Grafting; Purdue University: West Lafayette, IN, USA, 2016. [Google Scholar]
  21. Bilderback, T.; Bir, R.E.; Ranney, T.G. Grafting and Budding Nursery Crop Plants. Available online: https://content.ces.ncsu.edu/grafting-and-budding-nursery-crop-plants (accessed on 2 April 2019).
  22. Cinar, A.H. Serada ve Açık Alanlarda Domates Yetiştiriciliği; Hasad Publishing: Istanbul, Turkey, 2015; p. 254. [Google Scholar]
  23. Boulard, T.; Raeppel, C.; Brun, R.; Lecompte, F.; Hayer, F.; Carmassi, G.; Gaillard, G. Environmental impact of greenhouse tomato production in France. Agron. Sustain. Dev. 2011, 31, 757. [Google Scholar] [CrossRef] [Green Version]
  24. NREL. Life Cycle Greenhouse Gas Emissions from Solar Photovoltaics (Fact Sheet); NREL (National Renewable Energy Laboratory): Golden, CO, USA, 2012. [Google Scholar]
  25. BAKA. Yenilenebilir Enerji Mali Destek Programı—2018 Yılı Teklif Çağrısı - Başvuru Rehberi; BAKA: Isparta, Turkey, 2018. [Google Scholar]
  26. Da Silva, M.J.; Magalhães, P.S.G. A liquid injection dosing system for site-specific fertiliser management. Biosyst. Eng. 2017, 163, 150–158. [Google Scholar] [CrossRef]
  27. Ercolano, M.R.; Gomez, L.D.; Andolfi, A.; Simister, R.; Troise, C.; Angelino, G.; Borrelli, C.; McQueen-Mason, S.J.; Evidente, A.; Frusciante, L.; et al. Residual biomass saccharification in processing tomato is affected by cultivar and nitrogen fertilization. Biomass Bioenergy 2015, 72, 242–250. [Google Scholar] [CrossRef]
  28. US EPA. Pyrethrins and Pyrethroids; US EPA: Washington, DC, USA, 2015. [Google Scholar]
  29. Al-Alam, J.; Bom, L.; Chbani, A.; Fajloun, Z.; Millet, M. Analysis of dithiocarbamate fungicides in vegetable matrices using hplc-uv followed by atomic absorption spectrometry. J. Chromatogr. Sci. 2017, 55, 429–435. [Google Scholar] [CrossRef] [PubMed] [Green Version]
  30. Tan, R.B.H.; Khoo, H.H. Life cycle assessment of eps and cpb inserts: Design considerations and end of life scenarios. J. Environ. Manag. 2005, 74, 195–205. [Google Scholar] [CrossRef] [PubMed]
  31. Food and Agriculture Organization of the United Nations. Good Agricultural Practices for Greenhouse Vegetable Production in the South East European Countries: Principles for Sustainable Intensification of Smallholder Farms; FAO: Rome, Italy, 2017; p. 192. [Google Scholar]
  32. Hannay, F. Rigid Plastics Packaging: Materials, Processes and Applications; iSmithers Rapra Publishing: Shrewsbury, UK, 2002; p. 12. [Google Scholar]
  33. Hopewell, J.; Dvorak, R.; Kosior, E. Plastics recycling: Challenges and opportunities. Philos. Trans. R. Soc. B Biol. Sci. 2009, 364, 2115–2126. [Google Scholar] [CrossRef] [PubMed] [Green Version]
  34. Fidebirlik. Fidebirlik Faq. Available online: http://www.fidebirlik.org.tr/sss-liste/ (accessed on 5 April 2019).
  35. Fidebirlik. Fidebirlik Member Count. Available online: http://www.fidebirlik.org.tr/uyelik/fidebirlikin-yillara-ve-illere-gore-uye-sayisi/ (accessed on 15 April 2019).
  36. Muhamad, H.; Hashim, Z.; Subramaniam, V.; Tan, Y.; Wei, P.; Chong, C.L.; May, C. Life cycle assessment of oil palm seedling production (part 1). J. Oil Palm Res. 2010, 22, 878–886. [Google Scholar]
Figure 1. Stages of grafted tomato seedling production. (*) To reach the ideal growth of the scion and rootstock, the start time of planting differs for both.
Sustainability 12 00025 g001
Figure 2. System boundary schema of the study.
Sustainability 12 00025 g002
Figure 3. Main cultivation environment of grafted tomato seedlings.
Sustainability 12 00025 g003
Figure 4. Normalization results graph of fertilizers used for the production of a single grafted tomato seedling (Top 4 impact categories are shown).
Sustainability 12 00025 g004
Figure 5. Damage assessment comparison of EPS and HDPE as seedling tray material.
Sustainability 12 00025 g005
Table 1. Life cycle inventory for a single grafted tomato seedling.
InputAmountInputAmount
EnergyPesticides
Electricity0.026368171 kWhOrganophosphorus Compounds (F)0.00014156 g
Coal for Greenhouse Heating0.259842137 kWhCyclic N Compounds (F)0.00002389 g
FERTILIZERS[thio] Carbamate Compounds (F)0.00000741 g
Ammonium Nitrate0.131839585 gAcetamide Anillide Compounds (F)0.00002953 g
Diammonium Phosphate0.059936818 gTriazine Compounds (F)0.00000265 g
Monoamonnium Phosphate0.018759378 gDithiocarbamate Compounds (F)0.00015926 g
Potassium Nitrate0.236245177 gPhthalimide Compounds (F)0.00012387 g
Potassium Sulphate0.050896546 gPyrethroid Compounds (I)0.00010009 g
TransportTetramic Acid Compounds (I)0.00008848 g
Transport of Raw Materials0.501835584 kg.kmTetronic Acid Compounds (I)0.00004645 g
DisinfectantsMacrocyclic Lactone Compounds (I)0.00000657 g
Hydrogen Peroxide0.05529750 gSupporting Materials
Peracetic Acid0.03317850 gSeedling Insert (Polypropylene)1.5115741 g
Alcohol (Isopropanol)0.02211900 gEPS Tray (EPS Foam)3.662499 g
Horticultural SubstratesGrafting Sticks (Polypropylene)0.25 g
Peat5.271428571 gGrafting Clips (Silicone)0.6 g
Expanded Perlite1.142142857 gPlastic Sheeting (Polyethylene)0.666111574 g
Expanded Vermiculite4.539285714 gPackaging (Corrugated Board)0.00835 g
Irrigation (Water from Well)0.950 liters
F: fungicide, I: insecticide.
Table 2. Relations between impact categories, midpoint and endpoint indicators for ReCiPe 1.11. Source: ReCiPe 2008, a life cycle impact assessment method that comprises harmonized category indicators at the midpoint and endpoint levels [17].
Impact Category NameAbbrev.Midpoint IndicatorDamageEndpoint
Climate Change Human HealthCCHHinfra-red radiative forcingDamageHuman Health 1
Ozone DepletionODdecrease in ozone protectionDamageHuman Health
Human ToxicityHThazard-weighted doseDamageHuman Health
Photochemical Oxidant FormationPOFozone concentrationDamageHuman Health
Particulate Matter FormationPMFPM10 intakeDamageHuman Health
Ionizing RadiationIRabsorbed doseDamageHuman Health
Climate Change EcosystemsCCEinfra-red radiative forcingTerrestrial DamageEcosystems 2
Terrestrial AcidificationTAbase saturationTerrestrial DamageEcosystems
Freshwater EutrophicationFEalgae growthFreshwater DamageEcosystems
Terrestrial EcotoxicityTEThazard-weighted concentrationTerrestrial DamageEcosystems
Freshwater EcotoxicityFEThazard-weighted concentrationFreshwater DamageEcosystems
Marine EcotoxicityMEThazard-weighted concentrationMarine water DamageEcosystems
Agricultural Land OccupationALOoccupied areaTerrestrial DamageEcosystems
Urban Land OccupationULOoccupied areaTerrestrial DamageEcosystems
Natural Land TransformationNLTtransformed areaTerrestrial DamageEcosystems
Fossil DepletionFDenergy contentDamageResources Surplus Cost 3
1 Human health (unit): DALY, 2 Ecosystems (unit): Species.yr, 3 Resources surplus cost (unit): USD.
Table 3. Damage assessment percentages of processes for the production of a single grafted tomato seedling.
CatFertilizersSupp. MaterialsPesticidesTransp.IrrigationSoilEnergyDisinfectants
CCHH0.7811.460.00 (L)0.080.152.6184.85 (H)0.06
OD2.7136.940.02 (L)0.650.3719.8239.19 (H)0.30
HT0.923.870.01 (L)0.060.511.5793.01 (H)0.07
POF0.4914.190.00 (L)0.200.104.8680.11 (H)0.05
PMF0.857.830.00 (L)0.140.154.2386.76 (H)0.04
IR0.6011.510.01 (L)0.121.042.7083.86 (H)0.16
CCE0.7811.460.00 (L)0.080.152.6184.85 (H)0.06
TA0.877.590.00 (L)0.100.123.5687.73 (H)0.04
FE1.1741.070.01 (L)0.070.232.3055.03 (H)0.12
TET1.978.290.01 (L)0.200.868.4580.05 (H)0.17
FET0.9115.610.01 (L)0.165.135.0573.02 (H)0.11
MET1.8510.280.01 (L)0.130.767.9678.87 (H)0.12
ALO0.528.310.00 (L)0.010.422.1188.59 (H)0.03
ULO1.011.770.00 (L)0.210.984.6691.34 (H)0.03
NLT3.214.840.01 (L)0.390.6414.5976.19 (H)0.13
FD0.060.670.00 (L)0.010.060.2098.99 (H)0.01
H: highest percentage, L: lowest percentage, Cat: impact category (abbreviations are given in Table 2), Supp: supporting, Transp: transportation.
Table 4. Damage assessment percentages of the energy resources used for the production of a single grafted tomato seedling.
Res.CCHHODHTIRCCETAFETETFETMETFD
Elect.8.7241.728.4373.65 (H)8.727.0312.1912.8314.2318.693.67
Coal91.28 (H)58.28 (H)91.57 (H)26.3591.28 (H)92.97 (H)87.81 (H)87.17 (H)85.77 (H)81.31 (H)96.33 (H)
Res: Resource name, Elect: electricity.
Table 5. Damage assessment percentages of pesticides used for the production of a single grafted tomato seedling.
CatOrgano PhosphorusCyclic N[thio] CarbamateAcetamide AnillideTriazineDithio CarbamatePyrethroidPhthalimideUns.
CCHH19.132.080.914.210.37 (L)8.2438.07 (H)7.9119.09
OD18.152.221.014.970.44 (L)9.8434.24 (H)8.0421.07
HT16.932.120.884.310.38 (L)8.3941.02 (H)6.9019.08
POF18.822.130.944.490.38 (L)8.6236.78 (H)8.1719.66
PMF18.082.080.904.410.38 (L)7.9239.45 (H)7.4619.32
IR24.561.980.883.970.29 (L)6.4632.28 (H)11.0418.53
CCE19.132.080.914.210.37 (L)8.2438.07 (H)7.9119.09
TA17.982.060.904.460.38 (L)7.5739.98 (H)7.2619.39
FE19.96 (H)3.021.004.110.36 (L)18.8217.8015.5319.39
TET14.832.030.864.390.40 (L)7.4346.09 (H)4.8319.13
FET18.082.320.944.950.39 (L)9.1934.31 (H)9.6320.20
MET15.972.100.884.380.39 (L)8.1942.74 (H)6.1919.16
FD23.841.981.313.560.27 (L)12.7028.16 (H)9.9918.19
Uns: unspecified.
Table 6. Damage assessment percentages of supporting materials and horticultural substrates used for the production of a single grafted tomato seedling.
CatPeatPerliteVerm.Plastic SheetingGrafting SticksClipsSeedling InsertEPS TrayPackaging
CCHH8.334.026.226.352.075.7012.5654.72 (H)0.03 (L)
OD16.329.329.290.940.2636.41 (H)1.6025.810.04 (L)
HT17.105.016.804.661.3913.508.4542.93 (H)0.16 (L)
POF14.671.858.994.691.393.148.4156.85 (H)0.02 (L)
PMF15.992.9616.145.471.645.759.9642.05 (H)0.03 (L)
IR10.113.675.227.812.158.8313.0749.07 (H)0.07 (L)
CCE8.344.026.226.352.075.7012.5654.72 (H)0.03 (L)
TA12.182.9116.835.681.675.1910.1245.40 (H)0.03 (L)
FET3.300.891.123.732.784.2916.8866.87 (H)0.14 (L)
TET15.0330.145.302.430.884.195.3236.50 (H)0.22 (L)
FET11.205.098.168.171.805.0010.9049.58 (H)0.09 (L)
MET9.8316.3517.463.381.065.486.4239.94 (H)0.07 (L)
ALO2.66 (L)4.4413.1621.954.7215.2828.66 (H)5.183.95
ULO33.06 (H)8.6530.813.400.878.635.288.940.36 (L)
NLT32.95 (H)17.3524.792.770.537.373.2210.610.41 (L)
FD12.934.195.416.871.8117.5910.9940.10 (H)0.11 (L)
Verm: vermiculite.
Table 7. Comparison of polymers according to LCI data cradle-to-gate (EU data). Source: [33].
PolymerEnergy (GJ tonne−1)Water (kL tonne−1)CO2−e a (t tonne−1)Usage b (ktonne)Closed-Loop RecyclingEffectiveness in Current Recycling Processes
PET82.7663.42160yeshigh
HDPE76.7321.95468somehigh
PS87.41403.42600In theorypoor
a GWP calculated as 100-yr equivalent to CO2 emissions. b Usage for the aggregate EU-15 countries across all market sectors in 2002.

