Abstract
Minimizing the environmental impacts is a challenging task to achieve sustainability in road constructions. Although they are only temporary, the environmental burdens of building activities can have a great impact on the environment and communities, and must be properly assessed and mitigated. A comprehensive evaluation of the impacts requires the consideration of all construction activities, construction sites and the type and operation time of off-road machines and plants that will be used in each site. In this paper, a case study relating to the project of a motorway was carried out with the following objectives: (i) to estimate the dust and gases arising from the whole construction process and identify the most critical pollutants in terms of emitted quantity; (ii) to investigate the worksites, activities and processes with the greatest impact from an emissive standpoint, and (iii) to propose a rational approach for designing and putting in place effective mitigation measures. Carbon oxide (CO), nitrogen oxides (NOx), and fine particulate matter (PM10) emissions have been estimated by applying different models, methodologies and databases, depending on the construction process under analysis, and an emissive balance sheet has been produced. Results showed that CO is the pollutant released in the greatest quantity, followed by NOx. The emission of PM10, mainly due to the movement of trucks on unpaved roads, is one order of magnitude less with respect to CO and NOx, but produces the most perceived and undesired effects of the construction process in the interested communities. Tunnels and bridge are the components of a road with the greatest impact in terms of air emissions.
1. Introduction
Road construction activities and processes such as earthmovings, tunnel and bridge works, concrete production, transportation of materials, and operation of machines and equipment consume natural and non-renewable resources and generate wastes and pollution. The amount of environmental impacts depends on the road, its category, length and configuration, and on the peculiarity and sensitivity of the crossed sites and contexts. Minimizing the environmental burdens is a challenging task to be addressed, with the aim of contributing to sustainability in road constructions [1,2,3,4,5,6].
Among the impacts, a significant role is played by direct air emissions, particulate matter and trace gases, released by the machineries and equipment used during construction and which temporarily affect the local air quality. Off-road diesel equipment is a relevant font of nitrogen oxides (NOx), carbon oxide (CO) and particulate matter (PM) emissions [7,8]. According to emissions inventory data of U.S. Environmental Protection Agency (EPA) [9], off-road diesel equipment is estimated to be the third largest source for nitrogen oxides (NOx) emissions and the second largest source for particulate matter (PM) emissions. They represent, respectively, 14.5% and 24.3% of total NOx and PM emissions from mobile fonts. The adverse health and environmental effects of PM and trace gases have been confirmed by several studies [10,11,12].
Numerous studies have focused on off-road equipment emissions inventories [5,7,8,13,14,15]; however, the available data for comprehensive evaluations are still considerably more limited compared to the on-road mobiles sources. Few developed countries have published greenhouse gases (GHG) and non-GHG emission factor standards for non-road equipment. For instance, emission standards published by the United States Environmental Protection Agency [16] and the European Environmental Authority [17] include non-GHG emission factors for stationary equipment and data for off-road equipment.
The growing interest towards road constructions and their impacts on environment and society arises from the fact that, globally, more than 25 million kilometers of new roads are expected to be built by 2050, 90% of which will be in developed countries [18].
According to the World Bank [19], the transport sector accounts for nearly 14% of global GHG emissions, and approximately 72% of these emissions are caused by road construction, rehabilitation, maintenance and usage.
Considering this, the careful assessment of building procedures and practices and the estimation of magnitude of the correlated environmental impacts are of crucial importance in order to make road constructions more sustainable.
For this purpose, it is fundamental to gather information concerning the various activities and construction processes and their duration for comprehensive and suitable appraisals [1,2,20]. Activities and processes can have different emission characteristics, depending on the materials, machines and plants that are used [4,21,22]. Processes such as transportation and handling of bulk material, drilling, sawing, milling, compacting and grading of the ground are relevant sources of dust and gas emissions. A noteworthy amount of PM10, often higher than that produced by other construction operations [21,22] are also released by the movement of the vehicles on dirty or unpaved and temporary roads in the worksites [23,24,25].
In the literature, few studies deal with the real-world emissions from construction sites or with extensive evaluation on the emissions produced during the whole period of construction [26]. Some studies focused on data of exhaust emissions of the construction machineries [1,5,7,8]. Others investigated the influence of construction site emissions on local air quality [4,27,28] or calculated emission factors to assess emission inventories for all construction activities [21].
Comprehensive studies that take into account all these objectives, and that consider various construction activities and processes and their duration, are scarce [1,6,29]. Therefore, construction site emissions are poorly quantified and very uncertain [4].
This paper focuses on the consideration of the environmental burdens associated to a motorway building. The scope of work is the assessment of airborne emissions, gases and dust, during the whole period of construction.
A case study referring to an Italian motorway project was taken into consideration. Detailed data on construction sites, type of activities for each worksite, type of machineries and equipment, quantity of materials moved, and use of paved and unpaved roads were gathered and used for the performed calculations.
The objectives of this work are as follows:
- to estimate the dust and gases arising from the whole construction process and identify the most critical pollutants in terms of emitted quantity;
- to investigate the worksites, activities and processes with the greatest impact from an emissive standpoint;
- to propose a rational approach for designing and putting in place effective mitigation measures, in terms of type and location, which allow greater environmental sustainability for the construction process.
The rest of this paper is organized as follows: The methodology used in this study is introduced in Section 2. Then, the research findings, including the overall emissive balance sheet for construction activities, are discussed in Section 3. Finally, conclusions are presented in Section 4, highlighting the main contributions and future research directions.
2. Materials and Methods
2.1. Scope and System Boundary
In order to evaluate the impacts on air quality arising from road constructions, a motorway project, A category of Italian road standards [30], has been considered. The motorway is three lanes and dual carriageways and has a minimum width of 25.10 m and a length of approximately 18 km. It runs for five tunnels (13.3 km), five bridges (1.4 km) and excavations and embankments (3.2 km). The duration of construction is estimated at about eight years.
The analysis of the environmental impacts during construction was carried out considering all the parts of the motorway: road segment (excavation and embankment), bridges and tunnels.
For road segment, the works encompassed topsoil excavations, earthworks, subgrade compaction and subgrade construction for slope protection. Bridge erection included the realization of foundations, substructures, superstructures and sidewalks. Tunnel creation involved the activities of excavation, transportation, concrete ejection and bolting support and lining.
In this paper, the aim of estimating gases and dust emissions during the construction stage is addressed considering the activities and manufacturing processes listed in the following:
- operation of equipment and machines on worksites;
- transit of trucks on unpaved road;
- transit of trucks on paved road;
- topsoil excavation;
- storage of materials;
- deep excavations and earthworks;
- aggregate crushing and concrete production.
The construction plan has identified 25 work areas, distinguished as:
- construction sites (CS), where the storage of materials and the production of the concrete and the elements for tunnels lining take place;
- technical areas (TA), where all the plants and machineries needed for construction of bridges, tunnels and overpasses are located;
- area for general activities (CSGA), where all the offices (supervision, enterprise) and the facilities for workers (dormitories and canteens) are located, and
- work areas along the route of the future motorway.
Main functions and duration of the activities in all the areas are showed in Table 1.

Table 1.
Worksites functions and duration.
For each area, the construction project defined the machines and plants installed and the internal and external roads used for transportation of materials, as shown in Table 2.
Table 2.
Machineries and plants in work sites.
The type and the number of vehicles varied according to the activities to be executed, and complied with the following general lines:
- for operating sites and general activities camp, two rubber-tired loaders and two trucks;
- for work sites with crushing and concrete mixing, two rubber-tired loaders and two trucks, with the addition of a crushing plant and a concrete mixing plant;
- for technical areas used for the construction of viaducts, four drills, two excavators, two rubber-tired loaders, two cement mixers and two trucks;
- for technical areas used for the construction of embankments and trenches, two excavators, two rubber-tired loaders, two graders, two roller compactors and two trucks.
2.2. Models and Calculations
Different models, methodologies and databases, depending on the construction process under analysis, were applied for the estimation of gas and dust emissions. Main references were:
- US EPA Quality Analysis Guidance Handbook. Off-Roads Mobile Source Emission Factors AP 42 Fifth Edition, Volume I eds 2006 [16];
- COPERT v.5.2.2 (EMISIA SA, 2019) [31],
- ISPRA-INA-net, 2017 Database emission factors [32];
- Tuscany Region, 2018. Regional plan for ambient air quality. Annex 2: Technical document with determination of emission limit values and prescription for productive activities [33].
2.2.1. Dust and Gas Emissions for Machines and Plants Operations
The estimation of dust and gas emissions for vehicles and plants operation was carried out separately for the machineries and equipment operating in the worksite and for the trucks.
As regards to exhaust gas emissions released by heavy machines (excavators and other earth-moving vehicles), reference was made to the emission factors estimated for the year 2022 according to the American method defined in [16]. For the operating machines included in this project, Table 3 shows the emission factors of CO, NOx, PM10 expressed in kg/h. The level of detail of the model allows selection of the type of vehicle and the power, while diesel is the only fuel considered in this case.
Table 3.
Emission factor for equipment, year 2022 [16].
Based on the hourly emissions of the different machines and considering the equipment of each worksite, the emissions were calculated under the hypothesis that in a typical construction day machines and plants work simultaneously for 10 h. Figure 1 shows the hourly emissions of CO, NOx and PM10 for each type of worksite.
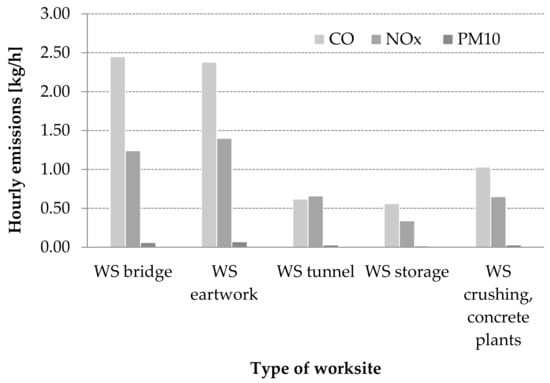
Figure 1.
Hourly emissions of CO, NOx and PM10 for type of work site (WS).
It is possible to observe the dominance of CO and NOx emissions with respect to the PM10 ones. It is noteworthy that in some worksites (specifically bridge and earthworks) the emissions of NOx are half of those of CO. The quantity of PM10 is negligible for all types of worksite. In more detail, the construction of bridges is the most emissive process, followed by the earthworks connected to the construction of embankments and trenches and the production of concrete. The worksite of tunnels seems to produce a lower amount of gases and particulate. This is partially true because the work takes place inside the bore, and ventilation systems allow minor discharges in the atmosphere. However, it needs to be considered that a greater part of earthmoving in this project is due to the tunnel constructions, which cover 74% of the motorway alignment; consequently a large amount of emissions assigned to the earthworks are intended as movement of materials deriving from tunnel excavations.
Given the hourly emission for each type of worksite and considering the daily activities, Figure 2 illustrates the distribution of the daily emissions along the worksites of the future motorway. In addition to what was already observed, it is remarkable that emissions are up to five times higher in some worksites than others, and this is true for all the pollutants.
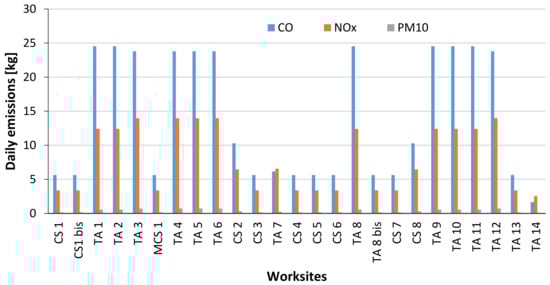
Figure 2.
Daily emissions of CO, NOx, PM10.
Figure 3 reports the quantity of the emissions, referring to the whole construction process of the motorway, caused by the operations of machines and plants.
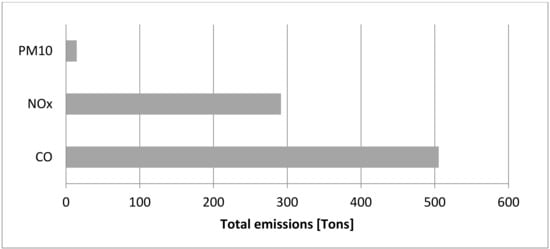
Figure 3.
Total emissions of CO, NOx, PM10.
The quantitative estimate of exhaust gas and particulate emissions from the exhaust pipes of the trucks used for materials transporting was carried out using the emission factors in g/vehicle-km (rural area) (see Table 4), obtained from the COPERT model [31] and reported in the ISPRA-SINAnet emission factor database 2017, [32]. In this case, in addition to CO, NOx, PM10, the emission of volatile organic components (VOC), nitrogen dioxide (NO2) and benzene (C6H6) were estimated.
Table 4.
Emissions for truck.
The calculation of the emissions in the worksites was performed under the hypothesis that in a typical day the trucks travel an average distance of 2 km. The total transits of trucks for transportation of earths, concrete, and other construction materials have been also considered (see Table 7). The quantities of emissions, expressed in kg, released into the atmosphere during the construction period are summarized in Table 5.
Table 5.
Emissions from trucks and vehicles circulating in worksite paths.
This table displays the predominance of the emission of NOx, which was about four times higher than that of CO. Quantities for VOC, PM10 and NO2 were lesser, but appreciable, especially for NO2. The emission of benzene was insignificant.
2.2.2. Particulate Emission for Truck Transit on Unpaved Roads
The transportation of excavations and other construction materials as well as other works involve the transit of vehicles on unpaved roads, where the friction of the wheels on the road surface determines the pulverization of the surface material and the subsequent volatilization and dispersion in the atmosphere.
The emission of dust for the circulation of vehicles on unpaved roads was estimated by applying Equation (1) provided by [16]:
where:
- E = specific emission factor for the different particle size values equal to 1.85 pounds per miles travelled or 522.44 g per kilometers;
- K = 1.5, multiplier factor for different particulate size values;
- s = 4.80, content of silt (%);
- W = average vehicle weight (tons), assumed equal to 30;
- a = 0.90 coefficient function of the particulate size;
- b = 0.45 coefficient function of the particulate size.
Table 6 shows the quantity of PM10 calculated for each worksite.
Table 6.
PM10 emissions for trucks transit on unpaved roads.
2.2.3. Particulate Emissions for Truck Transit on Paved Roads
The amount of particulate emitted during the transit of heavy vehicles on paved road depends on the characteristics of the road, the type of vehicle and the traffic flow.
The total number of transits was estimated considering that the total excavation volume would be transported by trucks with a capacity of 13 mc with a round trip. It was assumed that every truck traveled round-trip 30% of the length of the roads. The number of transits is reported in Table 7.
Table 7.
Trucks transit on paved roads.
The AP-42 methodology [16] proposes the following empirical expression (2) for estimating the quantity of particulate emissions from resuspension of loose material on the road surface due to vehicle travel on a dry paved road:
where:
- E = particle size multiplier for particle size range and units of interest. In this case (g/VKT), it is equal to 12.51 (from calculation);
- k = particle size multiplier for particle size range and units of interest. For PM10 and g/VKT it is equal to 0.62;
- SL = content of powdery material (sandy/silty) on the road (g/m2), assumed equal to 0.3;
- W = average vehicle weight (tons), equal to 30.
The total emissions of PM10 was calculated under the hypothesis that the average length travelled by trucks was about 1 km, and it is equal to 17,432 kg.
2.2.4. Particulate Emissions for Topsoil Excavation
Topsoil excavations (removal of the surface layers of the soil) are generally carried out with a scraper or excavator along the total construction site area. As indicated in paragraph 13.2.3 “Heavy construction operations” of the AP-42 [16], this phase produces Total Suspended Particles (PTS) emissions with a rate of 5.7 kg/km. In order to consider the emission factor of the PM10 component, it must be supposed that the emissions are completely constituted by the PM10 fraction, or partially. In this case, by observing the relationships between the PM10 and PTS emission factors relating to the other activities covered by this project, it was considered precautionary that the PM10 component is 60% of the PTS.
In this case, for each worksite, the length travelled by the scrapers was estimated to determine the emissions of PTS and PM10. The quantity of PM10 emitted by the topsoil excavations was 395 kg.
2.2.5. Particulate Emissions for Materials Storage
The amount of fine particulate matter (PM10) produced by the storage process was estimated by means of the empirical Equation (3) [16]:
where:
- E = PM10 emission factor (kg powders/ton removed material);
- U = average wind speed, assumed equal to 1.0 m/s, based on the meteorological data gathered at five monitoring points representative of the area of study;
- M = soil moisture content in %, assumed equal to 3.4;
- k = multiplicative factor for the different particulate size values; for PM10 (diameter less than 10 m) the value is 0.35.
Emissive factors have therefore been estimated for each construction site, starting from the planned earth volumes and duration. The contributions of the loading and unloading phases were also considered, according to following emission factors [16]:
- for the loading phase, 6.8 g/ton of loaded material;
- for the discharge phase, 0.45 g/ton of discharged material.
These factors are conservative as they refer to a surface material characterized by a low humidity and therefore very dusty. Table 8 displays the obtained results.
Table 8.
PM10 emitted in storage phase.
Uploading is the process of storage that produces 93% of the total PM10, while downloading produces 6% and the heap formation only 1%.
2.2.6. Particulate Emissions for Earthworks
As regards the assessment of emissions produced by excavations and earthworks, the same methodology used for storage was applied [16].
The areas where excavations take place were located along the entire alignment of the motorway, and the amount of the total excavation volume was derived from the project documents, particularly from the bill of quantities (BOQ). Table 9 shows the estimates of PM10 produced during excavation activities.
Table 9.
PM10 emitted during excavation and earth movement.
2.2.7. Particulate Emissions for Aggregate Crushing
Two crushing plants were placed in the CS 2 and CS 8 worksites. These plants, when in operation, involved the emission of dusts. The Tuscany Guidelines [33] report the emission factors of PM10 for various crushing activities, in the presence or absence of mitigation measures, according to the AP-42 method [16]. In the project, periodic wettings are foreseen and consequently the emission factors in presence of mitigation measures have been applied. Table 10 shows the results obtained starting from the cumulative expected volumes entering into the two crushing plants and the size of the outgoing aggregates.
Table 10.
PM10 emissions for crushing.
Among the crushing phases, the secondary phase is the most relevant from an emissive standpoint. In fact, it contributed 52% of the total emissions of PM10, while screening and tertiary crushing were 27% and 20%, respectively. The contribution of the truck download was very low and negligible.
3. Results and Discussion
Based on the previous estimates, the overall emissive balance sheet for construction activities of the motorway has been produced and reported in Table 11. The main pollutants considered in the study are the non-GHG emissions such as carbon monoxide (CO) and nitrogen oxides (NOx) and particulate matters (PM10), which are the major particle-based emissions that especially affect the air quality in urban areas. Volatile organic compounds (VOC), nitrogen dioxide (NO2) and benzene (C6H6) were calculated only for truck operation.
Table 11.
Overall emissive balance sheet.
CO is the pollutant emitted in the highest quantity mainly by the machineries and plants. Results show that during the construction stage of the motorway, about 500,000 kg of CO will be produced. An important contribution of about 300,000 kg is also provided by the nitrogen oxides (NOx). Significantly lesser quantities are the result of VOC, NO2 and C6H6. The emission of PM10 is one order of magnitude less with respect to CO and NOx, but it produces the most perceived and undesired effects of the construction process in the interested communities [34,35].
More in-depth assessment on PM10 emissions, as illustrated in Figure 4, shows that the main contribution (about 50%) to the total amount of particle emissions arises from the truck transits on unpaved roads, under the hypothesis that all the roads inside the worksite are unpaved. Transits on paved roads contribute about 25%. Aggregate crushing and concrete production and storage share a similar contribution of about 15%, while earthworks and topsoil excavation have a negligible contribution. Dust emissions are strongly dependent on soil moisture and can successfully be reduced by wetting the ground (for PM10 up to 95 ± 34%), showing the importance of potential mitigation strategies [1].
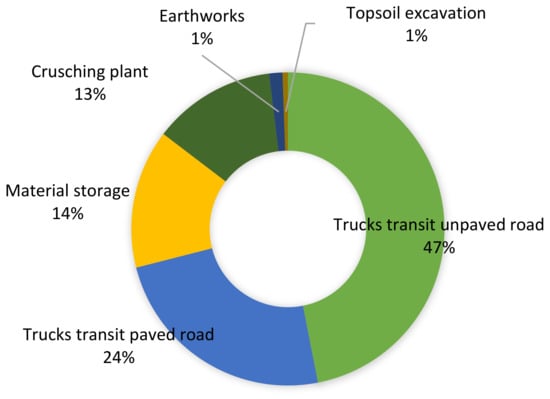
Figure 4.
Share of particulate emissions for type of construction activities.
The results, albeit derived from a conservative hypothesis, provide useful information about the environmental burdens associated with the construction of an important road, not only in terms of magnitude, but mainly referring to the activities and process that must be careful planned and organized in order to reduce and mitigate the negative effects.
4. Conclusions
The expected growth of the road constructions around the world calls for careful and reliable evaluations of environmental impacts arising from the main activities in the realization process. Annual emissions from construction activities reveal that the construction sector contributes significantly to the total emissions of particles and trace gases in many countries. A great amount of materials and equipment, with different work time are involved in construction activities, depending on the part of motorway under construction (road segment, bridge, tunnel).
The key contribution of this study is the detailed analysis of the relevant processes in road-building, the assessment of their potential emissions, and the most critical conditions referring to both quantities emitted and location. The analysis of a case-study made it possible to derive general considerations and indications for practitioners to be applied in road construction projects.
The study demonstrates that in the worksites of bridges, earthworks and tunnels, due to the operating equipment, the emissions are 2.5 to 5 times higher than the emission of storage and concrete production worksites. Consequently, in some worksites the daily emissions can reach a value 5 times higher than others.
Among the total gases and dust released from motorway construction, the share of carbon monoxide (CO) is 57%, nitrogen oxides (NOx) comprises 33% and particulate matter (PM10) is 10%.
These outcomes can assist project managers in adopting targeted effective mitigation measures, both activity-specific and site-specific, at the project stage and address a feasible monitoring system, which controls and supervises on-site emissions in a timely manner. For example, by knowing the main sources of dust generation, the construction managers and controllers of an earthwork activity can pay intensive attention to materials transportation and storage and adopt proper mitigation measures tailored to them for better outcomes of the monitoring system. The abatement of CO and NOx can be pursued by enforcing a greener construction policy addressed, for example, towards the restricted use of older machines and equipment, the replacing or repowering of older engines, or the installation of exhaust retrofits. These emission control measures are of the utmost importance in order to reduce the damage of the pollutant emissions, to meet emission standards and requirements, and to prevent the harmful effects of pollutant emissions on the environment and human health.
Author Contributions
Conceptualization: M.G., D.L.B., G.L., F.S.; data curation: M.G.; methodology: M.G., D.L.B., G.L., F.S.; writing (original draft): M.G., writing—review and editing: M.G., D.L.B., G.L., F.S.
Funding
This research received no external funding.
Conflicts of Interest
The authors declare no conflict of interest.
References and Note
- Faber, P.; Drewnick, F.; Borrmann, S. Aerosol particle and trace gas emissions from earthworks, road construction, and asphalt paving in Germany: Emission factors and influence on local air quality. Atmos. Environ. 2015, 122, 662–671. [Google Scholar] [CrossRef]
- Heidari, B.; Marr, L.C. Real-time emissions from construction equipment compared with model predictions. J. Air Waste Manage Assoc. 2015, 65, 115–125. [Google Scholar] [CrossRef]
- Kong, S.; Li, X.; Li, Q.; Yin, Y.; Li, L.; Chen, K.; Liu, D.; Yuan, L.; Pang, X. Subway construction activity influence on polycyclic aromatic hydrocarbons in fine particles: Comparison with a background mountainous site. Atmos. Res. 2015, 161, 82–92. [Google Scholar] [CrossRef]
- Font, A.; Baker, T.; Mudway, I.S.; Purdie, E.; Dunster, C.; Fuller, G.W. Degradation in urban air quality from construction activity and increased traffic arising from a road widening scheme. Sci. Total. Environ. 2014, 497, 123–132. [Google Scholar] [CrossRef] [PubMed]
- Fu, M.; Ge, Y.; Tan, J.; Teng, T.; Liang, B. Characteristics of typical non-road machinery emissions in China by using portable emission measurement system. Sci. Total Environ. 2012, 437, 255–261. [Google Scholar] [CrossRef] [PubMed]
- Chen, J.; Zhao, F.; Liu, Z.; Ou, X.; Hao, H. Greenhouse gas emissions from road construction in China: A province-level analysis. J. Clean. Prod. 2017, 168, 1039–1047. [Google Scholar] [CrossRef]
- Pirjola, L.; Rönkkö, T.; Saukko, E.; Parviainen, H.; Malinen, A.; Alanen, J.; Saveljeff, H. Exhaust emissions of non-road mobile machine: Real-world and laboratory studies with diesel and HVO fuels. Fuel 2017, 202, 154–164. [Google Scholar] [CrossRef]
- Wang, F.; Li, Z.; Zhang, K.; Di, B.; Hu, B. An overview of non-road equipment emissions in China. Atmos. Environ. 2016, 13, 283–289. [Google Scholar] [CrossRef]
- United States Environmental Protection Agency. Determination of PEMS Measurement Allowances for Gaseous Emissions Regulated Under the Heavy-duty Diesel Engine In-use Testing Program; Revised Final Report EPA420-R-08–005; U.S. EPA: Arlington, VA, USA, 2008.
- Hime, N.J.; Marks, G.B.; Cowie, C.T. A Comparison of the Health Effects of Ambient Particulate Matter Air Pollution from Five Emission Sources. Int. J. Environ. Res. Public Health. 2018, 15, 1206. [Google Scholar] [CrossRef]
- Boningari, T.; Smirniotis, P.G. Impact of nitrogen oxides on the environment and human health: Mn-based materials for the NOx abatement. Curr. Opin. Chem. Eng. 2016, 13, 133–141. [Google Scholar] [CrossRef]
- Kim, K.H.; Kabir, E.; Kabir, S. A review on the human health impact of airborne particulate matter. Environ. Int. 2015, 74, 136–143. [Google Scholar] [CrossRef] [PubMed]
- Cao, T.; Russell, R.L.; Durbina, T.D.; Cocker, D.R., III; Burnette, A.; Calavita, J.; Maldonado, H.; Johnson, K.C. Characterization of the emissions impacts of hybrid excavators with a portable emissions measurement system (PEMS)-based methodology. Sci. Total Environ. 2018, 635, 112–119. [Google Scholar] [CrossRef] [PubMed]
- Cao, T.; Durbin, T.D.; Russell, R.L.; Cocker, D.R., III; Scora, G.; Maldonado, H.; Johnson, K.C. Evaluations of in-use emission factors from off-road construction equipment. Atmos. Environ. 2016, 147, 234–245. [Google Scholar] [CrossRef]
- Iim, J.H.; Jung, S.W.; Lee, T.W.; Kim, J.C.; Seo, C.Y.; Ryu, J.H.; Hwang, J.W.; Kim, S.M.; Eom, D.S. A study on calculation of air pollutants emission factors for construction equipment. J. Korea. Soc. Atmos. Environ. 2009, 25, 188–195. [Google Scholar]
- Environmental Protection Agency (US EPA). Air Quality Analysis Guidance Handbook Off-Roads Mobile Source Emission Factors, 5th ed.; Environmental Protection Agency (US EPA): Washington, DC, USA, 2006; 1, AP 42.
- European Parliament and Council (EPC). Regulation (Eu) 2016/1628 on Requirements Relating to Gaseous and Particulate Pollutant Emission Limits and Type-Approval for Internal Combustion Engines for Non-Road Mobile Machinery; European Parliament and Council (EPC): Edinburgh, UK, 2016. [Google Scholar]
- Laurance, W.F.; Clements, G.R.; Sloan, S.; O’Connell, C.S.; Mueller, N.D.; Goosem, M.; Venter, O.; Edwards, D.P.; Phalan, B.; Balmford, A.; et al. A global strategy for road building. Nature 2014, 513, 229–232. [Google Scholar] [CrossRef]
- The World Bank. Transport Greenhouse Gas Emissions Mitigation in Road Construction and Rehabilitation: A Toolkit for Developing Countries; World Bank: Washington, DC, USA, 2005. [Google Scholar]
- Azarmi, F.; Kumar, P.; Mulheron, M. The exposure to coarse, fine and ultrafine particle emissions from concrete mixing, drilling and cutting activities. J. Hazard. Mater. 2014, 279, 268–279. [Google Scholar] [CrossRef]
- Muleski, G.E.; Cowherd, C., Jr.; Kinsey, J.S. Particulate emissions from construction activities. J. Air Waste Manag Assoc. 2005, 55, 772–783. [Google Scholar] [CrossRef]
- Abolhasani, S.; Frey, H.C.; Kim, K.; Rasdorf, W.; Lewis, P.; Pang, S.H. Real-world in-use activity, fuel use, and emissions for non-road construction vehicles: A case study for excavators. J. Air Waste Manag. Assoc. 2008, 58, 1033–1046. [Google Scholar] [CrossRef]
- Kinsey, J.S.; Linna, K.J.; Squier, W.C.; Muleski, G.E.; Cowherd, C., Jr. Characterization of the fugitive particulate emissions from construction mud/dirt carryout. J. Air Waste Manag. Assoc. 2004, 54, 1394–1404. [Google Scholar] [CrossRef]
- Guttikunda, S.K.; Goel, R.; Pant, P. Nature of air pollution, emission sources, and management in the Indian cities. Atmos. Environ. 2014, 95, 501–510. [Google Scholar] [CrossRef]
- Gillies, J.A.; Watson, J.G.; Rogers, C.F.; Du Bois, D.; Chow, J.C.; Langston, R.; Sweet, J. Long-term efficiencies of dust suppressants to reduce PM10 emissions from unpaved roads. J. Air Waste Manag. Assoc. 1999, 49, 3–16. [Google Scholar] [CrossRef] [PubMed]
- Liu, Y.; Wang, Y.; Li, D.; Yu, Q. Life cycle assessment for carbon dioxide emissions from freeway construction in mountainous area: Primary source, cut-off determination of system boundary. Resour. Conserv. Recycl. 2019, 140, 36–44. [Google Scholar] [CrossRef]
- Fuller, G.W.; Green, D. The impact of local fugitive PM10 from building works and road works on the assessment of the European Union limit value. Atmos. Environ. 2004, 38, 4993–5002. [Google Scholar] [CrossRef]
- Lee, D.; Kang, G.; Nam, C.; Cho, H.; Kang, K.I. Stochastic Analysis of Embodied Carbon Dioxide Emissions Considering Variability of Construction Sites. Sustainability 2019, 11, 4215. [Google Scholar] [CrossRef]
- Alzard, M.H.; Maraqa, M.A.; Chowdhury, R.; Khan, Q.; Albuquerque, F.D.B.; Mauga, T.I.; Aljunadi, K.N. Estimation of Greenhouse Gas Emissions Produced by Road Projects in Abu Dhabi, United Arab Emirates. Sustainability 2019, 11, 2367. [Google Scholar] [CrossRef]
- D.M. 5/11/2001 n. 6792. In Norme geometriche e funzionali per la costruzione delle strade; Ministero delle Infrastrutture e dei Trasporti: Rome, Italy, 2011.
- Copert v.5.2.2. EMISIA SA. 2019.
- ISPRA–SINAnet. Database of Average Emission Factors for Road Transport in Italy. 2017. Available online: http://www.sinanet.isprambiente.it/it/sia-ispra/fetransp/ (accessed on 16 September 2019).
- Tuscany Region. Regional Plan for Ambient Air Quality. Annex 2: Technical Document with Determination of Emission Limit Values and Prescription for Productive Activities. 2018. Available online: https://www.regione.toscana.it/documents/10180/14847862/Allegato-A-PRQA-All2-documento-tecnico.pdf/0c520559-a270-4698-9652-7873ae007863 (accessed on 18 September 2019).
- Wu, Z.; Zhang, X.; Wu, M. Mitigating construction dust pollution: State of the art and the way forward. J. Clean. Prod. 2016, 112, 1658–1666. [Google Scholar] [CrossRef]
- Xing, J.; Ye, K.; Zuo, J.; Jiang, W. Control Dust Pollution on Construction Sites: What Governments Do in China? Sustainability 2018, 10, 2945. [Google Scholar] [CrossRef]


© 2019 by the authors. Licensee MDPI, Basel, Switzerland. This article is an open access article distributed under the terms and conditions of the Creative Commons Attribution (CC BY) license (http://creativecommons.org/licenses/by/4.0/).