Article

Reliability Validation of a Low-Cost Particulate Matter IoT Sensor in Indoor and Outdoor Environments Using a Reference Sampler

1
Institute of New Imaging Technologies (INIT), Universitat Jaume I, Av. Vicente Sos Baynat s/n, 12071 Castelló de la Plana, Spain
2
Department of Agricultural and Environmental Sciences, Universitat Jaume I, Av. Vicente Sos Baynat s/n, 12071 Castelló de la Plana, Spain
3
Department of Mathematics, Statistics Area, Universitat Jaume I, Av. Vicente Sos Baynat s/n, 12071 Castelló de la Plana, Spain
4
Institut Universitari de Matemàtiques (IMAC), Universitat Jaume I, Av. Vicente Sos Baynat s/n, 12071 Castelló de la Plana, Spain
5
CIBER of Epidemiology and Public Health (CIBERESP), 28029 Madrid, Spain
6
Research Group on Statistics, Econometrics and Health (GRECS), University of Girona, 17004 Girona, Spain
*
Author to whom correspondence should be addressed.
These authors contributed equally to this work.
Sustainability 2019, 11(24), 7220; https://doi.org/10.3390/su11247220
Submission received: 17 November 2019 / Revised: 12 December 2019 / Accepted: 12 December 2019 / Published: 16 December 2019

Abstract

:
A suitable and quick determination of air quality allows the population to be alerted with respect to high concentrations of pollutants. Recent advances in computer science have led to the development of a high number of low-cost sensors, improving the spatial and temporal resolution of air quality data while increasing the effectiveness of risk assessment. The main objective of this work is to perform a validation of a particulate matter (PM) sensor (HM-3301) in indoor and outdoor environments to study PM2.5 and PM10 concentrations. To date, this sensor has not been evaluated in real-world situations, and its data quality has not been documented. Here, the HM-3301 sensor is integrated into an Internet of things (IoT) platform to establish a permanent Internet connection. The validation is carried out using a reference sampler (LVS3 of Derenda) according to EN12341:2014. It is focused on statistical insight, and environmental conditions are not considered in this study. The ordinary Linear Model, the Generalized Linear Model, Locally Estimated Scatterplot Smoothing, and the Generalized Additive Model have been proposed to compare and contrast the outcomes. The low-cost sensor is highly correlated with the reference measure ( R 2 greater than 0.70), especially for PM2.5, with a very high accuracy value. In addition, there is a positive relationship between the two measurements, which can be appropriately fitted through the Locally Estimated Scatterplot Smoothing model.

1. Introduction

Numerous scientific studies support that air pollution is harmful to public health [1,2,3,4,5,6]. Therefore, the evaluation of pollutant concentrations is essential to assess risk [7]. A suitable and quick knowledge of air quality allows the population to be alerted in terms of high concentrations of pollutants. One pollutant that presents a high risk is particulate matter (PM), due to its great potential to reach the inner part of the lung [8]. The reference method (EN12341:2014) established by the European Union to determine these pollutants is based on collecting particles in filters with 24-h exposure (Directive 2008/50/EC [9], amended by Commission Directive 2015/1480/EC [10]). This hinders rapid action when there are episodes of high concentrations of pollutants. On the other hand, there is a limitation in the use of reference equipment due to the high economic costs involved, and consequently, there are fewer control stations.
Recent advances in the fields of low-cost sensors and computer science such as the movement of the Internet of things (IoT) and open and low-cost hardware have led to the opportunity to deploy sensorization platforms with acceptable costs for mass deployment. Also, the impulse towards smart cities has generated greater penetration and implantation of these sensing devices [11]. The field of environmental monitoring is not an exception. It has allowed the installation of a higher number of these outdoor air quality monitoring solutions and improvements both in spatial and temporal resolution [12], besides increasing effectiveness in risk assessment.
This work is focused on environmental monitoring of particles levels in the air, and currently there are some sensorization solutions on the market to measure this phenomenon. Most of these sensors are based on the optical scattering of light using a laser and the application Mie’s theory to scattered light to determine the particle size [13]. In this way, different particle sizes such as PM2.5 (less than 2.5 μ m) and PM10 (less than 10 μ m) can be measured. These sensors can be installed in both indoor and outdoor environments [14]. The size of these sensors is contained, and the power consumption is low (and supports sleep mode). These sensors can operate with high sampling rates (even higher than professional solutions), and their price ranges from 5 to 100 euros [15].
PM sensors are widely used in particle detection instruments, smart appliances, indoor and outdoor air detection, and clean room evaluations. In the literature, these sensors have been used in a long list of applications [16], for example in air quality testing equipment, air purifiers/air conditioners, dust and smoke detection and analysis, industrial PM analysis, multichannel particle counters, and environmental testing equipment. There are several low-cost PM sensor solutions on the market, such as: Sharp GP2Y1010 [17], Wuhan Cubic PM3007 [18], Plantower PMS1003 [19], Shinyei PPD42NS [20], Nova SDS011 [21], and HM-3001 [22] (used in this work). Deployment of these sensors can be performed by non-profit organizations and civil scientists [23]. However, the accuracy and reliability of the sensors must be evaluated in a comprehensive and repeatable manner under real-world conditions before they are implemented in large quantities [24]. In the literature, there are few validations works for this type of PM2.5 sensor, and their approaches do not respond to different time scales or different environments indoors and outdoors [25,26].
This work aims to perform a validation of one of these dust sensors (HM-3301) in the range PM2.5 and PM10. This has not yet been done in prior research. For this purpose, extensive tests were defined temporarily and in indoor and outdoor environments. The HM-3301 sensor was integrated into an IoT platform called Sense Our Environment ( SEnviro) [27] to provide full connectivity. The validation was carried out using a reference sampler (LVS3 from Derenda) according to EN12341:2014. It is focused on the statistical point of view, and environmental conditions are not considered to realize the comparative.
In this context, the primary objective of the present work is to identify how a low-cost, lightweight, and portable HM-3301 particle counter works as a particle counting device. This sensor captures trends in ambient PM2.5 and PM10 concentrations, but essential properties of the sensor response have yet to be demonstrated. In the same way, the aim is to analyze the validation using sampler (LVS3) and to compare the possible differences with the sensor data. Another objective is to use different methodologies for adjusting the differences, such as Linear Models (LMs), Generalized Linear Models (GLMs), Locally Estimated Scatterplot Smoothing (LOESS), or Generalized Additive Models (GAMs).

2. Materials and Methods

2.1. Low-Cost Sensor

As was indicated in the previous section, a PM sensor was integrated into a sensing node platform called Sense Our Environment (SEnviro) [27]. SEnviro is a low-cost and autonomous solution to monitor the environment. In 2015, some nodes of the SEnviro platform were deployed and evaluated in the context of Jaume I University’s campus [28]. Those nodes could monitor meteorological and air quality phenomena. A new version of the SEnviro node platform was published in 2018 [29,30,31] to monitor small vineyards. This new version provides some improvements compared to the first version published in 2015. Some of these enhancements were 3G connectivity, the possibility of changing the behavior of the IoT node using Over The Air (OTA) updates, more efficient power management, and more appropriate connection techniques to deliver observations using the Message Queue Telemetry Transport (MQTT) protocol. The current work is based on the last version of SEnviro and includes the mentioned PM sensor for monitoring in indoor and outdoor environments. The PM sensor adaptation in the IoT node is also detailed.
From the hardware point of view (how the node is built) and following the modules defined in [29] (Core, Sensors/Actuators, Power supply, and Communication), a new 3G microcontroller called Particle Boron [32] is used. This microcontroller increases the performance of the previous one (Particle Electron) in terms of speed and allowing a mesh configuration in a natural manner. The communication module used is 3G and is used to establish a connection between the IoT node and the server side. The power supply is accomplished using a battery and a permanent power supply. The wire is used because in this case for sensor validation a wireless solution is not compulsory, and this solution increases the performance and reliability of the platform. In the sensor module and for this research work, only the appointed PM sensor to monitor particulate matter (Section 2.1.1) is added. This sensor is joined to the microcontroller using a Grove connector and I2C communication protocol. Finally, an enclosure printed using a 3D printer has been designed to house all the components and to protect the electronic components (Figure 1).
At the behavioral level, following the same previous work [29], the developed IoT node also follows a modular design formed by seven modules (Control, Basic Config, Communication, Sensing, Acting, Energy Savings, and Update Mode). In our current work, the seven modules are developed in the same way as the appointed work, but in this case, the energy savings due to a continuous power supply are disabled. In order to validate the sensor, the sensing module is adjusted to take observations every 15 min. In addition to the storage mechanisms used in SEnviro, in this work the observations are stored in a Google Drive spreadsheet in real-time to facilitate the validation analysis step.

2.1.1. The Laser Particulate Matter Sensor: HM-3301

The PM sensor included in the IoT node is called HM-3301 (Figure 2) and was created as a new generation of laser dust sensors developed by Huaman Electronics. The HM-3301 PM sensor is adopted for constant and real-time exposure of dust in the air in indoor and outdoor environments. The main difference with respect to the previous pumping generation is that the HM-3301 PM sensor employs fan blades to drive air, and the air flowing through the detection chamber is used as a test sample to perform a real-time and continuous test on the dust of different particle sizes in the air. This sensor follows standards like ISO 21501-4, ISO 14644-1, and FS209E. The HM-3301 PM sensor supports a six-channel output of 0.3 μ m, 0.5 μ m, 1.0 μ m, 2.5 μ m, 5.0 μ m, and 10.0 μ m. It is composed of a fan, a condensing mirror, an infrared laser source, a photosensitive tube, and a signal-amplifying and sorting circuit. This sensor supports communication modes between a microcontroller using the I2C and UART interfaces. Table 1 summarizes all PM sensor features.
The HM-3301 PM sensor is based on the Mie scattering theory [13]. When light passes through particles at the same quantity as a wavelength of the light (or greater), it produces light scattering (Figure 3). The scattered light is concentrated on a highly sensitive photodiode, which is then amplified and analyzed by a circuit. With a specific mathematical model and algorithm, the count concentration and mass concentrations of the dust particles are obtained. For this work, mass concentrations of PM2.5, and PM10 were used.

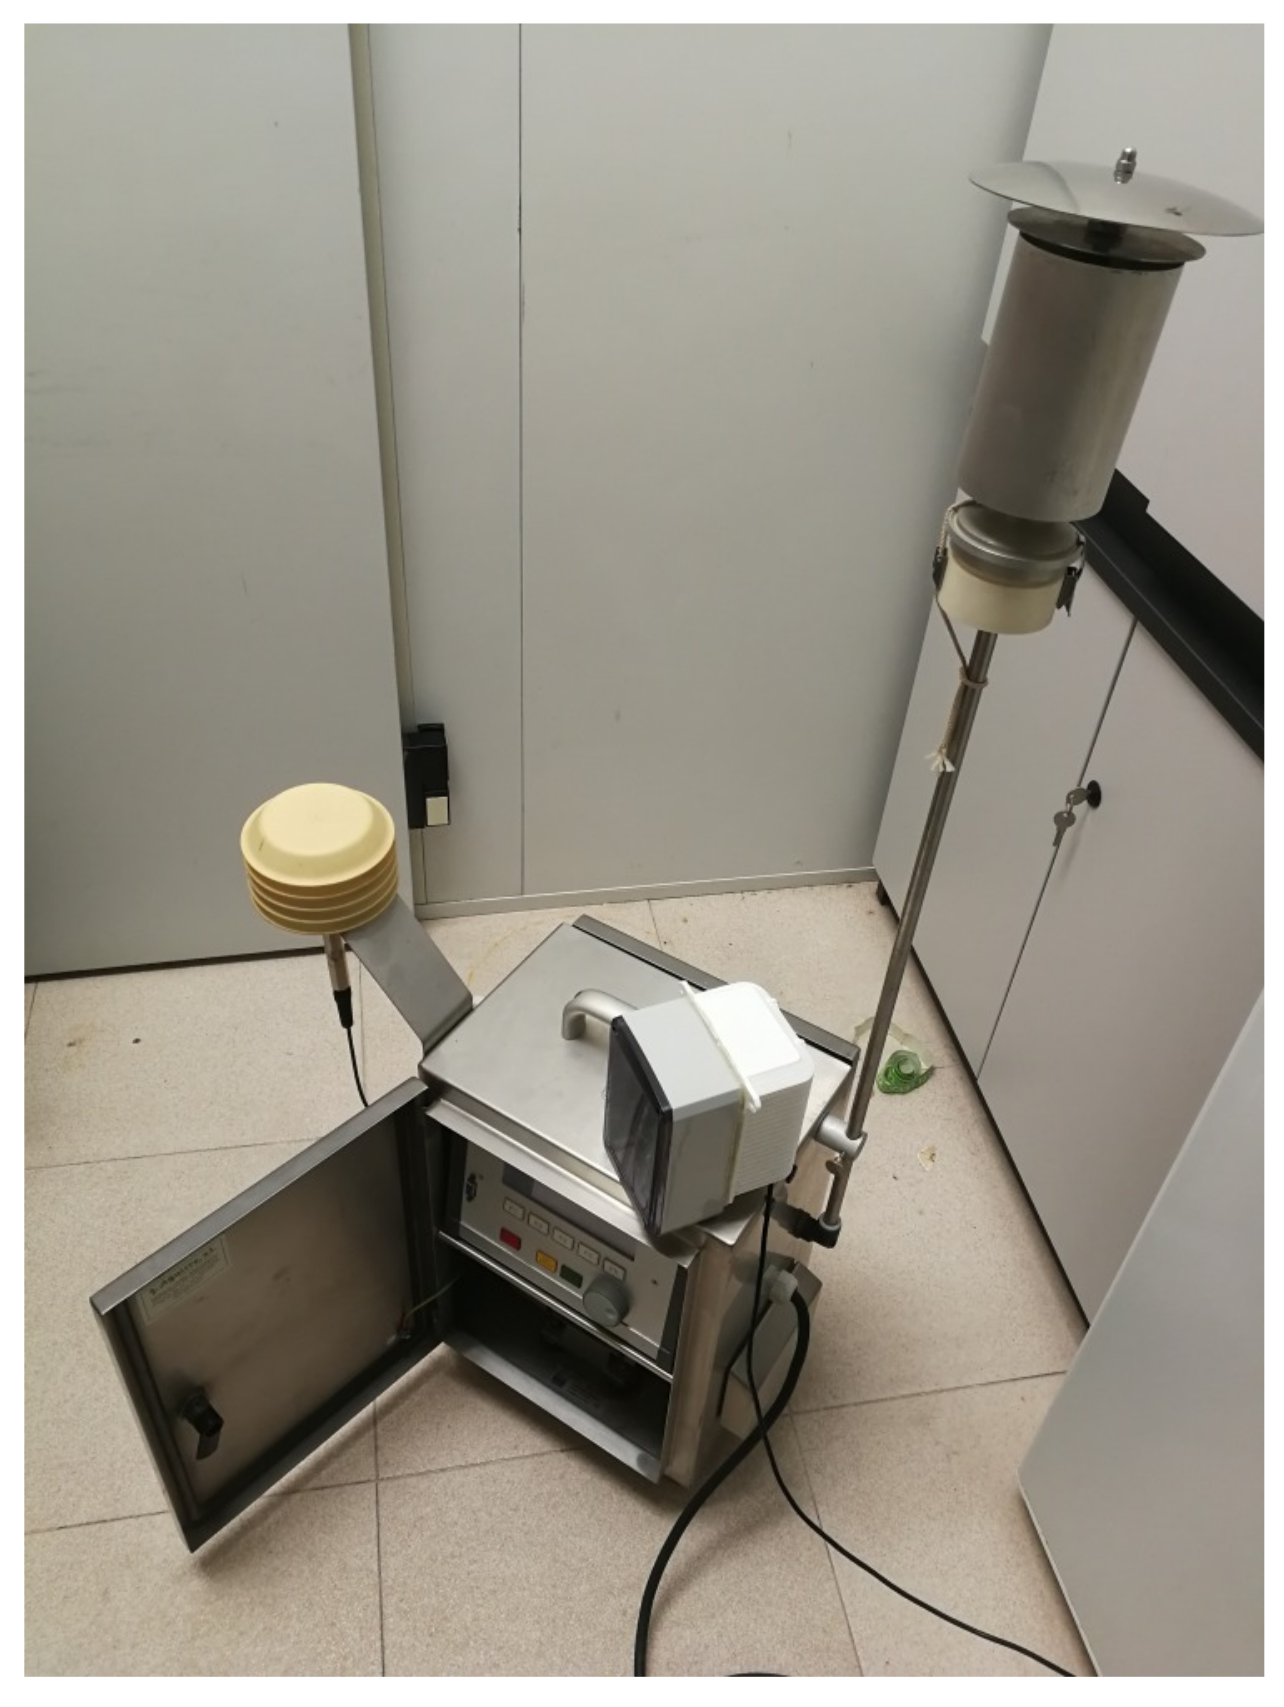
2.2. Reference Sampler: LVS3

LVS3 sampler unit from Derenda has been used to collect particles from ambient air in compliance with EN12341:2014 (Figure 4). It was set up for as a control unit in combination with filter changer. This mechanism uses a 4-m 3 rotary vane vacuum pump to draw the particulate-laden air into an upstream head. The particles are then ranked by size in an upstream impactor and deposited on a quartz fiber filter with a diameter of 47 mm. The air throughout is monitored with a measuring hole which fits between the filter and the vacuum pump. The technical parameters of LVS3 sampler are shown in Table 2.
PM2.5 and PM10 concentrations were determined by gravimetric method based on weighing the filter before and after sampling. According to standard EN12341:2014, the filters must be kept for at least 48 hours in a special chamber at 50 % relative humidity and 20 C temperature. Filters were weighed on an analytical scale with a precision of 0.1 mg. The PM concentration levels were determined using Equation (1):
C P M = ( P m P v ) 10 6 / V a i r
where C P M is the particle concentration in μ g/m 3 ; P m is the weight of the sampled filter in g; P v is the empty weight of the filter in g; and V a i r is the volume of air pumped in m 3 .

2.3. Sampling Conditions

The current work aims to carry out validations of the named low-cost sensor in two different environments (indoors and outdoors) to learn the behavior of equipment measuring different ranges of concentrations within PM2.5 and PM10. One unit of this inexpensive sensor and two reference samplers (one in each environment) sampled simultaneously in the same location, so external factors to the measure were not considered. During the indoor environment period the low-cost sensor and the reference sampler were used inside an office of the Jaume I University without a human presence (Figure 5).
Regarding the outdoor environment validation, Vila-real, an industrial city in the eastern region of the province of Castellón (Spain), has been chosen. This province is a strategic area in the framework of European Union pollution control. This area has a high concentration of ceramic tiles and factories, representing an essential cluster with respect to this material [33] (Figure 6). Indoor and outdoor measurements were not concurrent during the same time period.

2.4. Statistical Models Used for Validation

Linear models are relatively simply described and developed, and are easily interpreted. In particular, the GLM is a resilient generalization of ordinary linear regression models characterized by response variables for which its error distribution models differ from a normal distribution. Thus, these kinds of models allow the linear model to be related to the response variable through a link function and permit the magnitude of the variance of each measurement to be a function of its predicted value [34,35].
However, such models may be limited in terms of predictive capacity if the relationship between variables is more complicated. Some of the models that allow the modeling of non-linear relationships while trying to maintain a high level of interpretability are, for example, LOESS or GAM. LOESS is a nonlinear regression with a single predictor, similar to splines in terms of adjustment by regions, but it differs in that the intervals can overlap. On the other hand, GAM is an extension of LOESS for modeling multiple predictors. In this study, an ordinary LM, GLM, LOESS, and GAM have been proposed to compare and contrast their results.

3. Results

3.1. Description Data

As discussed, a low-cost sensor validation has been performed using a reference sampler unit. The HM-3301 PM sensor has a sequential typology, so it takes timely and parameterizable measurements every x minutes (15 in our case), while the reference sampler unit performs daily measurements using one-day filters. Thus, the granularity of the observations is different; this feature will be treated to perform validation.
The PM low-cost sensor was installed on 17 September 2019, with data taken until 12 November 2019, although there were some days of inactivity. During this period, the sensor was located in both indoor and outdoor environments. In total, three different periods can be identified. The first period was from 17 September to 14 October, where the PM sensor was installed in an indoor environment (Figure 7a); the second period was from 15 October to 30 October, in an outdoor environment (Figure 7b); and finally, third period from 31 October to 12 November, in an indoor environment (Figure 7c). Both indoor environments periods were in the same university office. In total 3677 observations were collected during these three periods with a rate of 15 min. Each observation contains a timestamp and PM2.5 and PM10 values. The dataset with all collected observations is published in Zenodo [36].
Moreover, two units of reference samplers (one for PM10 and other for PM2.5) were set up during several days in the periods of HM-3301 sensor. Table 3a summarizes the data collected using PM2.5 LVS3 sampler and Table 3b for PM10.

3.2. Analysis and Modeling

First of all, in order to get a first insight on how data are distributed and which is the degree of relationship between the values obtained by the HM-3301 sensor (for PM2.5 or PM10) and those of the LVS3 sampler, an exploratory analysis of the data for each by means on a scatter plot was carried out (Figure 8). Even if the number of points is scarce, a positive trend can be observed between the two measures.
Secondly, the results, after applying the different models in the data comparison between LVS3 sampler and HM-3301 sensor for PM2.5 and PM10 (indoor and outdoor) are shown in Figure 9. These graphs also include envelopes (grey color) indicating a confidence interval assuming 95% confidence. In most cases, the points are always kept within the limits of the interval, although LOESS seems to best fit the points.
In addition, Figure 10 shows the LOESS model for PM2.5 and PM10 obtained by the HM-3301 sensor, which presents a correlation 0.8495. There seems to be a linear regression because the data are correlated. A suitable fit between the two measurements with the correlation value and the graph is obtained. The correlations for the two PM series are 0.9143 in PM2.5 and 0.8870 in PM10, separately and in front of reference sampler, showing very similar values. In all cases, a good adjustment is shown, at close to 1.
After this first joint analysis, the indoor and outdoor environments are distinguished. The results are shown in Figure 11 in the case of PM2.5. Although there are not too many points, a certain tendency over them can be observed, with correlations of 0.8905 and 0.7306, respectively.
A similar process has been done to analyze the PM10 values. Thus, considering all the values together (indoor and outdoor measures), a correlation of 0.8870 is obtained. Moreover, again, LOESS seems to be the best. When we distinguish between indoor and outdoor data (Figure 12) we obtain correlations of −0.4644 and 0.7720, respectively. In the case of the former, due to the small amount of data the correlation is not significant, and therefore a much lower and negative value appears.
Finally, the accuracy of the data, which gives information about the similarity between the low-cost sensor measurement and the reference sampler values, is calculated using the following Equation (2) [37,38]:
A % = 100 ( ( | ( S M ) | / M ) 100 )
where S is the average concentration obtained by the sensors throughout the testing period and M is the average concentration measured by the official air quality monitoring station during the testing period.
The value for PM2.5 was 80.4337 and for PM10 56.5942. Considering that it is a measure interpreted in percentages, these values indicate that for PM2.5 the sensors measure 80% with respect to the reference measures, while for PM10 the sensor’s accuracy is lower. Thus, in our case, the sensor’s accuracy is better when analyzing PM2.5 than PM10.
The results of the study are: (1) the HM-3301 sensor provides almost identical figures, with correlations with the reference sample being greater than 0.70 (VLS3 from Derenda); (2) all the measures show a quite high linearity against officially measured concentrations of PM2.5 and PM10; and (3) the data validation recorded directly at the three sensors increased the R 2 value. The results confirm that the use of this kind of low-cost sensors for PM2.5 and PM10 monitoring under certain environmental conditions is viable.

4. Discussion and Conclusions

The HM-3301 sensor has recently drawn attention due to its appearance and low cost for measuring PM mass concentration, which is frequently used as an indicator of air quality. Until now, this sensor has not been thoroughly evaluated in real-world conditions, and its data quality is not well documented. In this study, accurate monitoring of indoor and outdoor mass concentrations of particulate matter was achieved. The PM2.5 and PM10 assessed in our study are crucial for human health risk assessments. An IoT platform called SEnviro was used to provide Internet connection and transmit observations in real-time.
The low cost associated with these sensors, and the possibility of calibrating them for field use [23] are advantages for this new tool to reliably obtain continuous exposure estimates in broad areas. The results of this paper suggest that if such sensors are arranged indoors or outdoors, measurements are expected to be reasonably accurate and precise. The capacity to obtain detailed continuous exposure information from a large number of study participants may allow for additional insight into short-term exposures to respirable PM2.5 or PM10. Again, the applicability of the sensor for personal monitoring studies largely depends on whether the upper limit of detection might be exceeded. The validation performed between the HM-3301 sensor and the VLS3 reference sampler, according to EN12341:2014, demonstrated that the low-cost sensor measurements highly correlated with the reference measures, especially for PM2.5, where a very high accuracy value was found. In addition, in general, there was a positive relationship between the two types of measurements, which was adequately fitted through the LOESS model.
A limitation raised during the presented work, and especially in the outdoor environment, is that this study was limited to a relatively low number of days in which there were no substantial variations in environmental conditions (although there were several days of continuous rain). As noted in [26], we should be concerned about the data captured by this type of sensor when the relative humidity values are higher than 80% (following the technical parameters of the HM-3301 this value is 90%). For this reason, in future works meteorological parameters will be included in the statistical models. Another reason to utilize more comprehensive working periods is to evaluate long-term performance. Although the manufacturer claims a two-year lifespan in outdoor environments, this must be tested. A long working period can cause some problems for sensor response. One is the formation of films in the optical sensor lens. Alternatively, another issue could appear if the sensor is located in high-concentration environments where it will likely become saturated and will not capture the correct particulate values. Both limitations can be addressed using correction techniques on the results obtained [26].
As conclusions, the analyzed sensor (HM-3301) is valid to complement the regulatory networks of monitoring the outdoor (and indoor) PM and improve the spatial and temporal resolution of the data of PM2.5 and PM10. The low cost and the possibility for use outdoors are advantages for this new tool to reliably obtain continuous exposure estimates over more extensive areas such as large cities.
As future work, a more extended period of monitoring time is planned to cover a broader range of weather conditions and to test the long-term stability of the sensors. A follow-up study that will evaluate the sensor performance using at least a one-year time series is proposed and adding more low-cost sensors in a wide variety of different environmental conditions and pollution regimes. Another approach to take into account should focus on the question of whether and how other covariates could be included, for instance, how temperature or humidity can affect the sensor and measurements. These possibilities could reduce the possible limitations in this kind of sensor. The small size, low power requirements, and the ability for the HM-3301 sensor to be integrated into other monitoring devices such as GPS or mobile phones make this sensor a promising tool for personal monitoring studies and for providing data to support new research studies. Finally, emerging techniques on machine learning [39] will be explored to validate this kind of low-cost sensor.

Author Contributions

Conceptualization, A.B.V.; Data curation, P.J.; Formal analysis, P.J. and L.S.; Methodology, S.T., A.B.V., and L.S.; Project administration, S.T.; Resources, S.M.; Software, S.T.; Validation, P.J. and L.S.; Writing—original draft, S.T., A.B.V., P.J., and L.S.; Writing—review and editing, F.R. and S.M.

Funding

This work has been funded by the Generalitat Valenciana through the Subvenciones para la Realización de Proyectos de I+D+i Desarrollados por Grupos de Investigación Emergentes program (GV/2019/016). Sergio Trilles has been funded by the postdoctoral programme PINV2018, Universitat Jaume I (POSDOC-B/2018/12).

Conflicts of Interest

The authors declare no conflict of interest.

References

  1. Clancy, L.; Goodman, P.; Sinclair, H.; Dockery, D.W. Effect of air-pollution control on death rates in Dublin, Ireland: an intervention study. Lancet 2002, 360, 1210–1214. [Google Scholar] [CrossRef]
  2. Vedal, S.; Brauer, M.; White, R.; Petkau, J. Air pollution and daily mortality in a city with low levels of pollution. Environ. Health Perspect. 2003, 111, 45–52. [Google Scholar] [CrossRef] [PubMed] [Green Version]
  3. Kampa, M.; Castanas, E. Human health effects of air pollution. Environ. Pollut. 2008, 151, 362–367. [Google Scholar] [CrossRef]
  4. Torres, P.; Ferreira, J.; Monteiro, A.; Costa, S.; Pereira, M.C.; Madureira, J.; Mendes, A.; Teixeira, J.P. Air pollution: A public health approach for Portugal. Sci. Total. Environ. 2018, 643, 1041–1053. [Google Scholar] [CrossRef] [PubMed]
  5. Bayat, R.; Ashrafi, K.; Motlagh, M.S.; Hassanvand, M.S.; Daroudi, R.; Fink, G.; Künzli, N. Health impact and related cost of ambient air pollution in Tehran. Environ. Res. 2019, 176, 108547. [Google Scholar] [CrossRef]
  6. Kim, J.S.; Chen, Z.; Alderete, T.L.; Toledo-Corral, C.; Lurmann, F.; Berhane, K.; Gilliland, F.D. Associations of air pollution, obesity and cardiometabolic health in young adults: The Meta-AIR study. Environ. Int. 2019, 133, 105180. [Google Scholar] [CrossRef]
  7. Vicente, A.B.; Juan, P.; Meseguer, S.; Serra, L.; Trilles, S. Air Quality Trend of PM10. Statistical Models for Assessing the Air Quality Impact of Environmental Policies. Sustainability 2019, 11, 5857. [Google Scholar] [CrossRef] [Green Version]
  8. Unal, Y.; Toros, H.; Deniz, A.; Incecik, S. Influence of meteorological factors and emission sources on spatial and temporal variations of PM10 concentrations in Istanbul metropolitan area. Atmos. Environ. 2011, 45, 5504–5513. [Google Scholar] [CrossRef]
  9. European Parliament and Council of the European Union. Directive 2008/50/EC of the European Parliament and of the Council of 21 May 2008 on ambient air quality and cleaner air for Europe; European Unions: Brussels, Belgium, 2008. [Google Scholar]
  10. European Parliament and Council of the European Union. Commission Directive (EU) 2015/1480 of 28 August 2015 Amending Several Annexes to Directives 2004/107/EC and 2008/50/EC of the European Parliament and of the Council Laying Down the Rules Concerning Reference Methods, Data Validation and Location of Sampling Points for the Assessment of Ambient air Quality; European Unions: Brussels, Belgium, 2015. [Google Scholar]
  11. Degbelo, A.; Granell, C.; Trilles, S.; Bhattacharya, D.; Casteleyn, S.; Kray, C. Opening up smart cities: citizen-centric challenges and opportunities from GIScience. ISPRS Int. J. -Geo-Inf. 2016, 5, 16. [Google Scholar] [CrossRef] [Green Version]
  12. Castell, N.; Dauge, F.R.; Schneider, P.; Vogt, M.; Lerner, U.; Fishbain, B.; Broday, D.; Bartonova, A. Can commercial low-cost sensor platforms contribute to air quality monitoring and exposure estimates? Environ. Int. 2017, 99, 293–302. [Google Scholar] [CrossRef]
  13. Hahn, D.W. Light Scattering Theory; Department of Mechanical and Aerospace Engineering, University of Florida: Gainesville, FL, USA, 2009. [Google Scholar]
  14. Götschi, T.; Oglesby, L.; Mathys, P.; Monn, C.; Manalis, N.; Koistinen, K.; Jantunen, M.; Hänninen, O.; Polanska, L.; Künzli, N. Comparison of black smoke and PM2.5 levels in indoor and outdoor environments of four European cities. Environ. Sci. Technol. 2002, 36, 1191–1197. [Google Scholar] [CrossRef] [PubMed]
  15. Zikova, N.; Masiol, M.; Chalupa, D.; Rich, D.; Ferro, A.; Hopke, P. Estimating hourly concentrations of PM2.5 across a metropolitan area using low-cost particle monitors. Sensors 2017, 17, 1922. [Google Scholar] [CrossRef] [PubMed] [Green Version]
  16. Le, K.; Tingey, K.; Becnel, T.; Giallardon, P.; Butterfield, T. Building Air Quality Sensors & Inspiring Citizen Scientists. Chem. Eng. Educ. 2018, 52, 193–201. [Google Scholar]
  17. Sharp GP2Y1010AU0F. Available online: https://www.sparkfun.com/datasheets/Sensors/gp2y1010au_e.pdf (accessed on 5 November 2019).
  18. PM3007. Available online: http://www.gassensor.com.cn/product_detail_en/Particle_Sensor/PM3007 (accessed on 5 November 2019).
  19. PMS 1003. Available online: https://aqicn.org/sensor/pms1003/es/ (accessed on 5 November 2019).
  20. Particle Sensor Unit—PPD42NJ. Available online: https://www.shinyei.co.jp/stc/eng/products/optical/ppd42nj.html (accessed on 5 November 2019).
  21. Nova SDS011. Available online: http://www.inovafitness.com/en/a/chanpinzhongxin/95.html (accessed on 5 November 2019).
  22. HM3301. Available online: https://www.seeedstudio.com/Grove-Laser-PM2-5-Sensor-HM3301.html (accessed on 5 November 2019).
  23. Trilles, S.; Calia, A.; Belmonte, Ó.; Torres-Sospedra, J.; Montoliu, R.; Huerta, J. Deployment of an open sensorized platform in a smart city context. Future Gener. Comput. Syst. 2017, 76, 221–233. [Google Scholar] [CrossRef]
  24. Mukherjee, A.; Stanton, L.; Graham, A.; Roberts, P. Assessing the utility of low-cost particulate matter sensors over a 12-week period in the Cuyama valley of California. Sensors 2017, 17, 1805. [Google Scholar] [CrossRef] [Green Version]
  25. Genikomsakis, K.N.; Galatoulas, N.F.; Dallas, P.I.; Candanedo Ibarra, L.; Margaritis, D.; Ioakimidis, C.S. Development and On-Field testing of Low-Cost portable system for monitoring PM2.5 concentrations. Sensors 2018, 18, 1056. [Google Scholar] [CrossRef] [Green Version]
  26. Liu, H.Y.; Schneider, P.; Haugen, R.; Vogt, M. Performance assessment of a low-cost PM2.5 sensor for a near four-month period in Oslo, Norway. Atmosphere 2019, 10, 41. [Google Scholar] [CrossRef] [Green Version]
  27. Trilles, S.; Luján, A.; Belmonte, Ó.; Montoliu, R.; Torres-Sospedra, J.; Huerta, J. SEnviro: A sensorized platform proposal using open hardware and open standards. Sensors 2015, 15, 5555–5582. [Google Scholar] [CrossRef] [Green Version]
  28. Universitat Jaume I University. Available online: http://www.uji.e (accessed on 26 Novermber 2019).
  29. Trilles, S.; González-Pérez, A.; Huerta, J. A Comprehensive IoT Node Proposal Using Open Hardware. A Smart Farming Use Case to Monitor Vineyards. Electronics 2018, 7, 419. [Google Scholar] [CrossRef] [Green Version]
  30. Trilles Oliver, S.; González-Pérez, A.; Huerta Guijarro, J. Adapting Models to Warn Fungal Diseases in Vineyards Using In-Field Internet of Things (IoT) Nodes. Sustainability 2019, 11, 416. [Google Scholar] [CrossRef] [Green Version]
  31. Oliver, S.T.; González-Pérez, A.; Guijarro, J.H. An IoT proposal for monitoring vineyards called SEnviro for agriculture. In Proceedings of the 8th International Conference on the Internet of Things, Santa Barbara, CA, USA, 15–18 October 2018; p. 20. [Google Scholar]
  32. Particle Boron Microcontroller. Available online: https://docs.particle.io/datasheets/cellular/boron-datasheet/ (accessed on 5 November 2019).
  33. Vicente, A.; Juan, P.; Meseguer, S.; Díaz-Avalos, C.; Serra, L. Variability of PM10 in industrialized-urban areas. New coefficients to establish significant differences between sampling points. Environ. Pollut. 2018, 234, 969–978. [Google Scholar] [CrossRef] [PubMed]
  34. Archontoulis, S.V.; Miguez, F.E. Nonlinear regression models and applications in agricultural research. Agron. J. 2015, 107, 786–798. [Google Scholar] [CrossRef] [Green Version]
  35. Patón, D.; Andréu, E.; Morales, T.; Degollada, E.; Amigó, N.; Martín, C.; Molina, C.; Pajuelo, P. Análisis comparado de modelos GAM, GLM y LOESS para la determinación de mapas de distribución en cetáceos. In Proceedings of the X Congreso de la SEC (Sociedad Española de Cetáceos), Valencia, Spain, 29–30 September 2017. [Google Scholar]
  36. Trilles, S. Particulate Matter Observations Using HM-3301 Low-cost Sensor; Zenodo: Geneva, Switzerland, 13 November 2019. [Google Scholar] [CrossRef]
  37. Polidori, A.; Papapostolou, V.; Zhang, H. Laboratory Evaluation of Low-Cost Air Quality Sensors; South Coast Air Quality Management District: Diamondbar, CA, USA, 2016.
  38. Papapostolou, V.; Zhang, H.; Feenstra, B.J.; Polidori, A. Development of an environmental chamber for evaluating the performance of low-cost air quality sensors under controlled conditions. Atmos. Environ. 2017, 171, 82–90. [Google Scholar] [CrossRef]
  39. Zimmerman, N.; Presto, A.A.; Kumar, S.P.; Gu, J.; Hauryliuk, A.; Robinson, E.S.; Robinson, A.L.; Subramanian, R. A machine learning calibration model using random forests to improve sensor performance for lower-cost air quality monitoring. Atmos. Meas. Tech. 2018, 11, 291–313. [Google Scholar] [CrossRef] [Green Version]
Figure 1. The 3D printed enclosure of the particulate matter (PM) sensor.
Sustainability 11 07220 g001
Figure 2. HM-3301 PM sensor.
Sustainability 11 07220 g002
Figure 3. Graphical representation of how the HM-3301 PM sensor works.
Sustainability 11 07220 g003
Figure 4. LVS3 Reference sampler parts. Source: https://bit.ly/350yNTQ.
Sustainability 11 07220 g004
Figure 5. The indoor environment.
Sustainability 11 07220 g005
Figure 6. The outdoor environment.
Sustainability 11 07220 g006
Figure 7. Low-cost sensor data.
Sustainability 11 07220 g007
Figure 8. LVS3 vs. HM-3301 sensor points, PM2.5–PM10.
Sustainability 11 07220 g008
Figure 9. Models of PM2.5 and PM10 of indoor and outdoor enviroments.
Sustainability 11 07220 g009
Figure 10. Locally Estimated Scatterplot Smoothing model (LOESS) for PM2.5 vs. PM10 of the HM-3301 sensor.
Sustainability 11 07220 g010
Figure 11. Models of PM2.5.
Sustainability 11 07220 g011
Figure 12. Models of PM10.
Sustainability 11 07220 g012
Table 1. Technical parameters of the HM-3301 PM sensor.
FeatureTechnical Parameters
Range 1 500 μ g/m 3 (effective range), 1000 μ g/m 3 (maximum range)
Particle size 0.3 μ m, 0.5 μ m, 1.0 μ m, 2.5 μ m, 5 μ m, 10 μ m
Output valuePM1, PM2.5, PM10, TSP concentration ( μ μ g/m 3 , number of particles ( o n e / 0.1 L )
ResolutionConcentration: 1 μ g/m 3 , counting concentration: 1 s/0.1 L
Consistency 0 100 μ g/m 3 :±10 μ g/m 3 @ 25, 50% RH
100 500 μ g/m 3 : ± 10 μ g/m 3 @ 25, 50% RH
Stability time30 s after power on
SensitivityRefresh data once every second
Supply voltage D C 5 V ± 3 %
Operating currentAverage operating current < 75 mA, peak current < 120 mA
Communication InterfaceUART, I2C optional
Conditions of Use 10 60 C, 10 % 90 % RH (non-condensing)
LifeNot less than 2 years of indoor environment use
Standards followedISO 14644-1 and FS209E
Dimension 40 × 38 × 15 mm
Price27.15 euros
Table 2. Technical parameters of the LVS3 reference sampler.
FeatureTechnical Parameters
Flow rate1.0 … 3.5 m 3 (Nm 3 /h)
Particle size 2.5 μ m, 10 μ m
Power consumption240 VA
Filter diameter47 mm
Dimensionswidth 300 mm; height 450 mm; depth 250 mm
Weight17 kg
SensitivityRefresh data once every 1 s
Noise level<31 dB(A)
Operating temperature range 30 , + 50 C
Operating humidity range 0 100 r H
PriceApproximately 15,000 euros
Table 3. Reference sampler data in outdoor and indoor environments.
(a) PM2.5 Value(b) PM10 Value
DateEnvironmentPM2.5 ( μ g/m 3 )DateEnvironmentPM10 ( μ g/m 3 )
25/09/2019Indoor4.883016/10/2019Outdoor17.0293
16/10/2019Outdoor13.863516/10/2019Outdoor28.0802
17/10/2019Outdoor16.821017/10/2019Outdoor25.9058
18/10/2019Outdoor16.814918/10/2019Outdoor31.8846
21/10/2019Outdoor9.226319/10/2019Outdoor29.7107
25/09/2019Indoor4.883020/10/2019Outdoor9.7831
31/10/2019Indoor9.582721/10/2019Outdoor19.7475
05/11/2019Indoor2.894131/10/2019Indoor2.3509
07/11/2019Indoor0.542507/11/2019Indoor0.7230
09/11/2019Indoor1.446909/11/2019Indoor4.3386
11/11/2019Indoor2.710611/11/2019Indoor2.1701

