Impact of Land Use/Land Cover Change on Hydrological Components in Chongwe River Catchment


Department of Environmental Engineering, The Copperbelt University, Kitwe 50100, Zambia
*
Author to whom correspondence should be addressed.
Sustainability 2019, 11(22), 6415; https://doi.org/10.3390/su11226415
Submission received: 7 October 2019
/
Revised: 7 November 2019
/
Accepted: 11 November 2019
/
Published: 14 November 2019
(This article belongs to the Special Issue Sustainable Water Resources Management for Disaster Risk Reduction)
Abstract
:Chongwe River Catchment, a sub-catchment of the Zambezi River Basin, has been experiencing changes in land use/land cover (LULC) and in its hydrology. This study aims to assess the impact of LULC changes on the catchment’s hydrological components such as streamflow, evapotranspiration and water abstractions. LULC change data, detected from the 1984, 1994, 2014 and 2017 USGS Landsat imagery using a maximum likelihood supervised classifier, were integrated into the WEAP Model along with soil, slope and hydro–climate data. The results showed that between 1984 and 2017 built-up area increased by 382.77% at 6.97 km2/year, irrigated agriculture increased by 745.62% at 1.70 km2/year, rainfed farms/ranch/grassland increased by 14.67% at 14.53 km2/year, forest land decreased by 41.11% at 22.33 km2/year and waterbodies decreased by 73.95% at 0.87 km2/year. Streamflow increased at a rate of 0.13 Mm3 per annum in the wet seasons and showed a high variation with flow volume of 79.68 Mm3 in February and 1.01 Mm3 in September. Annual actual evapotranspiration decreased from 840.6 mm to 796.3 mm while annual water abstraction increased from 8.94 mm to 23.2 mm from the year 1984 to 2017. The pattern of LULC change between 1984 and 2017 has negatively impacted the hydrology of the Chongwe River Catchment. From these findings, an integrated catchment management and protection approach is proposed to mitigate the negative impacts of LULC dynamics on hydrological components in the Chongwe River Catchment.
1. Introduction
1.1. Background
Land and natural resources are fundamental components of the ecosystem of a catchment that provide socio-economic and ecological functions to people [1]. Over the years, there have been changes in land use/land cover (LULC) at local, regional and global levels resulting from natural and anthropogenic activities and leading to changes in hydrological components [2]. Land cover is the biophysical state of the Earth’s surface and its upper subsurface, whereas land use is the utilization, human inputs and management levels on the Earth’s surface. Land use, driven by production and consumption dynamics closely tied to social, political and economic activities, leads to land cover modification. Land use affects land cover and changes in land cover affect land use [3]. One of the most noticeable effects of the modifications of terrestrial ecosystems by human activity is LULC change and its impact on the environment locally, regionally and globally [4].
It has been observed that over time, land cover takes certain changes that influence the topography, distribution of soil and ecology resulting in changes in the hydrological characteristics and processes [5,6]. LULC change is also known to modify the underlying mechanisms that transfer rainfall to water yield through altering an ecosystem’s hydrological characteristics such as infiltration, evapotranspiration, and groundwater recharge capacity [7]. Understanding the impact of LULC change on watershed hydrology at catchment level could help to (i) identify and alleviate the occurrence of critical shifts in hydrologic processes, (ii) assess the water resources availability and their sustainable utilization under increasing population, agricultural expansion, and industrialization, and (iii) formulate appropriate policies to improve land use planning and spatial developments [8,9,10]. In this regard, direct field observations and spatial–temporal analysis of LULC change from remote sensing data play a crucial role in providing historical and current information to understand the effects on river ecosystem, guide urban densification and limit unsustainable urban expansion at catchment level [11,12,13].
The Chongwe River Catchment, with a population of over 834,359 people, is a sub-catchment of the Zambezi River Basin [14,15], and has been experiencing changes in LULC influenced by the fast-growing population, infrastructure and social-economic developments particularly in Lusaka City [15,16,17]. About 45% of Lusaka City falls within the Chongwe River Catchment [16]. The majority of the people in the catchment depend on the Chongwe River and its main tributaries for their domestic, agriculture, industrial and socio-economic water needs. The demand for water has drastically increased and it is expected to increase even higher in the next 50 years given the increasing population and socio–economic development activities in the Chongwe River Catchment. These developments are welcome as they have the potential to improve the socio-economic wellbeing of the people in the catchment and surrounding areas. However, the changes in the LULC pattern induced by these developments and their impact on the natural environment appear to have negatively altered the hydrological components such as streamflow, evapotranspiration and water abstraction in the catchment [18]. Recently, the catchment has been experiencing an increase in water scarcity due to the drying up of the Chongwe River and some of its tributaries posing a high likelihood of deterioration of living conditions particularly among the vulnerable to water security [19].
The aim of this study is to analyze the spatial-temporal change of LULC and assess its impact on the hydrological components of Chongwe River Catchment between 1984 and 2017. This is achieved with the help of the USGS Landsat imagery for 1984, 1994, 2004 and 2017 classified and analyzed in ERDAS Imagine 2014, ArcGIS 10.3 and hydrological simulation under various LULC changes from years 1984 to 2017 in the water evaluation and planning (WEAP) model. The output of this research will contribute to the existing or assist build a new scientific knowledge base on the spatial-temporal change of LULC and its impact on the hydrology of the Chongwe River Catchment. This will benefit the water resource professionals, development planners, policymakers, researchers as well as the end-users in the community.
1.2. Study Area
The Chongwe River Catchment, covering an estimated area of 5168.66 km2, is located in Zambia between latitude 14°55′40″ to 15°43′19″ S and longitude 28°13′53″ to 29°21′24″ E as shown in Figure 1. The catchment covers parts of Lusaka, Chongwe, Chibombo, Chisamba, and Kafue Districts. It also covers 45% of Lusaka Metropolitan City [16]. The climate of Chongwe River Catchment is described as humid subtropical, with dry winters and hot summers. The warmer wet season starts in mid-September and extends through May. Precipitation peaks high in December and January at around 232 mm/month. The colder dry season is from June through August with little or no precipitation and long dry spells. Average maximum air temperatures peak in October around 32 °C, while the average minimum air temperature is 8.2 °C occurring in July [16].
The Chongwe River Catchment is divided into upper, middle and lower parts. The predominant land use in the upper and middle half is agriculture and livestock production. About 6.5 km2 (6500 ha) of land is now cultivated under a variety of irrigation schemes and methods in both large- and small-scale farming. The main crops grown are wheat, maize, beans, groundnut, cotton, vegetables, flowers, and horticultural crops. The other middle half is predominantly a built-up area. The lower part is mainly forest and bushland providing valuable habitat for wild animals and birds. Small scale river bank cultivation and fishing are common practices by the local community in the lower part of the catchment [16].
The vegetation of Chongwe River catchment is classified as Miombo woodland, dominated by semi-evergreen trees with a well-developed grass layer. The Zambezi Escarpment zone in the lower part of the catchment is predominantly Mopane woodland typically interspersed by patches of Munga woodland [16]. The dominant lithologies of the catchment are schists, quartzite and basement complex rocks (gneiss and granite mainly). The upper part of the catchment contains Metasedimentary Rocks of Katanga age intruded by granitic and basic bodies while the south–western half (Middle Chongwe) part has schists and carbonate rocks (mainly, dolomitic limestone and dolomites). The lower part making up the north–western half of the catchment (mainly the Zambezi Escarpment) is dominated by basement complex with quartzite’s and schists [16,19].
2. Data and Methods
2.1. Data
The data used in this study consisted of Landsat imagery for 1984, 1994, 2004 and 2017 freely obtained from the United States Geological Survey (USGS), shapefile of Chongwe River Catchment boundary, the 1:1 Million Soil Map of Zambia, and climate data from 1965 to 2017 obtained from the Zambia Meteorological Department, Global Weather Net and the Southern African Science Service Centre for Climate Change and Adaptive Land Management.
2.2. Methods
2.2.1. Detection and Analysis of Land Use Land Cover Change in the Chongwe River Catchment
Chongwe River Catchment was first clipped from the Landsat imagery of 1984, 1994, 2004 and 2017 using the shapefile of the catchment boundary. The clipped imageries were then subjected to a supervised classification process. Supervised classification relies on pattern recognition skills and prior experience and knowledge of the data to help the system to determine the statistical criteria (signatures) for data classification. Supervised classification requires prior information about the data. The classification was based on a predefined LULC classification scheme consisting of five classes namely irrigation land, forest, built-up, water bodies and rainfed farm/ranch/grassland. The scheme, described in Table 2, was based on field knowledge and the USGS Anderson Land Classification Scheme [21].
With the help of classes in Table 2, training sets were developed and spectral signatures from the specified areas were generated. These signatures were then used to classify the pixels using maximum likelihood (MLC) parametric decision rule. The MCL calculates a Bayesian probability function from the inputs for classes established from training sites. All these operations were performed using Earth Resource Development Assessment System (ERDAS) Imagine 2014 and ArcMap 10.3 [22,23] software packages. Figure 2 gives a summary of the data flow involved in the process of detecting LULC in this study.
The LULC classification accuracy was assessed using the Kappa coefficient, user’s, producer’s and overall accuracy. The change detection analysis was done in ArcGIS by comparing the 1984, 1994, 2014 and 2017 LULC images using matrix operation.
2.2.2. Simulation of Hydrological Components in WEAP Model
The streamflow was estimated from the WEAP Model simulation using climate data, LULC data obtained from Section 2.2.1, and soil texture, soil water holding capacities, soil horizon depth and conductivity [24] extracted from the 1:1 Million Soil Map of Zambia [16]. The climatic data inputs used in WEAP model were precipitation, temperature, relative humidity (RH), wind speed and solar radiation (Figures S1 and S2 Supplementary Materials). Solar radiation can be quantified in WEAP by entering solar radiation data or hours of sunshine per day or cloudiness fraction depending on data availability. Cloudiness fraction was available and is defined as the fraction of daytime hours with no clouds. It ranges from 0.0 (complete cloud) to 1.0 (no cloud). Evapotranspiration was simulated in the WEAP Model using average mean air temperature, relative humidity, average wind speed, and cloudiness fraction as input data. These climate data inputs are presented in Table 3. The time step for the WEAP model was based on the hydrological year of the region starting in the month of October and ending in September (Figure S3, Supplementary Materials).
The surface and groundwater abstractions were analyzed as in [16] using data obtained from the Water Resource Management Authority water permit database, satellite imagery, field assessments, Ministry of Agriculture, Lusaka Water and Sewerage Company, and the Groundwater Resources Management Support Programme database (Figure S4, Supplementary Materials). The use of hydrologic models offers the advantage of spatially mapping the patterns of hydrological consequences resulting from LULC changes and allows for the comparison of basin changes in hydrological components with basin-scale changes in Land use/Land cover [25].
The WEAP model was used in the estimation of the hydrological components of the water balance in Equation (1) using the climate, physical, and hydrologic inputs from the Chongwe River catchment. Equation (1) was used in the computation of the annual available water balance of the catchment.
where, P = precipitation (Mm3/year), = external inflow from other catchments (Mm3/year), ET = actual evapotranspiration (Mm3/year), = streamflow (Mm3/year), ABST = abstraction (Mm3/year), ΔS = change in storage (Mm3/year).
Performance of WEAP model results were obtained through calibration and validation using observed and simulated streamflow on a monthly and annual basis. The performance assessment was done using the coefficient of determination (R2), Nash–Sutcliffe model efficiency coefficient (NSE) and percentage bias (PBIAS).
3. Results and Discussion
3.1. Results
3.1.1. Land Use Land Cover Analysis and Classification Accuracy
The land use/land cover of the study area for the years 1984, 1994, 2014 and 2017 and the LULC change between 1984 and 2017 are presented in Table 4. It can be seen from the table that forest, land, and water bodies have decreased while built-up area, rainfed farm/ranch/grassland, and irrigated agriculture have increased in the study period. The LULC for the reference years are further shown in the bar graphs in Figure 3.
The LULC for the years 1984, 1994, 2014 and 2017 are visualized in Figure 4.
The above LULC results were adopted on the basis of the image classification accuracy assessment results given in Table 5 are given in terms of the producer’s accuracy, user’s accuracy, overall accuracy and the kappa coefficient for the years 1984, 1994, 2014 and 2017. The producer’s accuracy is derived by dividing the number of correct pixels in one class divided by the total number of pixels as derived from reference data. It measures how well a certain area has been classified. The user’s accuracy is derived by dividing the correct classified pixels in a class by the total number of pixels that were classified in that class. It measures the reliability of the map and therefore informs the user how well the map represents what is really on the ground.
3.1.2. WEAP Streamflow Variation at the Outlet of Chongwe River Catchment
The long-term streamflow at the outlet of the catchment was analyzed for a period of 33 years and its plot is shown in Figure 5. The plot reveals that the streamflow has been increasing at a rate of 0.13 million meter cubes per annum. The values for the hydro–climatic components of streamflow, evapotranspiration, water abstraction, precipitation and change in storage for the years 1983/84, 1993/94, 2014/15 and 2016/17 as obtained in the study by [16] are presented in Table 6. The estimated surface water and groundwater abstractions from all the demand nodes (water users) for the years 1983/84, 1993/94, 2003/04, 2014/15 and 2016/17 are presented in Table 7 and Table 8. The total estimated volume of water abstracted for the hydrological year 1983/84 was 46.09 Mm3 and for the year 2017 was 119. 87 Mm3.
3.1.3. Trend Analysis for Changes in Forest Land, Built-up Area from 1984 to 2017
Figure 6 shows the linear trend for forest land, built-up area, and the streamflow response during the period 1984 to 2017 (i.e., a period of 33 years). The result indicated that forest land has been decreasing at the rate of 10.893 km2/annum while built-up land has been increasing at a rate of 6.404 km2/annum.
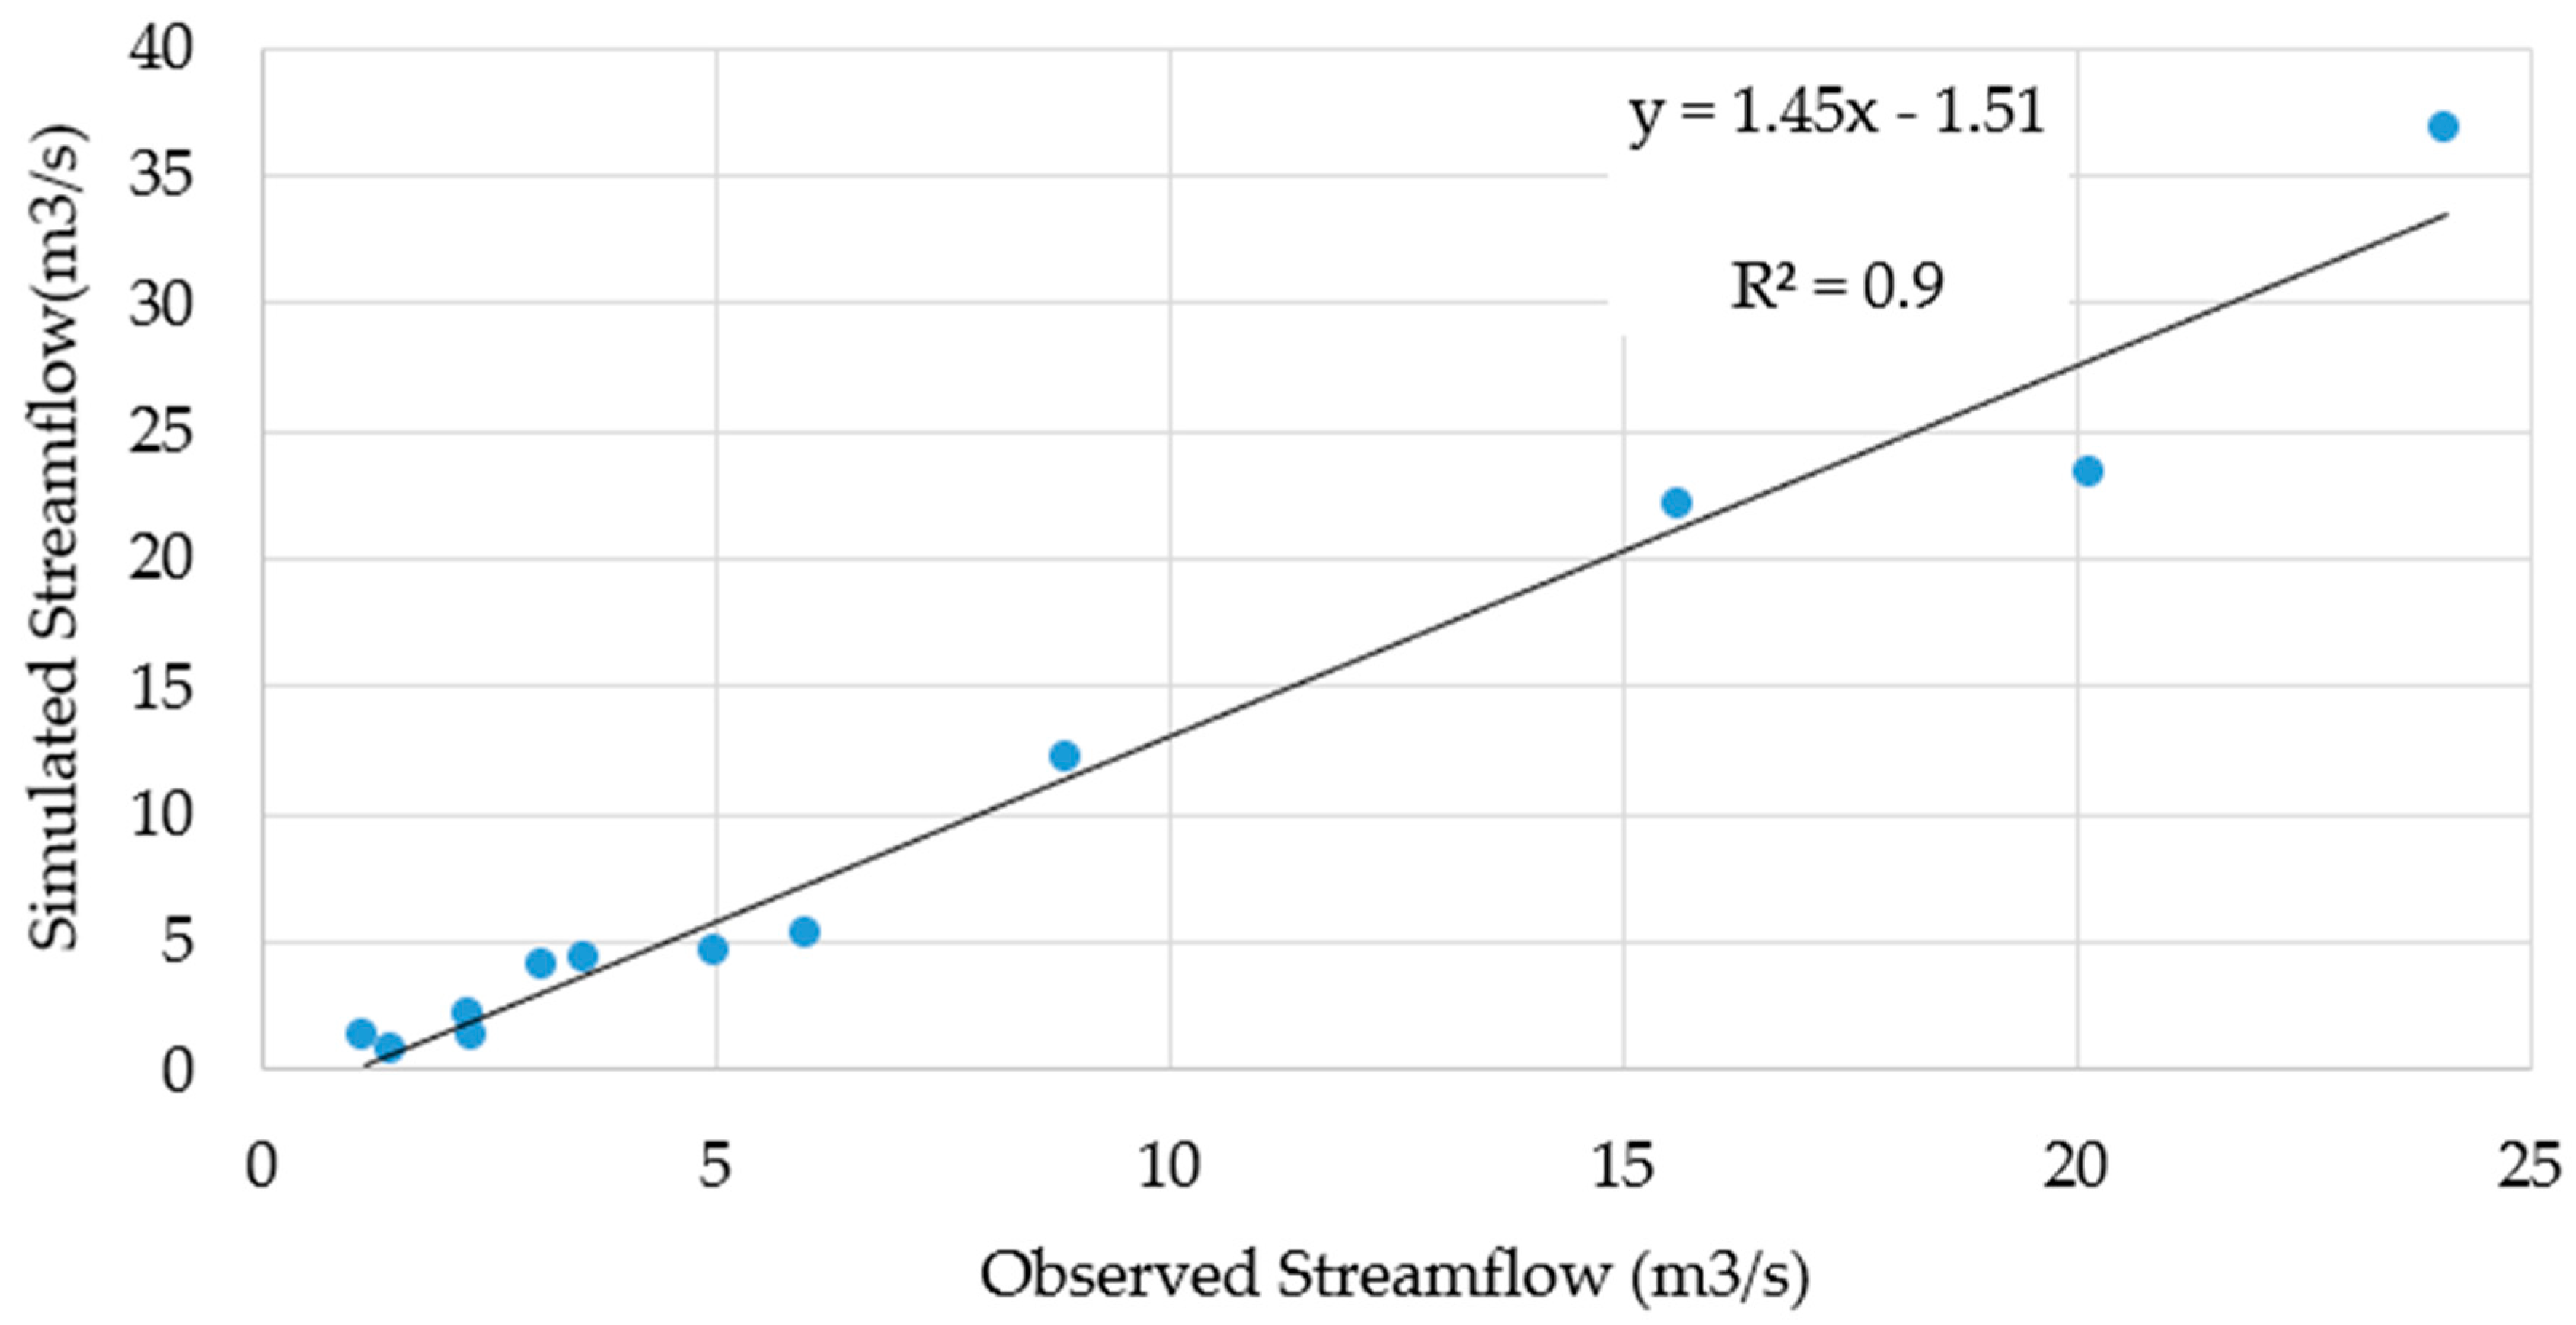
3.1.4. WEAP Model Performance
The WEAP model was calibrated using the observed streamflow data for the Chongwe Great East Road Bridge gauging station obtained from WARMA for a period from 1968 to 2017 hydrological year. Figure 7 shows the comparison of the observed average monthly streamflow and WEAP simulated average monthly streamflow. The simulated streamflow was calibrated and validated against observed streamflow on the average monthly basis for a period from 1982/1983 to 2016/2017 (Figure 8). The model fit was assessed using the coefficient of determination (R2), Nash–Sutcliffe model efficiency coefficient (NSE) and percentage bias (PBIAS) where an R2 of 0.97 shown in Figure 8, NSE of 0.64 and PBIAS of 25.89% were achieved.Computation of NSE and PBIAS are shown in Tables S1 and S2 under the Supplementary Materials.
3.2. Discussion
3.2.1. Land Use/Land Cover Change
As shown in Table 4 and Figure 3 in the year 1984, about 1.16% (60.1 km2) area was covered by the Built-up area, 34.67% (1792.20 km2) by forest land, 63.26% (3269.84 km2) by rainfed agriculture/pasture/grassland, 0.76% (39.04 km2) by water body and 0.15% (7.54 km2) by irrigated agriculture. By 2017, built-up area covered 5.6% (289.95 km2, forest land covered 20.42% (1055.40 km2), rainfed farm/ranch/grassland covered 72.55% (3749.40 km2), waterbodies covered 0.20% (10.17 km2) and irrigation land covered 1.23% (63.76 km2). Each LULC class has undergone significant changes and the description of each class is presented in (1)–(5).
(1) Built-up Area
The built-up area has been increasing at a rate of 6.97 km2/year between 1984 and 2017 representing a percentage change of 382.77% (or 4.45% of the total catchment area). The increase in the built-up area is mainly due to the radial expansion of Lusaka City the Capital of Zambia. This increase is expected to continue in the upper and middle part of the Chongwe River Catchment as the urbanization and the overall socio-economic development activities in Lusaka City, Chongwe and Chisamba Towns continue to increase.
(2) Forest Land
Forest land has been decreasing at 22.33 km2/year between 1984 and 2017 representing a percentage change of −41.11% (or −14.26% of the total catchment area). This reduction can be attributed to the conversion of forest land to built-up area and farmland as well as the high demand for forest products such as wood products and charcoal production. A study conducted by [26] revealed that Chongwe River Catchment supplied 36% of the consumption of Charcoal in Lusaka City. The increase in demand for forest products is a result of massive socio-economic activities and urbanization in the Chongwe River Catchment.
(3) Waterbodies
Waterbodies have been decreasing at 0.87 km2/year between 1984 and 2017 representing a decrease change of 73.95% (or 0.56% of the total catchment area). This reduction can be attributed to massive change from rainfed farming to irrigated farming by both commercial and small-scale farmers which has resulted in an increase in water abstraction. Over abstraction of water from natural bodies and wetlands leads to drying up the water bodies. In addition, some wetlands are converted to irrigated and residential areas. The reduction in the water bodies can also be attributed to deforestation, an increase in agricultural land and built-up area and reduced baseflow. Chongwe River shows high streamflow variability during the wet season and a drastic reduction in the dry season.
(4) Rainfed Farm/Ranch/Grassland
Rainfed farm/ranch/grassland has been increasing at 14.53 km2/year between 1984 and 2017 representing a percentage change of 14.67% (or 9.28% of the total catchment area). This increment is attributed to an increase in farming activities in the upper and middle parts of the Chongwe River Catchment. The farmland has been increasing at the expense of the reduction in forest land. Shifting cultivation and fallow are the common traditional farming practices in the catchment where farmland has been changed to grassland and vice versa.
(5) Irrigation Land
Irrigation agriculture has been increasing at 1.70 km2/year between 1984 and 2017 representing a percentage change of 745.62% (or 1.09% of the total catchment area). There is an increase of commercial and small-scale irrigation farmland on the upper and middle part of the Chongwe River Catchment. Based on the field observation, the increment of irrigation farm is associated with the development of commercial irrigation farms and socio-economic development activities in the catchment.
3.2.2. Hydrological Responses to Changes in Land Use/Land Cover
Streamflow responses; the increase in built-up area as well as the corresponding decrease in forest land has resulted in an increase in streamflow (Figure 6) in the Chongwe River Catchment during the wet season. Construction of buildings and road infrastructure increases the runoff coefficient, thereby increasing the rate of streamflow. In addition, the decrease in forest cover can reduce the infiltration capacity and increase the runoff coefficient characteristics of the catchment which leads to an increase in runoff. Streamflow is one of the most important hydrological components for the execution of water resource plans and models [27].
Evapotranspiration responses; There has been a decrease in actual evapotranspiration from 840.6 mm to 796.3 mm during the 33 years’ period agreeing with the findings of Gao and Qiu [28] and Tena et al [16]. This decrease can be partly attributed to the decrease of the area of Waterbodies from 39.04 km2 (during 1984) to 10.1 km2 (in 2017) as well as the decrease in Forest land. The decrease in forest land is known to lead to a decrease in the rate of transpiration, hence the decrease in evapotranspiration (Figure S5, Supplementary materials).
Water abstraction; responses; water abstraction increased from 8.94 mm to 23.2 mm as shown in Table 6. This increase is due to an increase in population, irrigation, domestic, livestock, and industry use [16]. The largest water abstractions in the Chongwe River Catchment are mainly for irrigation purposes [16,29]. It is expected that the quantity of water abstraction will increase due to an increase in the irrigation area.
4. Conclusions
This study set out to evaluate changes in catchment hydrological components such as streamflow/runoff, evapotranspiration and water abstraction as impacted by LULC changes. The WEAP model, ERDAS Imagine 14 and ArcGIS 10.3 were applied in this study. The findings indicate that the pattern of changes in LULC has adverse effects on the streamflow and evapotranspiration and available water resources in terms of abstraction. The study has also demonstrated the usefulness of the WEAP Model to successfully simulate the patterns of streamflow and other hydrological components in response to LULC change at catchment level, indicating that it is a useful tool for water resources management planning and catchment management.
Based on the findings of this study, sustainable integrated catchment management and protection measures are required to address the negative consequences of LULC dynamics on hydrological components such as streamflow and evapotranspiration in the Chongwe River Catchment. This could be achieved through (i) the participation of the local community and relevant institutions in the management and development of land resources (including conservation of forest and wetland), (ii) formulating and implementing land use management interventions essential for sustainable use of the land resources, and (iii) provision of reliable data on the extent and spatial distribution of the land to allocate appropriate land-use plan. In addition, implementation of water harvesting technologies such as dams, ponds, and groundwater recharge structures are important to harvest excess runoff in the wet season to help in overcoming the water deficit during the dry season. Implementation of integrated catchment management measures with the participation of water users, the community and water management institutions is important for the sustainability of socio–economic development activities in Chongwe River Catchment.
Supplementary Materials
The following are available online at https://www.mdpi.com/2071-1050/11/22/6415/s1, Figure S1:Average Monthly Precipitation for Chongwe River Catchment (1983 to 2017), Figure S2: Monthly Temperature variation for Chongwe River Catchment (1983 to 2017) obtained from WEAP, Figure S3: WEAP Model Years and Time Steps, Figure S4: WEAP Schematic Map Demand and Supply Nodes for Chongwe River Catchment, Figure S5: Annual actual evapotranspiration (ET), potential ET and precipitation for Chongwe River catchmen Table S1: Computation of Nash-Sutcliffe model efficiency coefficient (NSE), Table S2. Computation of Percentage bias (PBIAS).
Author Contributions
Conceptualization, T.M.T.; methodology, T.M.T., P.M., A.N.; software, T.M.T, A.N.; validation, T.M.T., P.M., A.N.; formal analysis, T.M.T., P.M., A.N.; investigation, T.M.T.; resources, T.M.T., P.M., A.N.; data curation, T.M.T.; writing—original draft preparation, T.M.T.; writing—review and editing, T.M.T., P.M., A.N.; visualization, T.M.T., P.M., A.N.; supervision, P.M., A.N.; project administration, T.M.T.; funding acquisition, T.M.T., P.M., A.N.
Funding
The APC was funded by the Copperbelt University Centre of Excellence in Sustainable mining.
Acknowledgments
The authors want to acknowledge the support from Copperbelt University Africa Center of Excellence in Sustainable Mining (CBU-ACESM) and Water Resources Management Authority of Zambia (WARMA). The authors acknowledge Stockholm Environment Institute(SEI) for the provision of Water Evaluation And Planning" system (WEAP) software.
Conflicts of Interest
The authors declare no conflict of interest.
References
- Gessesse, B.; Bewket, W.; Bräuning, A. Model-based characterization and monitoring of runoff and Soil erosion in response to land use/Hydrological components changes in the modjo watershed, Ethiopia. Land Degrad. Dev. 2015, 26, 711–724. [Google Scholar] [CrossRef]
- Woldesenbet, T.A.; Elagib, N.A.; Ribbe, L.; Heinrich, J. Hydrological responses to land use/cover changes in the source region of the Upper Blue Nile Basin, Ethiopia. Sci. Total Environ. 2017, 575, 724–741. [Google Scholar] [CrossRef] [PubMed]
- Rawat, S.M.; Kumar, M. Monitoring land use/cover change using remote sensing and GIS techniques: A case study of Hawalbagh block, district Almora, Uttarakhand, India. Egypt. J. Remote Sens. Space Sci. 2015, 18, 77–84. [Google Scholar] [CrossRef]
- Weng, Q.; Liu, H.; Lu, D. Assessing the effects of land use and land cover patterns on thermal conditions using landscape metrics in city of Indianapolis, United States. Urban Ecosyst. 2007, 10, 203–219. [Google Scholar] [CrossRef]
- Hu, Q.; Willson, G.D.; Chen, X.; Akyuz, A. Effects of Climate and Landcover Change on Stream Discharge in the Ozark Highlands, USA. Environ. Model. Assess. 2005, 10, 9–19. [Google Scholar] [CrossRef]
- Awotwi, A.; Yeboah, F.; Kumi, M. Assessing the impact of land cover changes on water balance components of White Volta Basin in West Africa. Water Environ. J. 2014, 29, 259–267. [Google Scholar] [CrossRef]
- Li, S.; Hong Yang, H.; Lacay, M.; Liu, J.; Lei, G. Impacts of Land-Use and Land-Cover Changes on Water Yield: A Case Study in Jing-Jin-Ji, China. Sustainability 2018, 10, 960. [Google Scholar] [CrossRef]
- Puno, R.C.C.; Puno, G.R.; Talisay, B.A.M. Hydrologic responses of watershed assessment to land cover and climate change using soil and water assessment tool model. Glob. J. Environ. Sci. Manag. 2019, 5, 71–82. [Google Scholar]
- Al-Bakri, J.; Salahat, M.; Suleiman, A.; Suifan, M.; Hamdan, M.; Khresat, S.; Kandakji, T. Impact of climate and land use changes on water and food security in Jordan: Implications for transcending “the tragedy of the commons. Sustainability 2013, 5, 724–748. [Google Scholar] [CrossRef]
- Forkuor, G.; Cofie, O. Dynamics of land-use and land-cover change in Freetown, Sierra Leone and its effects on urban and peri-urban agriculture—A remote sensing approach. Int. J. Remote Sens. 2011, 32, 1017–1037. [Google Scholar] [CrossRef]
- Ayivor, J.S.; Gorden, C. Impact of Land Use on River Systems in Ghana. West Afr. J. Appl. Ecol. 2012, 20, 83–95. [Google Scholar]
- Sohl, T.; Sleeter, B. Role of Remote Sensing for land-use and land-cover change modelling. In Remote Sensing and Land Cover: Principles and Applications; Chandra, G., Ed.; Taylor and Francis CRC Press: Boca Raton, FL, USA, 2012; pp. 225–240. [Google Scholar]
- Akubia, J.E.K.; Bruns, A. Unravelling the Frontiers of Urban Growth: Spatio-Temporal Dynamics of Land-Use Change and Urban Expansion in Greater Accra Metropolitan Area, Ghana. Land 2019, 8, 131. [Google Scholar] [CrossRef]
- WARMA. Water Resources Management Report; Water Resources Management Authority (WARMA): Lusaka, Zambia, 2015. [Google Scholar]
- Lesolle, D. SADC Policy Paper on Climate Change: Assessing the Policy Options for SADC Member States; SADC Secretariat, Policy, Planning; Resource Mobilisation Directorate: Gaborone, Botswana, 2012.
- Tena, T.M.; Mwaanga, P.; Nguvulu, A. Hydrological Modelling and Water Resources Assessment of Chongwe River Catchment using WEAP Model. Water 2019, 11, 839. [Google Scholar] [CrossRef]
- CSO. 2010 Census of Population and Housing; Lusaka Province Analytical Report; Central Statistics Office (CSO): Lusaka, Zambia, 2014.
- Wagner, P.D.; Kumar, S.; Schneider, K. An assessment of land use change impacts on the water resources of the Mula and Mutha Rivers catchment upstream of Pune, India. Hydrol. Earth Syst. Sci. 2013, 17, 2233–2246. [Google Scholar] [CrossRef]
- Nick, A. The Chongwe Catchment: A Hydrological, Hydrogeological and Hydrochemical Characterization for the Establishment of a Catchment Management Plan; Ministry of Energy and Water Development: Lusaka, Zambia, 2015.
- YEC-Yachiyo Engineering Co. Ltd. Study Report on National Water Resources Master Plan in the Republic of Zambia; Japan International Cooperation Agency and Ministry of Energy and Water Development: Lusaka, Zambia, 1995; Volume 1.
- Anderson, J.R.; Hardy, E.E.; Roach, J.T.; Richard, E.; Witmer, R.E. A Land Use and Land Cover Classification System for Use with Remote Sensor Data; Geological Survey Professional Paper 964; U.S. Government Printing Office: Washington, DC, USA, 1976.
- Hexagon Geospatial, Madison, United States of America. Available online: www.erdas.com (accessed on 19 November 2016).
- Esri, Redlands, California. Available online: www.esri.com (accessed on 8 February 2017).
- SEI. WEAP Tutorial; Stockholm Environment Institute: Somerville, MA, USA, 2016.
- Gyamfi, C.; Ndambuki, J.M.; Salim, R.W. Hydrological Responses to Land Use/Cover Changes in the Olifants Basin, South Africa. Water 2016, 8, 588. [Google Scholar] [CrossRef]
- Hibajene, S.H.; Ellegard, A. Charcoal Transportation and Distribution: A study of the Lusaka Market; Energy, Environment and Development Series; Stockholm Environment Institute: Stockholm, Sweden, 1994; Volume 33, p. 30. [Google Scholar]
- Wen-Cheng, H.; Yang, F.-T. Stream Flow Estimation Using Kriging. Water Resour. Res. 1998, 34, 1599–1608. [Google Scholar]
- Gao, J.; Qiao, M.; Qiu, X.; Zeng, Y.; Hua, H.; Ye, X.; Adamu, M. Estimation of Actual Evapotranspiration Distribution in the Huaihe River Upstream Basin Based on the Generalized Complementary Principle. Adv. Meteorol. Hindawi 2018, 2018, 2158168. [Google Scholar] [CrossRef]
- Mayerhofer, C.; Shamboko, B.; Mweene, R. Development of Groundwater Information and Management Program for Lusaka Groundwater Systems, Report No. 4—Survey on Commercial Farmers and Major Industries; Department of Water Affairs (Zambia): Lusaka, Zambia; Federal Institute of Geosciences and Natural Resources (Germany): Lusaka, Zambia, 2010.
Figure 1.
Location map of Chongwe River Catchment (modified after [16]).
Figure 1.
Location map of Chongwe River Catchment (modified after [16]).
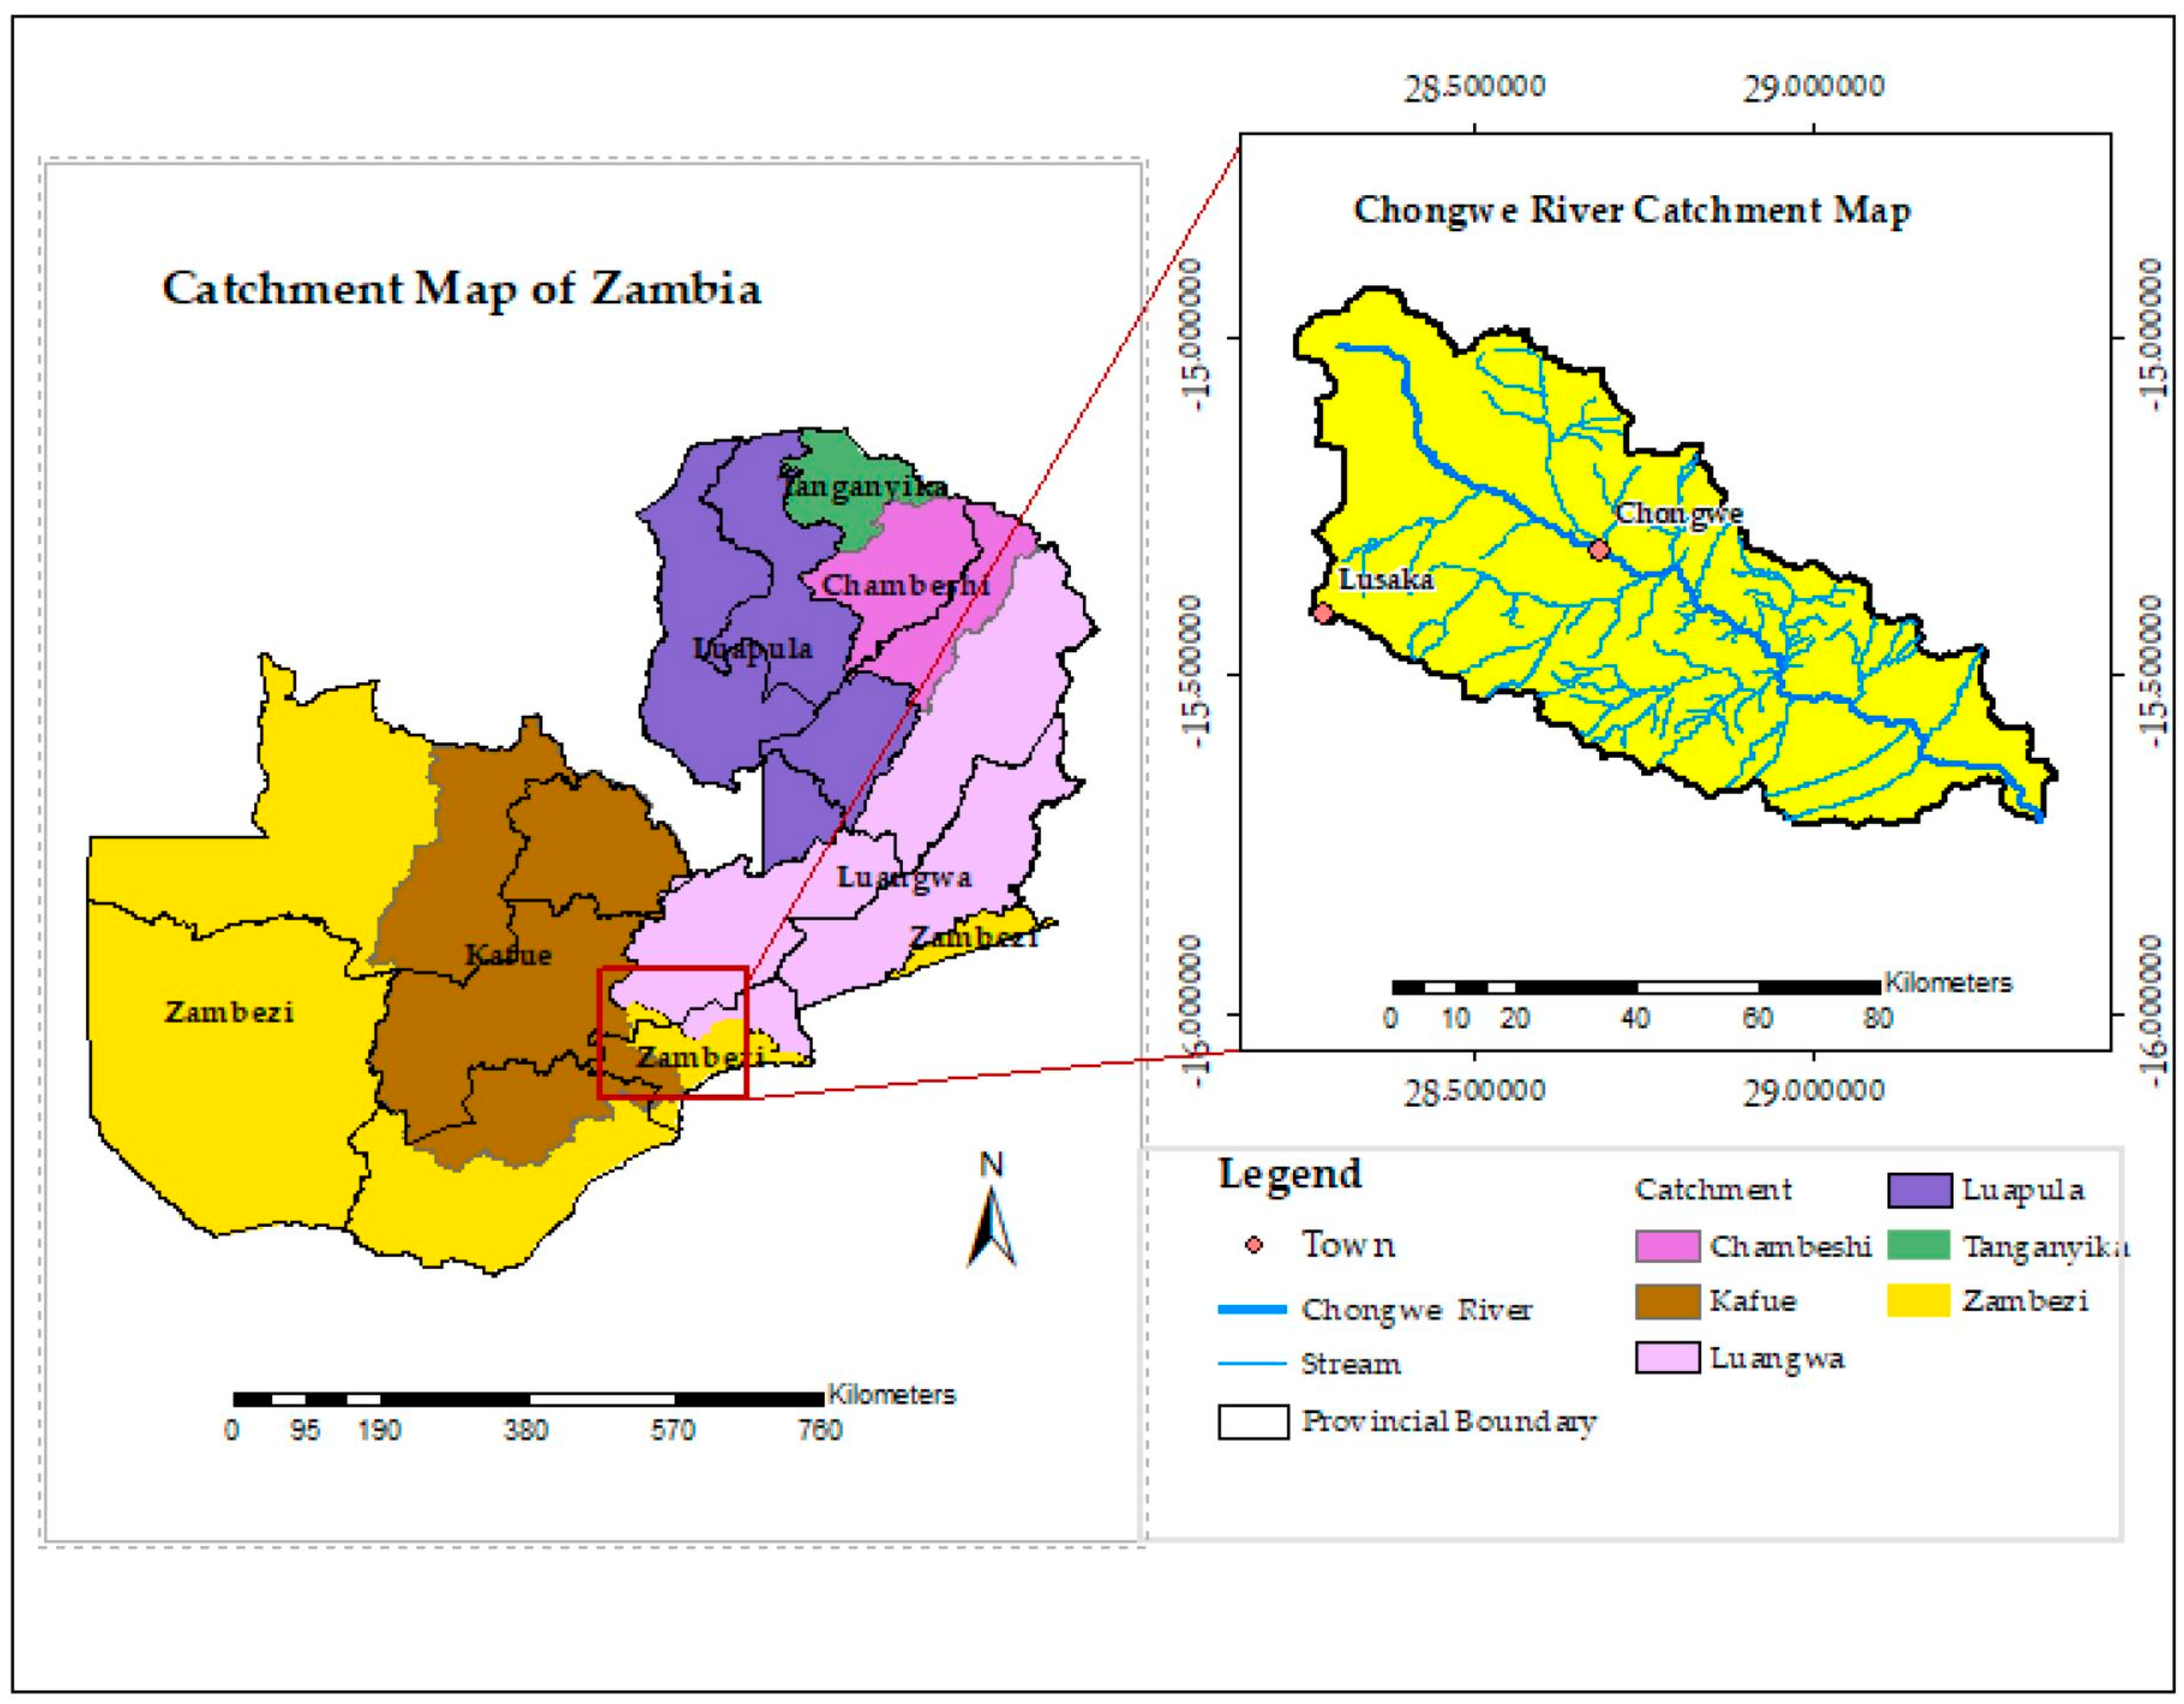
Figure 2.
Flowchart for land use/land cover map analysis of Chongwe River catchment.
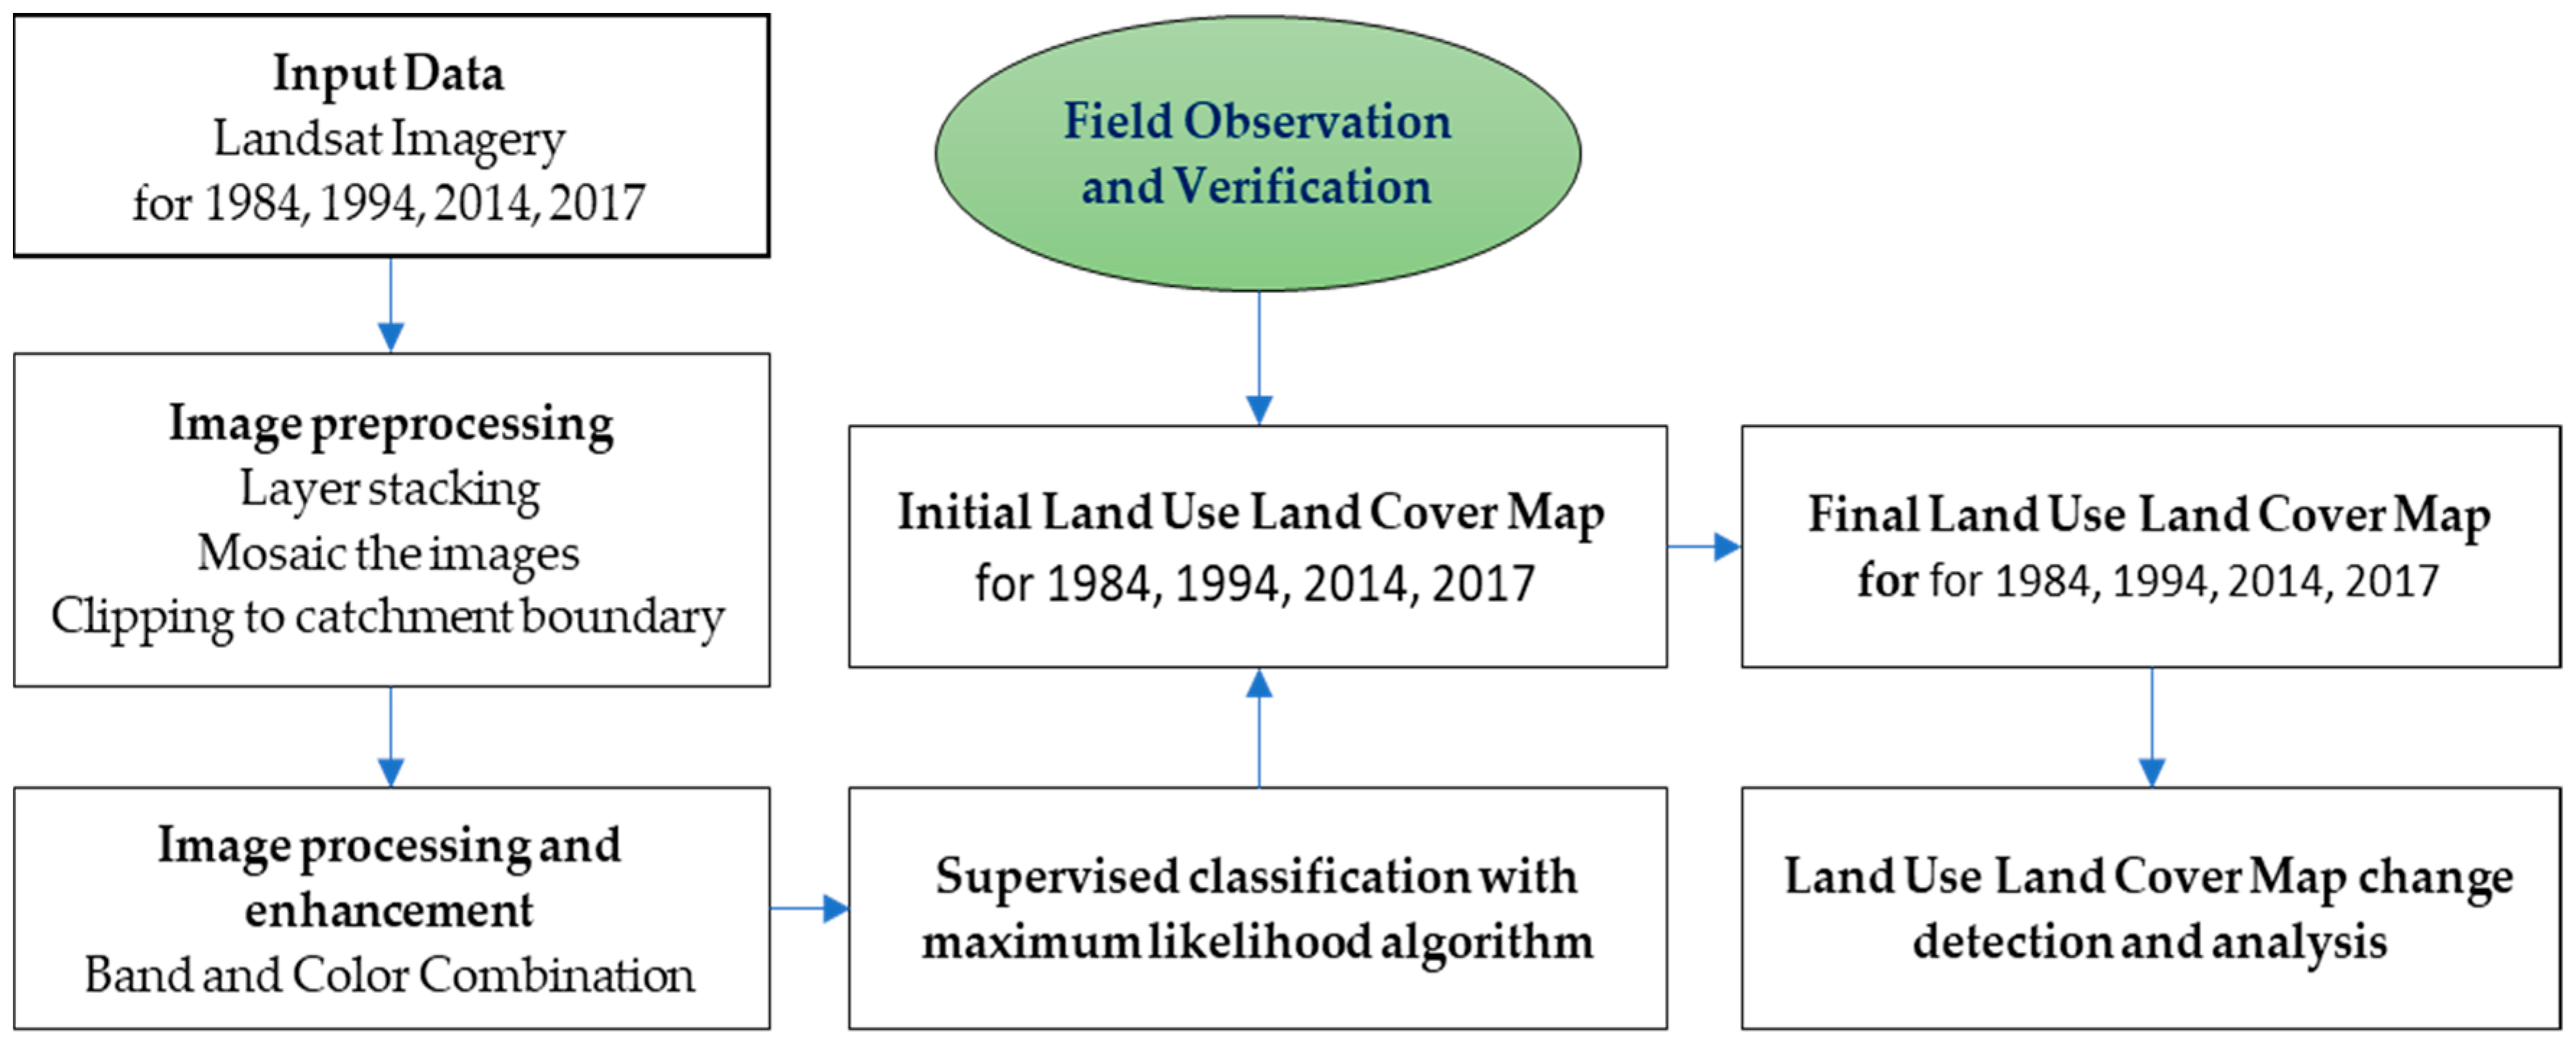
Figure 3.
Land use/land cover bar chart of Chongwe River Catchment for the years 1984, 1994, 2014 and 2017.
Figure 3.
Land use/land cover bar chart of Chongwe River Catchment for the years 1984, 1994, 2014 and 2017.
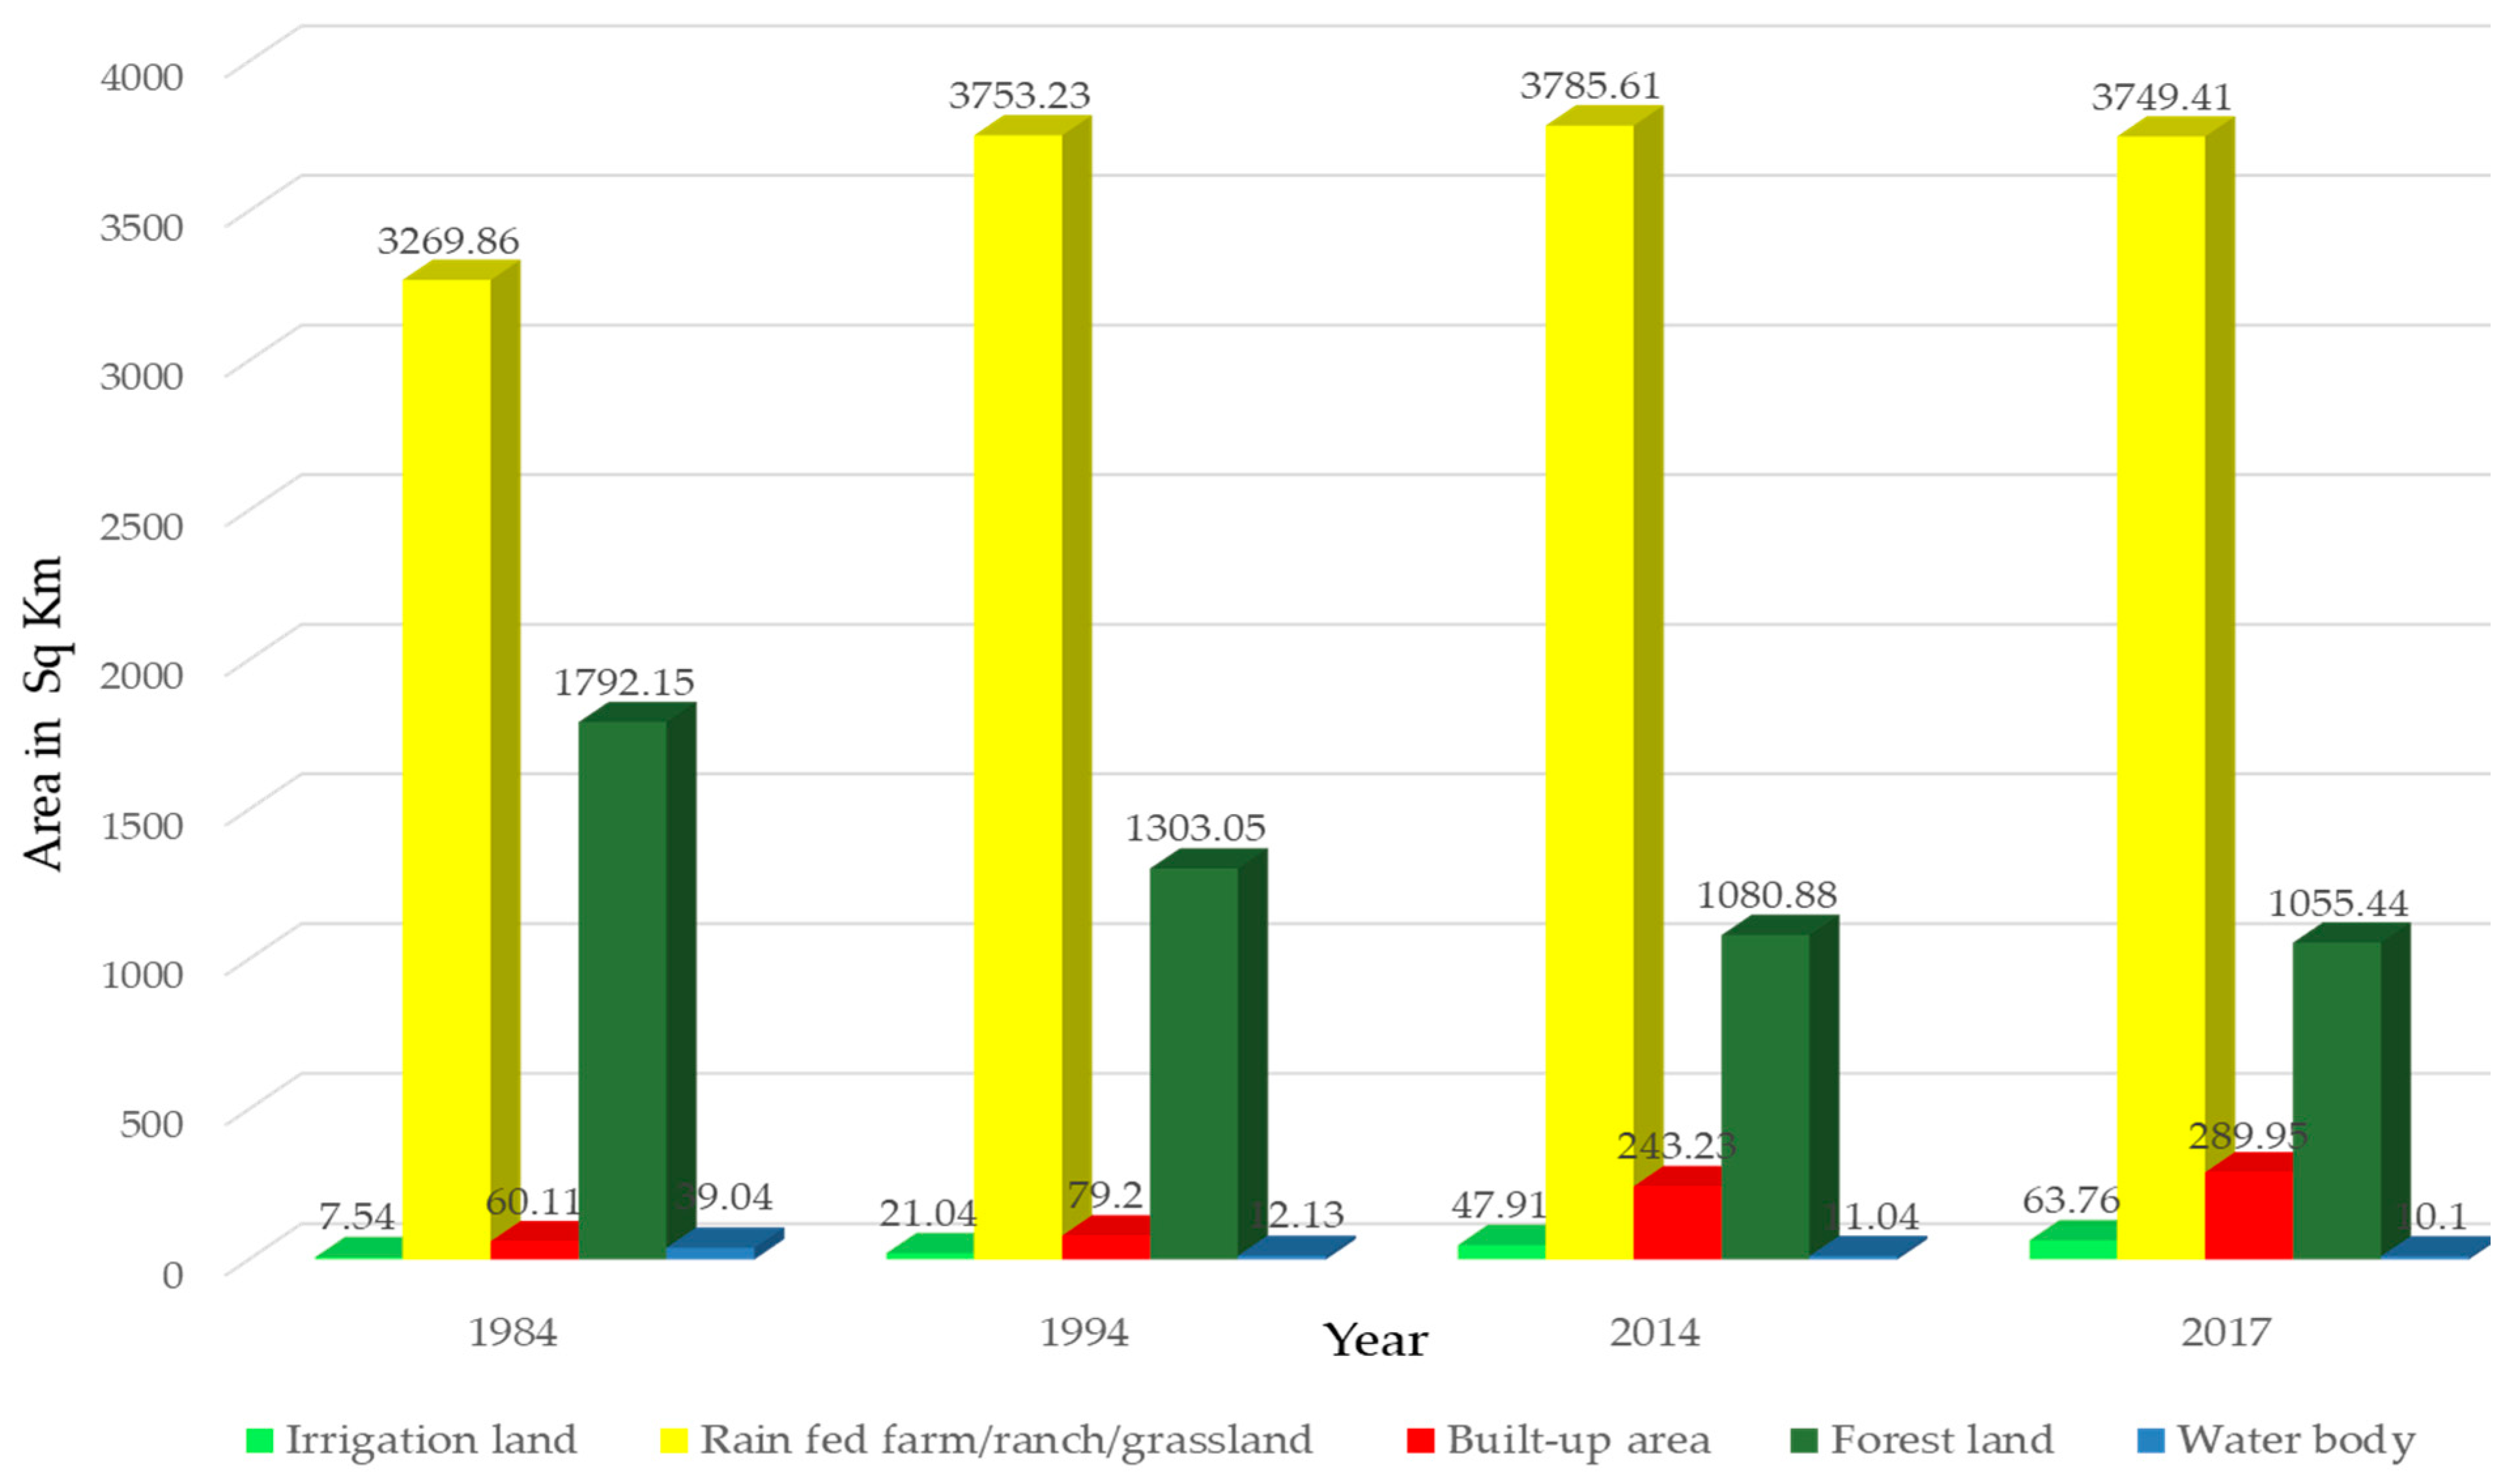
Figure 4.
Land use/land cover images of the Chongwe River Catchment for the years 1984, 1994, 2014, and 2017.
Figure 4.
Land use/land cover images of the Chongwe River Catchment for the years 1984, 1994, 2014, and 2017.
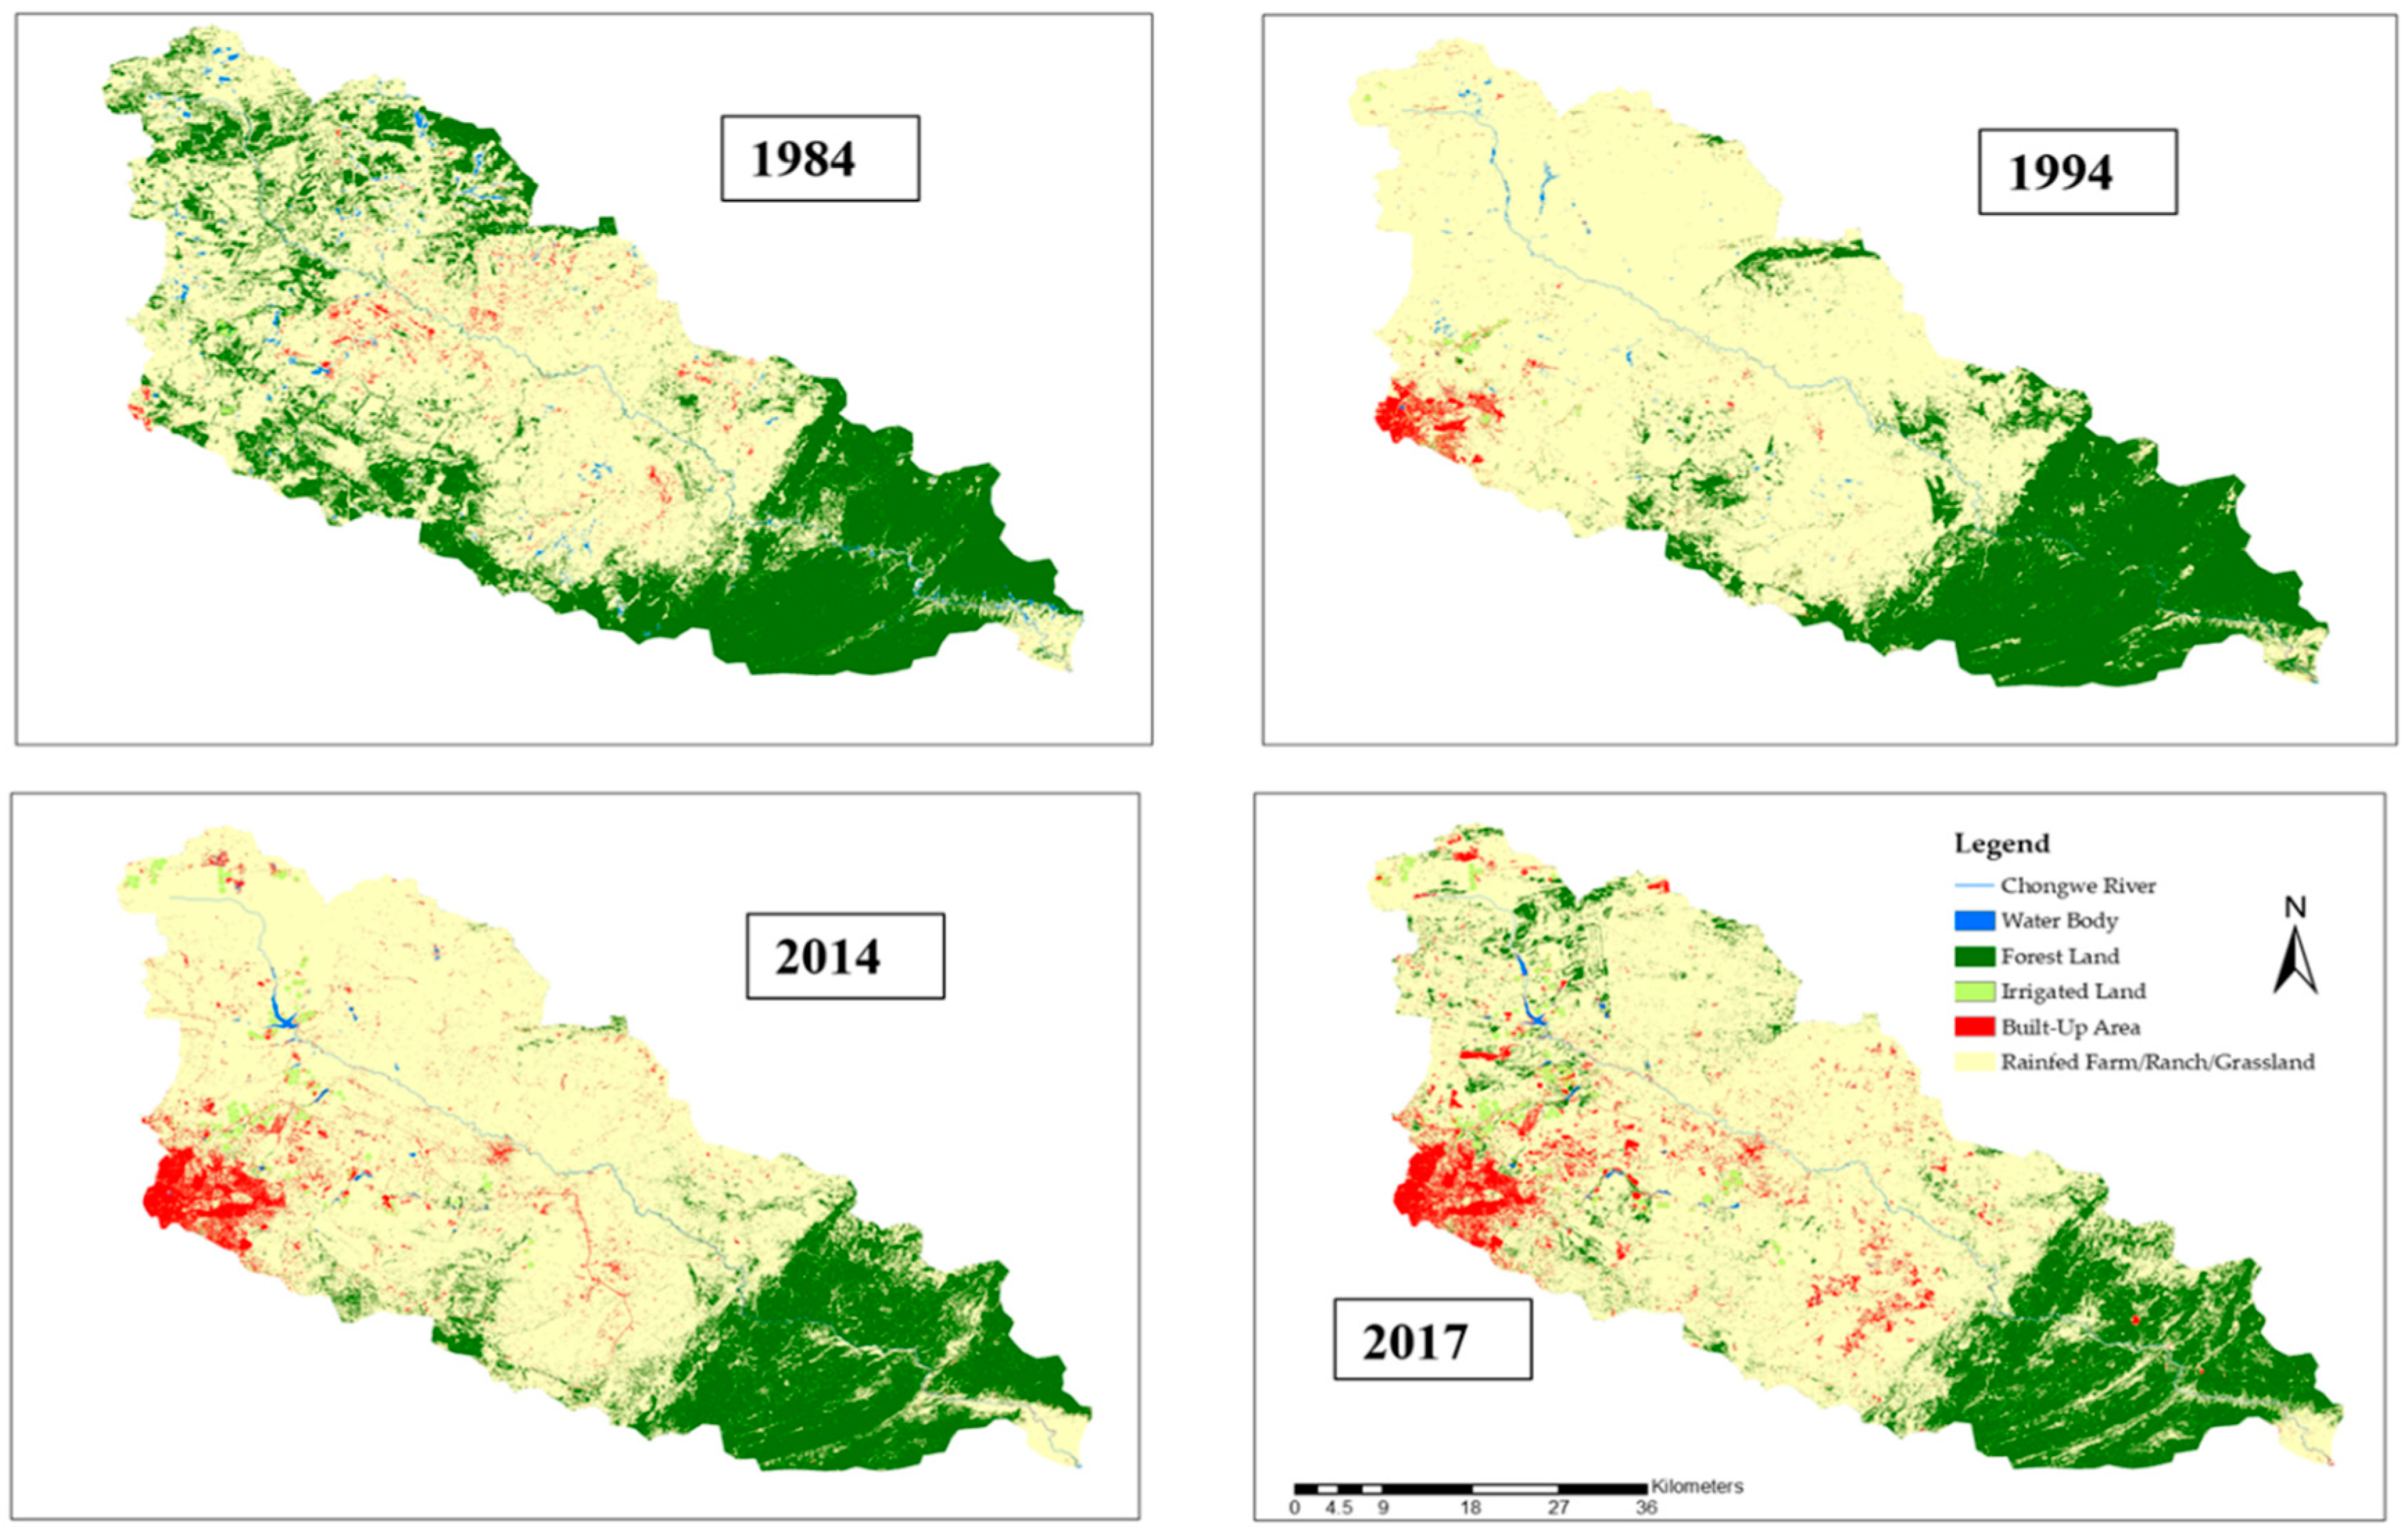
Figure 5.
Annual streamflow variation at the outlet of Chongwe River Catchment for the years 1984–2017.
Figure 5.
Annual streamflow variation at the outlet of Chongwe River Catchment for the years 1984–2017.
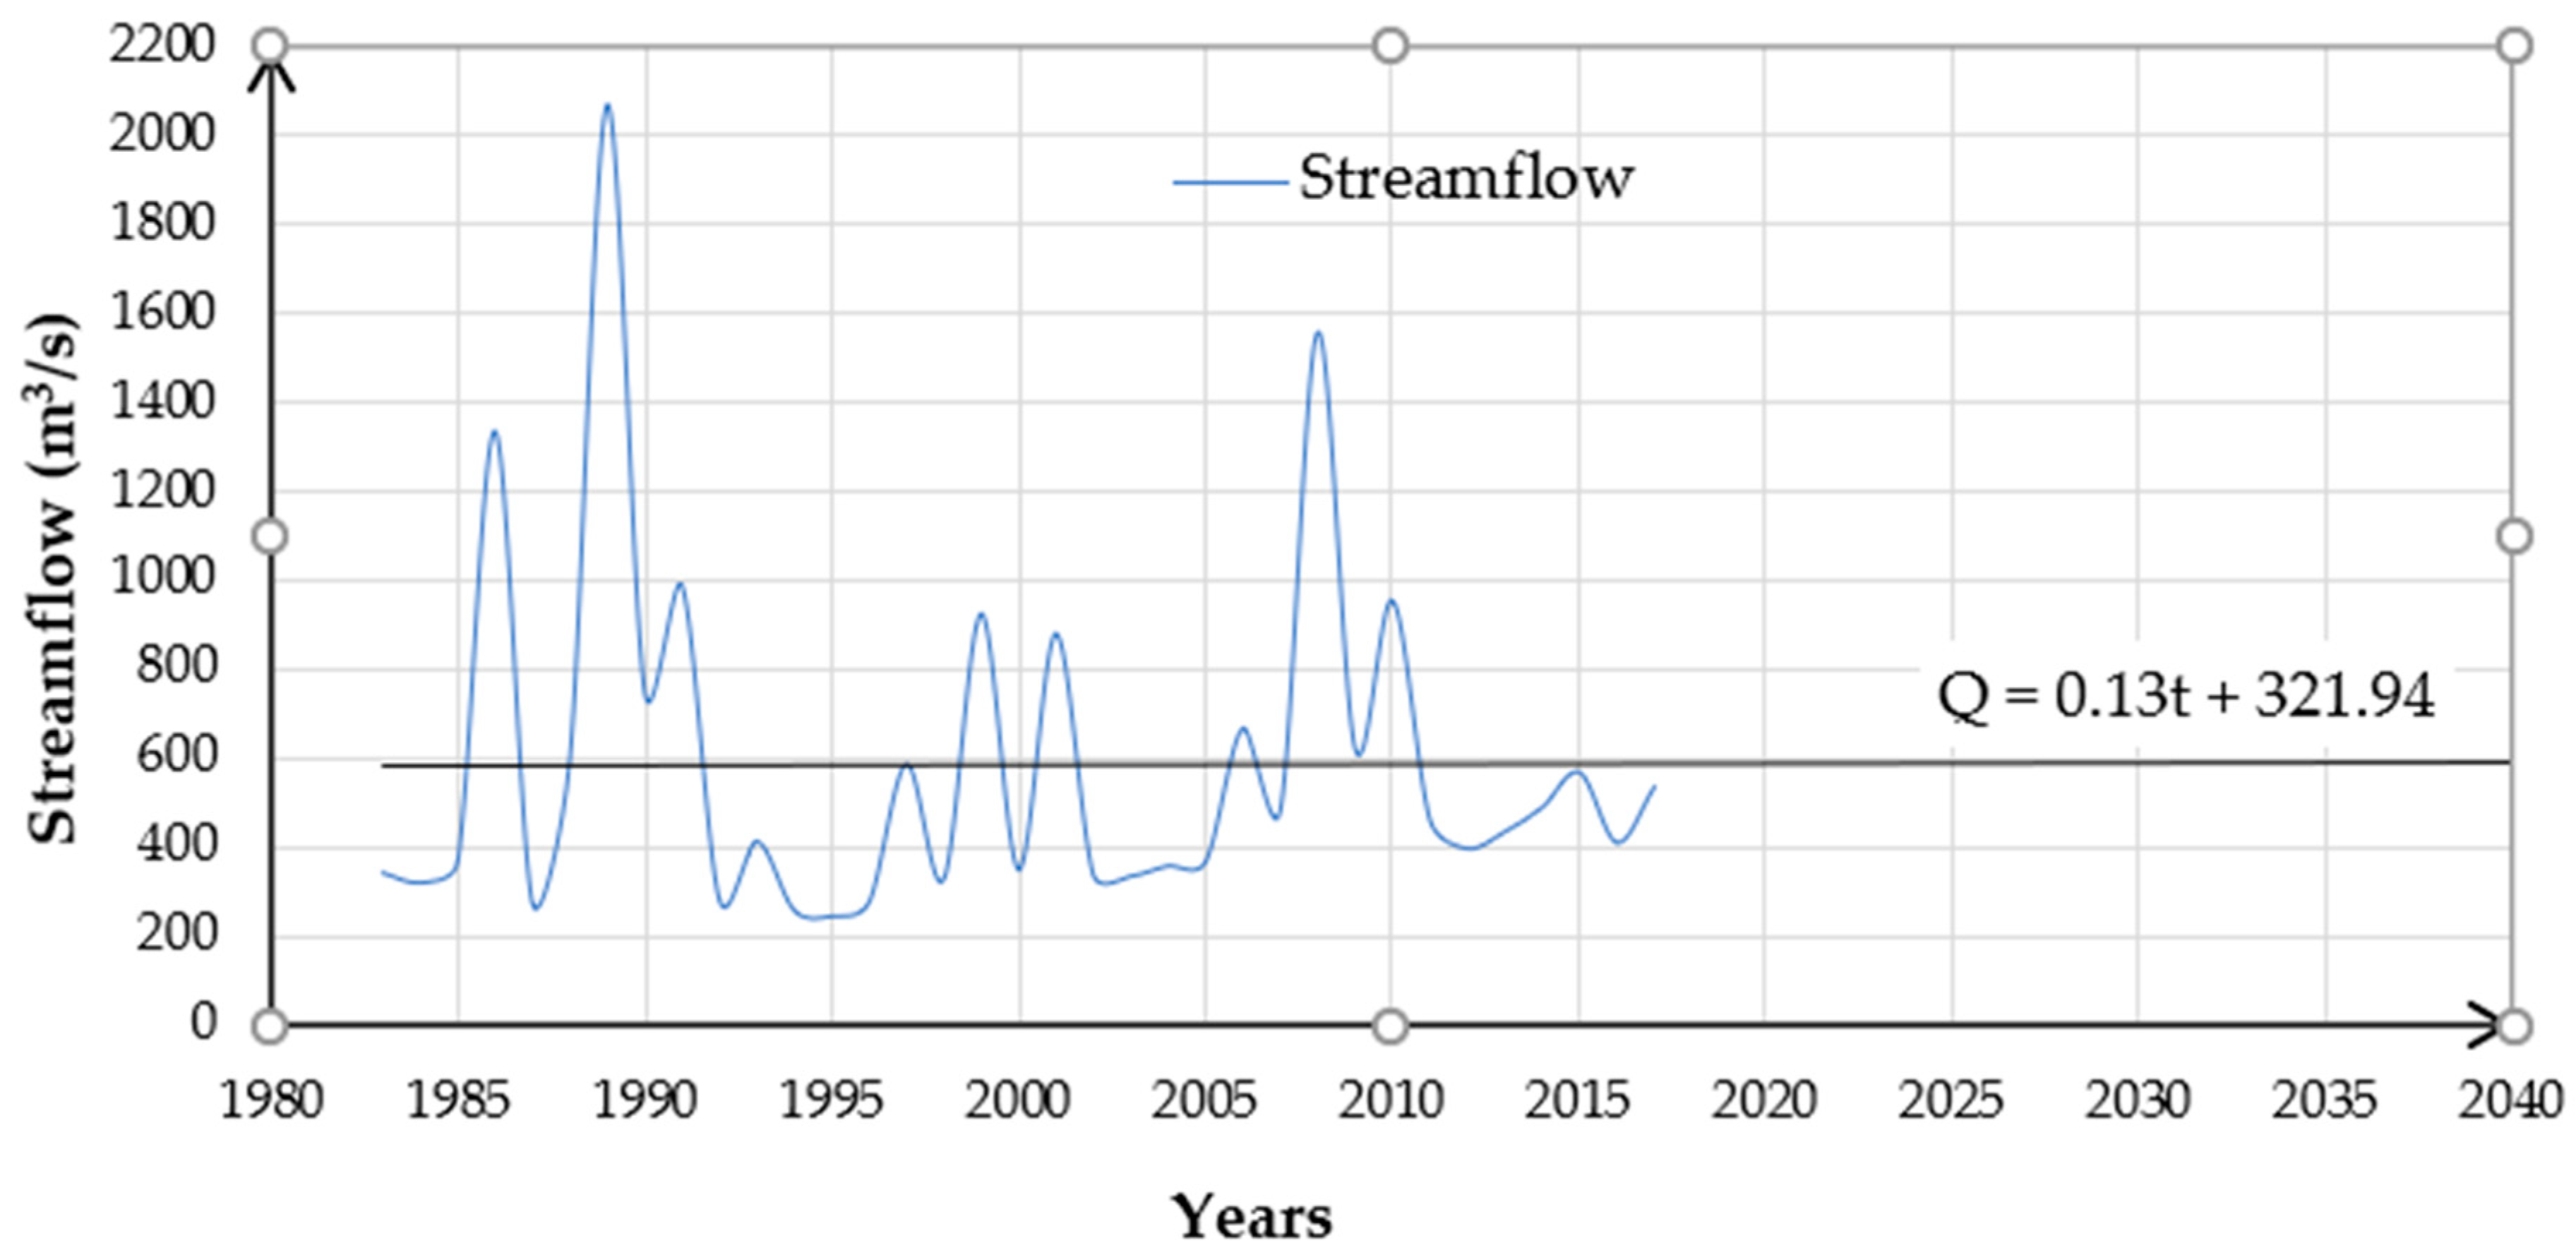
Figure 6.
Change in forest land and built-up area in relation to the WEAP Simulated streamflow at the outlet of Chongwe River Catchment.
Figure 6.
Change in forest land and built-up area in relation to the WEAP Simulated streamflow at the outlet of Chongwe River Catchment.
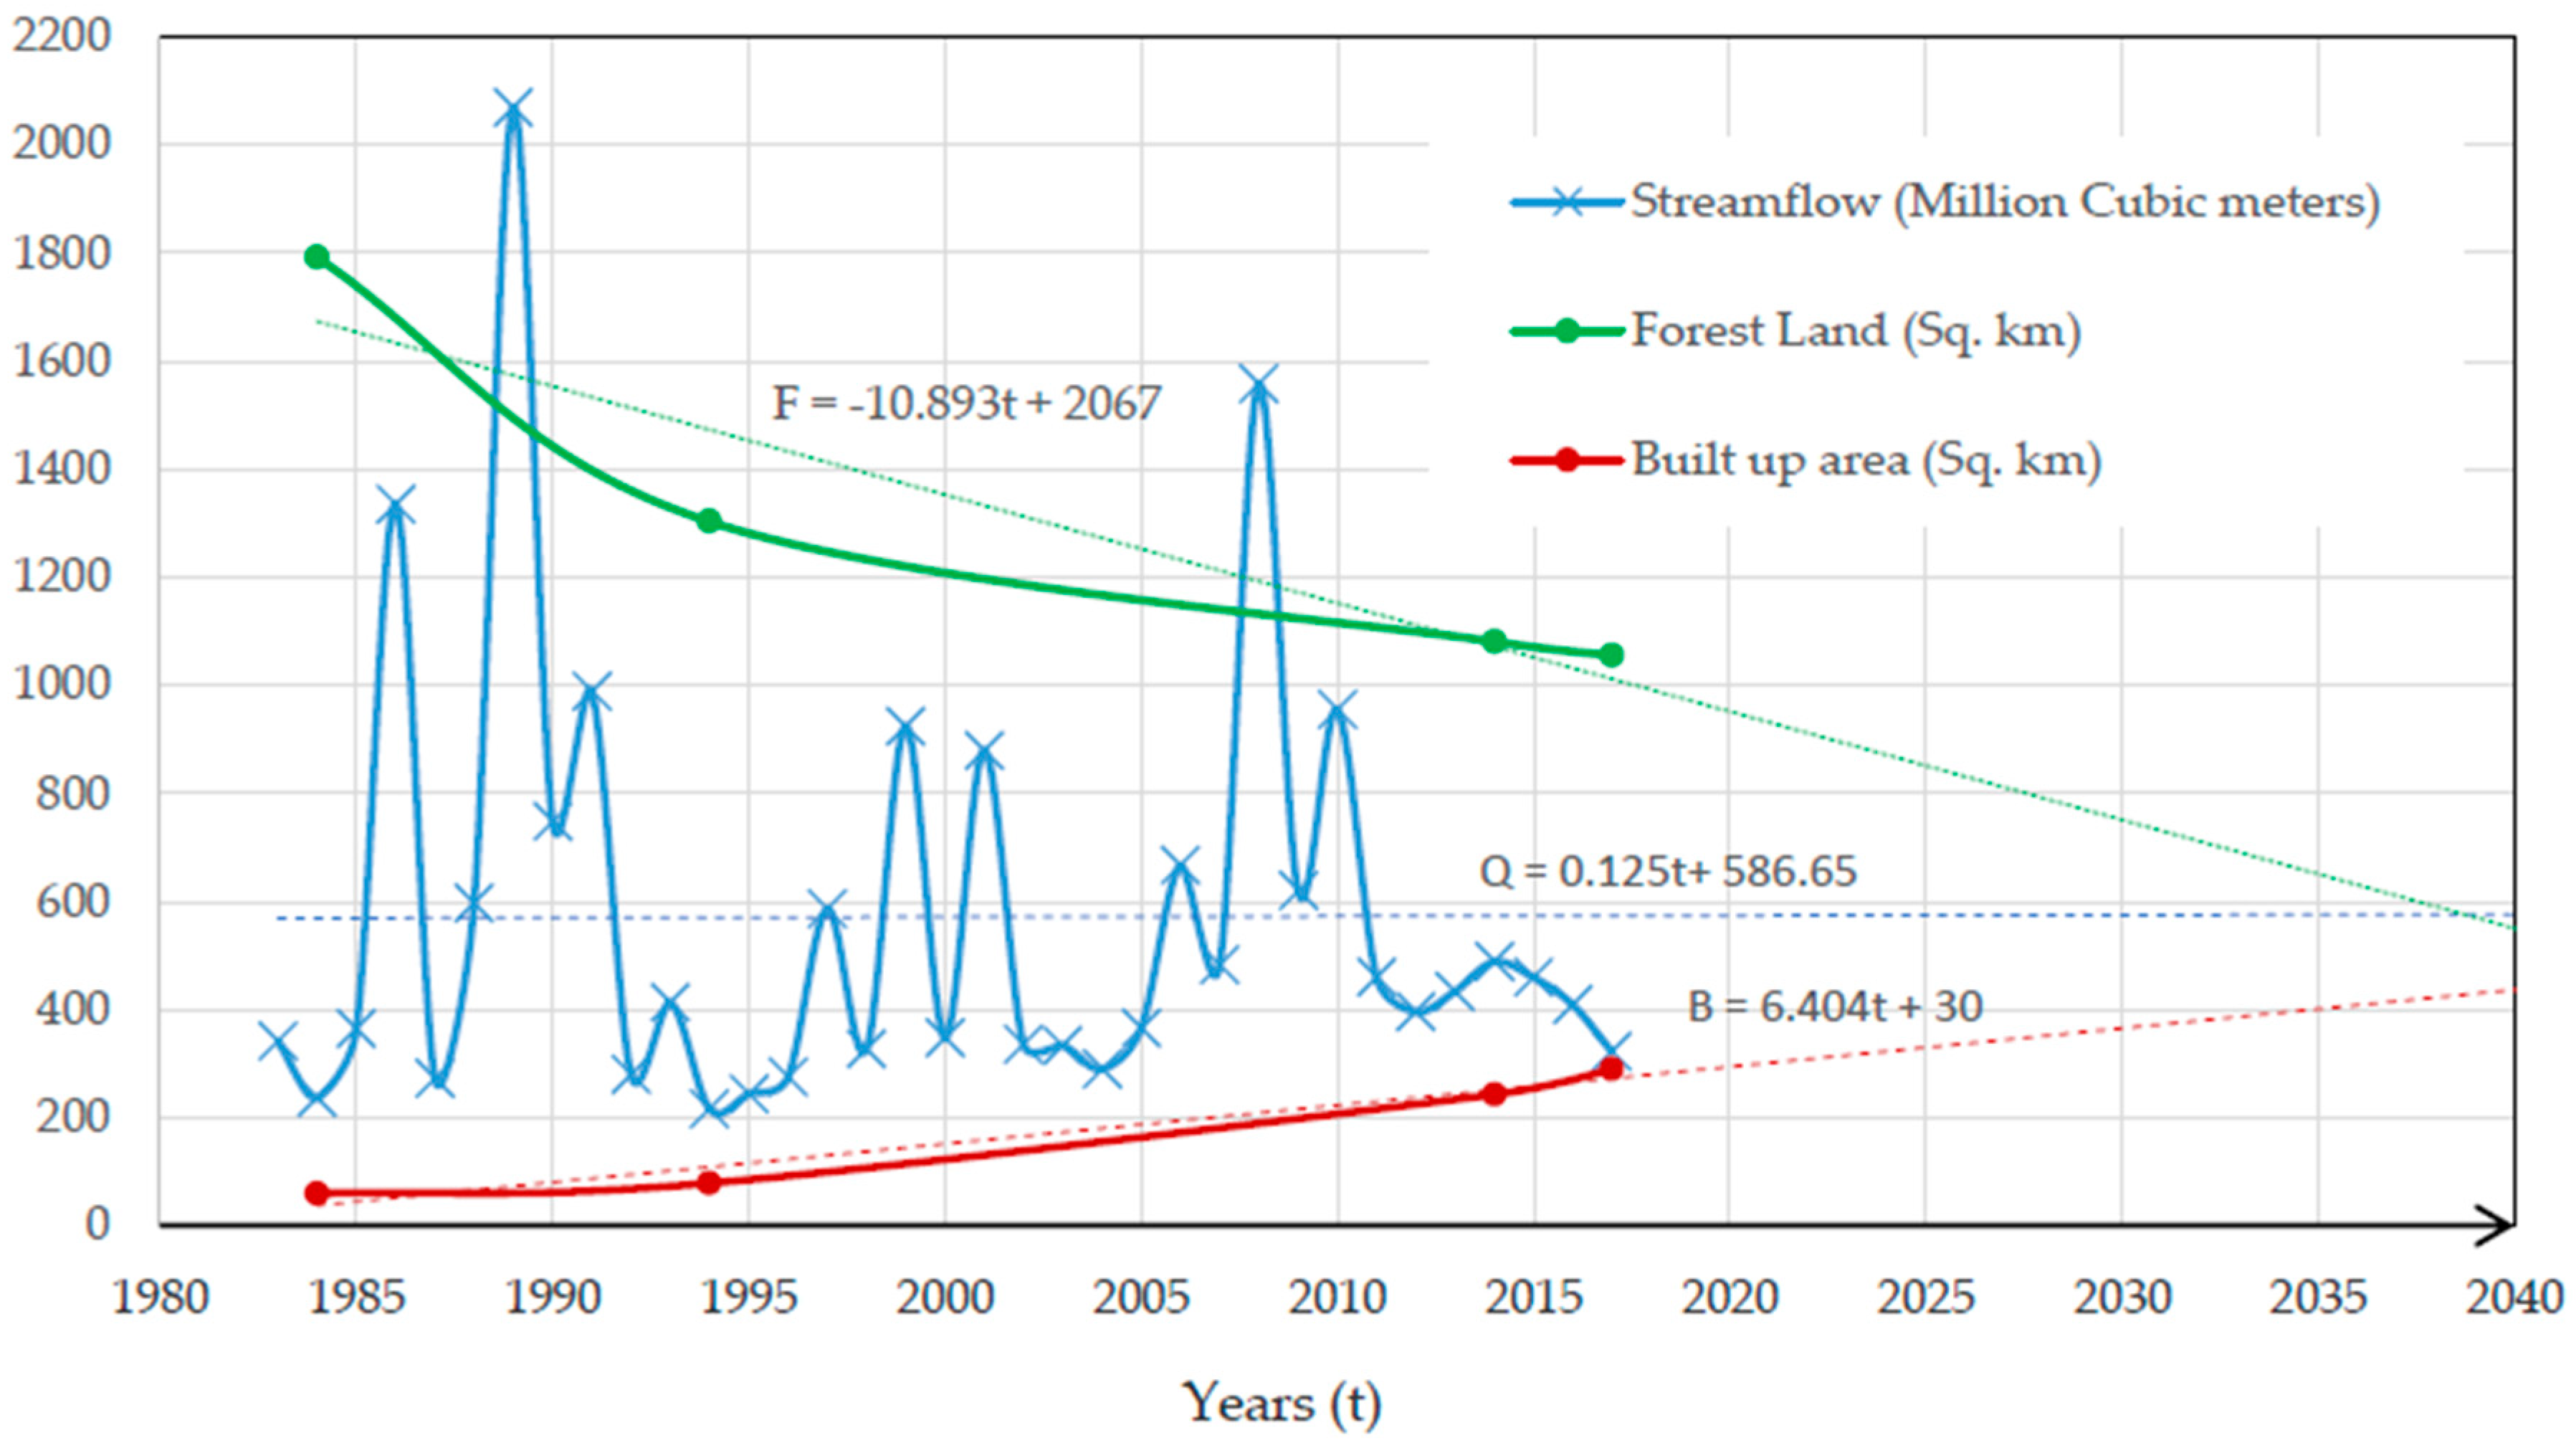
Figure 7.
WEAP observed and simulated average monthly streamflow of Chongwe River at the Great East Bridge from 1982/1983 to 2016/2017.
Figure 7.
WEAP observed and simulated average monthly streamflow of Chongwe River at the Great East Bridge from 1982/1983 to 2016/2017.
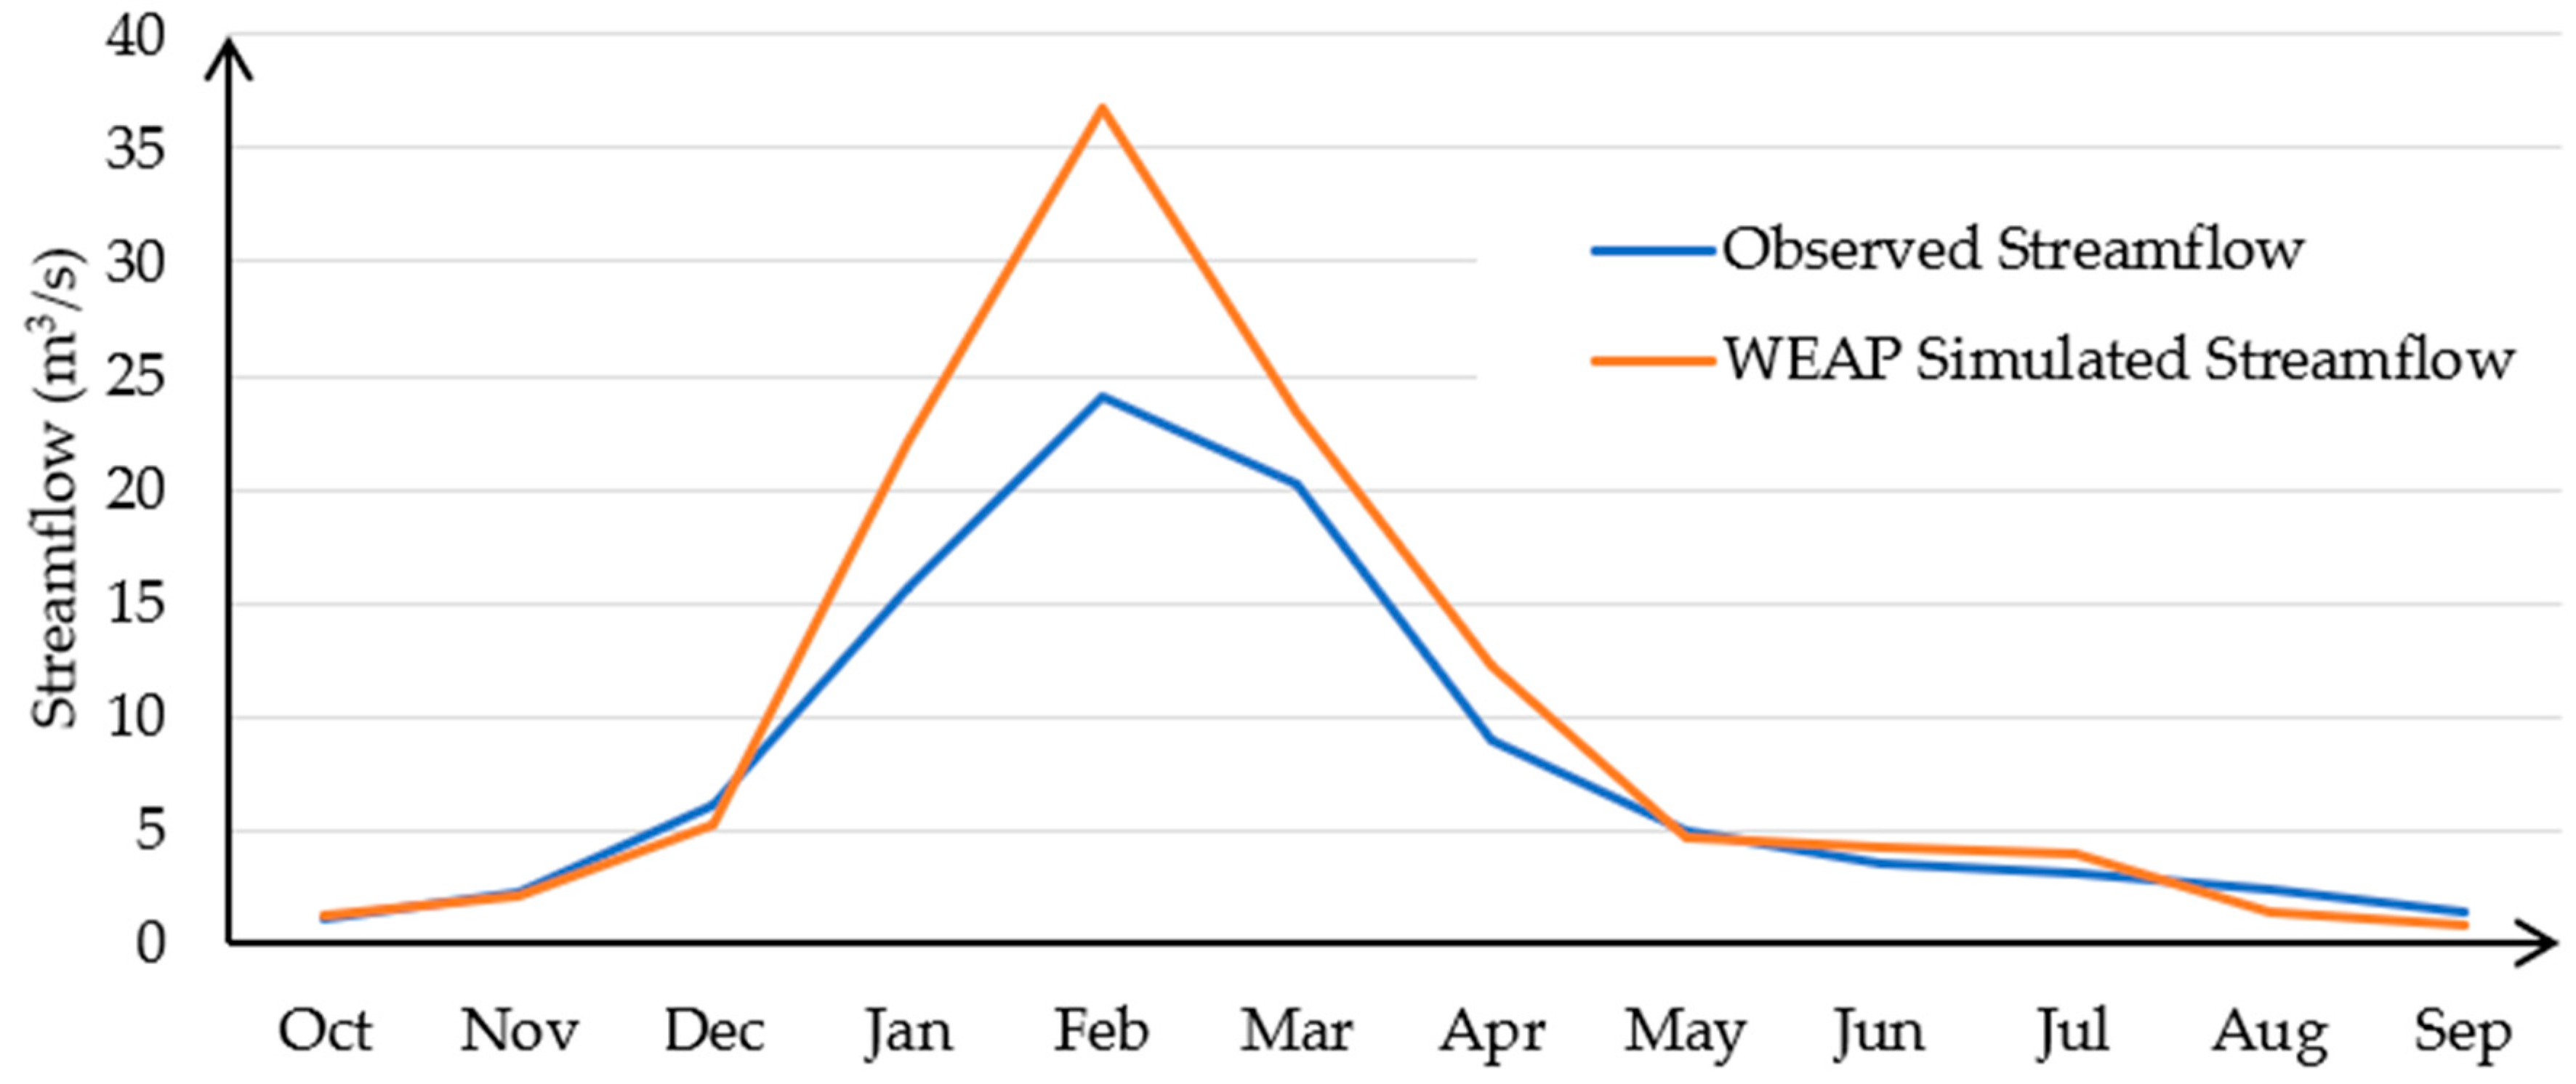
Figure 8.
Scatterplot of observed and simulated streamflow of Chongwe River using R2 for the period from 1982/1983 to 2016/2017.
Figure 8.
Scatterplot of observed and simulated streamflow of Chongwe River using R2 for the period from 1982/1983 to 2016/2017.


Table 1.
Sub-catchments of Chongwe River Catchment and dominant land use pattern.
| Name of Sub-Catchment | Area (km2) | Dominant Land Use Pattern |
|---|---|---|
| Upper Chongwe | 1236 | Agriculture, Ranch (livestock production), Irrigation |
| Ngwerere | 300 | Build-Up, Agriculture, Irrigation, Ranch (livestock production) |
| Kanakantapa | 485 | Agriculture, Forest |
| Chalimbana | 674 | Agriculture, Build-Up, Forest, Irrigation |
| Middle Chongwe–Luimba | 1342 | Agriculture, Forest, Ranch (livestock production) |
| Lower Chongwe | 1131 | Forest, Agriculture, Ranch (livestock production) |
Table 2.
Description of land use/land cover classes used in this study.
| Land Use/Land Cover Class | Cover Description |
|---|---|
| Irrigation land | Irrigation farms, |
| Rain fed farm/ranch/grassland | Rain fed farm/grass land/Pasture land, small shrubs and Bareland |
| Built-up area | Urban Area, Building, Commercial, Industrial Area, Airport, Road, Green houses, Residential Area, Sand Plain, Excavation Sites and other related infrastructure |
| Forest land | Woodland, Forest Area, Dense trees, Shrubs |
| Waterbodies | Reservoirs, Dams, Rivers/Streams, Ponds, Wetland |
Table 3.
Averaged monthly climate values of Chongwe River catchment (1965 to 2017).
| Climate Variable | Month | ||||||||||||
|---|---|---|---|---|---|---|---|---|---|---|---|---|---|
| Oct | Nov | Dec | Jan | Feb | Mar | Apr | May | Jun | Jul | Aug | Sep | Annual | |
| Average Precipitation (mm) | 18 | 98 | 212 | 232 | 201 | 93 | 28 | 5 | 0 | 0 | 0 | 2 | 889 |
| Average Temperature (°C) | 17.8 | 17.7 | 16.6 | 14.6 | 11.4 | 8.7 | 8.2 | 10.3 | 14.1 | 17.4 | 18.2 | 18 | |
| Average RH (%) | 39.34 | 52.4 | 73.4 | 83.71 | 85.7 | 82.45 | 80.14 | 69.17 | 63.91 | 58.05 | 48.1 | 39.77 | |
| Average Wind Speed (m/s) | 39.34 | 52.4 | 73.4 | 83.71 | 85.7 | 82.45 | 80.14 | 69.17 | 63.91 | 58.05 | 48.1 | 39.77 | |
| Cloudiness Fraction | 0.5 | 0.3 | 0.1 | 0.1 | 0.1 | 0.3 | 0.4 | 0.7 | 0.9 | 1 | 1 | 0.7 | |
Table 4.
Land use/land cover change detection in the Chongwe River Catchment from 1984 to 2017.
| LULC Class | 1984 | 1994 | 2014 | 2017 | LULC Change 1984 to 2017 | Rate of Change | |||||
|---|---|---|---|---|---|---|---|---|---|---|---|
| Area (km2) | % | Area (km2) | % | Area (km2) | % | Area (km2) | % | Area (km2) | % | km2/Yr | |
| Irrigation land | 7.54 | 0.2 | 21.0 | 0.4 | 47.9 | 0.93 | 63.8 | 1.2 | 56.2 | 745.6 | 1.7 |
| Rainfed farm/ranch/grass land | 3269.8 | 63.3 | 3753.2 | 72.6 | 3785.6 | 73.24 | 3749.4 | 72.5 | 479.5 | 14.7 | 14.5 |
| Built-up area | 60.06 | 1.2 | 79.2 | 1.5 | 243.2 | 4.71 | 289.9 | 5.6 | 229.8 | 382.7 | 7.0 |
| Forest land | 1792.2 | 34.7 | 1303.1 | 25.2 | 1080.9 | 20.91 | 1055.4 | 20.4 | −736.8 | −41.1 | −22.3 |
| Waterbodies | 39.0 | 0.8 | 12.1 | 0.2 | 11.0 | 0.21 | 10.2 | 0.2 | −28.9 | −74.1 | −0.9 |
| Total | 5168.7 | 5168.7 | 5168.7 | 5168.7 | |||||||
Table 5.
Image classification accuracy using producer’s, user’s, overall accuracy and Kappa coefficient.
Table 5.
Image classification accuracy using producer’s, user’s, overall accuracy and Kappa coefficient.
| LULC Class | Producer’s Accuracy (%) | User’s Accuracy (%) | Overall Accuracy (%) | Kappa Coefficient (%) | ||||||||||||
|---|---|---|---|---|---|---|---|---|---|---|---|---|---|---|---|---|
| 1984 | 1994 | 2014 | 2017 | 1984 | 1994 | 2014 | 2017 | 1984 | 1994 | 2014 | 2017 | 1984 | 1994 | 2014 | 2017 | |
| Irrigated agriculture | 88.6 | 91.8 | 89.2 | 91.9 | 89.6 | 92.8 | 95.7 | 96.6 | 87.8 | 89.4 | 88.4 | 92.2 | 82.4 | 84.2 | 83.2 | 88.9 |
| Rainfed farm/ranch/grass land | 88.4 | 89.4 | 88.1 | 92.4 | 82.5 | 81.6 | 80.7 | 80.2 | ||||||||
| Built-up area | 81.8 | 80.0 | 75.0 | 80.0 | 90.0 | 88.9 | 85.0 | 97.8 | ||||||||
| Forest land | 81.0 | 80.0 | 85.0 | 87.5 | 85.0 | 87.0 | 81.0 | 82.4 | ||||||||
| Waterbodies | 87.8 | 88.8 | 88.8 | 91.0 | 89.8 | 91.4 | 88.3 | 94.5 | ||||||||
Table 6.
Estimated hydrological components and water balance for Chongwe River Catchment for years 1983/1984,1993/1994,2003/2004,2014/2015 and 2016/2017 obtained from water evaluation and planning (WEAP) model.
Table 6.
Estimated hydrological components and water balance for Chongwe River Catchment for years 1983/1984,1993/1994,2003/2004,2014/2015 and 2016/2017 obtained from water evaluation and planning (WEAP) model.
| Year | 1983/1984 | 1993/1994 | 2003/2004 | 2014/2015 | 2016/2017 |
|---|---|---|---|---|---|
| Precipitation (mm) | 897.4 | 576.9 | 889.0 | 892.1 | 890.6 |
| Evapotranspiration (mm) | 840.6 | 598.0 | 792.9 | 787.1 | 796.3 |
| Streamflow (mm) * | 45.8 | 41.9 | 56.1 | 88.9 | 62.3 |
| Abstractions (mm) ** | 8.9 | 11.0 | 15.3 | 21.7 | 23.2 |
| Change in Storage | 2.1 | −73.9 | 24.6 | −1.2 | 8.3 |
* Annual total flow of water at the outlet of Chongwe River Catchment. ** Water withdraws from surface water and groundwater bodies for irrigation, domestic, industrial, water supply and ecological activities by the main water users in the Chongwe River Catchment.
Table 7.
Surface water abstractions in Chongwe River Catchment for the years 1983/1984, 1993/1994, 2003/2004, 2014/2015 and 2016/2017.
Table 7.
Surface water abstractions in Chongwe River Catchment for the years 1983/1984, 1993/1994, 2003/2004, 2014/2015 and 2016/2017.
| Year | Water Supply (Mm3) | Irrigation (Mm3) | Livestock Water Use (Mm3) | Eco System Maintenance (Mm3) | Total Surface Water Abstraction Volume (Mm3) |
|---|---|---|---|---|---|
| 2016/2017 | 1.14 | 57.02 | 2.01 | 30.02 | 90.19 |
| 2014/2015 | 1.03 | 52.56 | 1.94 | 28.54 | 84.07 |
| 2003/2004 | 0.95 | 34.82 | 1.76 | 21.21 | 58.74 |
| 1993/1994 | 0.92 | 19.29 | 1.32 | 19.51 | 41.04 |
| 1983/1984 | 0.63 | 13.77 | 1.52 | 18.94 | 34.86 |
Table 8.
Groundwater abstractions in Chongwe River Catchment for the years 1983/1984, 1993/1994, 2003/2004, 2014/2015 and 2016/2017.
Table 8.
Groundwater abstractions in Chongwe River Catchment for the years 1983/1984, 1993/1994, 2003/2004, 2014/2015 and 2016/2017.
| Year | Groundwater Abstraction Irrigation (Mm3) | Groundwater Abstraction Domestic, Industrial and Rural Water Supply (Mm3) | Total Groundwater Abstraction Volume (Mm3) |
|---|---|---|---|
| 2016/2017 | 11.63 | 18.04 | 29.67 |
| 2014/2015 | 10.50 | 17.79 | 28.29 |
| 2003/2004 | 7.75 | 12.83 | 20.58 |
| 1993/1994 | 4.75 | 10.82 | 15.57 |
| 1983/1984 | 2.05 | 9.18 | 11.23 |
© 2019 by the authors. Licensee MDPI, Basel, Switzerland. This article is an open access article distributed under the terms and conditions of the Creative Commons Attribution (CC BY) license (http://creativecommons.org/licenses/by/4.0/).
Share and Cite
MDPI and ACS Style
Tena, T.M.; Mwaanga, P.; Nguvulu, A. Impact of Land Use/Land Cover Change on Hydrological Components in Chongwe River Catchment. Sustainability 2019, 11, 6415. https://doi.org/10.3390/su11226415
AMA Style
Tena TM, Mwaanga P, Nguvulu A. Impact of Land Use/Land Cover Change on Hydrological Components in Chongwe River Catchment. Sustainability. 2019; 11(22):6415. https://doi.org/10.3390/su11226415
Chicago/Turabian StyleTena, Tewodros M., Phenny Mwaanga, and Alick Nguvulu. 2019. "Impact of Land Use/Land Cover Change on Hydrological Components in Chongwe River Catchment" Sustainability 11, no. 22: 6415. https://doi.org/10.3390/su11226415
Note that from the first issue of 2016, this journal uses article numbers instead of page numbers. See further details here.