Obesity- and Lipid-Related Parameters in the Identification of Older Adults with a High Risk of Prediabetes According to the American Diabetes Association: An Analysis of the 2015 Health, Well-Being, and Aging Study
Abstract
1. Introduction
2. Materials and Methods
2.1. Study Population
2.2. Anthropometric Measurements
- –
- BRI = 364.2 − 365.5 [1 − π−2 WC2 (m) Height−2 (m)]1/2
- –
- BAI = [Hip circumference (m)/Height2/3 (m)] − 18
- –
- ABSI = WC (m)/[BMI2/3(kg/m2)Height1/2 (m)]
- –
- C = 0.109−1 WC (m) [Weight (kg)/Height (m)]−1/2
- –
- VAI = Males: [WC/39.68 + (1.88 × BMI)] × (TG/1.03) × (1.31/HDL); Females: [WC/36.58+(1.89 × BMI)] × (TG/0.81) × (1.52/HDL)
- –
- TyG index = Ln[(triglyceride (mg/dl) × glucose (mg/dl)/2]
- –
- TyG-BMI = TyG × BMI
- –
- TyG-WC = TyG × WC
- –
- TyG-WHtR = TyG × WHtR
2.3. Laboratory Measurements
2.4. Classification of Variables
2.5. Analysis Plan
3. Results
3.1. Clinical and Sociodemographic Characteristics of the Study Participants According to Their Glycemic Status
3.2. Obesity- and Lipid-Related Parameters According to the 2016 American Diabetes Association Glycemic Status
3.3. Association of Prediabetes with the Level of Obesity- and Lipid-Related Indices
3.4. Receiver Operating Characteristic Curve Analysis for the Obesity- and Lipid-Related Indices for Diagnosing Prediabetes According the 2016 American Diabetes Association Criteria
3.5. Prevalence of Prediabetes According to Obesity- and Lipid-Related Indices
4. Discussion
5. Conclusions
Supplementary Materials
Author Contributions
Funding
Acknowledgments
Conflicts of Interest
References
- Wilson, M.L. Prediabetes. Nurs. Clin. N. Am. 2017, 52, 665–677. [Google Scholar] [CrossRef] [PubMed]
- Nasr, G.; Sliem, H. Silent myocardial ischemia in prediabetics in relation to insulin resistance. J. Cardiovasc. Dis. Res. 2010, 1, 116–121. [Google Scholar] [CrossRef] [PubMed][Green Version]
- Levitan, E.B.; Song, Y.; Ford, E.S.; Liu, S. Is Nondiabetic Hyperglycemia a Risk Factor for Cardiovascular Disease? Arch. Intern. Med. 2004, 164, 2147. [Google Scholar] [CrossRef] [PubMed]
- Kurihara, O.; Takano, M.; Yamamoto, M.; Shirakabe, A.; Kimata, N.; Inami, T.; Kobayashi, N.; Munakata, R.; Murakami, D.; Inami, S.; et al. Impact of prediabetic status on coronary atherosclerosis: A multivessel angioscopic study. Diabetes Care 2013, 36, 729–733. [Google Scholar] [CrossRef] [PubMed]
- Huang, Y.; Cai, X.; Mai, W.; Li, M.; Hu, Y. Association between prediabetes and risk of cardiovascular disease and all cause mortality: Systematic review and meta-analysis. BMJ 2016, 355, i5953. [Google Scholar] [CrossRef]
- World Health Organization. Global Status Report on Noncommunicable Diseases 2014; World Health Organization: Geneva, Switzerland, 2014; ISBN 9789241564854. [Google Scholar]
- Cho, N.H.; Shaw, J.E.; Karuranga, S.; Huang, Y.; da Rocha Fernandes, J.D.; Ohlrogge, A.W.; Malanda, B. IDF Diabetes Atlas: Global estimates of diabetes prevalence for 2017 and projections for 2045. Diabetes Res. Clin. Pract. 2018, 138, 271–281. [Google Scholar] [CrossRef]
- Buysschaert, M.; Bergman, M. Definition of Prediabetes. Med. Clin. N. Am. 2011, 95, 289–297. [Google Scholar] [CrossRef]
- Yip, W.; Sequeira, I.; Plank, L.; Poppitt, S. Prevalence of Pre-Diabetes across Ethnicities: A Review of Impaired Fasting Glucose (IFG) and Impaired Glucose Tolerance (IGT) for Classification of Dysglycaemia. Nutrients 2017, 9, 1273. [Google Scholar] [CrossRef]
- Gerstein, H.C.; Santaguida, P.; Raina, P.; Morrison, K.M.; Balion, C.; Hunt, D.; Yazdi, H.; Booker, L. Annual incidence and relative risk of diabetes in people with various categories of dysglycemia: A systematic overview and meta-analysis of prospective studies. Diabetes Res. Clin. Pract. 2007, 78, 305–312. [Google Scholar] [CrossRef]
- Gu, Z.; Li, D.; He, H.; Wang, J.; Hu, X.; Zhang, P.; Hong, Y.; Liu, B.; Zhang, L.; Ji, G. Body mass index, waist circumference, and waist-to-height ratio for prediction of multiple metabolic risk factors in Chinese elderly population. Sci. Rep. 2018, 8, 385. [Google Scholar] [CrossRef]
- Gu, Z.; Zhu, P.; Wang, Q.; He, H.; Xu, J.; Zhang, L.; Li, D.; Wang, J.; Hu, X.; Ji, G.; et al. Obesity and lipid-related parameters for predicting metabolic syndrome in Chinese elderly population. Lipids Health Dis. 2018, 17, 289. [Google Scholar] [CrossRef] [PubMed]
- Li, R.; Li, Q.; Cui, M.; Yin, Z.; Li, L.; Zhong, T.; Huo, Y.; Xie, P. Clinical surrogate markers for predicting metabolic syndrome in middle-aged and elderly Chinese. J. Diabetes Investig. 2018, 9, 411–418. [Google Scholar] [CrossRef] [PubMed]
- Ramírez-Vélez, R.; Correa-Bautista, J.E.; García-Hermoso, A.; Cano, C.A.; Izquierdo, M. Reference values for handgrip strength and their association with intrinsic capacity domains among older adults. J. Cachexia. Sarcopenia Muscle 2019, 10, 278–286. [Google Scholar] [CrossRef] [PubMed]
- Gomez, F.; Corchuelo, J.; Curcio, C.-L.; Calzada, M.-T.; Mendez, F. SABE Colombia: Survey on Health, Well-Being, and Aging in Colombia—Study Design and Protocol. Curr. Gerontol. Geriatr. Res. 2016, 2016, 7910205. [Google Scholar] [CrossRef] [PubMed]
- Amato, M.C.; Giordano, C.; Galia, M.; Criscimanna, A.; Vitabile, S.; Midiri, M.; Galluzzo, A.; AlkaMeSy Study Group. Visceral Adiposity Index: A reliable indicator of visceral fat function associated with cardiometabolic risk. Diabetes Care 2010, 33, 920–922. [Google Scholar] [CrossRef] [PubMed]
- Thomas, D.M.; Bredlau, C.; Bosy-Westphal, A.; Mueller, M.; Shen, W.; Gallagher, D.; Maeda, Y.; McDougall, A.; Peterson, C.M.; Ravussin, E.; et al. Relationships between body roundness with body fat and visceral adipose tissue emerging from a new geometrical model. Obesity 2013, 21, 2264–2271. [Google Scholar] [CrossRef] [PubMed]
- Bergman, R.N.; Stefanovski, D.; Buchanan, T.A.; Sumner, A.E.; Reynolds, J.C.; Sebring, N.G.; Xiang, A.H.; Watanabe, R.M. A Better Index of Body Adiposity. Obesity 2011, 19, 1083–1089. [Google Scholar] [CrossRef]
- Krakauer, N.Y.; Krakauer, J.C. A New Body Shape Index Predicts Mortality Hazard Independently of Body Mass Index. PLoS ONE 2012, 7, e39504. [Google Scholar] [CrossRef]
- Valdez, R. A simple model-based index of abdominal adiposity. J. Clin. Epidemiol. 1991, 44, 955–956. [Google Scholar] [CrossRef]
- Guerrero-Romero, F.; Simental-Mendía, L.E.; González-Ortiz, M.; Martínez-Abundis, E.; Ramos-Zavala, M.G.; Hernández-González, S.O.; Jacques-Camarena, O.; Rodríguez-Morán, M. The Product of Triglycerides and Glucose, a Simple Measure of Insulin Sensitivity. Comparison with the Euglycemic-Hyperinsulinemic Clamp. J. Clin. Endocrinol. Metab. 2010, 95, 3347–3351. [Google Scholar] [CrossRef]
- Zheng, S.; Shi, S.; Ren, X.; Han, T.; Li, Y.; Chen, Y.; Liu, W.; Hou, P.C.; Hu, Y. Triglyceride glucose-waist circumference, a novel and effective predictor of diabetes in first-degree relatives of type 2 diabetes patients: Cross-sectional and prospective cohort study. J. Transl. Med. 2016, 14, 260. [Google Scholar] [CrossRef] [PubMed]
- Lim, J.; Kim, J.; Koo, S.H.; Kwon, G.C. Comparison of triglyceride glucose index, and related parameters to predict insulin resistance in Korean adults: An analysis of the 2007-2010 Korean National Health and Nutrition Examination Survey. PLoS ONE 2019, 14, e0212963. [Google Scholar] [CrossRef] [PubMed]
- Chamberlain, J.J.; Rhinehart, A.S.; Shaefer, C.F.; Neuman, A. Diagnosis and Management of Diabetes: Synopsis of the 2016 American Diabetes Association Standards of Medical Care in Diabetes. Ann. Intern. Med. 2016, 164, 542. [Google Scholar] [CrossRef] [PubMed]
- Claridge-Chang, A.; Assam, P.N. Estimation statistics should replace significance testing. Nat. Methods 2016, 13, 108–109. [Google Scholar] [CrossRef]
- Salgado, J.F. Transforming the Area under the Normal Curve (AUC) into Cohen’s d, Pearson’s r pb, Odds-Ratio, and Natural Log Odds-Ratio: Two Conversion Tables. Eur. J. Psychol. Appl. Leg. Context 2018, 10, 35–47. [Google Scholar] [CrossRef]
- Cohen, J. Statistical Power Analysis for the Behavioral Sciences; L. Erlbaum Associates: Mahwah, NJ, USA, 1988; ISBN 0805802835. [Google Scholar]
- McHugh, M.L. The chi-square test of independence. Biochem. Med. 2013, 23, 143–149. [Google Scholar] [CrossRef]
- IDF Diabetes Atlas. Available online: https://www.idf.org/e-library/epidemiology-research/diabetes-atlas/13-diabetes-atlas-seventh-edition.html (accessed on 20 August 2019).
- Soriguer, F.; Goday, A.; Bosch-Comas, A.; Bordiú, E.; Calle-Pascual, A.; Carmena, R.; Casamitjana, R.; Castaño, L.; Castell, C.; Catalá, M.; et al. Prevalence of diabetes mellitus and impaired glucose regulation in Spain: The Di@bet.es Study. Diabetologia 2012, 55, 88–93. [Google Scholar] [CrossRef]
- Menke, A.; Casagrande, S.; Geiss, L.; Cowie, C.C. Prevalence of and Trends in Diabetes Among Adults in the United States, 1988–2012. JAMA 2015, 314, 1021. [Google Scholar] [CrossRef]
- Vilanova, M.B.; Falguera, M.; Marsal, J.R.; Rubinat, E.; Alcubierre, N.; Castelblanco, E.; Granado-Casas, M.; Miró, N.; Molló, À.; Mata-Cases, M.; et al. Prevalence, clinical features and risk assessment of pre-diabetes in Spain: Mata-Cases, M.; Franch-Nadal, J.; Mauricio, D. Prevalence, clinical features and risk assessment of pre-diabetes in Spain: The prospective Mollerussa cohort studythe prospective Mollerussa cohort study. BMJ open 2017, 7, e015158. [Google Scholar] [CrossRef]
- Barceló, A.; Gregg, E.W.; Pastor-Valero, M.; Robles, S.C. Waist circumference, BMI and the prevalence of self-reported diabetes among the elderly of the United States and six cities of Latin America and the Caribbean. Diabetes Res. Clin. Pract. 2007, 78, 418–427. [Google Scholar] [CrossRef]
- Yang, X.Y.; Zhang, M.; Luo, X.P.; Wang, J.J.; Yin, L.; Pang, C.; Wang, G.A.; Shen, Y.X.; Wu, D.T.; Zhang, L.; et al. Body mass index, waist circumference and waist-to-height ratio associated with the incidence of type 2 diabetes mellitus: A cohort study. Zhonghua Yu Fang Yi Xue Za Zhi 2016, 50, 328–333. [Google Scholar] [PubMed]
- Fujita, M.; Sato, Y.; Nagashima, K.; Takahashi, S.; Hata, A. Predictive Power of a Body Shape Index for Development of Diabetes, Hypertension, and Dyslipidemia in Japanese Adults: A Retrospective Cohort Study. PLoS ONE 2015, 10, e0128972. [Google Scholar] [CrossRef] [PubMed]
- Hardy, D.S.; Stallings, D.T.; Garvin, J.T.; Xu, H.; Racette, S.B. Best anthropometric discriminators of incident type 2 diabetes among white and black adults: A longitudinal ARIC study. PLoS ONE 2017, 12, e0168282. [Google Scholar] [CrossRef] [PubMed]
- Qiu, M.; Shen, W.; Song, X.; Ju, L.; Tong, W.; Wang, H.; Zheng, S.; Jin, Y.; Wu, Y.; Wang, W.; et al. Effects of Prediabetes Mellitus Alone or Plus Hypertension on Subsequent Occurrence of Cardiovascular Disease and Diabetes Mellitus. Hypertension 2015, 65, 525–530. [Google Scholar] [CrossRef] [PubMed]
- Nwose, E.U.; Richards, R.S.; Bwititi, P.T.; Igumbor, E.O.; Oshionwu, E.J.; Okolie, K.; Onyia, I.C.; Pokhrel, A.; Gyawali, P.; Okuzor, J.N.; et al. Prediabetes and cardiovascular complications study (PACCS): International collaboration 4 years’ summary and future direction. BMC Res. Notes 2017, 10, 730. [Google Scholar] [CrossRef] [PubMed]
- Rodriguez-Segade, S.; Rodriguez, J.; Camiña, F.; Sanmartín-Portas, L.; Gerpe-Jamardo, J.; Pazos-Couselo, M.; García-López, J.M.; Alonso-Sampedro, M.; González-Quintela, A.; Gude, F. Prediabetes defined by HbA1c and by fasting glucose: Differences in risk factors and prevalence. Acta Diabetol. 2019, 56, 1023–1030. [Google Scholar] [CrossRef] [PubMed]
- Er, L.-K.; Wu, S.; Chou, H.-H.; Hsu, L.-A.; Teng, M.-S.; Sun, Y.-C.; Ko, Y.-L. Triglyceride Glucose-Body Mass Index Is a Simple and Clinically Useful Surrogate Marker for Insulin Resistance in Nondiabetic Individuals. PLoS ONE 2016, 11, e0149731. [Google Scholar] [CrossRef]
- Spruijt-Metz, D.; O’Reilly, G.A.; Cook, L.; Page, K.A.; Quinn, C. Behavioral contributions to the pathogenesis of type 2 diabetes. Curr. Diab. Rep. 2014, 14, 475. [Google Scholar] [CrossRef]
- Zhang, S.; Du, T.; Zhang, J.; Lu, H.; Lin, X.; Xie, J.; Yang, Y.; Yu, X. The triglyceride and glucose index (TyG) is an effective biomarker to identify nonalcoholic fatty liver disease. Lipids Health Dis. 2017, 1, 15. [Google Scholar] [CrossRef]
- Lee, E.Y.; Yang, H.K.; Lee, J.; Kang, B.; Yang, Y.; Lee, S.H.; Ko, S.H.; Ahn, Y.B.; Cha, B.Y.; Yoon, K.H.; et al. Triglyceride glucose index, a marker of insulin resistance, is associated with coronary artery stenosis in asymptomatic subjects with type 2 diabetes. Lipids Health Dis. 2016, 15, 155. [Google Scholar] [CrossRef]
- Du, T.; Yuan, G.; Zhang, M.; Zhou, X.; Sun, X.; Yu, X. Clinical usefulness of lipid ratios, visceral adiposity indicators, and the triglycerides and glucose index as risk markers of insulin resistance. Cardiovasc. Diabetol. 2014, 13, 146. [Google Scholar] [CrossRef] [PubMed]
- Lambrinoudaki, I.; Kazani, M.V.; Armeni, E.; Georgiopoulos, G.; Tampakis, K.; Rizos, D.; Augoulea, A.; Kaparos, G.; Alexandrou, A.; Stamatelopoulos, K. The TyG Index as a Marker of Subclinical Atherosclerosis and Arterial Stiffness in Lean and Overweight Postmenopausal Women. Heart Lung Circ. 2018, 27, 716–724. [Google Scholar] [CrossRef] [PubMed]
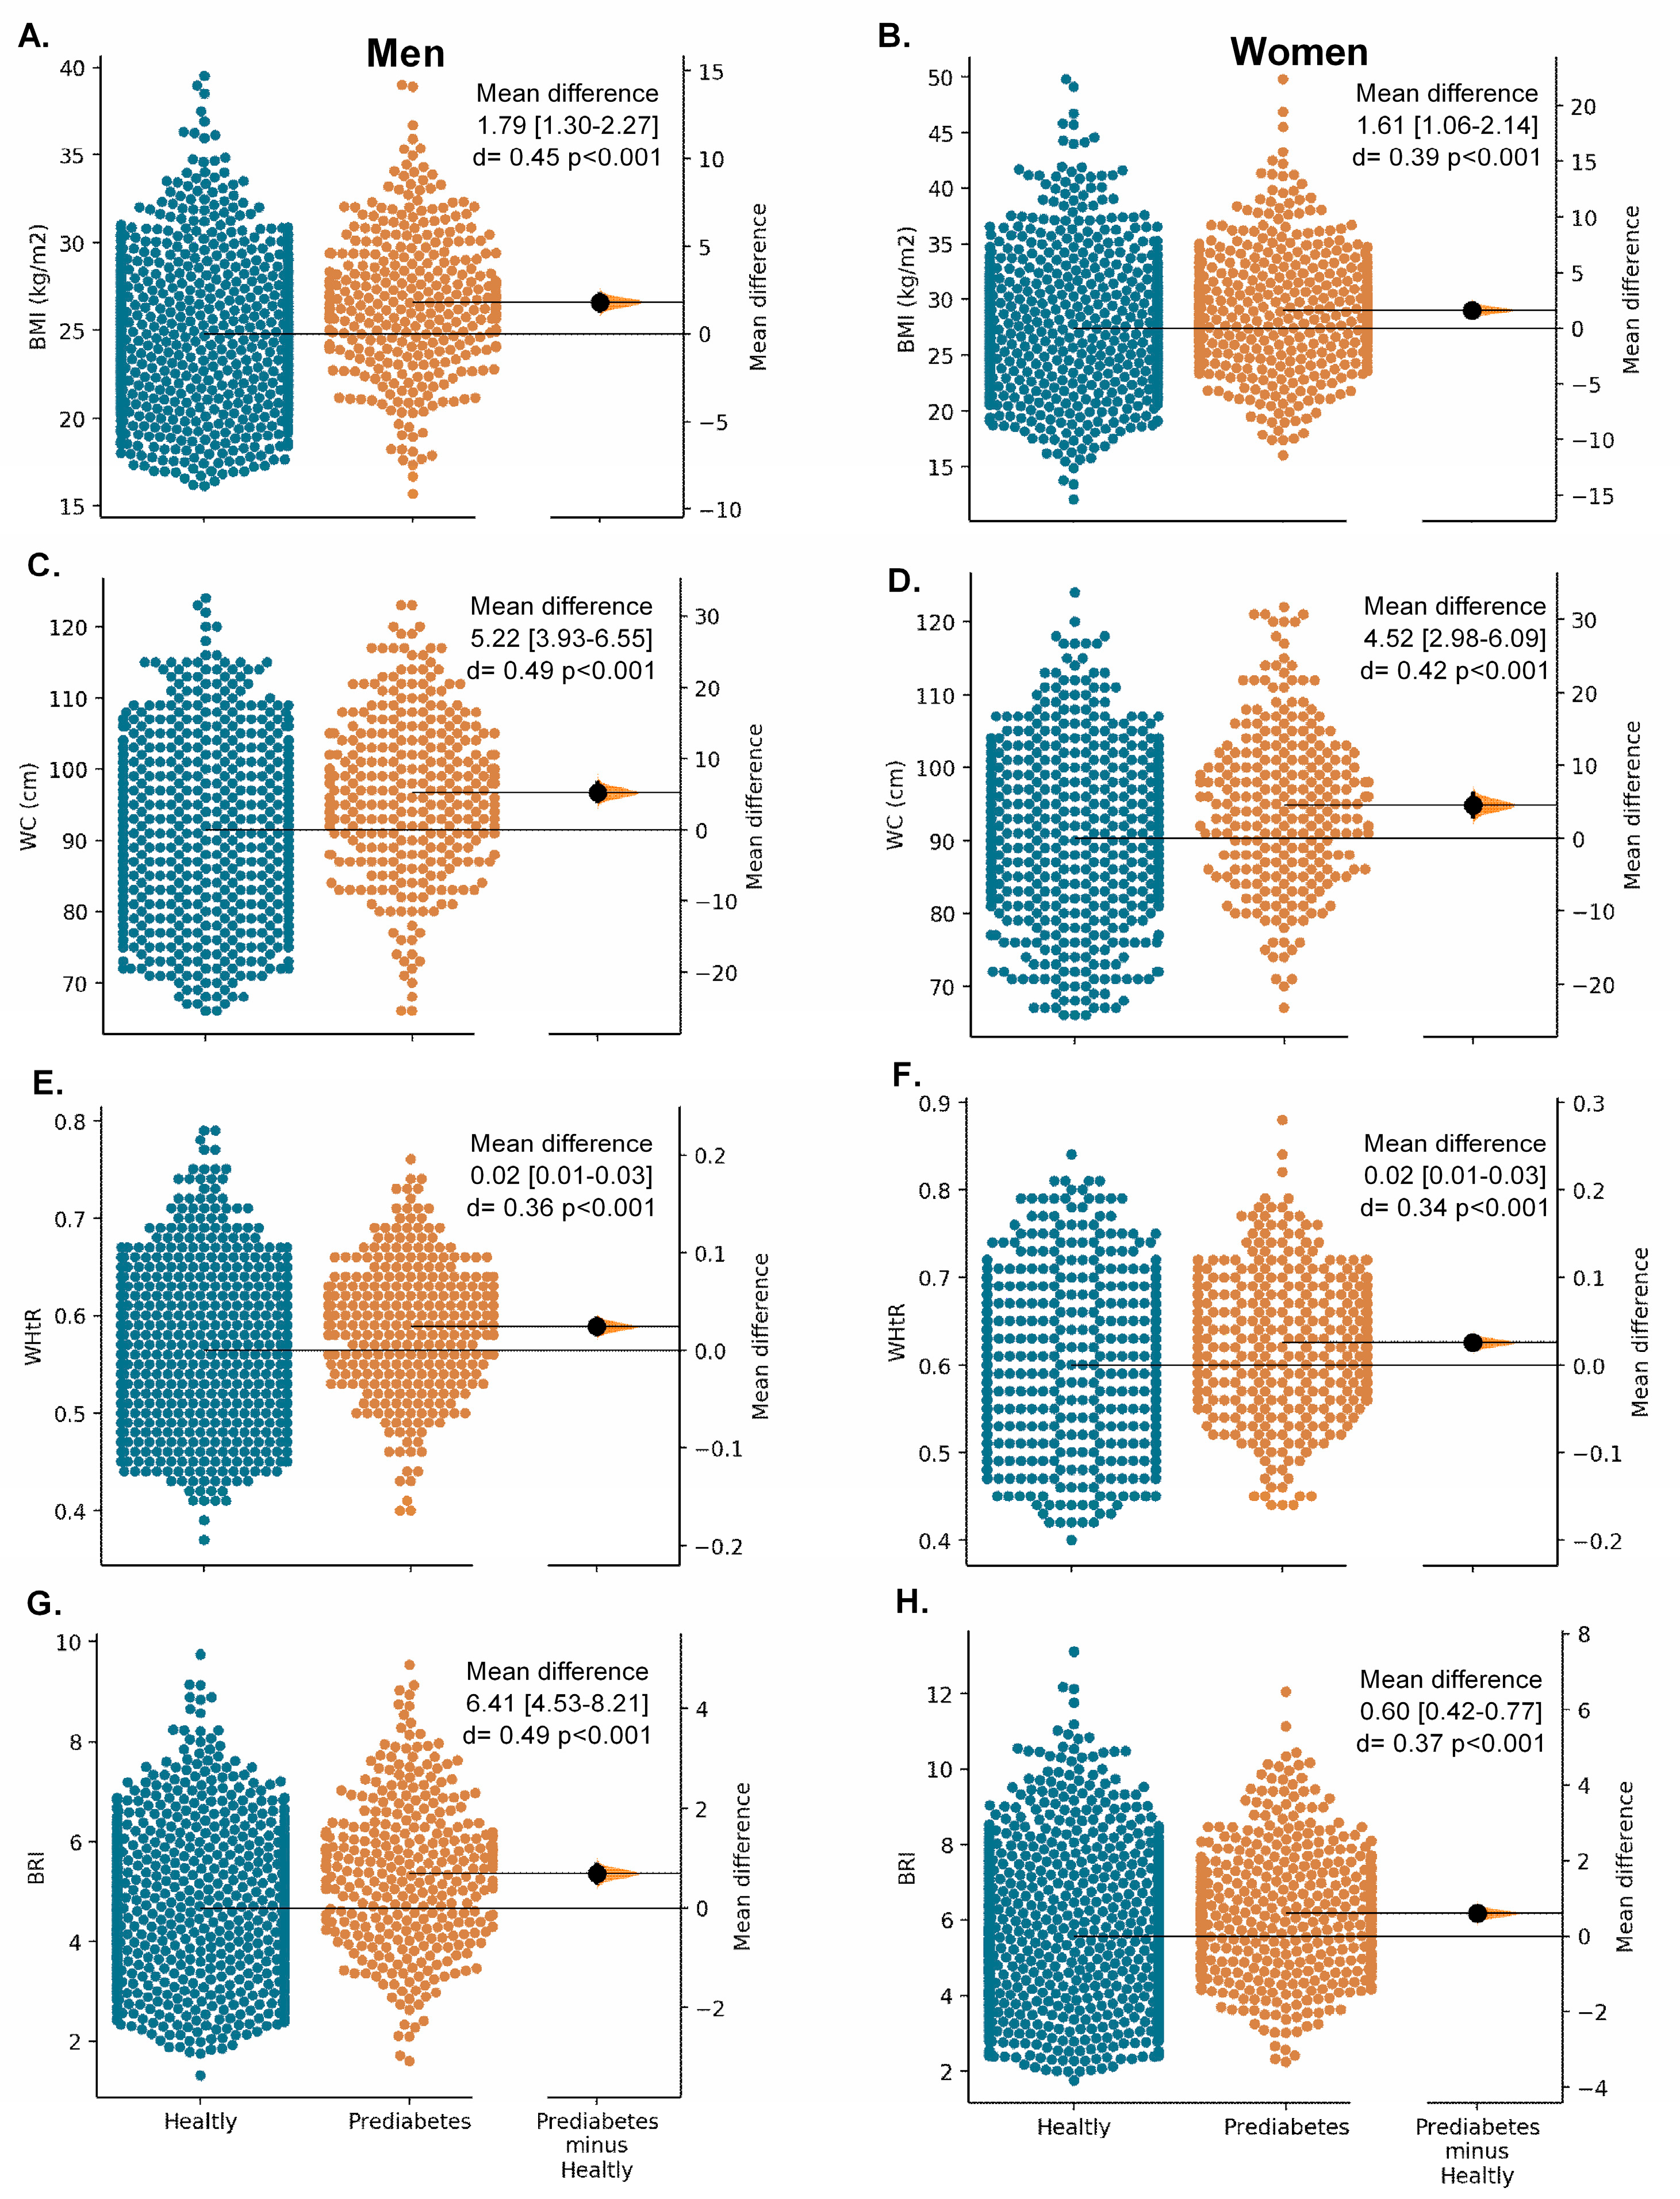
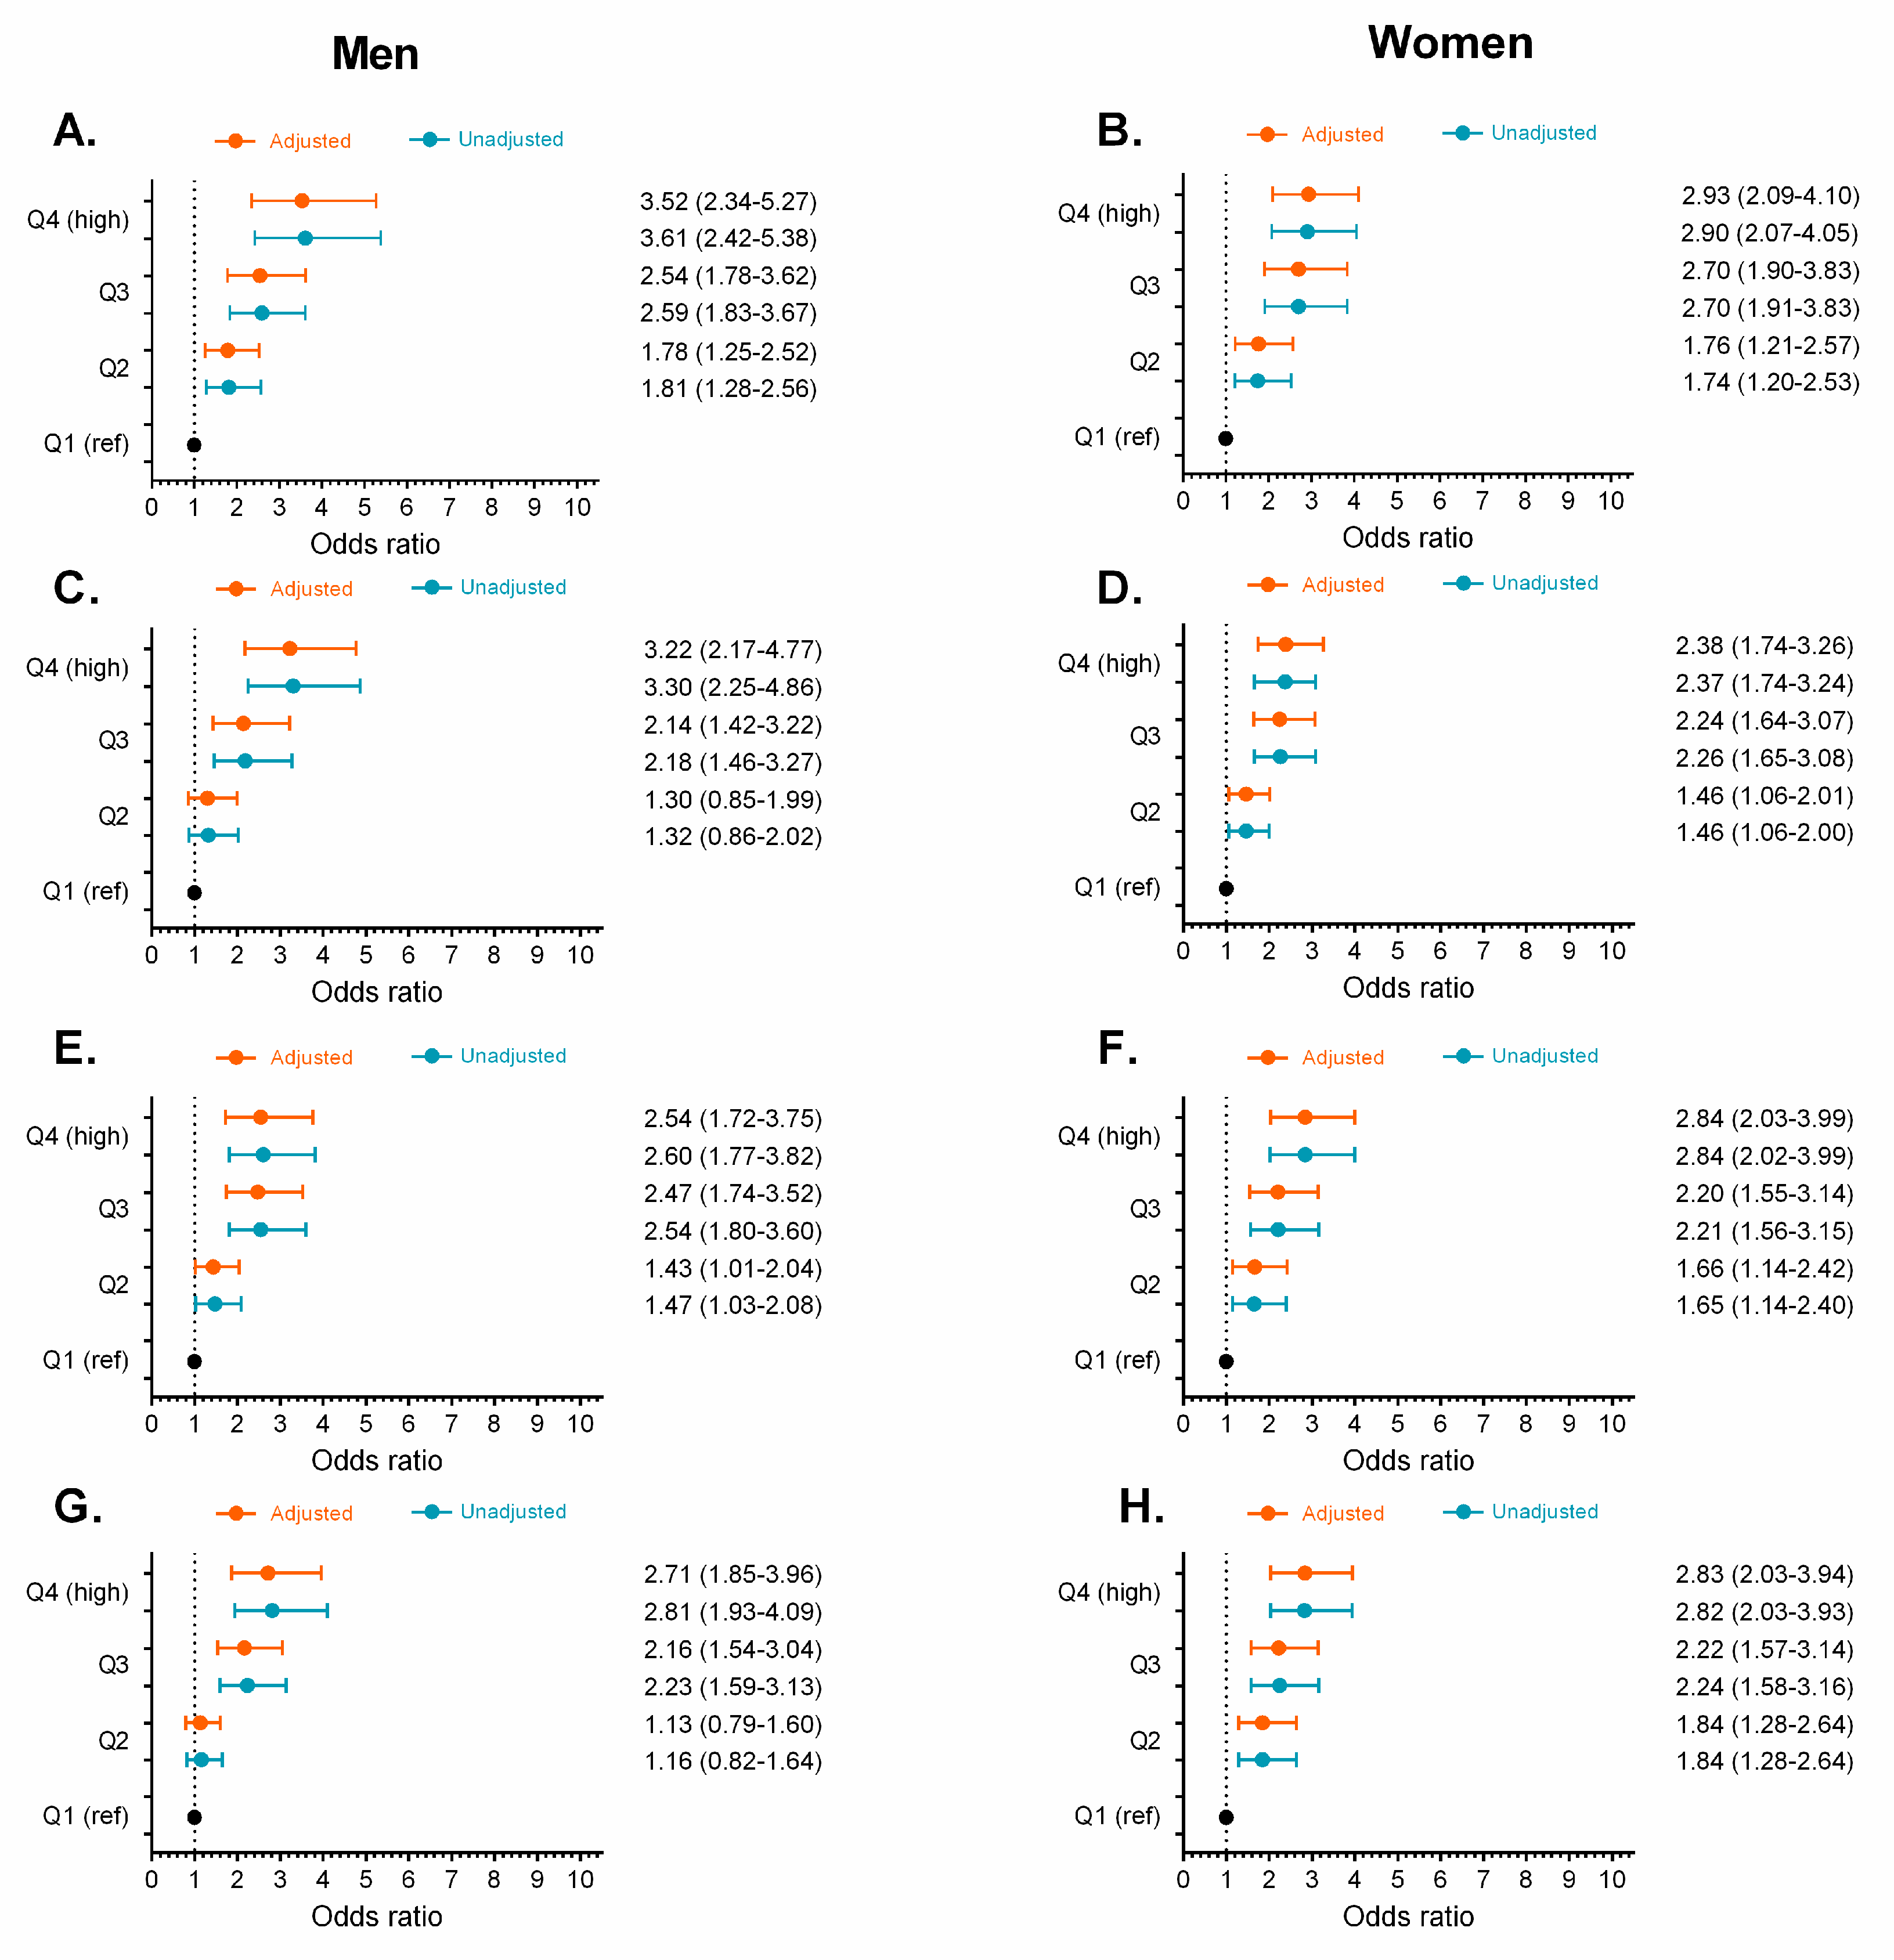
 ) and adjusted odds ratios (
 ) for prediabetes in quartiles (Q) of obesity- and lipid-related indices by sex. BMI (A,B), WC (C,D), WHtR (E,F), and BRI (G,H) by sex. Odds ratio adjusted for age, smoking, drinking, and physical activity “proxy”. (Q1 reference “lowest” group), second quartile (Q2), third quartile (Q3), and fourth quartile (Q4 highest group).
 ) and adjusted odds ratios (
 ) for prediabetes in quartiles (Q) of obesity- and lipid-related indices by sex. BMI (A,B), WC (C,D), WHtR (E,F), and BRI (G,H) by sex. Odds ratio adjusted for age, smoking, drinking, and physical activity “proxy”. (Q1 reference “lowest” group), second quartile (Q2), third quartile (Q3), and fourth quartile (Q4 highest group).
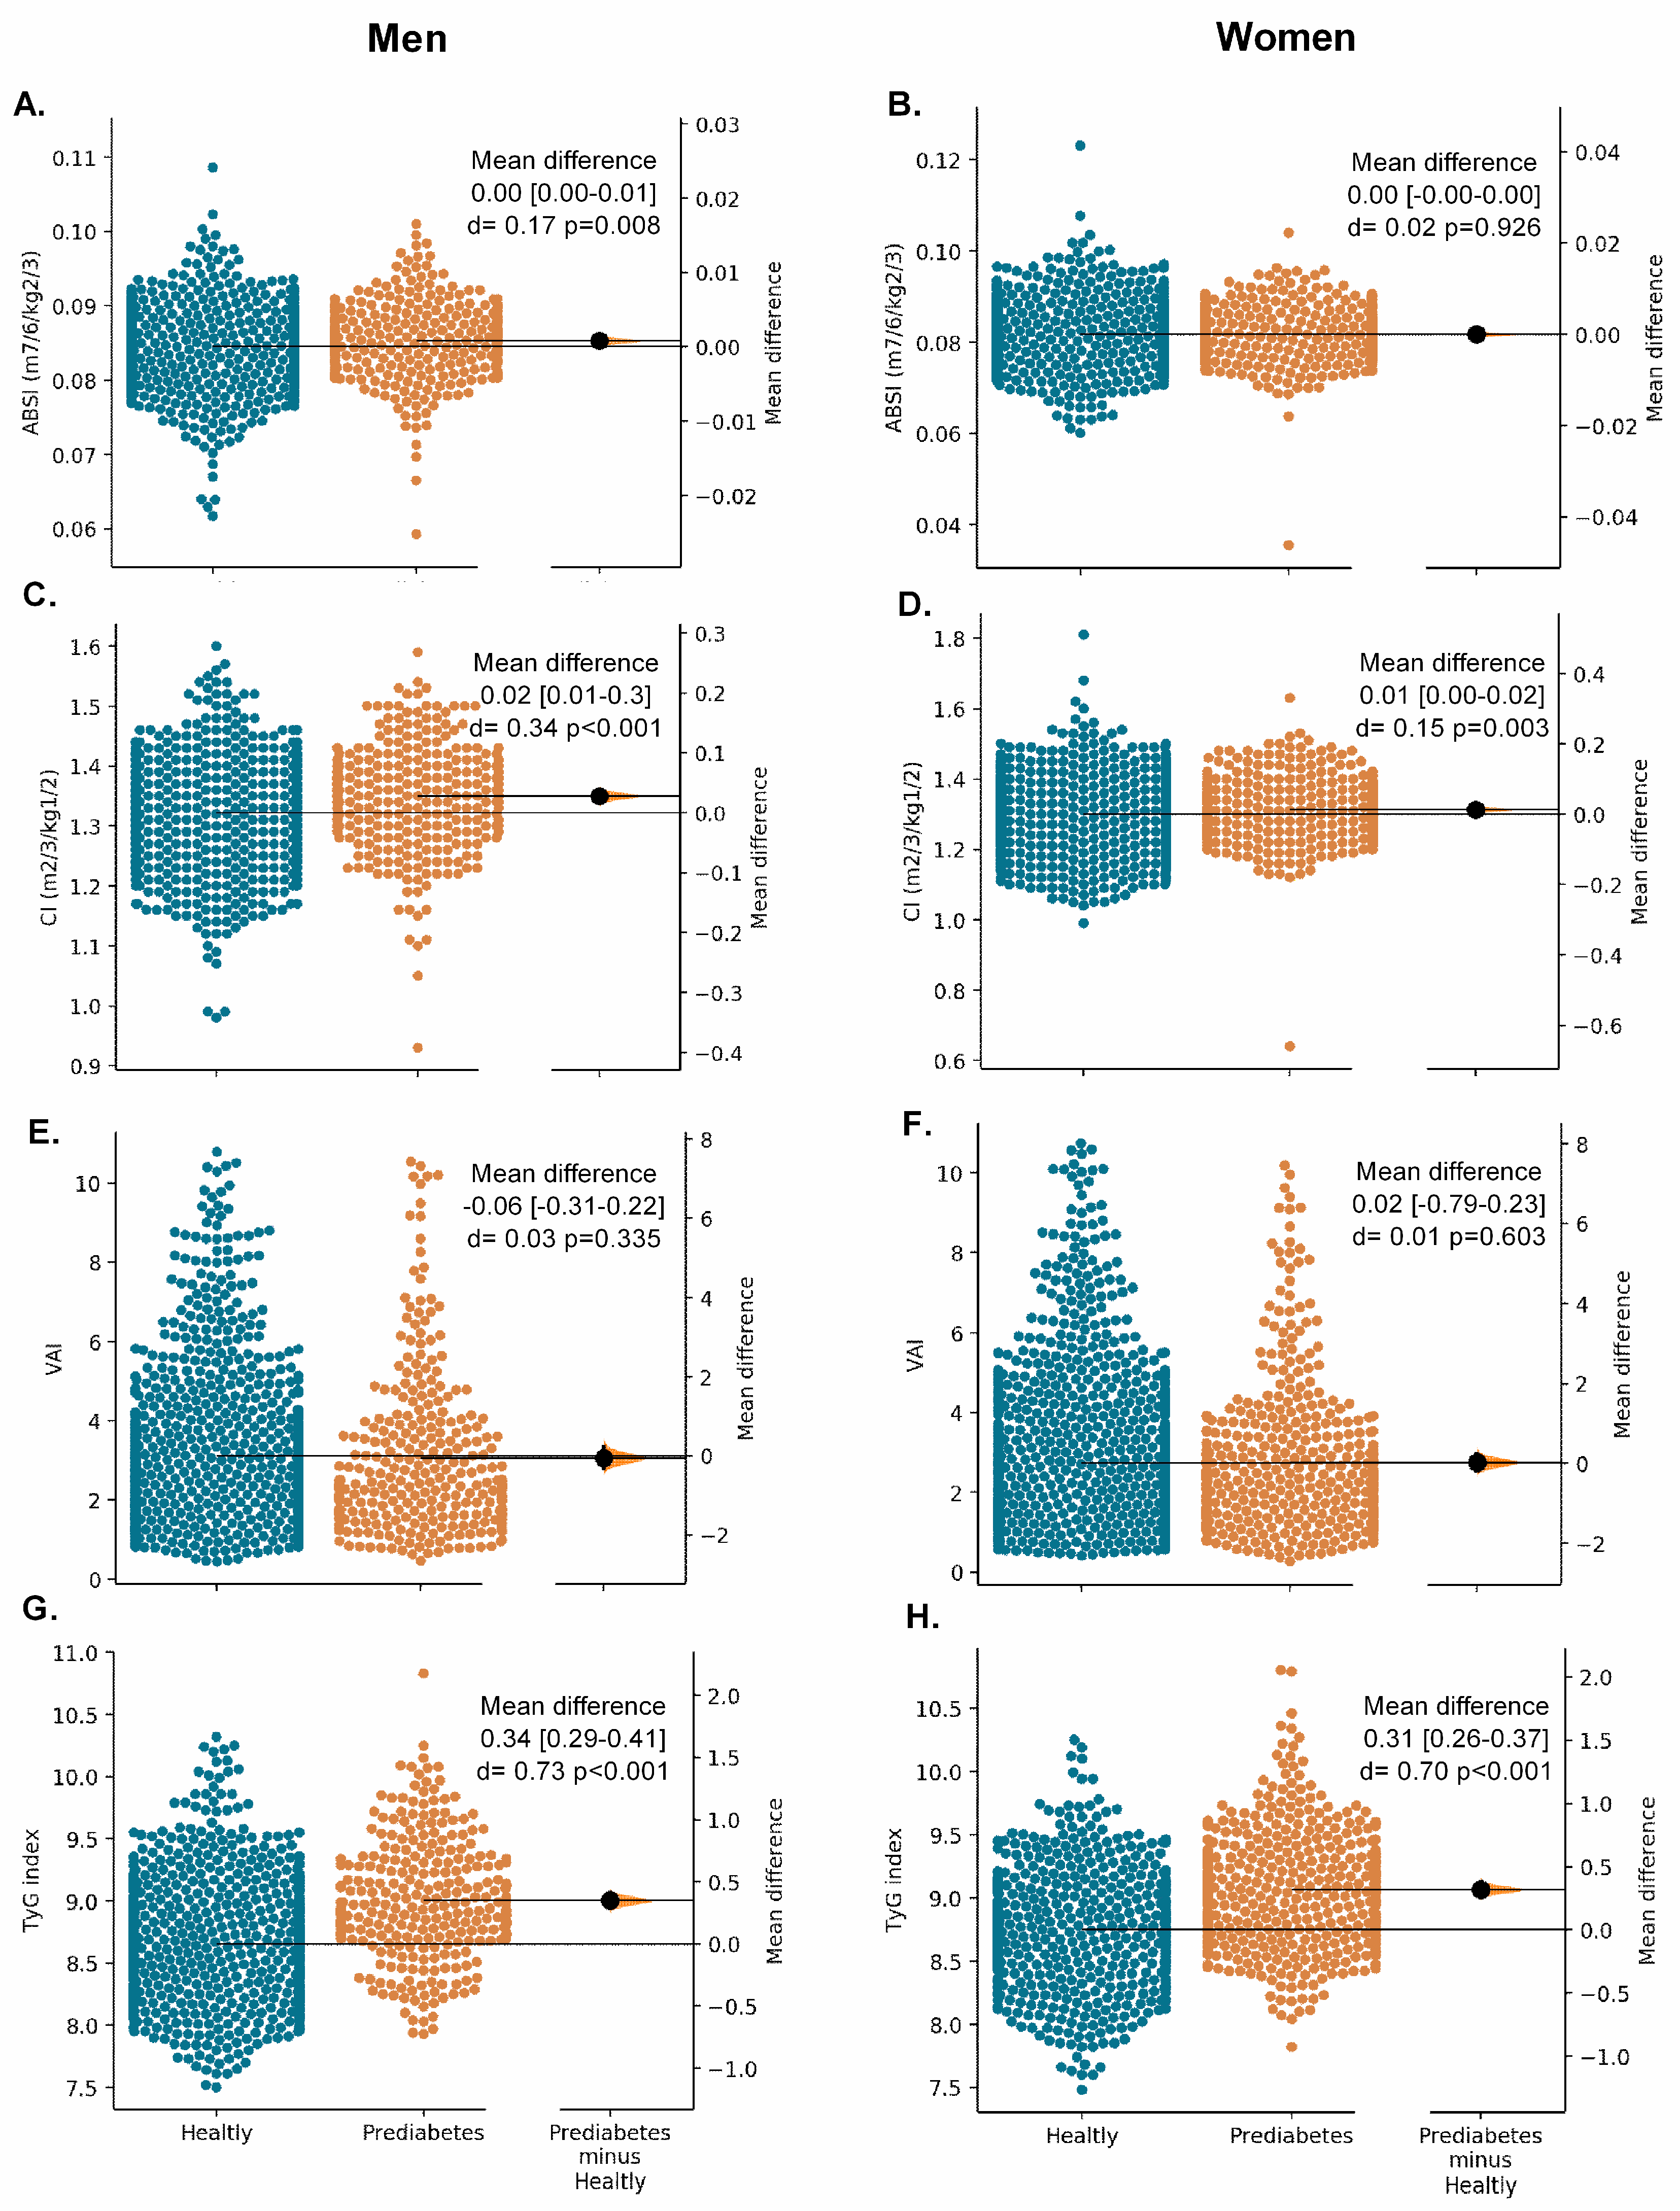
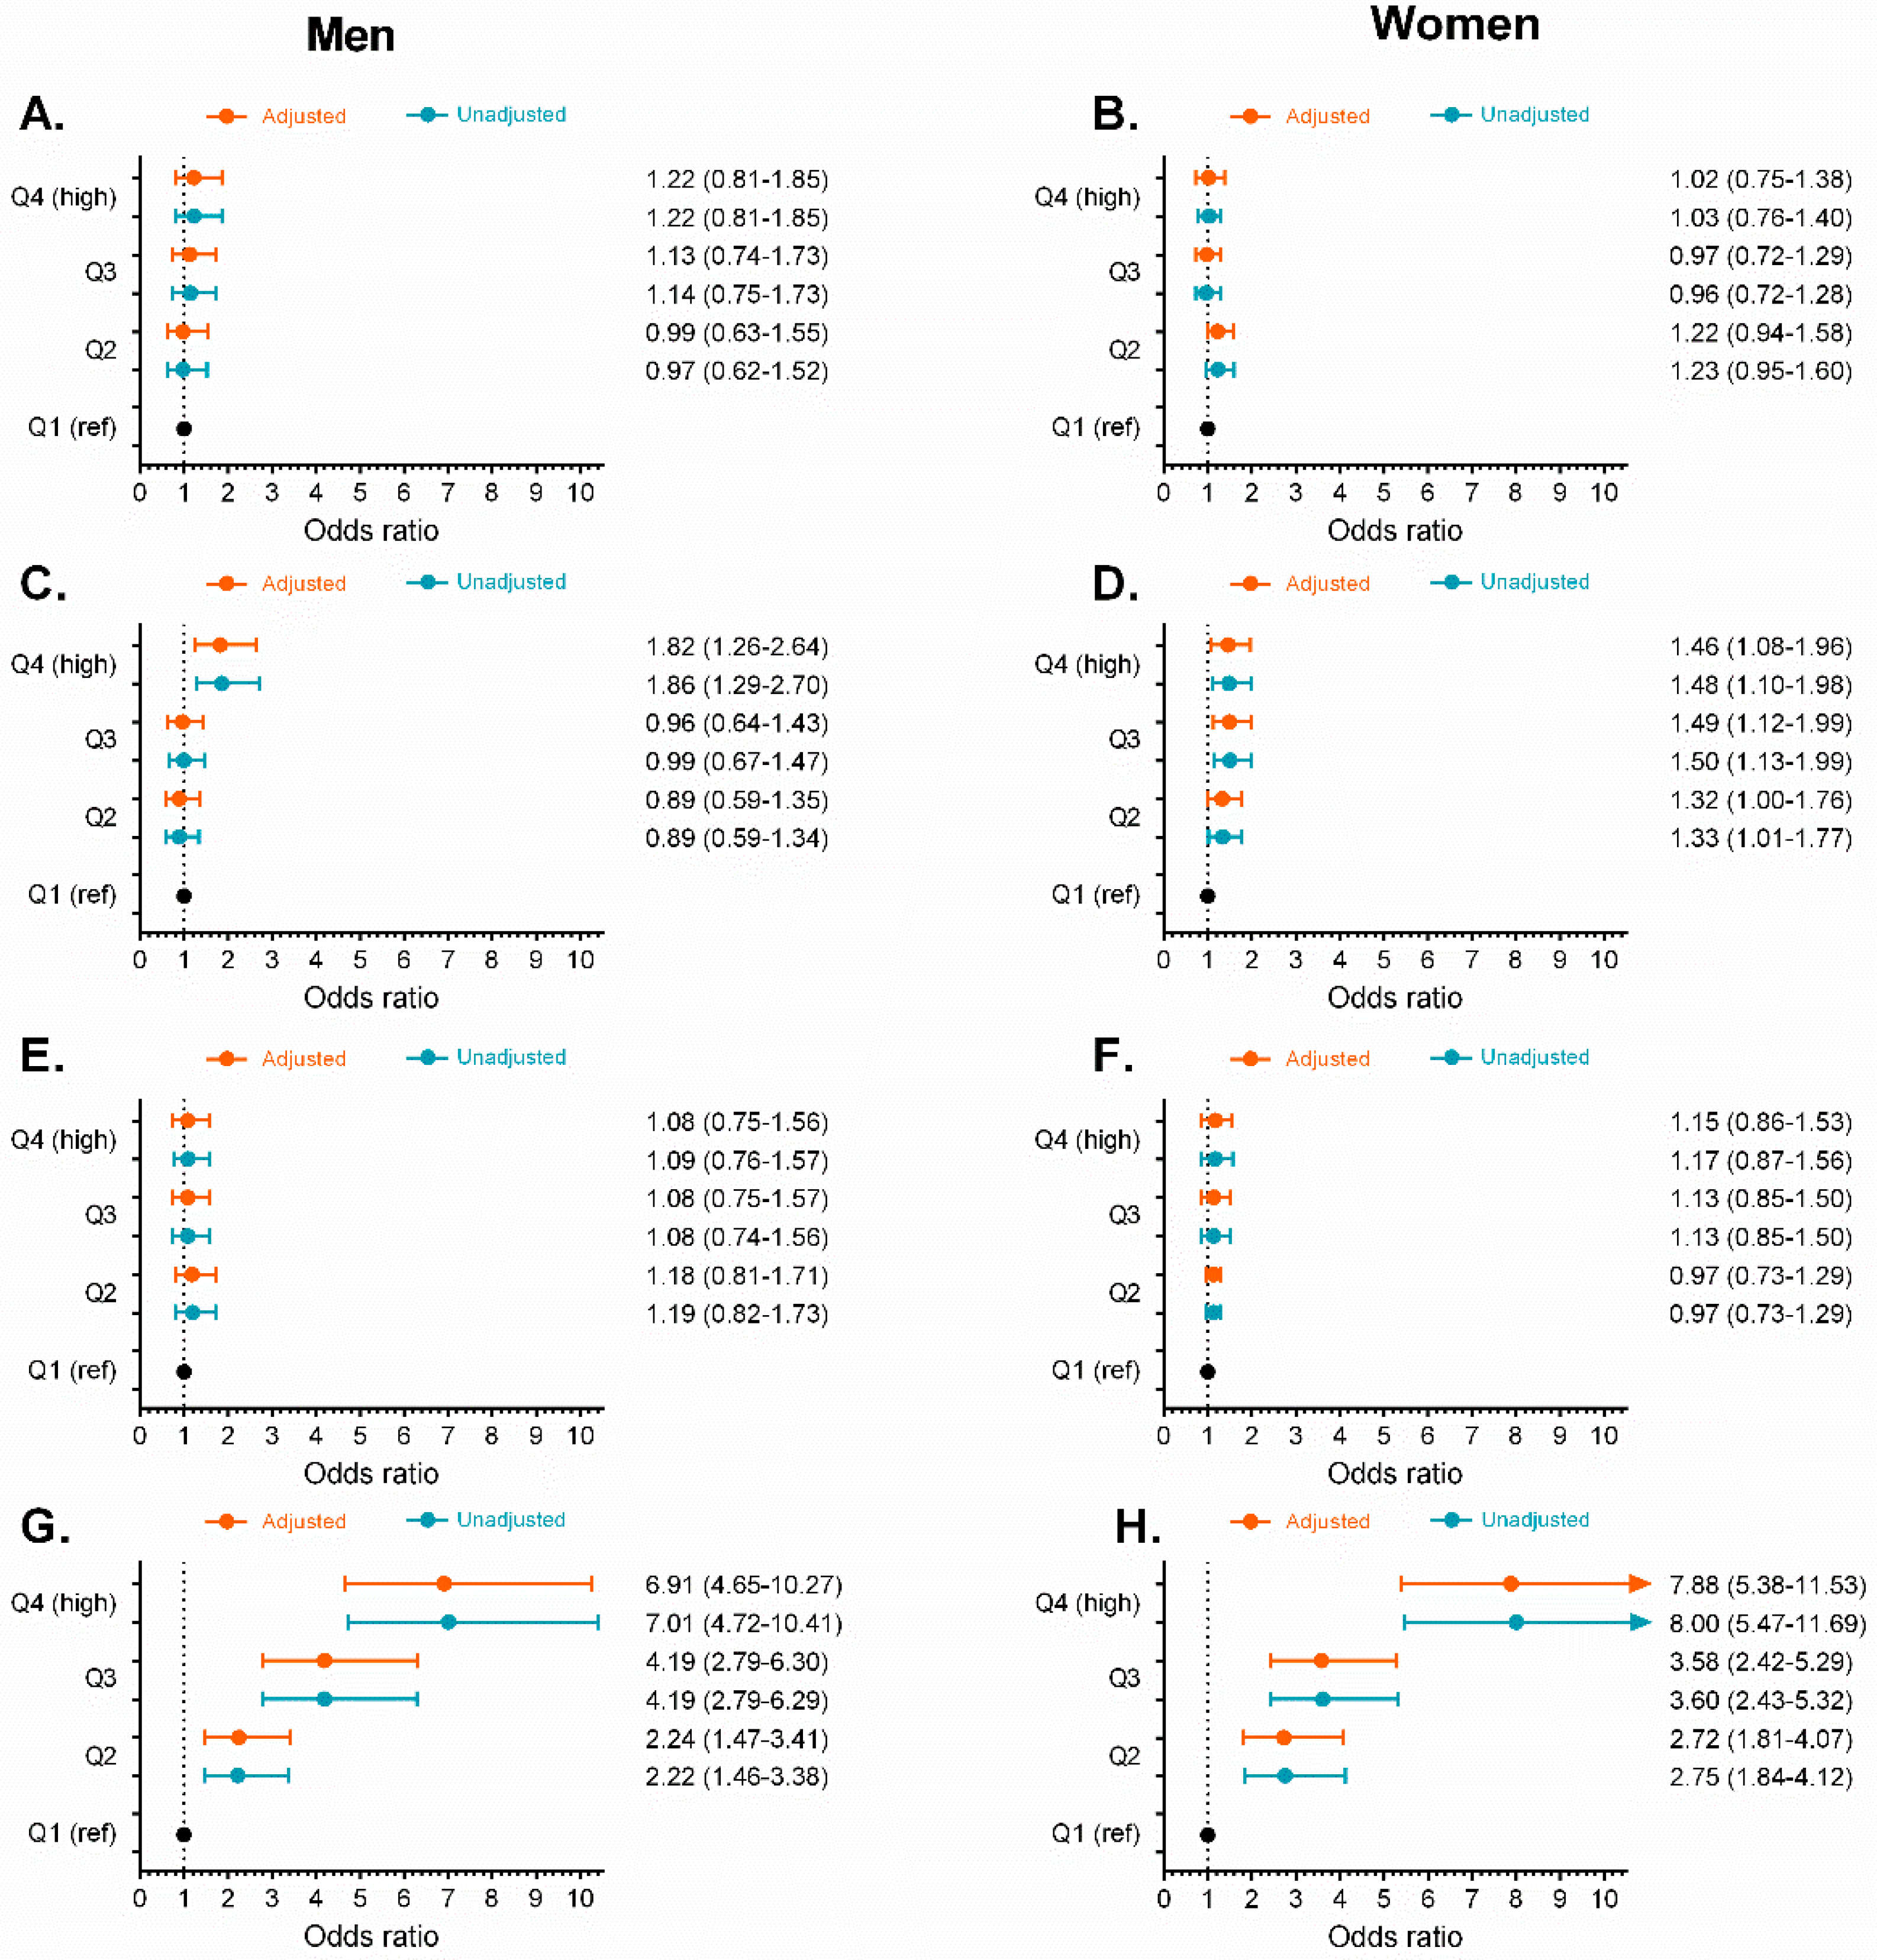
 ) and adjusted odds ratios (
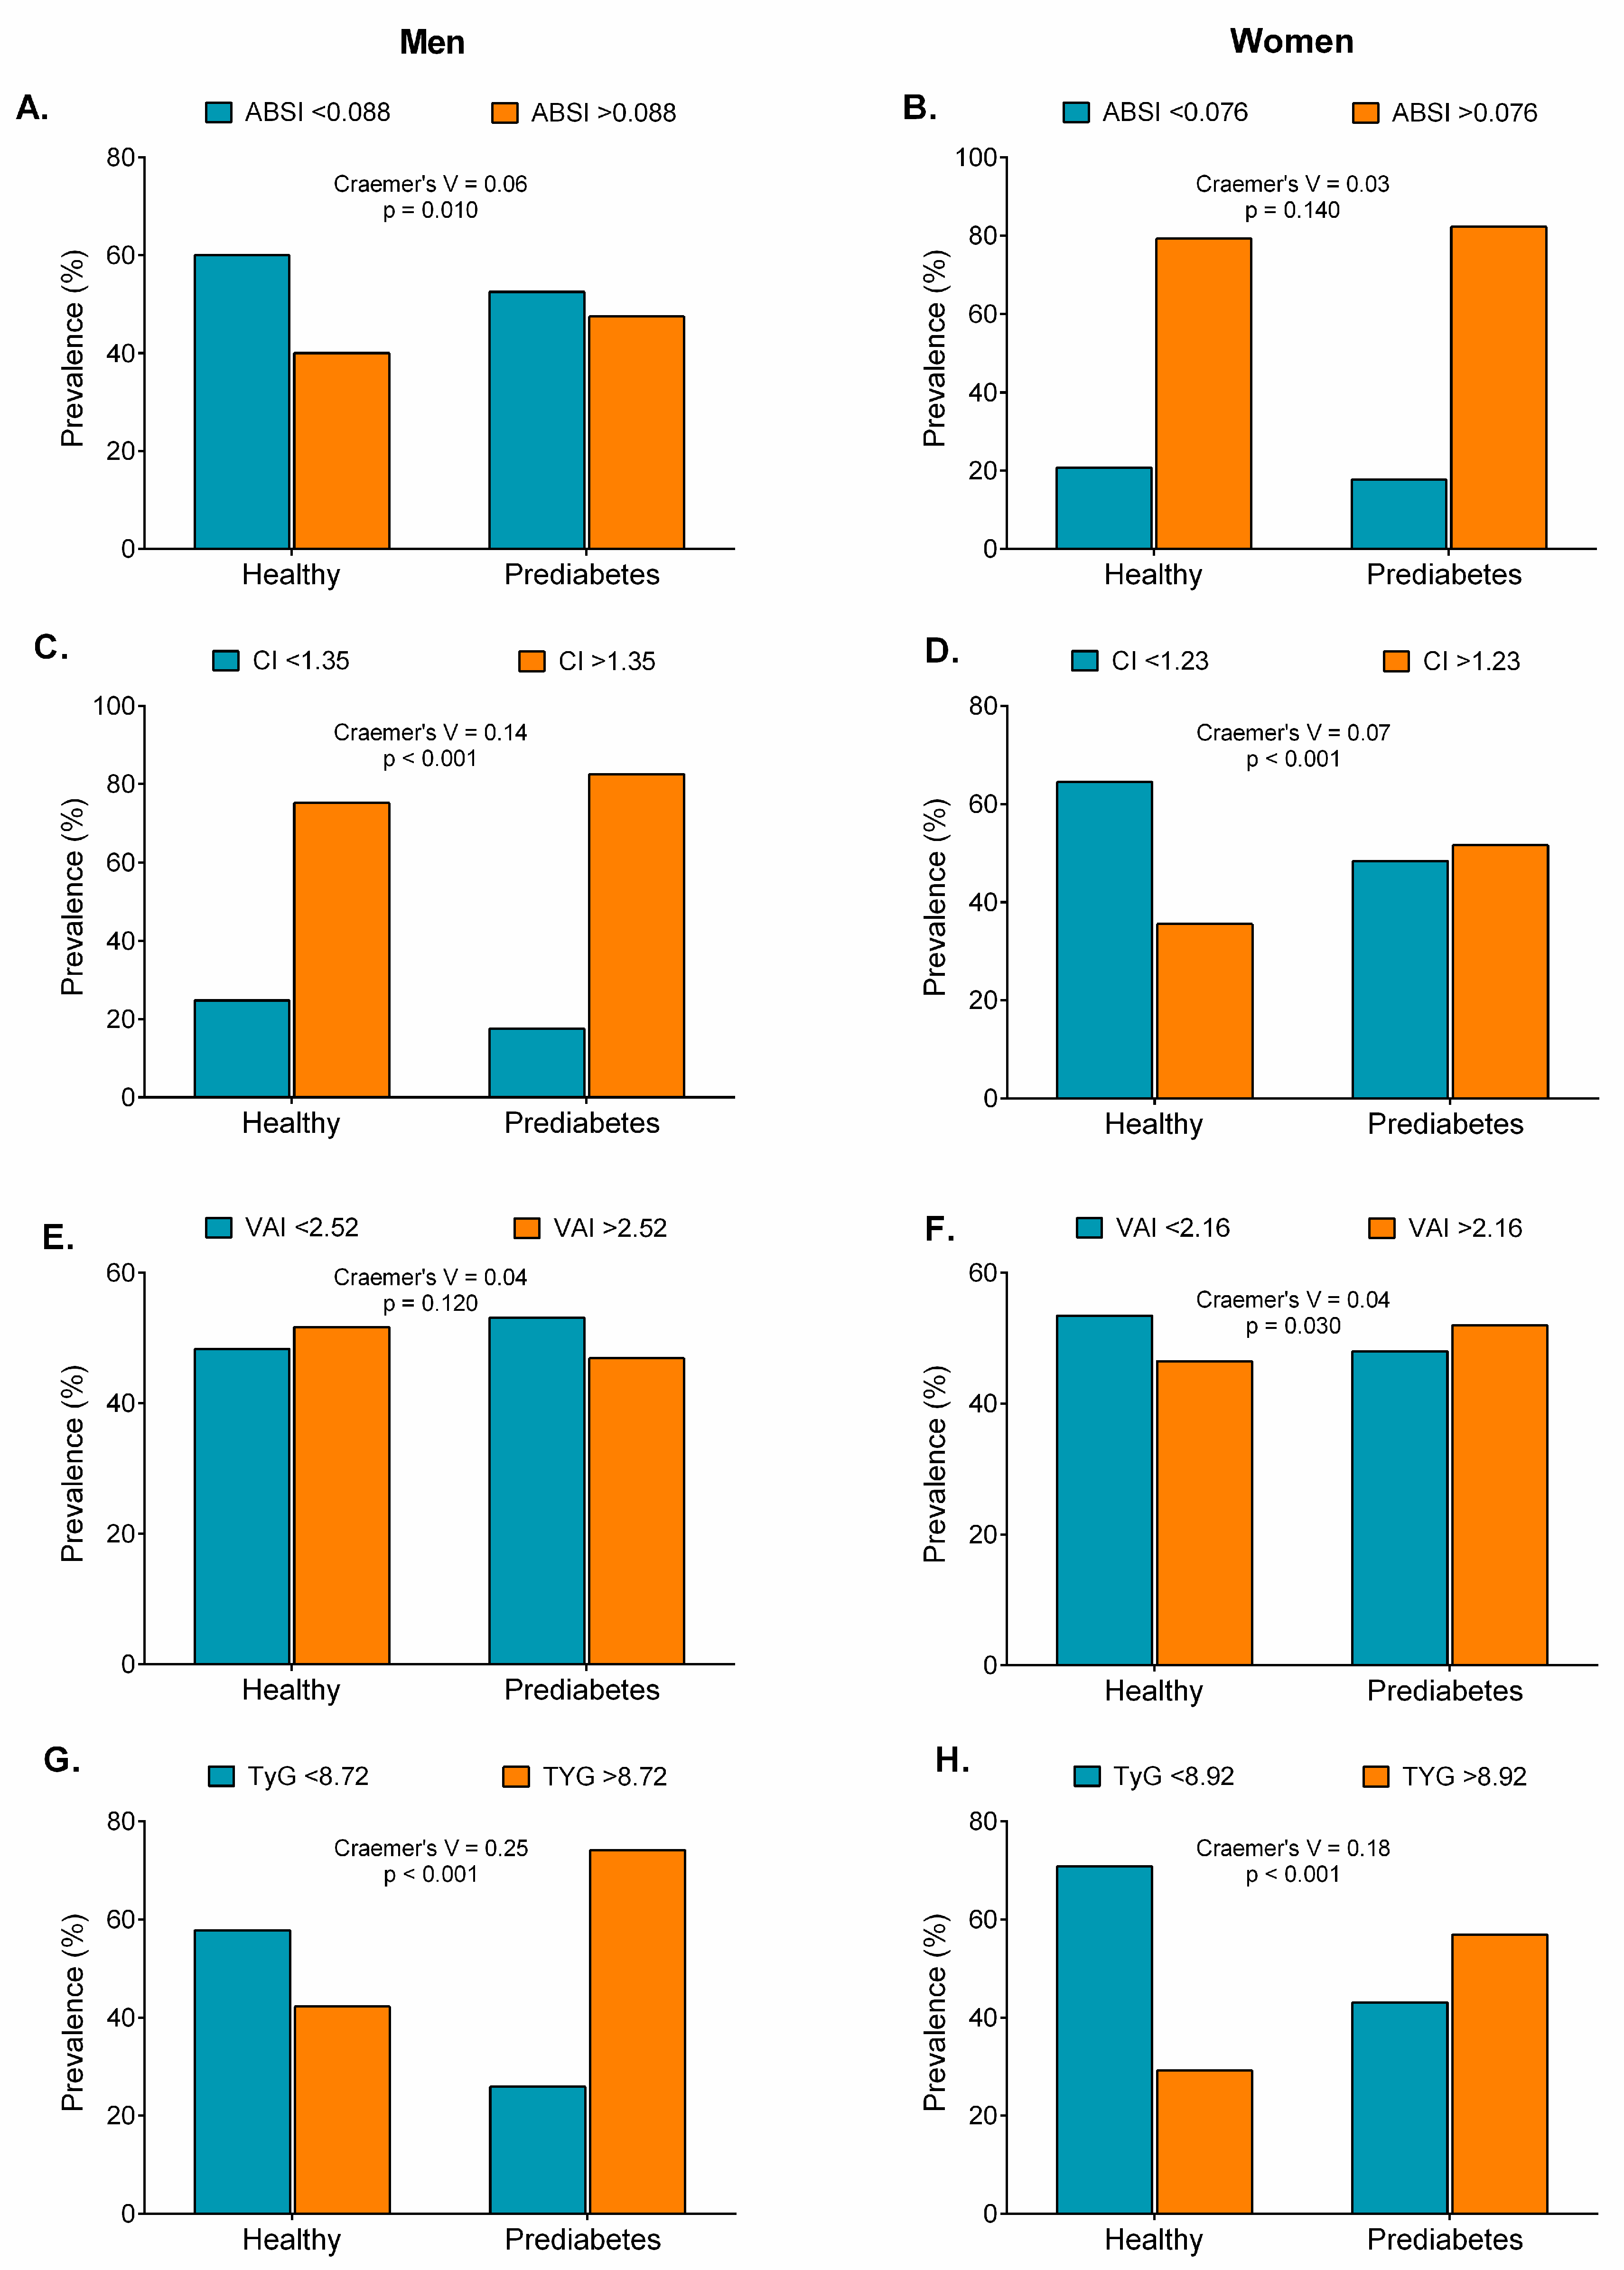
 ) for prediabetes in quartiles (Q) of obesity- and lipid-related indices by sex. ABSI Panel (A,B), C (C,D), VAI (E,F), and TyG (G,H) by sex. Odds ratio adjusted for age, smoking, drinking, and physical activity “proxy”. (Q1 reference “lowest” group), second quartile (Q2), third quartile (Q3), and fourth quartile (Q4 highest group).
 ) and adjusted odds ratios (
 ) for prediabetes in quartiles (Q) of obesity- and lipid-related indices by sex. ABSI Panel (A,B), C (C,D), VAI (E,F), and TyG (G,H) by sex. Odds ratio adjusted for age, smoking, drinking, and physical activity “proxy”. (Q1 reference “lowest” group), second quartile (Q2), third quartile (Q3), and fourth quartile (Q4 highest group).
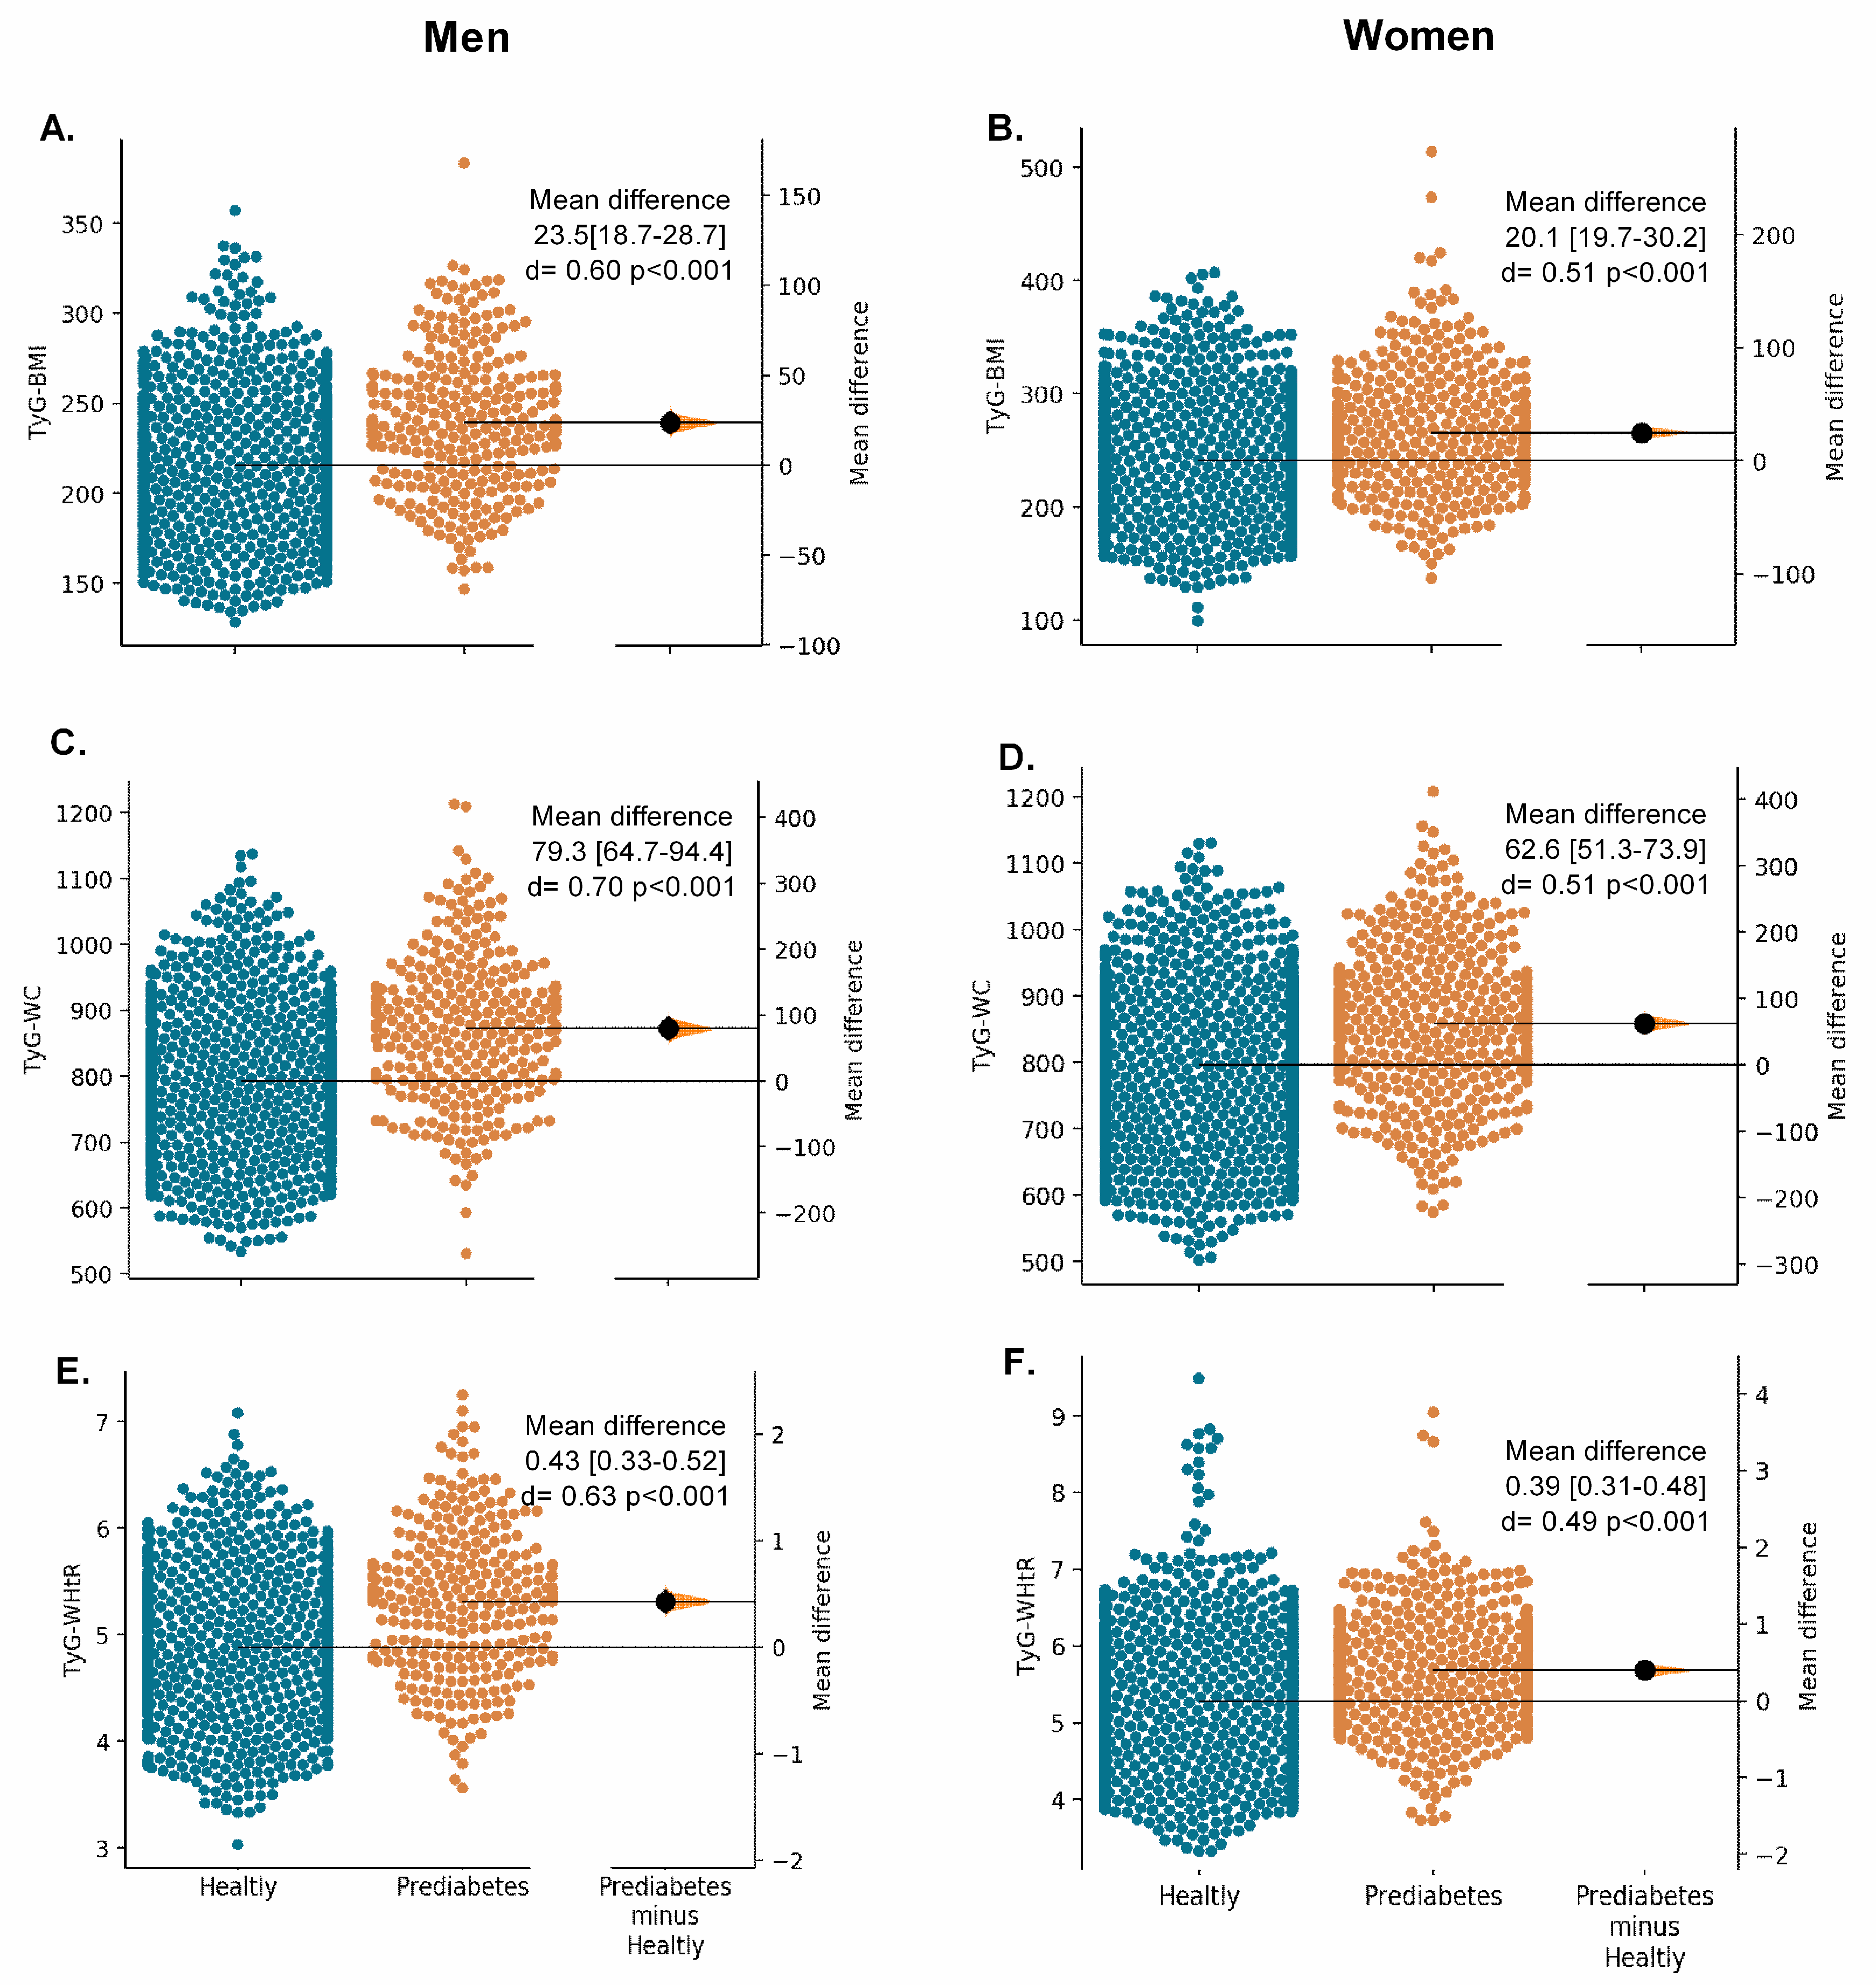
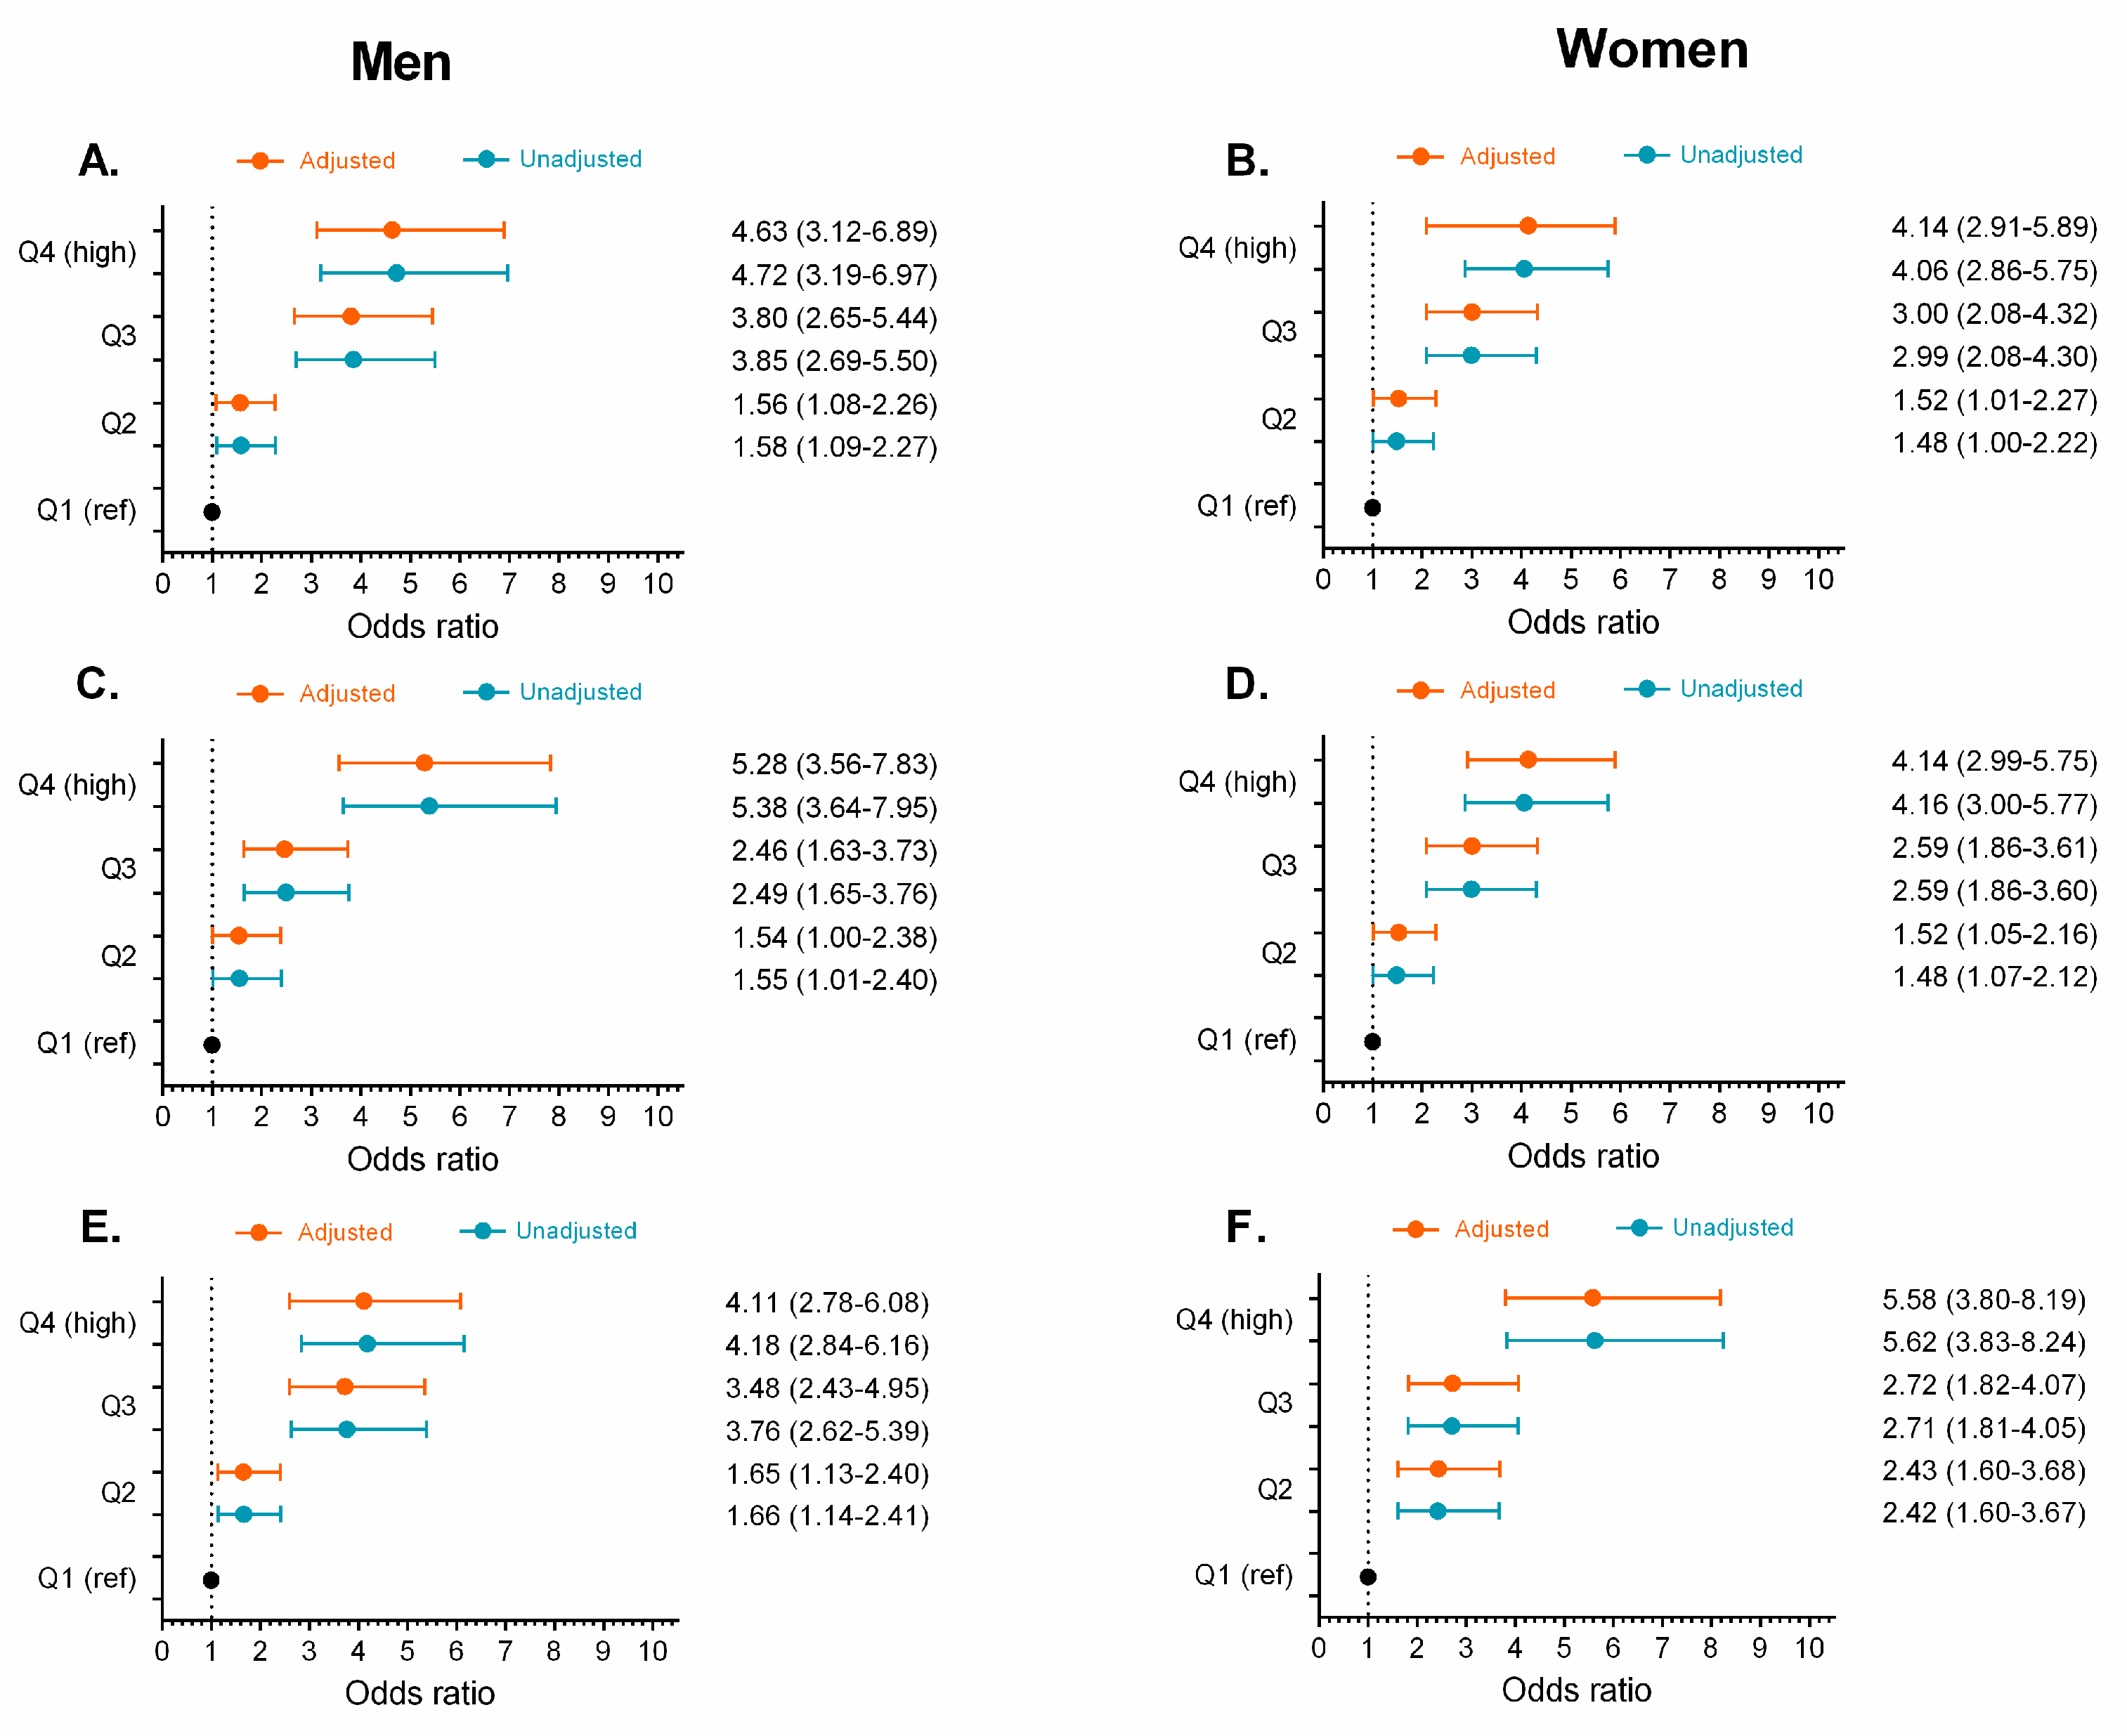
 ) and adjusted odds ratios (
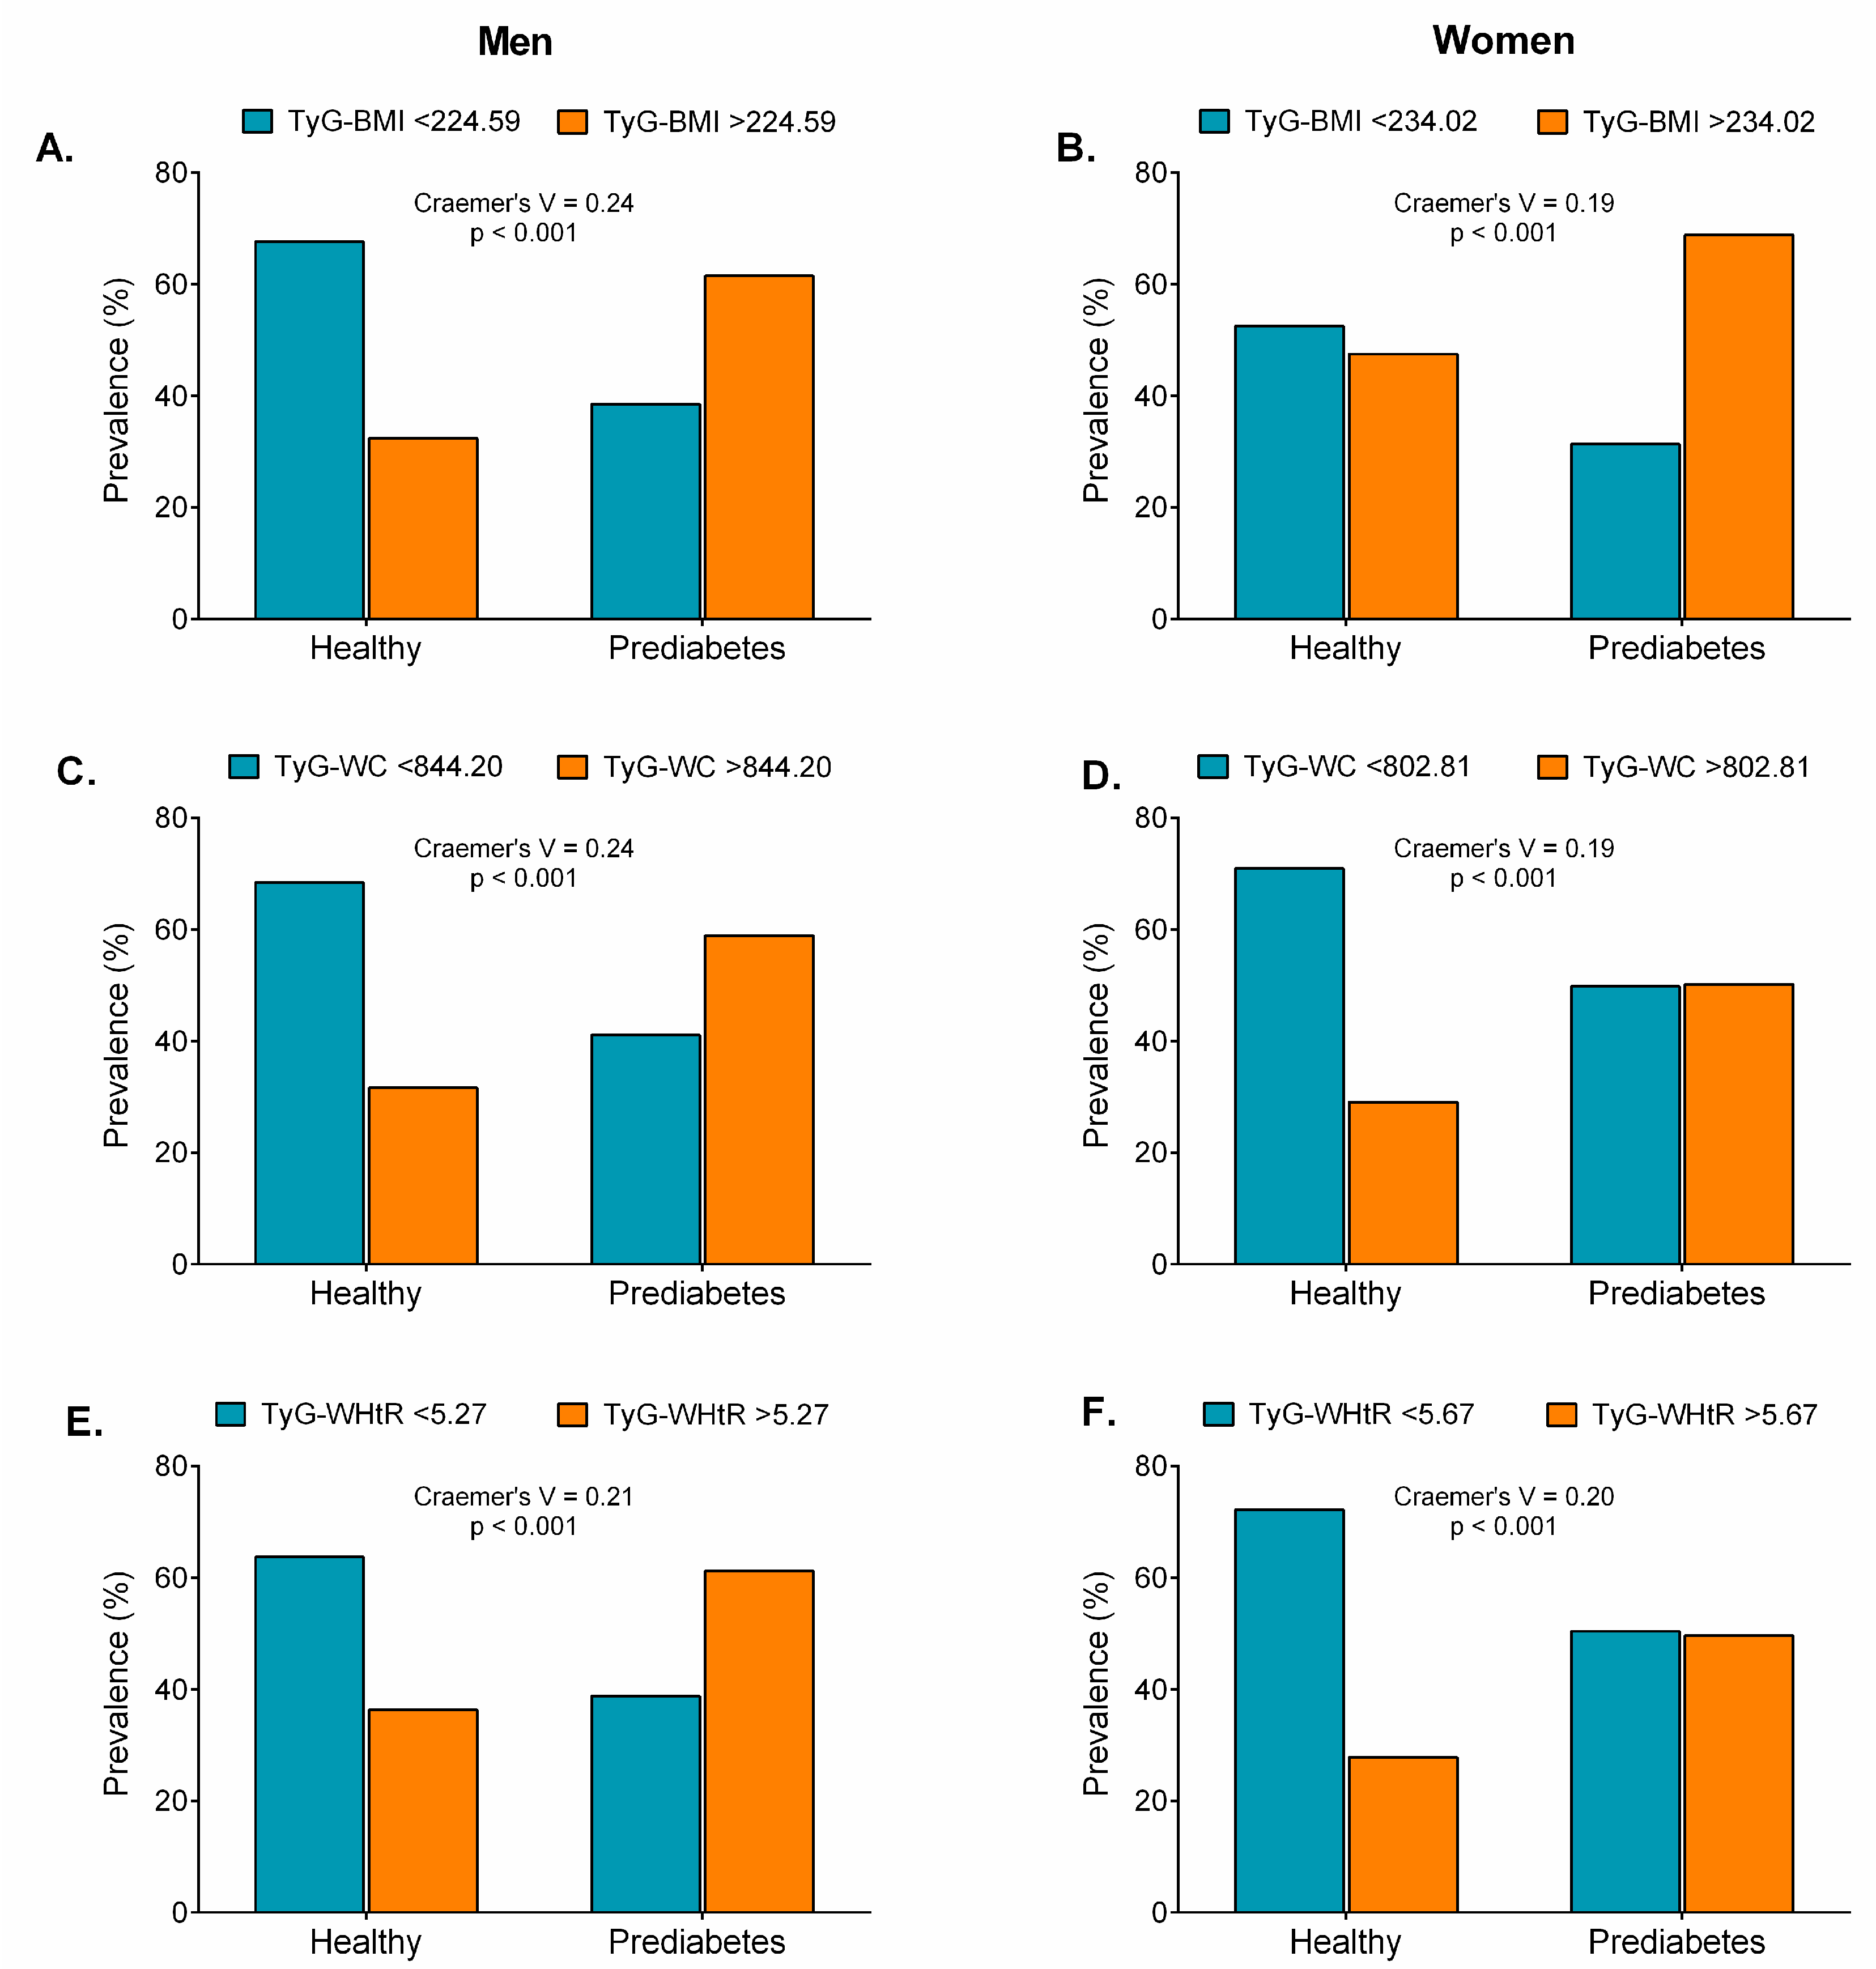
 ) for prediabetes in quartiles (Q) of obesity- and lipid-related indices by sex. TyG-BMI Panel (A,B), TyG-WC (C,D), TyG-WHtR (E,F) by sex. Odds ratio adjusted for age, smoking, drinking, and physical activity “proxy”. (Q1 reference “lowest” group), second quartile (Q2), third quartile (Q3), and fourth quartile (Q4 highest group).
 ) and adjusted odds ratios (
 ) for prediabetes in quartiles (Q) of obesity- and lipid-related indices by sex. TyG-BMI Panel (A,B), TyG-WC (C,D), TyG-WHtR (E,F) by sex. Odds ratio adjusted for age, smoking, drinking, and physical activity “proxy”. (Q1 reference “lowest” group), second quartile (Q2), third quartile (Q3), and fourth quartile (Q4 highest group).
| Variables | Total Sample (n = 3307) | Healthy (n = 2468) | Prediabetes (n = 839) | p for Groups |
|---|---|---|---|---|
| Age | 69.8 (7.6) | 69.7 (7.6) | 70.2 (7.7) | 0.331 |
| Anthropometric | ||||
| Height (m) | 1.56 (0.08) | 1.56 (0.08) | 1.55 (0.11) | 0.143 |
| Weight (kg) | 65.1 (12.79) | 63.84 (12.21) | 68.1 (13.42) | <0.001 |
| BMI (kg/m2) | 26.78 (5.02) | 26.32 (4.94) | 28.13 (5.00) | <0.001 |
| WC (cm) | 92.20 (10.93) | 91.1 (10.93) | 95.41 (10.61) | <0.001 |
| Waist height ratio | 0.58 (0.09) | 0.58 (0.09) | 0.60 (0.08) | <0.001 |
| Triglycerides (mg/dL) | 159.55 (86.61) | 153.43 (81.47) | 175.43 (95.56) | <0.001 |
| Glucose (mg/dL) | 92.61 (11.61) | 87.48 (8.43) | 107.17 (6.49) | <0.001 |
| Obesity Indices | ||||
| BRI | 5.14 (2.02) | 5.00 (1.97) | 5.55 (2.10) | <0.001 |
| ABSI (m7/6/kg2/3) | 0.0803 (0.015) | 0.0805 (0.014) | 0.799 (0.017) | 0.316 |
| C (m2/3/kg1/2) | 1.27 (0.24) | 1.271 (0.23) | 1.276 (0.27) | 0.634 |
| VAI | 3.00 (3.16) | 3.00 (3.15) | 3.10 (3.19) | 0.445 |
| TyG index | 8.78 (0.49) | 8.70 (0.47) | 9.03 (0.46) | <0.001 |
| TyG-BMI | 236.0 (48.90) | 229.63 (47.25) | 254.64 (48.92) | <0.001 |
| TyG-WC | 811.29 (116.65) | 794.31 (111.94) | 863.90 (112.58) | <0.001 |
| TyG-WHtR | 5.18 (0.91) | 5.07 (0.91) | 5.51 (0.82) | <0.001 |
| Weight Status | ||||
| Underweight | 78 (2.4) | 66 (2.7) | 12 (1.4) | 0.305 |
| Normal weight | 1046 (31.6) | 858 (34.8) | 188 (22.4) | <0.001 |
| Overweight | 1299 (39.3) | 943 (38.2) | 356 (42.4) | 0.209 |
| Obesity | 884 (26.7) | 601 (24.4) | 283 (33.7) | 0.006 |
| Socioeconomic Status, n (%) | ||||
| 1 to 3 (Low) | 3201 (96.8) | 2388 (96.8) | 813 (96.9) | 0.917 |
| 4 to 6 (Medium to high) | 106 (3.2) | 80 (3.2) | 26 (3.1) | 0.536 |
| Smoking Status, n (%) | ||||
| Yes | 337 (10.2) | 269 (10.9) | 68 (8.1) | 0.739 |
| No | 2970 (89.8) | 2199 (89.1) | 771 (91.8) | 0.462 |
| Alcohol Intake, n (%) | ||||
| Yes | 418 (12.6) | 326 (13.2) | 92 (11.0) | 0.739 |
| No | 2889 (87.4) | 2142 (86.8) | 747 (89.0) | 0.043 |
| Physical Activity “proxy”, n (%) | ||||
| Physically active | 1503 (45.4) | 1025 (41.5) | 478 (57.0) | <0.001 |
| Non-Physically active | 1804 (54.6) | 1443 (58.5) | 361 (43.0) | <0.001 |
| Self-Report Comorbid Chronic Diseases, n (%) | ||||
| Hypertension | 1023 (30.9) | 867 (35.1) | 156 (18.6) | <0.001 |
| Respiratory diseases | 217 (6.6) | 149 (6.0) | 68 (8.1) | 0.798 |
| Cardiovascular diseases | 311 (9.4) | 219 (8.9) | 92 (11.2) | 0.737 |
| Stroke | 61 (1.8) | 44 (1.8) | 17 (2.0) | 0.314 |
| Osteoporosis | 397 (12.0) | 303 (12.3) | 94 (11.2) | 0.936 |
| Cancer | 109 (3.3) | 84 (3.4) | 25 (3.0) | 0.590 |
| Hearing loss | 270 (8.2) | 102 (4.1) | 168 (20.0) | <0.001 |
| Vision loss | 919 (27.8) | 700 (28.4) | 219 (26.1) | 0.622 |
| Parameters | BMI | WC | WHtR | BRI | ABSI | C | VAI | TyG | TyG-BMI | TyG-WC | TyG-WHtR |
|---|---|---|---|---|---|---|---|---|---|---|---|
| Men | |||||||||||
| Area under curve | 0.633 | 0.640 | 0.613 | 0.617 | 0.534 | 0.580 | 0.564 | 0.700 | 0.674 | 0.689 | 0.667 |
| Effect Size | 0.48 | 0.50 | 0.40 | 0.42 | 0.12 | 0.28 | 0.22 | 0.74 | 0.63 | 0.69 | 0.61 |
| Odds Ratio | 2.38 | 2.50 | 2.08 | 2.14 | 1.24 | 1.67 | 1.51 | 3.86 | 3.17 | 3.53 | 3.02 |
| P-value | <0.001 | <0.001 | <0.001 | <0.001 | 0.066 | <0.001 | <0.001 | <0.001 | <0.001 | <0.001 | <0.001 |
| Optimal cutoffs | 25.58 | 96.0 | 0.57 | 4.96 | 0.088 | 1.35 | 2.52 | 8.72 | 224.59 | 844.20 | 5.27 |
| J-Youden | 0.23 | 0.21 | 0.19 | 0.20 | 0.080 | 0.14 | 0.12 | 0.32 | 0.30 | 0.29 | 0.28 |
| Sensitivity (%) | 62.10 | 59.10 | 61.21 | 58.43 | 21.87 | 56.10 | 60.89 | 75.63 | 68.04 | 61.26 | 55.18 |
| Specificity (%) | 60.93 | 62.18 | 58.57 | 62.45 | 86.36 | 58.49 | 51.95 | 57.05 | 62.19 | 68.63 | 73.56 |
| (+) Likelihood ratio | 1.59 | 1.56 | 1.57 | 1.56 | 1.60 | 1.35 | 1.27 | 1.74 | 1.80 | 1.95 | 2.09 |
| (−) Likelihood ratio | 0.62 | 0.56 | 0.68 | 0.67 | 0.90 | 0.75 | 0.75 | 0.43 | 0.52 | 0.56 | 0.61 |
| Women | |||||||||||
| Area under curve | 0.603 | 0.597 | 0.600 | 0.596 | 0.504 | 0.573 | 0.575 | 0.695 | 0.642 | 0.654 | 0.655 |
| Effect Size | 0.36 | 0.34 | 0.35 | 0.34 | 0.01 | 0.26 | 0.26 | 0.72 | 0.51 | 0.56 | 0.56 |
| Odds Ratio | 1.95 | 1.87 | 1.91 | 1.86 | 1.02 | 1.60 | 1.62 | 3.79 | 2.54 | 2.76 | 2.77 |
| P-value | <0.001 | <0.001 | <0.001 | <0.001 | 0.390 | <0.001 | <0.001 | <0.001 | <0.001 | <0.001 | <0.001 |
| Optimal cutoffs | 26.57 | 90.0 | 0.60 | 5.51 | 0.076 | 1.23 | 2.16 | 8.92 | 234.02 | 802.81 | 5.67 |
| J-Youden | 0.17 | 0.17 | 0.16 | 0.17 | 0.04 | 0.13 | 0.13 | 0.28 | 0.23 | 0.25 | 0.23 |
| Sensitivity (%) | 70.36 | 65.61 | 61.01 | 61.45 | 84.31 | 63.45 | 67.22 | 60.77 | 75.81 | 70.38 | 51.57 |
| Specificity (%) | 47.49 | 51.80 | 55.43 | 55.60 | 19.80 | 49.97 | 45.93 | 68.08 | 47.80 | 54.63 | 71.47 |
| (+) Likelihood ratio | 1.34 | 1.36 | 1.37 | 1.38 | 1.05 | 1.27 | 1.24 | 1.90 | 1.44 | 1.55 | 1.80 |
| (−) Likelihood ratio | 0.62 | 0.66 | 0.70 | 0.69 | 0.79 | 0.73 | 0.71 | 0.58 | 0.51 | 0.54 | 0.68 |
© 2019 by the authors. Licensee MDPI, Basel, Switzerland. This article is an open access article distributed under the terms and conditions of the Creative Commons Attribution (CC BY) license (http://creativecommons.org/licenses/by/4.0/).
Share and Cite
Ramírez-Vélez, R.; Pérez-Sousa, M.Á.; González-Ruíz, K.; Cano-Gutierrez, C.A.; Schmidt-RioValle, J.; Correa-Rodríguez, M.; Izquierdo, M.; Romero-García, J.A.; Campos-Rodríguez, A.Y.; Triana-Reina, H.R.; et al. Obesity- and Lipid-Related Parameters in the Identification of Older Adults with a High Risk of Prediabetes According to the American Diabetes Association: An Analysis of the 2015 Health, Well-Being, and Aging Study. Nutrients 2019, 11, 2654. https://doi.org/10.3390/nu11112654
Ramírez-Vélez R, Pérez-Sousa MÁ, González-Ruíz K, Cano-Gutierrez CA, Schmidt-RioValle J, Correa-Rodríguez M, Izquierdo M, Romero-García JA, Campos-Rodríguez AY, Triana-Reina HR, et al. Obesity- and Lipid-Related Parameters in the Identification of Older Adults with a High Risk of Prediabetes According to the American Diabetes Association: An Analysis of the 2015 Health, Well-Being, and Aging Study. Nutrients. 2019; 11(11):2654. https://doi.org/10.3390/nu11112654
Chicago/Turabian StyleRamírez-Vélez, Robinson, Miguel Ángel Pérez-Sousa, Katherine González-Ruíz, Carlos A. Cano-Gutierrez, Jacqueline Schmidt-RioValle, María Correa-Rodríguez, Mikel Izquierdo, Jesús Astolfo Romero-García, Adriana Yolanda Campos-Rodríguez, Héctor Reynaldo Triana-Reina, and et al. 2019. "Obesity- and Lipid-Related Parameters in the Identification of Older Adults with a High Risk of Prediabetes According to the American Diabetes Association: An Analysis of the 2015 Health, Well-Being, and Aging Study" Nutrients 11, no. 11: 2654. https://doi.org/10.3390/nu11112654
APA StyleRamírez-Vélez, R., Pérez-Sousa, M. Á., González-Ruíz, K., Cano-Gutierrez, C. A., Schmidt-RioValle, J., Correa-Rodríguez, M., Izquierdo, M., Romero-García, J. A., Campos-Rodríguez, A. Y., Triana-Reina, H. R., & González-Jiménez, E. (2019). Obesity- and Lipid-Related Parameters in the Identification of Older Adults with a High Risk of Prediabetes According to the American Diabetes Association: An Analysis of the 2015 Health, Well-Being, and Aging Study. Nutrients, 11(11), 2654. https://doi.org/10.3390/nu11112654


