Article

Soil Biological Quality Assessment to Improve Decision Support in the Wine Sector

1
Department of Agricultural and Environmental Sciences–Production, Landscape, Agroenergy, University of Milan, 20133 Milan, Italy
2
Agrofood Lab, Department of Molecular and Translational Medicine, University of Brescia, 25123 Brescia, Italy
3
Sata Studio Agronomico, 25121 Brescia, Italy
4
Ricicla Groups Lab, Department of Agricultural and Environmental Sciences–Production, Landscape, Agroenergy, University of Milan, 20133 Milan, Italy
*
Author to whom correspondence should be addressed.
Agronomy 2019, 9(10), 593; https://doi.org/10.3390/agronomy9100593
Submission received: 10 August 2019 / Revised: 13 September 2019 / Accepted: 26 September 2019 / Published: 28 September 2019
(This article belongs to the Special Issue Information Technologies for Precision Plant and Crop Protection)

Abstract

:
Biodiversity is an increasingly important aspect of wine production. The assessment of agro-ecosystem biodiversity is highly complex due to the heterogeneity of the elements involved in the evaluation. For this reason, wine companies have expressed a need for a decision support system (DSS) capable of dealing with this complexity, integrating assessments referring to the whole production system within a single tool. In this study a DSS developed for wine sector biodiversity management assessment is introduced. The DSS, called BIOPASS®, is made up of different sections relating to three compartments in the winemaking process (the soil, the vine and wine). Assessment of the physical, chemical and biological components of soil is a key element of the DSS. We investigate the relationship between biological soil quality (represented by the QBS-ar index), environmental conditions and the type of farming (organic or conventional). 70 soil samples were analysed in different Italian viticultural contexts. The model highlighted the relationships between QBS-ar and meteorological variables (air temperature and precipitation) as well as a positive relationship with organic farming systems. These results provide useful information for understanding agroecosystem biodiversity and will be integrated within the DSS for assessment of soil quality.

1. Introduction

Despite increasing interest in biodiversity in the agricultural sector and the tools that have been developed to investigate this subject [1,2,3] for the wine sector, aspects involving agroecosystem biodiversity and its functional role in relation to vines, must and wine are difficult to understand and manipulate. This is a result of the complexity of the dynamics of the biotic community in agroecosystems in relation to the environment and agricultural practices [4]. Biodiversity is defined by Millennium Ecosystem Assessment (MEA) as “the variability between living organisms and the ecological complexes of which they are part (terrestrial, marine and other aquatic systems); counting species diversity, between species and ecosystems” [5].
Monitoring biodiversity in agroecosystems requires one to make reference to a large number of indicators instead of a single one [6] to better understand complex system dynamics such as the ones characterizing winemaking systems. Decision support systems (DSSs) are useful tools for making possible the assessment of biodiversity in agroecosystems and the integration of biodiversity indicators. The importance of DSSs in agriculture is widely recognised [7,8], and also for the wine sector a large number of DSSs have been developed in the last few years, although these are mostly dedicated to pest and disease management [9,10,11,12], or to vinification management [5,6,13]. Despite their importance, DSSs are poorly considered as easy and affordable tools for assessing biodiversity in the field of wine, meeting the needs of the agricultural sector, as underlined by Doran and Zeiss [14].
Physical, chemical and biological soil quality play a key role for ecosystem sustainability that has been known for a long time [15,16,17]. In this paper we show how soil biological quality is monitored and assessed as a component of a multidimensional sustainability assessment tool developed for the winemaking sector activity. The tool is a DSS that provides composite indicators for three dimensions: (1) company biodiversity, (2) company sustainability, and (3) soil quality.
Soil biological diversity is one of the most sensitive component of agroecosystem biodiversity to environmental stress and farming, and then it can provide useful indication about the impact of farm and soil management practices. The increasing interest in soil biodiversity motivated the need of developing methods for its investigation in vineyard. Several studies have been carried out in vineyard on soil microbial diversity [18,19], earthworm [20], nematode and microarthropod communities as soil quality bioindicators [19,21,22]. The main results obtained from these studies have highlighted a positive effect of organic farming management on microarthropod populations [21,22], as well as an effect of age of planting and meteorological conditions. For example Costantini et al. [19] identified a positive relationship between rainfall occurred between winter-spring period (from January to April) and microarthropod abundance in an old Italian vineyard. The same authors were able to identify a positive relationship between temperatures and biological diversity. Studies carried out in other agricultural sectors have already highlighted the effect of seasonality on soil microarthropod communities [23,24,25,26]. Indications are generally given about the relationship between edaphic micro-arthropods and soil moisture conditions [19,27,28], but there are few studies that specifically identify the relationship between meteorological conditions and edaphic biodiversity [29]. Other studies have been focused on the assessment of the effect of organic and conventional farming on edaphic biodiversity [22,30,31,32,33,34], although only some of them are referred to vineyard context [22,30]. Further investigations are however required to identify clear patterns describing the relationships between soil biodiversity and environmental and management variables [35] and well as to better explore characteristics of methodologies and indexes proposed for soil biodiversity assessment.
Among the methods applied to investigate soil biological quality, the “Qualità biologica del suolo” (QBS)-ar Index is one of the most frequently applied in the agricultural sector. This method, proposed by Parisi et al. [36], is based on the principle that the greater is the sensitivity of a soil arthropod taxon to variability and perturbation of soil conditions, the greater is the importance of the taxon as an indicator of soil quality. The QBS-ar Index has already been applied by various researchers to different contexts, such as urban and degraded ecosystems [37,38,39,40], forests [23,41,42] and agricultural environments [25,32,43]. QBS-ar applies the criterion of “biological forms” [44] to edaphic microarthropods: different species are grouped according to their morphological characteristics. The Eco-Morphologic Index (EMI) is then associated to each group on the basis of its level of adaptation to environmental conditions [36]. The QBS-ar Index allows to overcome problems related to analysis based on the number and richness of species [2,45,46] and to compare results obtained in different contexts [47]. Moreover QBS-ar Index is an easily to apply and understand index that positively responds to the need to identify easy and affordable tools for assessing biodiversity [14]. This index does not provide any information regarding the abundance of individuals of various species, focousing the analysis to soil arthropods, as reported by Yan et al. [48]. These authors have in fact developed the Abundance-based Fauna Index (FAI) which considers the diversity of the soil faunal community along with its functional traits, and the abundance of its members.
In this study we carried out in-depth analysis of edaphic biodiversity to provide useful information for the design and interpretation of soil biodiversity assessment, in order to improve the DSS. We investigated how environmental conditions (meteorological and pedological) and farming systems (organic compared to conventional farming) influence the composition of the soil arthropod community. With this aim a total of 70 QBS-ar indices were obtained in 2014, 2015 and 2016 from different organic and conventional Italian winemaking contexts. Experimental sites have been chosen among wine farming where the DSS were tested. Chemical soil analyses were carried out in each sampling point, to identify the possible relationship between the pedological and biological characteristics of the soils. Data from different meteorological stations close to the sampling points were collected.

2. Materials and Methods
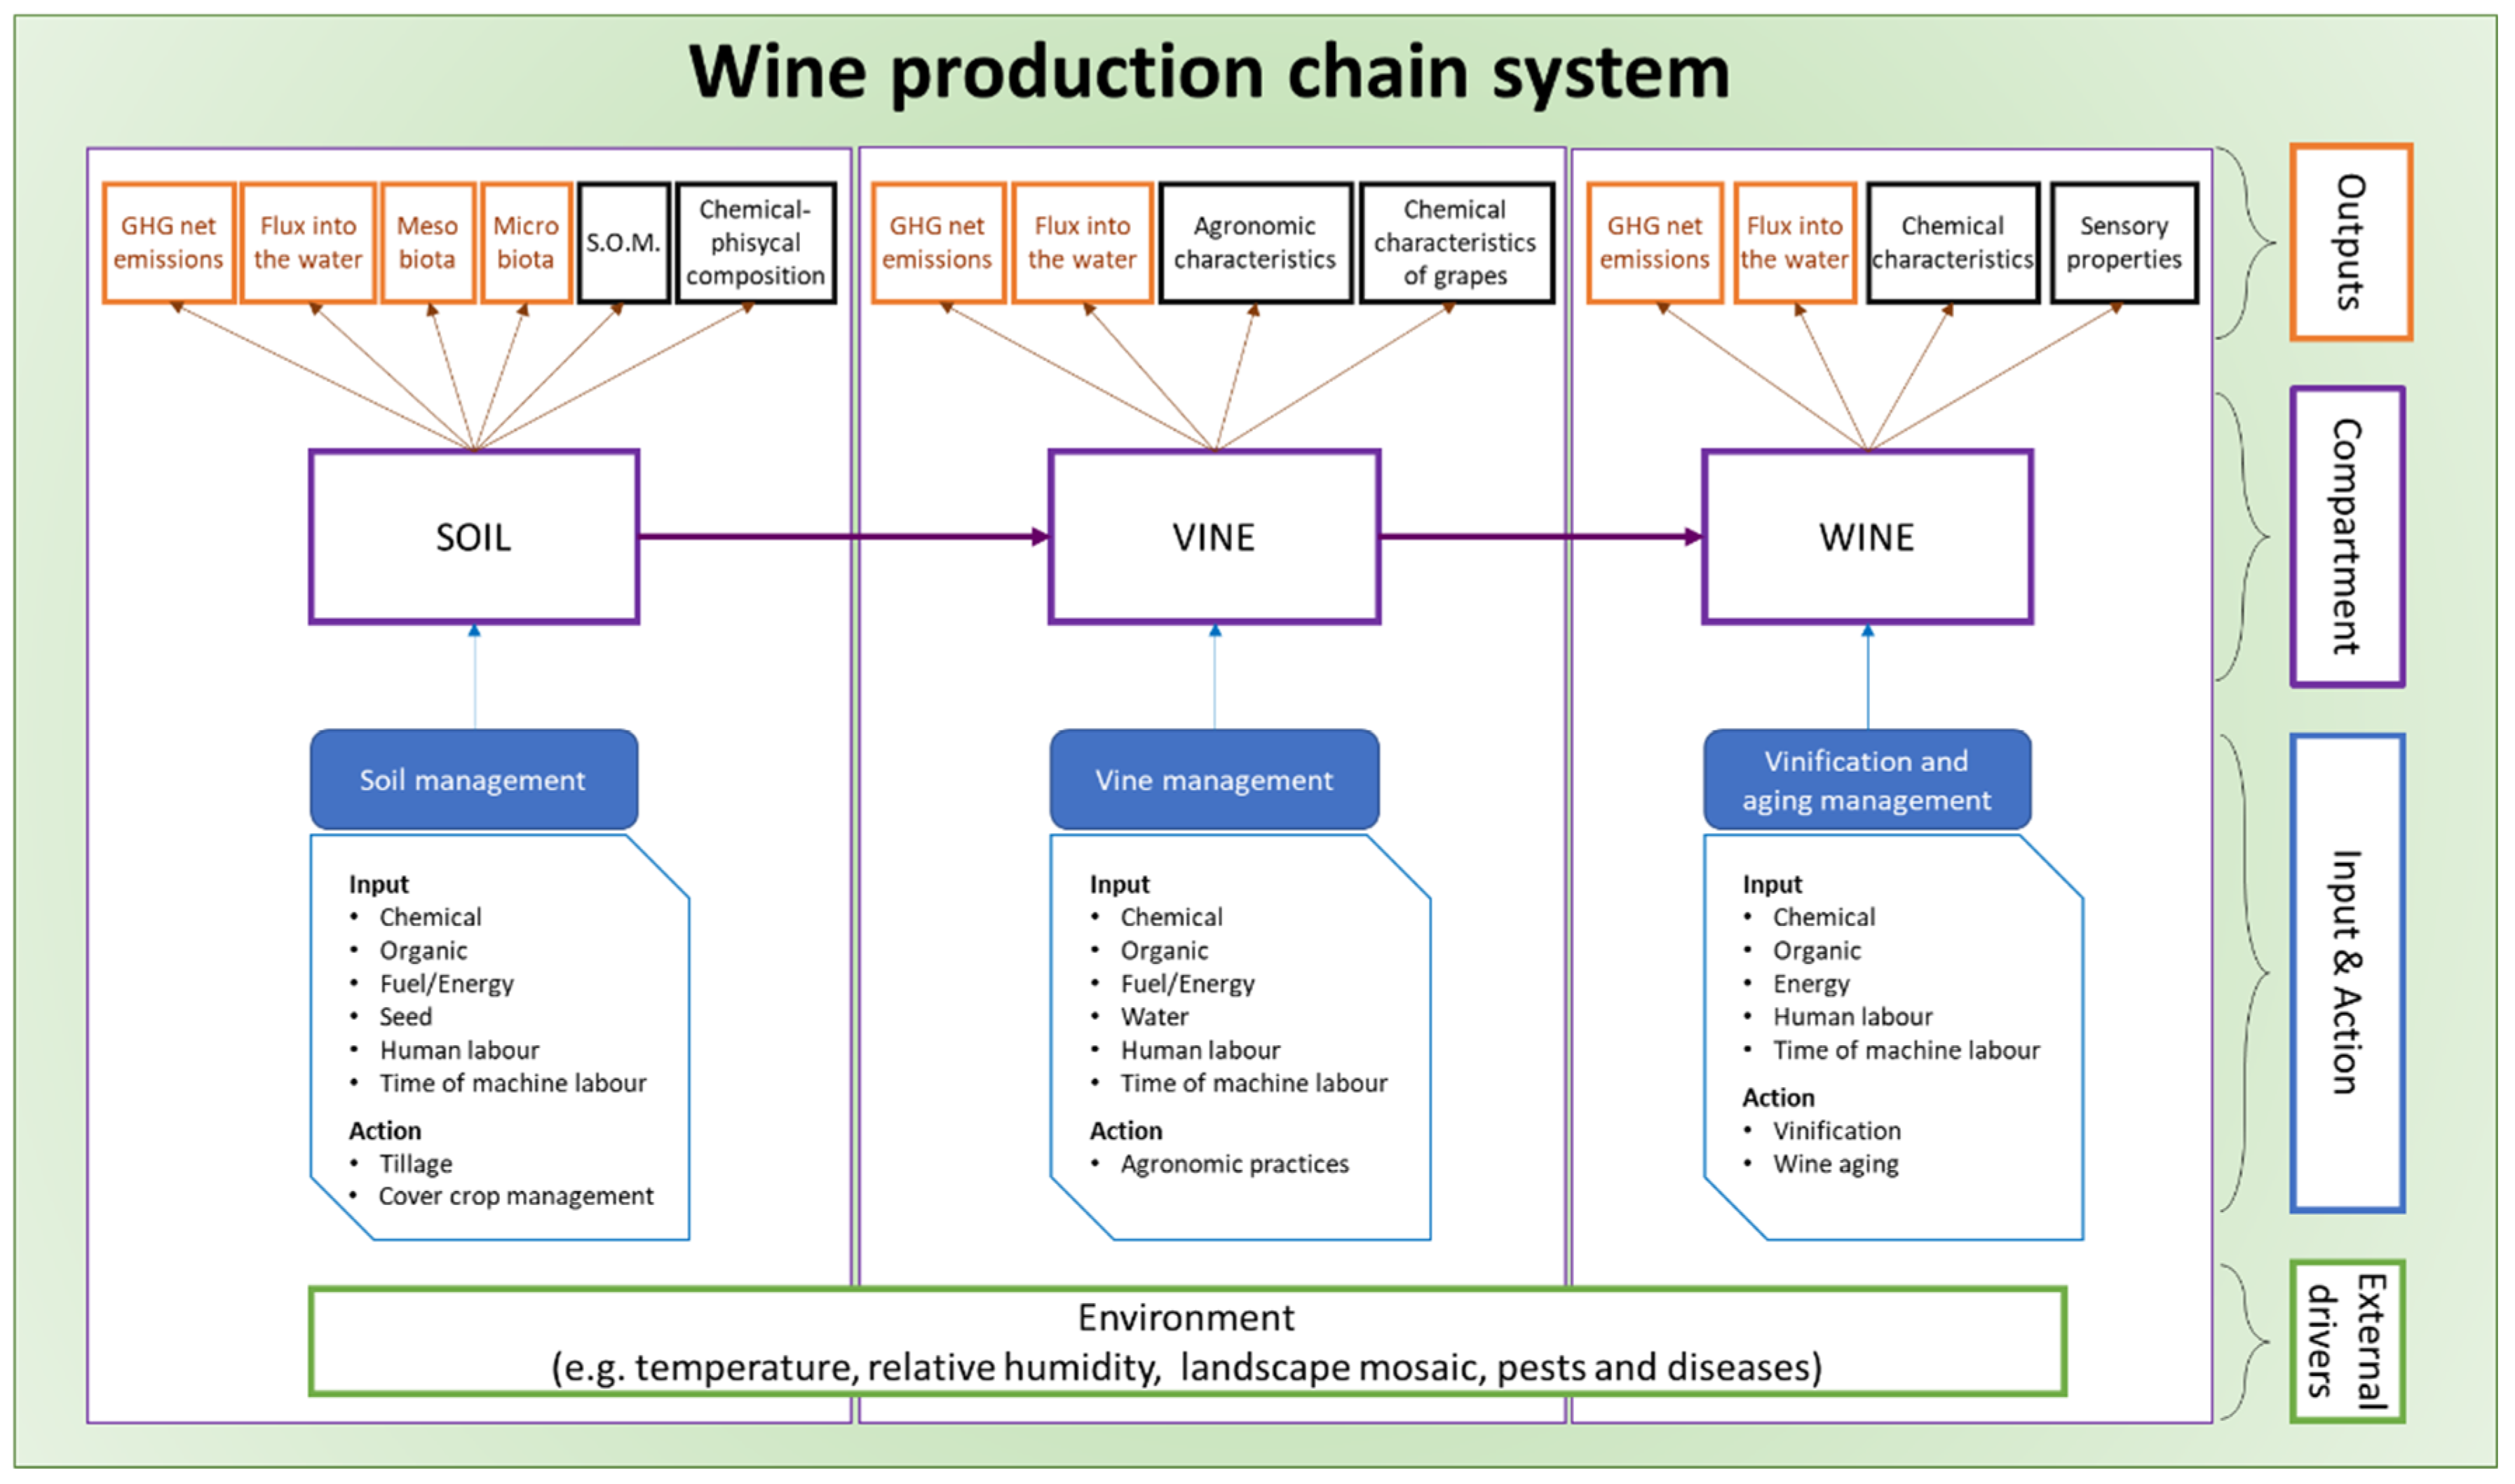
2.1. The DSS

The DSS to which we refer in this paper (BIOPASS®, for further details see [49,50]), was developed to assess the sustainability of the wine production chain with a set of methodologies. The DSS defines a system in which three main compartments are described: soil, vines and wine, as shown in Figure 1. Specific input and output are identified for each compartment, as well as external drivers influencing the overall system. The input concerned management of the compartment and it was divided into two groups: (i) chemical, physical, mechanical and human related inputs; (ii) actions (e.g., agronomical practices). As regards the output, we considered (i) production outputs, such as agronomical characteristics, chemical characteristics of grapes and wine, sensory properties, and (ii) chemical-biological outputs, if considered to have an impact on the specific environmental context.
The DSS is made up of five modules for comprehensive evaluation of the wine company system:
  • Module 1 addresses the evaluation of structural biodiversity of the farm considered, using indices proposed by ISPRA, an Italian public research institute for environmental studies and protection [3];
  • Module 2 assesses the sustainability of the company. It evaluates how the production processes fulfil the requirements of good practice for wine company sustainability. The evaluation system is based on application of Section 8 of the GEAvite® protocol, as defined in Valenti et al. [51].
  • Module 3 evaluates structural and chemical soil quality. Visual soil assessment is based on the protocol proposed by FAO [52], and chemical soil analysis considers the most commonly measured chemical components (e.g., organic matter content, available phosphorous, potassium and magnesium, for further details see the Materials and Methods section).
  • Module 4 considers soil penetration capacity, which is assessed with static penetrometric measurements [53].
  • Module 5 addresses soil biodiversity, evaluating three major components of soil biota: earthworm presence and demographic structure, mycorrhizae presence, and soil arthropod biodiversity, through application of the QBS-ar index [36]. This paper focus on the latter component of module 5 with the aim of better understanding the environmental and agronomic influences on the QBS-ar index and then obtaining indication for improving the use of the DSS.
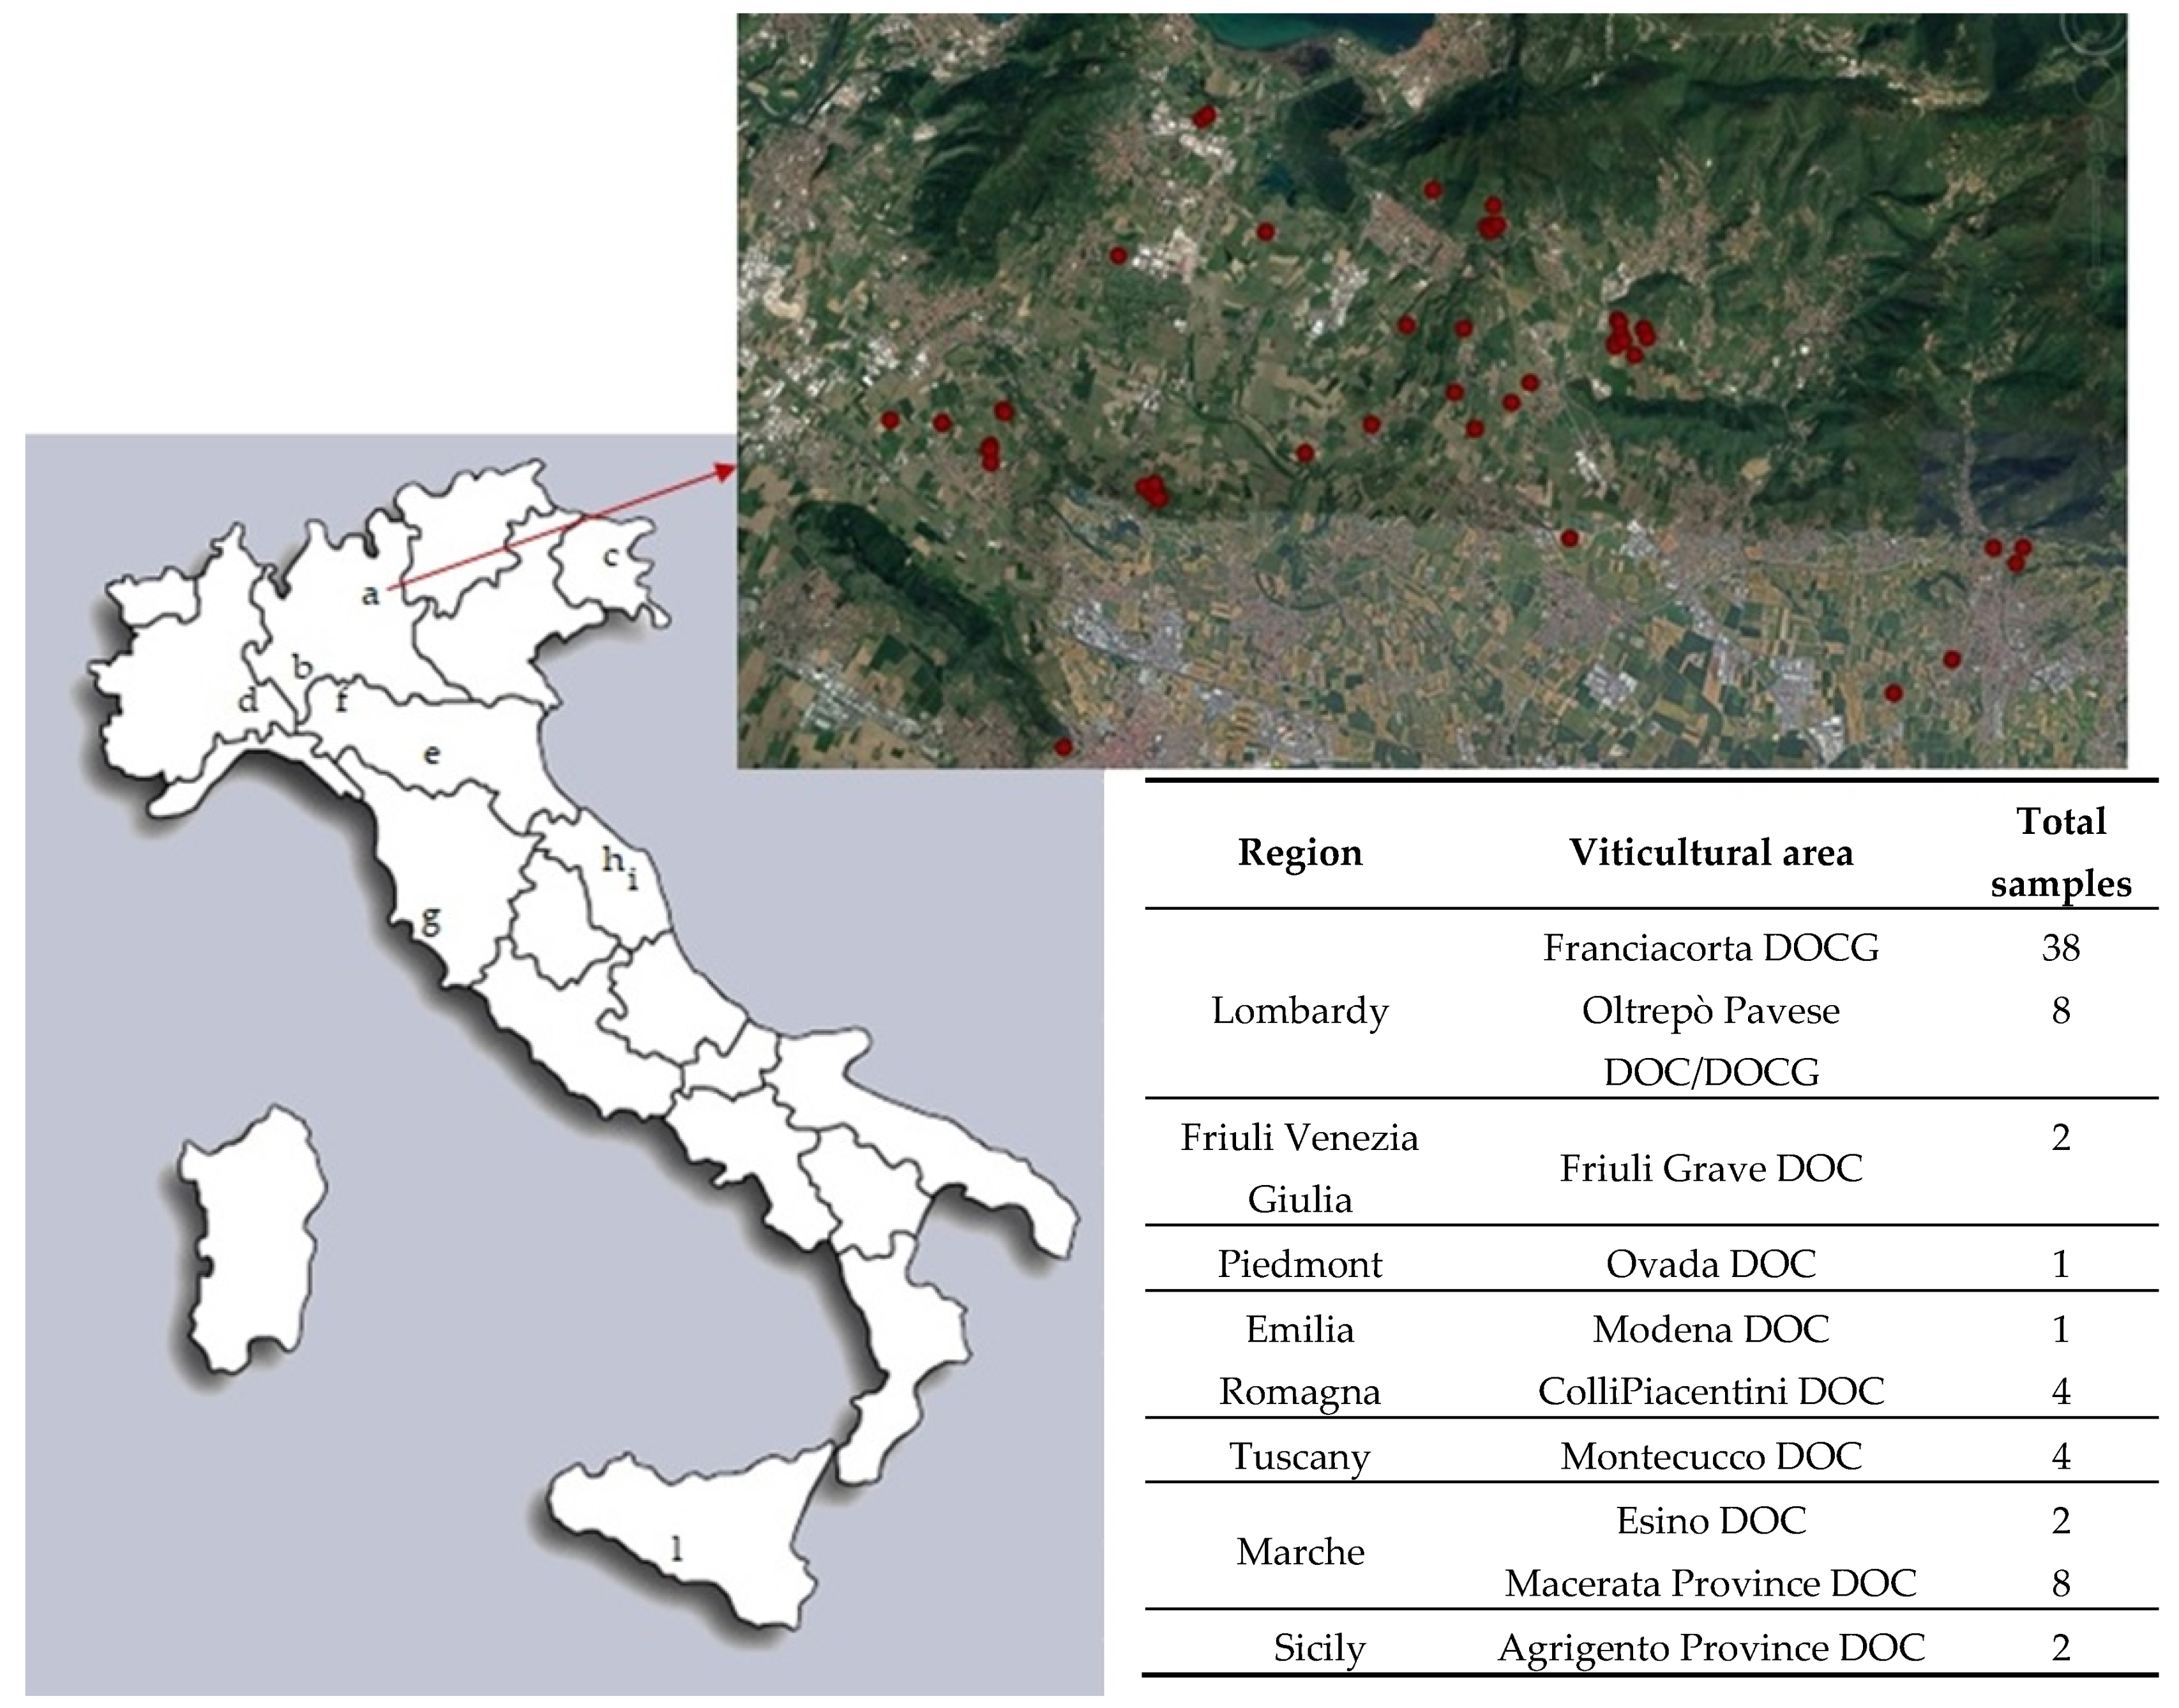
2.2. Study Sites

Soil data were collected in ten viticultural areas in Italy. A total of 70 soil samples were collected from 70 different vineyards (without replicates) over three years in 2014, 2015 and 2016. Sampling were performed in May (17%), June (74%), July (6%), and August (3%). All samples were analysed for QBS-ar and chemical characteristics of soil. The vineyards were located in 10 different Italian wine growing areas. In Figure 2 locations and number of samples collected in each wine-growing area are presented.
The soil farming practices were defined by each wine company, however there were criteria allowing their classification into two categories: organic farming, if they are compliant to European Regulation on Organic Farming (reg (CE) n° 834/2007; reg (CE) n° 889/2008 and subsequent modifications and integrations), and conventional farming (for all other cases without any specific environmental certification). In total, 56 samples were from organic vineyards and 14 from conventional vineyards. Organic vineyards were divided into different groups, on the basis of how long ago they had converted to organic production from conventional farming: 3 years or less, between 4 and 9 years, and 10 years or more.

2.3. Meteorological Data

To investigate the influence of temperature and rainfall on the QBS-ar the following variables were calculated for each soil sample, considering a period of 30 days before sampling:
  • Tmax_l: number of days in which the daily maximum temperature was below 20 °C;
  • Tmax_m: number of days in which the daily maximum temperature was between 20 °C and 30 °C;
  • Tmax_h: number of days in which the daily maximum temperature was above 30 °C;
  • Prec_t: total cumulative precipitation (mm);
  • Prec_l: low precipitation period, if cumulative rainfall was 13.50 mm or below;
  • Prec_m: medium precipitation period, if cumulative rainfall was between 13.50 mm and 186.51 mm;
  • Prec_h: high precipitation period, if cumulative rainfall was 186.51 mm or above.
The thresholds used to define the levels of precipitation (low, medium or high) were calculated based on the range defined by the mean ± 1.5*standard deviation of total cumulative precipitation. Values of total cumulative precipitation inside this range were classified as “Prec_m”, values lower than the lower bound of the range where classified as “Prec_l”, while values greater than the upper bound of the range were classified as “Prec_h”. Data were gather from 13 different meteorological stations (see Table 1). The soil sampling dates have been defined in order to avoid or minimize the possibility of overlapping the 30-day observation period of the meteorological variables for sites that refer to the same weather station.
Meteorological data were obtained from the meteorological service of the Brescia province for the Lombardy region and from the American NOAA Global Surface Summary of the Day (GSOD) dataset for all the other regions.

2.4. Chemical Characterisation of Soils

Characterisation of the soil chemistry involved consideration of: soil texture (sand, clay and loam content expressed in g/kg of soil), pH, cation exchange capacity (CSC expressed in cmoli(+)/kg of soil), total and active limestone (expressed in g CaCO3/kg of soil), organic matter content (expressed in g/kg of soil), available phosphorus (mg P2O5/kg of soil), available potassium (mg K2O/kg of soil) and magnesium (mg MgO/kg of soil).
Samples were taken at a depth of 0–20 cm (excluding the first cm of turfgrass) and mixed uniformly. The collected soil samples were air-dried, homogenized and passed through a 2 mm sieve for chemical analysis. Chemical analysis was performed by the Chemical Laboratory of the Fondazione Edmund Mach (San Michele all’Adige, Trento, Italy) according to the Italian regulation (DM 13/09/1999).

2.5. Soil biological Quality Evaluation (QBS-ar)

For this survey, a cubic sample of soil (with a side length of 12 cm) was collected at each site, at the same depth described for chemical soil analyses. The sample was placed in a Berlese–Tullgren funnel and under a 100 W incandescent bulb, the soil was warmed until complete dehydration. Small invertebrates tend to migrate away from the light and take refuge in the damp part of the soil sample (the bottom), then abandoning the soil and dropping into the cavity of the tunnel, from where they slip into a preserving solution.
Division into biological forms was carried out in relation to the characteristics of adaptation to the soil, which makes it possible to associate each systematic group with a numerical value defined as the “Ecomorphological Index” (EMI): the higher the EMI value, the higher the number of morphological characteristics linked to adaptation to the soil. The EMI value ranges from 1 to 20 [36].
For some systematic groups there is a uniform level of adaptation to edaphic life for various species; in this case assignment of a single EMI value is envisaged. Vice versa, for species with different adaptation to soil, increasing EMI values are assigned according to increased adaptation (e.g., no wings, no eyes, etc.). If several biological forms are recognised in a group and therefore different EMI values are attributed, only the highest EMI value is considered for calculation of the QBS-ar, which represents the maximum degree of adaptation to life in the soil shown by the group under examination. Calculation of the QBS-ar index value is obtained from the sum of the EMI values attributed to each systematic group. QBS values can vary from a minimum of 0 to a maximum of 349.

2.6. Statistical Analysis

To analyse the linear relationships between the selected explanatory variables (regressors) and the QBS-ar, a multiple linear regression model (MLR) with a stepwise approach [54] was applied. We adopted a bidirectional stepwise method, i.e., an automatic procedure to select the best set of explanatory variables in a large set of potential regressors that could explain the variance of the dependent variable. At each iteration of the algorithm, the decision to insert or to delete a regressor was based on minimisation of the Akaike Information Criteria (AIC) [55]. The full model to be tested with a stepwise regression model considered the following variables as regressors: type of farming (organic or conventional), years of organic farming, pH, soil texture, total limestone, active limestone, soil organic matter, available phosphorus, available potassium, available magnesium, Tmax_l, Tmax_m, Tmax_h, Prec_t, Prec_l, Prec_m and Prec_h. The final model adopted was made up of the subset of regressors resulting statistically significant, based on the stepwise procedure. Statistical analysis was performed using R software (version 3.5.3), MASS package [54].

3. Results

The analysed dataset is made up of 70 observations. Surveys were performed from May 2014 to June 2016. The descriptive statistics for explained variables included in the full model are shown in Table 2.
The distribution of all soil parameters showed high variability, due to the extensive heterogeneity characterising the study sites. Considering the reference period (30 days before each soil sampling), the mean number of days in which the daily maximum temperature was between 20 and 30°C was 24.51 ± 3.17 per site. Total precipitation ranged between 0 and 190.6 mm in the reference period. Only 1 observation recorded cumulative rainfall of less than 13.50 mm (Prec_l), in 59 sites cumulative rainfall was between 13.5 and 186.51 mm (Prec_m) and 10 observations recorded cumulative rainfall of over 186.51 mm (Prec_h).
The mean QBS-ar value in the dataset was 92.29 ± 40.32 (QBS-ar values ranging between 28 and 193). The different arthropod biological groups identified and their EMI values are shown in Table 3. The distribution of groups identified ranges between 3 and 14 (the mean value is 7).

3.1. Statistical Model

The results of the bidirectional stepwise linear regression model are shown in Table 4. All the estimated coefficients are statistically significant (p-value 0.1), except the estimated coefficient of Tmax_l, though this regressor was selected by the stepwise procedure. The adjusted R-squared value was 0.1945.

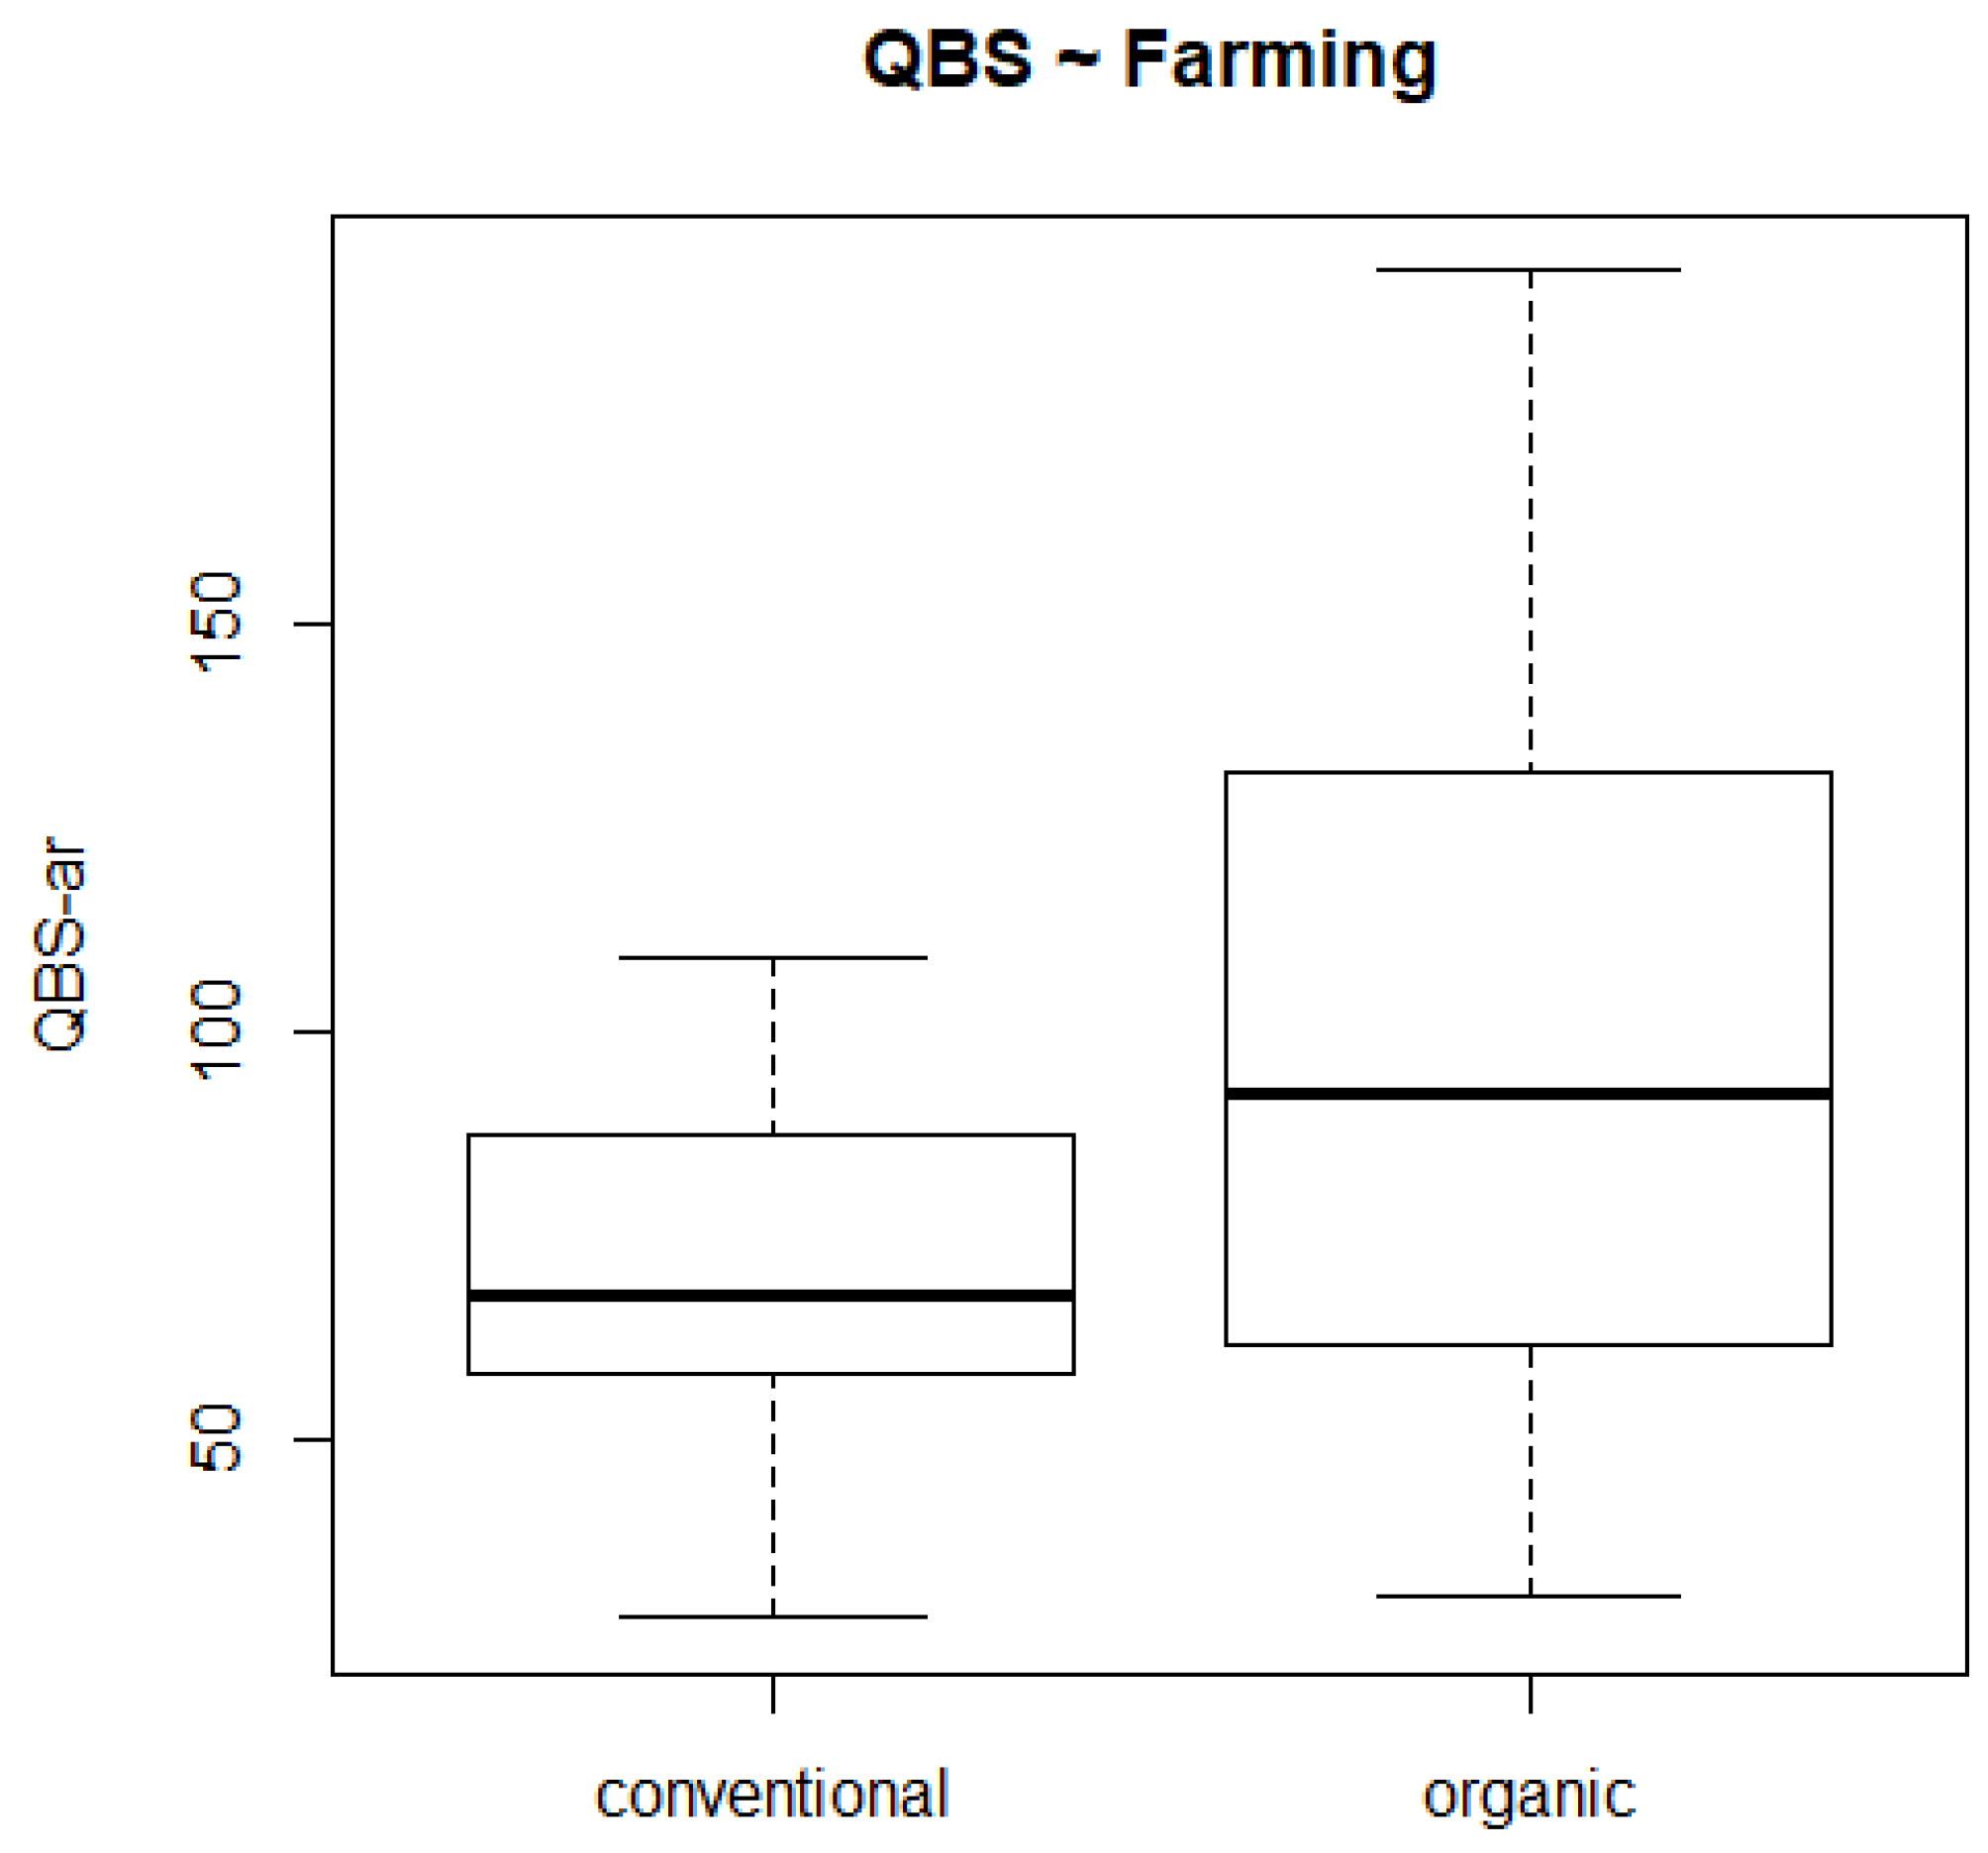
3.2. Relationship with Farming Systems

As shown in Table 4, the model applied identified a positive relationship between QBS-ar and organic farming systems. In Figure 3, we have plotted the distribution of QBS-ar according to farming systems. The QBS-ar median value is higher for organic farming than for conventional farming, although its distribution is characterised by greater variability compared to conventional systems.
The stepwise procedure did not select the number of years of organic farming as significant in describing the variability of QBS-ar.

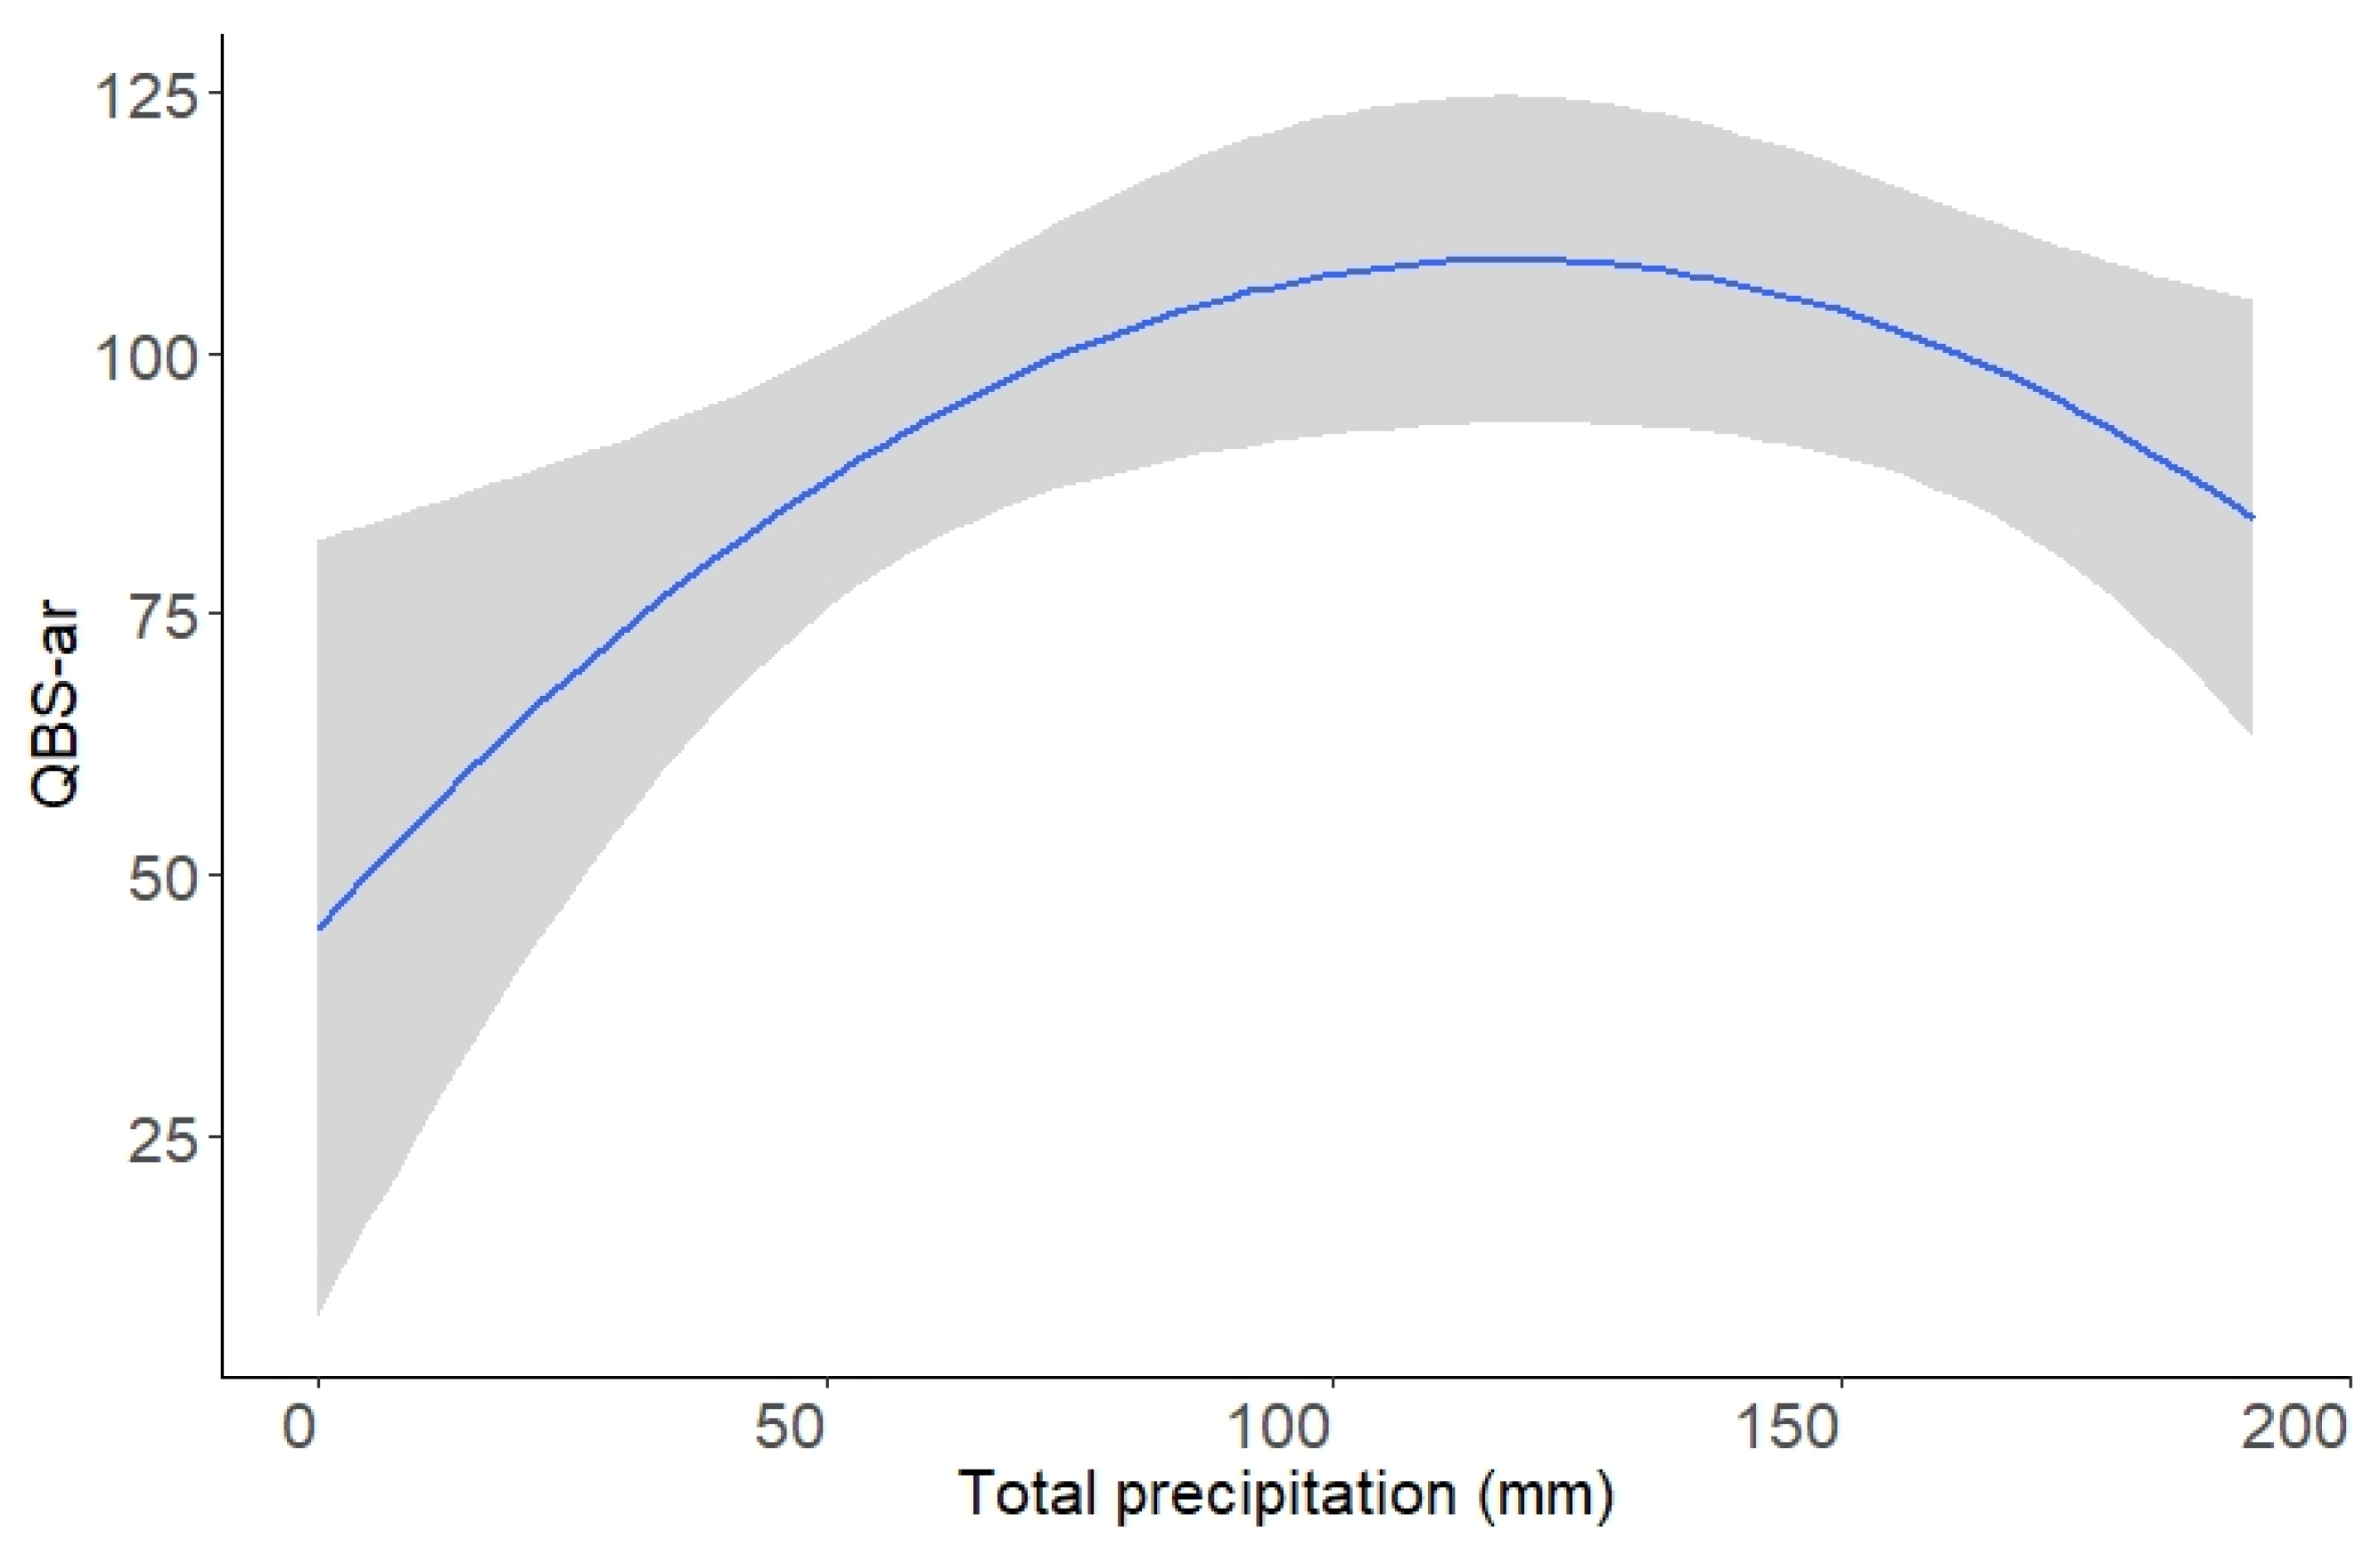
3.3. Relationship with Meteorological Variables

The statistically significant relationships between QBS-ar and meteorological variables identified by the stepwise regression model can be summarised as follows:
  • High daily maximum temperatures (Temp_h) were negatively related to the QBS-ar value, i.e., the number of days when the maximum daily temperature exceeded 30 °C in the 30 days before sample collection increased the QBS-ar value;
  • Total cumulative precipitation (Prec_t) was positive related to QBS-ar, i.e., an increase in total precipitation increased the estimated QBS-ar value.
The model also shows that high precipitation (Prec_h) was negatively related to QBS-ar, i.e., each mm of rainfall accumulated in the 30 days preceding the soil sampling decreased the estimated QBS-ar value by 40.78 points. The relationships highlighted in these two areas are represented graphically in Figure 4.
The stepwise procedure selected low daily maximum temperatures (lower than 20 °C) as a significant regressor explaining QBS-ar variance, but estimation of the regression coefficient of the bidirectional stepwise linear regression model was not statistically significant.

3.4. Relationship with Pedological Variables

The model applied did not identify any significant relationship between QBS-ar and pedological variables. This may be related to the fact that the nexus between soil characteristics and QBS-ar was not linear, or mean that some dynamics explaining this nexus were captured by meteorological and management variables.

4. Discussion and Conclusions

The mean QBS-ar index value in our dataset was 92.29 ± 40.32, in agreement with previous studies observing a mean QBS-ar value of 91 for agricultural land [56]. As regards the range of values in the index, in the literature a range of between 40 and 204 has been identified, depending on the year of sampling and the age of vineyards [19], while other authors have recorded a range of between 98 and 203 depending on farming systems [22]. In our dataset, the QBS-ar values ranged from 28 to 193.
The results of the linear regression model showed a positive relationship between QBS-ar and organic farming, which is supported by previous studies identifying the same behaviour in different contexts [28,33].
Important relationships between meteorological conditions in the 30 day period before soil sampling and the QBS-ar index were observed. A positive linear relationship with cumulative precipitation and a negative relationship with high temperature (≥30 °C) and high precipitation (>186.51 mm) were highlighted.
The effect of precipitation on the QBS-ar index is however known, as Parisi et al. [28] suggests collecting QBS-ar samples when soil moisture ranges between 40% and 80% of field capacity. Other studies reported a positive effect of rainfall on microarthropod abundance [19] always in relation to soil moisture conditions. Moreover, the seasonal variability of soil fauna has already been observed by other authors [23,24,25,26], although Neave and Fox [26] related this behaviour to mechanical and physical soil modifications rather than meteorological effects. Effect of temperature have been less investigated even if Costantini et al. highlight a positive relationship between biological diversity and temperature.
Microarthropods are very sensitive to the variations of edaphic microhabitat in which they are living (soil pores). Thermal variations and water content of this microhabitat are then factors that generate avoiding behaviours because this creates stress in the transpiration and leads to anoxic conditions due to the saturation of soil pores. In the same way, in presence of limited water contents of the soil, a stress due to water loss occurs. Vertical migrations take then place in the direction of higher depth where variations are more mitigated [29]. This behaviour may be related to the ability of soil organisms to migrate along the soil profile, to avoid stress conditions, and then not being found in the analysed soil sample [29,57,58]. This suggests that the sampling design must taking into account the depth of the different samplings collection. This is also aimed to verify the hypothesis of “vertical migration” as adaptive mechanism to stress conditions. Besides the migratory behaviour, variations in the abundance of microarthropods may also be attributed to the mortality increase, that stress conditions can generate [59].
The relationship between meteorological conditions and QBS-ar identified in this paper helps to go beyond the seasonality effect. The identification of a clear link between QBS-ar and the level of precipitation and temperature makes it possible to improve the accuracy of the analysis, highlighting differences within the same season, or between the different years of observations.
The results described give useful indications for wine sector operators, providing them with some fundamental rules regarding arthropod dynamics in vineyard soil. In relation to the large number of observations considered and the variability of the geographical context observed, the DSS applied to wine sector biodiversity can be improved with indicators increasing knowledge about the timing of sampling and viticulture farming management assessment. Further research is needed to increase understanding of the meteorological relationship observed and the relationship between vineyard management and the biological quality of soil.

Author Contributions

Development process and overall conceptualization of study design by L.V., P.D., I.G., G.G., M.T.; authorship of the original first draft of the manuscript by I.G. and A.S.; coordination of the study by L.V., P.D., G.G., data collection by P.D., I.G., M.T., F.B.; database development by I.G., A.S.; data processing and statistical analysis by A.S.; results interpretation by I.G., L.V., P.D., G.G., M.T.; revision of the final version of the manuscript by G.G. All authors read and approved the final manuscript.

Funding

This research received no external funding.

Acknowledgments

The authors would like to thank all wine companies that assisted with data collection. We thank Gabriele Cola and Francesca Orlando for their support in meteorological dataset development and Enzo Mescalchin for the support in QBS-ar evaluation. We thank the ‘Consorzio per la tutela del Franciacorta’ that played a key role in the development of new operational protocols for sustainable viticulture by promoting and inspiring collaboration between universities and productive excellence.

Conflicts of Interest

The authors declare no conflict of interest.

References

  1. MEA (Millennium Ecosystem Assessment). Ecosystems and Human Well-being: Biodiversity Synthesis; World Resosurce Institute: Washington, DC, USA, 2005. [Google Scholar]
  2. Büchs, W. Biotic Indicators for Biodiversity and Sustainable Agriculture—Introduction and background. Agric. Ecosyst. Environ. 2003, 98, 1–16. [Google Scholar] [CrossRef]
  3. ISPRA. Indicatori di Biodiversità per la Sostenibilità in Agricoltura. Linee guida, Strumenti e Metodi per la Valutazione della Qualità degli Agroecosistemi; Istituto Superiore per la Protezione e la Ricerca Ambientale: Roma, Italy, 2008.
  4. Gomiero, T.; Giampietro, M.; Mayumi, K. Facing complexity on agro-ecosystems: A new approach to farming system analysis. Int. J. Agric. Res. Gov. Ecol. 2006, 5, 116–144. [Google Scholar] [CrossRef]
  5. Van der Merwe, A.; Van Dyk, F.E.; Van Vuuren, J.H. Decision support for grape harvesting at a South African winery. ORiON 2011, 27, 83–100. [Google Scholar] [CrossRef]
  6. Wine Institute. Comprehensive Guide to Sustainable Management of Winery Water and Associated Energy Kennedy/Jenk Consultants—Engineers and Scientists. 2008. Available online: http://www.wineinstitute.org/files/AVF-Guide.pdf (accessed on 27 September 2019).
  7. Cancela, H.; Higgins, A.; Pagès-Bernaus, A.; Plà-Aragonès, L.M. Prologue—BigData and DSS in agriculture. Comput. Electron. Agric. 2019, 161, 1–3. [Google Scholar] [CrossRef]
  8. Matthews, K.B.; Schwarz, G.; Buchan, K.; Rivington, M.; Miller, D. Wither agricultural DSS? Comput. Electron. Agric. 2008, 61, 149–159. [Google Scholar] [CrossRef] [Green Version]
  9. Pérez-Expósito, J.P.; Fernández-Caramés, T.M.; Fraga-Lamas, P.; Castedo, L. VineSens: An Eco-Smart Decision-Support Viticulture System. Sensors 2017, 17, 465. [Google Scholar] [CrossRef]
  10. Caffarra, A.; Rinaldi, M.; Eccel, E.; Rossi, V.; Pertot, I. Modelling the impact of climate change on the interaction between a grapevine and its pests and pathogens: European grapevine moth and powdery mildew. Agric. Ecosyst. Environ. 2012, 148, 89–101. [Google Scholar] [CrossRef]
  11. Kuflik, T.; Prodorutti, D.; Frizzi, A.; Gafni, Y.; Simon, S.; Pertot, I. Optimisation of copper treatment in organic viticulture by using a web-based decision support system. Comput. Electron. Agric. 2009, 68, 36–43. [Google Scholar] [CrossRef]
  12. Calonnec, A.; Cartolaro, P.; Naulin, J.M.; Bailey, D.; Langlais, M. A host-pathogen simulation model: Powdery mildew of grapevine. Plant Pathol. 2008, 57, 493–508. [Google Scholar] [CrossRef]
  13. Rinaldi, S.; Tiano, A.; Serban, S.; Pittson, R.; Lajic, Z.; Politi, H.; El Murr, N.; Armani, A.; Cavazza, A. Monitoring wine quality and fermentation kinetics with innovative technologies. In XXIX Congreso mundial de la Viña y el Vino: 4a Asamblea General de la O.I.V.; Ministerio de Agricultura, Pesca y Alimentaciòn: Madrid, Spain, 2006; p. 10. [Google Scholar]
  14. Doran, J.W.; Zeiss, M.R. Soil health and sustainability: Managing the biotic component of soil quality. Appl. Soil Ecol. 2000, 15, 3–11. [Google Scholar] [CrossRef]
  15. Powlson, D.S.; Gregory, P.J.; Whalley, W.R.; Quinton, J.N.; Hopkins, D.W.; Whitmore, A.P.; Hirsch, P.R.; Goulding, K.W.T. Soil management in relation to sustainable agriculture and ecosystem services. Food Policy 2011, 36, 72–87. [Google Scholar] [CrossRef]
  16. Schoenholtz, S.H.; Van Miegroet, H.; Burger, J.A. A review of chemical and physical properties as indicators of forest soil quality: Challenges and opportunities. For. Ecol. Manag. 2000, 138, 335–356. [Google Scholar] [CrossRef]
  17. Karlen, D.L.; Mausbach, M.J.; Doran, J.W.; Cline, R.G.; Harris, R.F.; Schuman, G.E. Soil quality: A concept, definition, and framework for evaluation. Soil Sci. Soc. Am. J. 1997, 61, 4–10. [Google Scholar] [CrossRef]
  18. Zarraonaindia, I.; Owens, S.M.; Weisenhorn, P.; West, K.; Marcell, J.H.; Lax, S.; Bokulich, N.A.; Mills, D.A.; Martin, G.; Taghavi, S.; et al. The soil microbiome influences grapevine-associated microbiota. MBio 2015, 6, 1–14. [Google Scholar] [CrossRef] [PubMed]
  19. Costantini, E.A.C.; Agnelli, A.E.; Fabiani, A.; Gagnarli, E.; Mocali, S.; Priori, S.; Simoni, S.; Valboa, G. Short-term recovery of soil physical, chemical, micro- and mesobiological functions in a new vineyard under organic farming. Soil 2015, 1, 443–457. [Google Scholar] [CrossRef] [Green Version]
  20. Fusaro, S.; Gavinelli, F.; Lazzarini, F.; Paoletti, M.G. Soil biological quality Soil Biological Quality Index based on earthworms (QBS-e). A new way to use earthworms as bioindicators in agroecosystems. Ecol. Indic. 2018, 93, 1276–1292. [Google Scholar] [CrossRef]
  21. Priori, S.; Lagomarsino, A.; Agnelli, A.E.; Valboa, G.; Castaldini, M.; Pellegrini, S.; Simoni, S.; D’Avino, L.; Gagnarli, E.; Guidi, S.; et al. CostantiniSoil functionality assessment in degraded plots of vineyards. Suoli di Qualità per una Vita di Qualità 2017, 1, 190–199. [Google Scholar]
  22. Gagnarli, E.; Goggioli, D.; Tarchi, F.; Guidi, S.; Nannelli, R.; Vignozzi, N.; Valboa, G.; Lottero, M.R.; Corino, L.; Simon, S. Case study of microarthropod communities to assess soil quality in different managed vineyards. Soil 2015, 1, 527–536. [Google Scholar] [CrossRef] [Green Version]
  23. Galli, L.; Capurro, M.; Menta, C.; Rellini, I. Is the QBS-ar index a good tool to detect the soil quality in Mediterranean areas? A cork tree Quercus suber, L. (Fagaceae) wood as a case of study. Ital. J. Zool. 2014, 81, 126–135. [Google Scholar] [CrossRef]
  24. Menta, C.; Leoni, A.; Gardi, C.; Conti, F.D. Are grasslands important habitats for soil microarthropod conservation? Biodivers. Conserv. 2011, 20, 1073–1087. [Google Scholar] [CrossRef]
  25. Tabaglio, V.; Gavazzi, C.; Menta, C. Physico-chemical indicators and microarthropod communities as influenced by no-till, conventional tillage and nitrogen fertilisation after four years of continuous maize. Soil Till. Res. 2009, 105, 135–142. [Google Scholar] [CrossRef]
  26. Neave, P.; Fox, C.A. Response of soil invertebrates to reduced tillage systems established on a clay loam soil. Appl. Soil Ecol. 1998, 9, 423–428. [Google Scholar] [CrossRef]
  27. Chikoski, J.M.; Ferguson, S.H.; Meyer, L. Effects of water addition on soil arthropods and soil characteristics in a precipitation-limited environment. Acta Oecol. 2006, 30, 203–211. [Google Scholar] [CrossRef]
  28. Parisi, V.; Menta, C.; Gardi, C.; Jacomini, C.; Mozzanica, E. Microarthropod communities as a tool to assess soil quality and biodiversity: A new approach in Italy. Agric. Ecosyst. Environ. 2005, 105, 323–333. [Google Scholar] [CrossRef]
  29. Hassall, M.; Visser, S.; Parkinson, D. Vertical migration of Onychiurus subtensis (Collembola) in relation to rainfall and microbial activity. Pedobiologia (Jena) 1986, 29, 175–182. [Google Scholar]
  30. Döring, J.; Collins, C.; Frisch, M.; Kauer, R. Organic and Biodynamic Viticulture 3 Affect Biodiversity and Vine and Wine Properties: 4 A Systematic Quantitative Review. Am. J. Enol. Vitic. 2019, 70, 221–242. [Google Scholar] [CrossRef]
  31. Simoni, S.; Nannelli, R.; Castagnoli, M.; Goggioli, D.; Moschini, V.; Vazzana, C.; Benedettelli, S.; Migliorini, P. Abundance and biodiversity of soil arthropods in one conventional and two organic fields of maize in stockless arable systems. Redia 2013, 96, 37–44. [Google Scholar]
  32. Mazzoncini, M.; Canali, S.; Giovannetti, M.; Castagnoli, M.; Tittarelli, F.; Antichi, D.; Nannelli, R.; Cristani, C.; Bàrberi, P. Comparison of organic and conventionals tockless arable systems: A multidisciplinary approach to soilquality evaluation. Appl. Soil Ecol. 2010, 44, 124–132. [Google Scholar] [CrossRef]
  33. Hansen, B.; Alrøe, H.F.; Kristensen, E.S. Approaches to assess the environmental impact of organic farming with particular regard to Demmark. Agric. Ecosyst. Environ. 2001, 83, 11–26. [Google Scholar] [CrossRef]
  34. Hole, D.G.; Perkins, A.J.; Wilson, J.D.; Alexander, I.H.; Grice, P.V.; Evans, A.D. Does organic farming benefit biodiversity? Biol. Conserv. 2005, 122, 113–130. [Google Scholar] [CrossRef]
  35. Menta, C.; Conti, F.D.; Pinto, S.; Bodini, A. Soil Biological Quality index (QBS-ar): 15 years of application at global scale. Ecol. Indic. 2018, 85, 773–780. [Google Scholar] [CrossRef]
  36. Parisi, V. La qualità biologica del suolo. Un metodo basato sui microartropodi. Acta Naturalia de L’AteneoParmense 2001, 37, 105–114. [Google Scholar]
  37. Menta, C.; Conti, F.D.; Pinto, S.; Leoni, A.; Lozano-Fondón, C. Monitoring soil restoration in an open-pit mine in northern Italy. Appl. Soil Ecol. 2014, 83, 22–29. [Google Scholar] [CrossRef]
  38. Santorufo, L.; Van Gestel, C.A.M.; Rocco, A.; Maisto, G. Soil invertebrates as bioindicators of urban soil quality. Environ. Pollut. 2012, 161, 57–63. [Google Scholar] [CrossRef] [PubMed]
  39. Madej, G.; Barkzyk, G.; Gdawiec, M. Evaluation of soil biological quality index (QBS-ar): Its sensitivity and usefulness in the post-mining chronosequence –preliminary research. Pol. J. Environ. Stud. 2011, 20, 1367–1372. [Google Scholar]
  40. Hartley, W.; Uffindell, L.; Plumb, A.; Rawlinson, H.A.; Putwain, P.; Dickinson, N.M. Assessing biological indicators for remediated anthropogenic urban soils. Sci. Total Environ. 2008, 405, 358–369. [Google Scholar] [CrossRef]
  41. Ballabio, L.; Fumagalli, P.; Comolli, R. Soil Quality Evaluation in Periurban Lowland Forests Using Biological Indicators, in the Walking Urban Forest. In Proceedings of the 16th European Forum on Urban Forestry, Milan, Italy, 7–11 May 2013; p. 100. [Google Scholar]
  42. Blasi, S.; Menta, C.; Balducci, L.; Conti, F.D.; Petrini, E.; Piovesan, G. Soil microarthropod communities from mediterranean forest ecosystems in Central Italy under different disturbances. Environ. Monit. Assess. 2013, 185, 1637–1655. [Google Scholar] [CrossRef]
  43. Menta, C.; García-Montero, L.G.; Pinto, S.; Conti, F.D.; Baroni, G.; Maresi, M. Does the natural microcosm created by Tuber aestivum affect soil microarthropods? A new hypothesis based on Collembola in truffle culture. Appl. Soil Ecol. 2014, 84, 31–37. [Google Scholar] [CrossRef]
  44. Sacchi, C.F.; Testard, P. Ecologie Animale: Organismes et Milieu; Doin: Paris, France, 1971. [Google Scholar]
  45. De Bello, F.; Lavorel, S.; Diaz, S. Towards an assessment of multiple ecosystem processes and services via functional traits. Biodivers. Conserv. 2010, 19, 2873–2893. [Google Scholar] [CrossRef]
  46. Vandewalle, M.; de Bello, F.; Berg, M.P.; Bolger, T.; Doledec, S.; Dubs, F.; Feld, C.K.; Harrington, R.; Harrison, P.A.; Lavorel, S.; et al. Functional traits as indicators of biodiversity response to land use changes across ecosystems and organisms. Biodivers. Conserv. 2010, 19, 2921–2947. [Google Scholar] [CrossRef] [Green Version]
  47. Rüdisser, J.; Tasser, E.; Peham, T.; Meyer, E.; Tappeiner, U. The dark side of biodiversity: Spatial application of the biological soil quality indicator (BSQ). Ecol. Indic. 2015, 53, 240–246. [Google Scholar] [CrossRef]
  48. Yan, S.; Singh, A.N.; Fu, S.; Liao, C.; Wang, S.; Li, Y.; Cui, Y.; Hu, L. A soil fauna index for assessing soil quality. Soil Biol. Biochem. 2012, 47, 158–165. [Google Scholar] [CrossRef]
  49. Agronomisata. Available online: https://www.agronomisata.it/progetto-biopass/ (accessed on 8 August 2019).
  50. Ghiglieno, I.; Donna, P.; Tonni, M.; Valenti, L. Valutare la biodiversità nell’azienda viticola. Millevigne 2019, 2, 18–20. [Google Scholar]
  51. Valenti, L.; Ghiglieno, I.; Tonni, M.; Donna, P.; Dell’Orto, M.; Carletti, F. GEA.vite, an Example of Assesment Protocol to Evaluate the Efficiency and Sustainability of Viticultural Italian Companies. AJIBM 2013, 3, 322–329. [Google Scholar] [CrossRef] [Green Version]
  52. Food and Agriculture Organization of the United Nations (FAO). Visual Soil Assessment, Field Guides; FAO: Rome, Italy, 2008. [Google Scholar]
  53. Lune, T.; Robertson, P.K.; Powell, J.J. General Description of CPT and CPTU. In Cone Penetration Testing in Geotechnical Practice; Spon Press: Oxford, UK, 1997; pp. 1–2. [Google Scholar]
  54. Venables, W.N.; Ripley, B.D. Modern Applied Statistics with S, 4th ed.; Springer: Berlin/Heidelberg, Germany, 2002. [Google Scholar]
  55. Akaike, H. A new look at the statistical model identification. IEEE Trans. Automat. Contr. 1974, 19, 716–723. [Google Scholar] [CrossRef]
  56. Menta, C.; Conti, F.D.; Pinto, S. Microarthropodsbiodiversity in natural, seminatural and cultivated soils—QBS-ar approach. Appl. Soil Ecol. 2018, 123, 740–743. [Google Scholar] [CrossRef]
  57. Stillman, J.H. Acclimation capacity underlies susceptibility to climate change. Science 2003, 301, 65. [Google Scholar] [CrossRef]
  58. Clark, M.S.; Thorne, M.A.S.; Purac, J.; Grubor-Lajsic, G.; Kube, M.; Reinhardt, R.; Worland, M.R. Surviving extreme polar winters by desiccation: Clues from Arctic springtail (Onychiurusarcticus) EST libraries. BMC Genom. 2007, 8, 12. [Google Scholar] [CrossRef] [PubMed]
  59. Villani, M.G.; Allee, L.L.; D’ıaz, A.; Robbins, P.S. Adaptive strategies of edaphic arthropods. Annu. Rev. Entomol. 1999, 44, 233–256. [Google Scholar] [CrossRef] [PubMed]
Figure 1. Diagram of the wine production chain. Input and actions (blue boxes), and production output (black boxes) are shown for each component, in addition to chemical and biological output (orange boxes).
Agronomy 09 00593 g001
Figure 2. Map of locations of different wine growing areas where samples has been collected. For Franciacorta DOCG a deeper level of detail is shown in relation to the high number of vineyards investigated.
Agronomy 09 00593 g002
Figure 3. Boxplot of QBS-ar distribution according to farming system.
Agronomy 09 00593 g003
Figure 4. QBS-ar value distribution in relation to total cumulative precipitation values.
Agronomy 09 00593 g004
Table 1. Location of meteorological stations.
LocationRegionLatitude (Geographical Coordinates)Longitude (Geographical Coordinates)Altitude-m a.s.l.
AnconaMarche43.61713.517103
Udine/CampoformidoFriuli Venezia Giulia46.03313.18394
Cuneo LevaldigiPiedmont44.5337.617386
Novi Ligure44.7678.783187
PiacenzaEmilia Romagna44.9139.723139
Modena44.6510.9533
ArezzoTuscany43.46711.85249
SciaccaSicily37.51713.083125
Gela37.08314.21733
MonticelliLombardy45.62210.091230
Corte Franca45.63310.021220
Erbusco45.5929.972215
Rodengo Saiano45.59610.124160
Table 2. Descriptive statistics for quantitative variables in the dataset.
Unit of MeasureMean ± SD*Median (Q25–Q75)MinMax
QBS-ar 92.29 ± 40.3284.00 (59.25–127.75)28.00193.00
Years of organic farming 4.11 ± 5.022 (1.00–7.00)0.0020.00
pH 7.33 ± 0.897.75 (6.63–8.00)5.308.40
Active limestone(g CaCO3/kg)31.70 ± 41.9612.50 (0.00–57.00)0.00130.00
Soil organic matter (g/kg)21.66 ± 9.3121.00 (15.00–27.75)5.0042.00
Assimilable phosphorus(mg P2O5/kg)34.40 ± 23.9927.00 (17.00–47.50)5.0094.00
Exchangeable potassium(mg K2O/kg)191.10 ± 118.11156.00 (114.20–219.50)60747.00
Exchangeable magnesium(mg MgO/kg)362.50 ± 310.82259.50 (159.00–433.50)721585.00
Tmax_l 3.00 ± 2.632.00 (1.00–6.00)0.008.00
Tmax_m 24.51 ± 3.1724.00 (22.25–27.00)16.0030.00
Tmax_h 2.49 ± 3.461 (0–4)0.0014.00
Prec_t 100.01 ± 57.6779.50 (51.00–153.10)0.00190.60
*SD: standard deviation, Q25: first quantile of distribution, Q75: third quantile of distribution.
Table 3. Groups identified in all the analysed samples. The EMI scores has been attributed following values proposed by Parisi et al. [36].
GroupEMI ValueEMI Attribution
Acari20Default value
Araneae1Forms >5 mm EMI 1
5Small forms scarcely pigmented EMI 5
Chilopoda10Forms >5 mm, well-developed legs EMI 10
20Other forms EMI 20
Coleoptera1Clearly epigeous forms EMI 1
5Clearly epigeous forms (EMI1) and dimensions smaller than 2 mm (additional points 4)
10Clearly epigeous forms (EMI1), dimensions smaller than 2 mm (additional points 4) and the occurrence of two of the following conditions:
• thin integument, often testaceous (tan-brown) colour (additional points 5)
• hind wings highly reduced or absent (additional points 5)
• microphtalmy or anophtalmy (additional points 5)
20Clearly epigeous forms (EMI1), dimensions smaller than 2 mm (additional points 4), thin integument, often testaceous (tan-brown) colour (additional points 5), hind wings highly reduced or absent (additional points 5), microphtalmy or anophtalmy (additional points 5).
Collembola1Clearly epigeous forms: middle to large size, complex pigmentation present, long, well-developed appendages, well developed visual apparatus (eye spot and eyes)
4Small size—though not necessarily—forms, usually limited to litter, with modest pigmentation, average length of appendages, developed visual apparatus
8Hemi-edaphic forms with reduced number of ommatidia, scarcely developed appendages, often short or absent furca, pigmentation present
10Eu-edaphic forms with no pigmentation, reduction or absence of ommatidia, furca present—but reduced
20Clearly eu-edaphic forms: no pigmentation, absent furca, short appendages, presence of typical structures such as pseudo-oculi, developed postantennal organs (character not necessarily present), apomorphic sensorial structures
Diplopoda20Forms <5 mm EMI 20
Diplura20Default value
Diptera (larvae)10Default value
Hemiptera1Mostly epigeous (above-ground) or root feeding forms
Hymenoptera1Default value without Formicidae
5Formicidae
Isopoda10Default value
Opiliones10Default value
Palpigradi20Default value
Pauropoda20Default value
Protura20Default value
Pseudoscorpiones20Default value
Psocotteri1Default value
Symphyla20Default value
Thysanoptera1Default value
Other holometaboulos insects (larvae)10Default value
Other holometaboulos insects (adults)1Default value
Table 4. Results of the bidirectional stepwise linear regression model.
Coefficient.EstimateStandard Errorp-Value
Intercept64.8220.360.0023
Organic farming40.2113.080.0031
Tmax_l-3.212.260.1614
Tmax_h-4.891.570.0028
Prec-t0.230.130.0777
Prec-h-40.7821.870.0668

