Bimodal Porosity and Stability of a TiO2 Gig-Lox Sponge Infiltrated with Methyl-Ammonium Lead Iodide Perovskite


 ,
, 


Abstract
1. Introduction
2. Materials and Methods
2.1. TiO2 Gig-Lox Deposition
2.2. Perovskite Preparation
2.3. X-ray Reflectivity and X-ray Diffraction Method
2.4. Transmission Electron Microscopy Method
2.5. Scanning Transmission Electron Microscopy Method
2.6. CXDI Method
2.7. Spectroscopic Ellipsometry Method
2.8. EEP Method
3. Results and Discussion
3.1. Auto-Seeds Formation: XRR and TEM Analyses
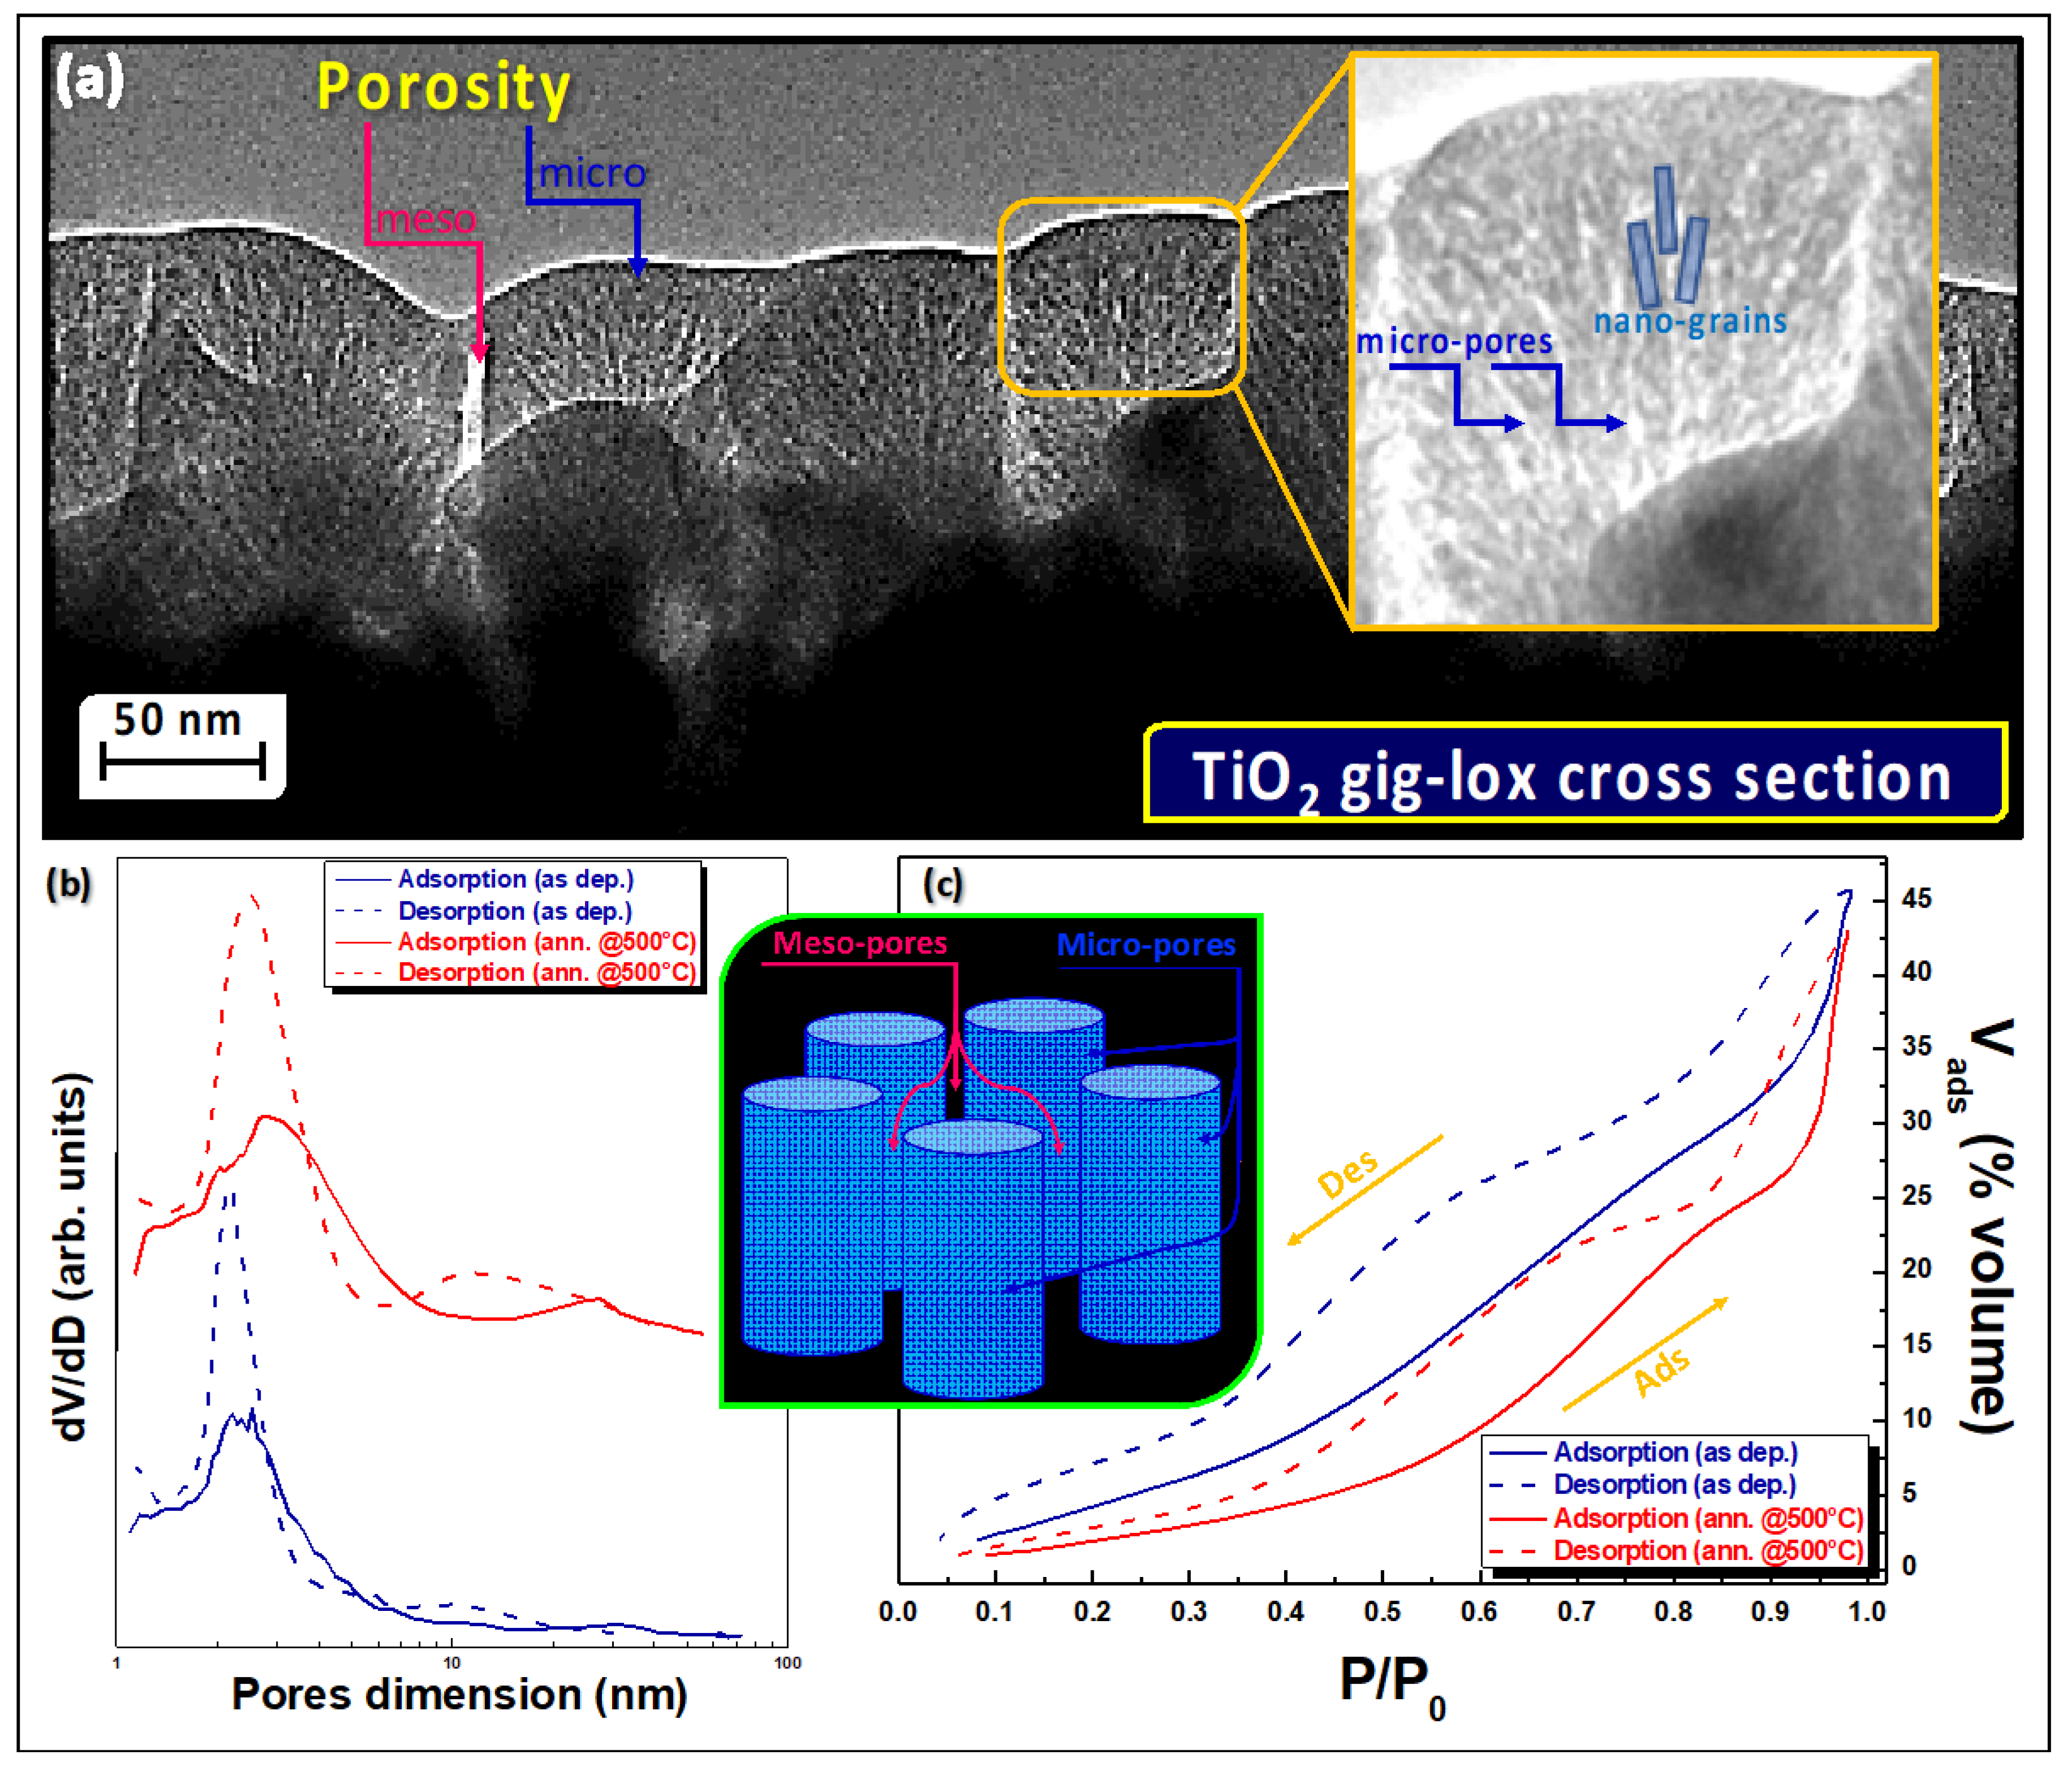
3.2. Bimodal Porosity Investigation
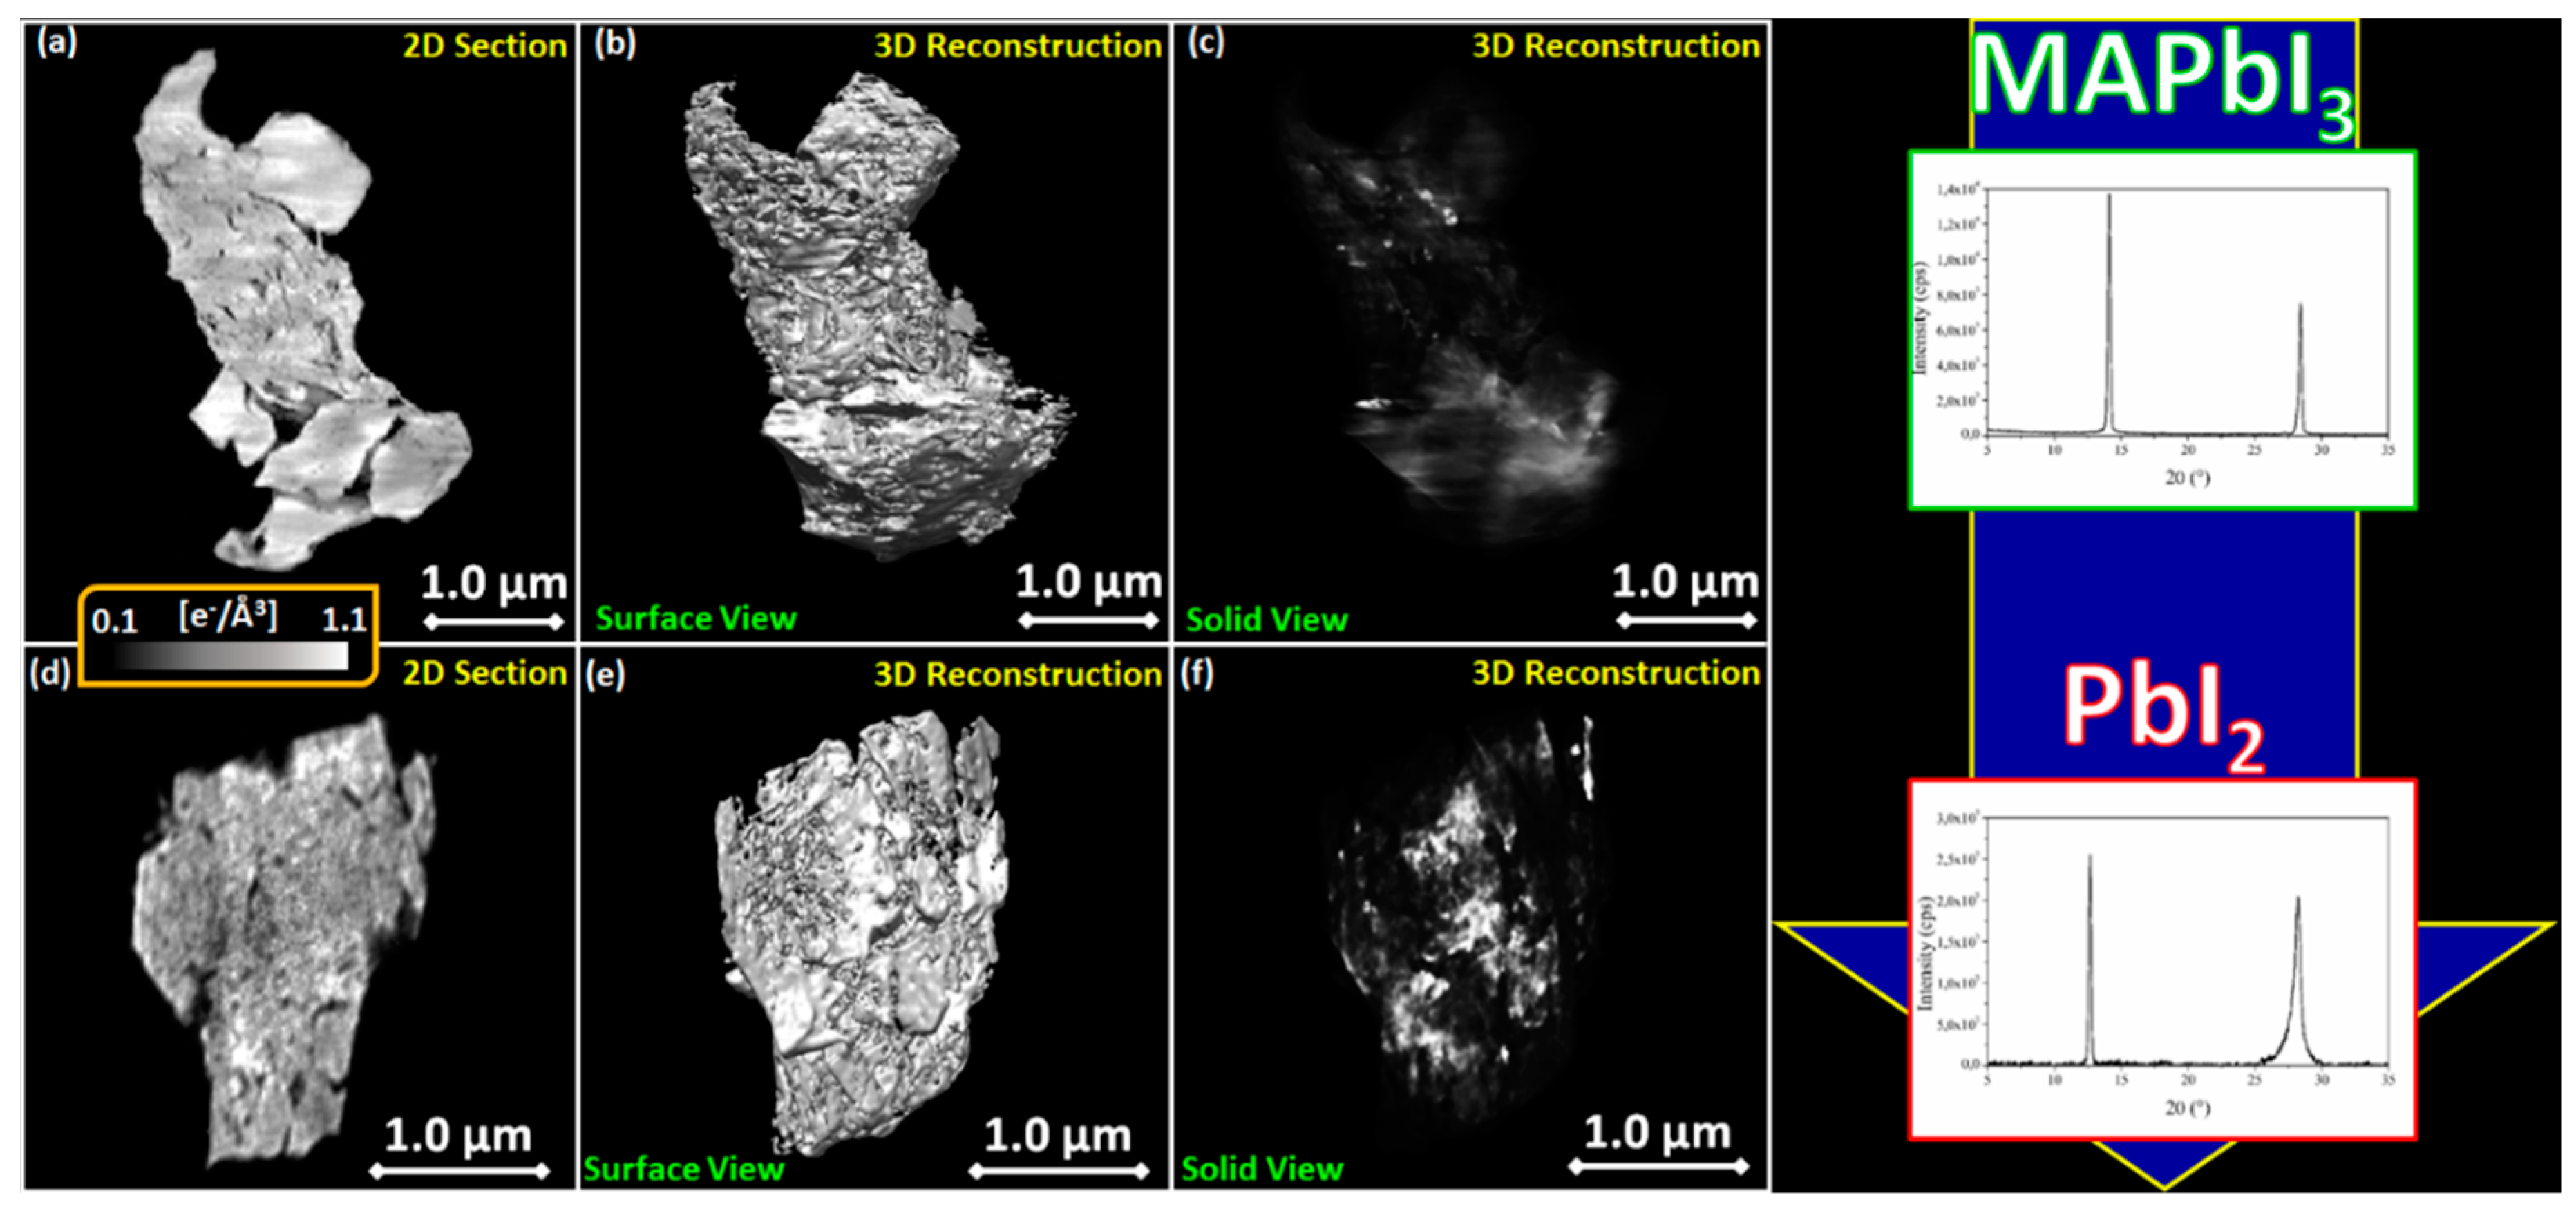
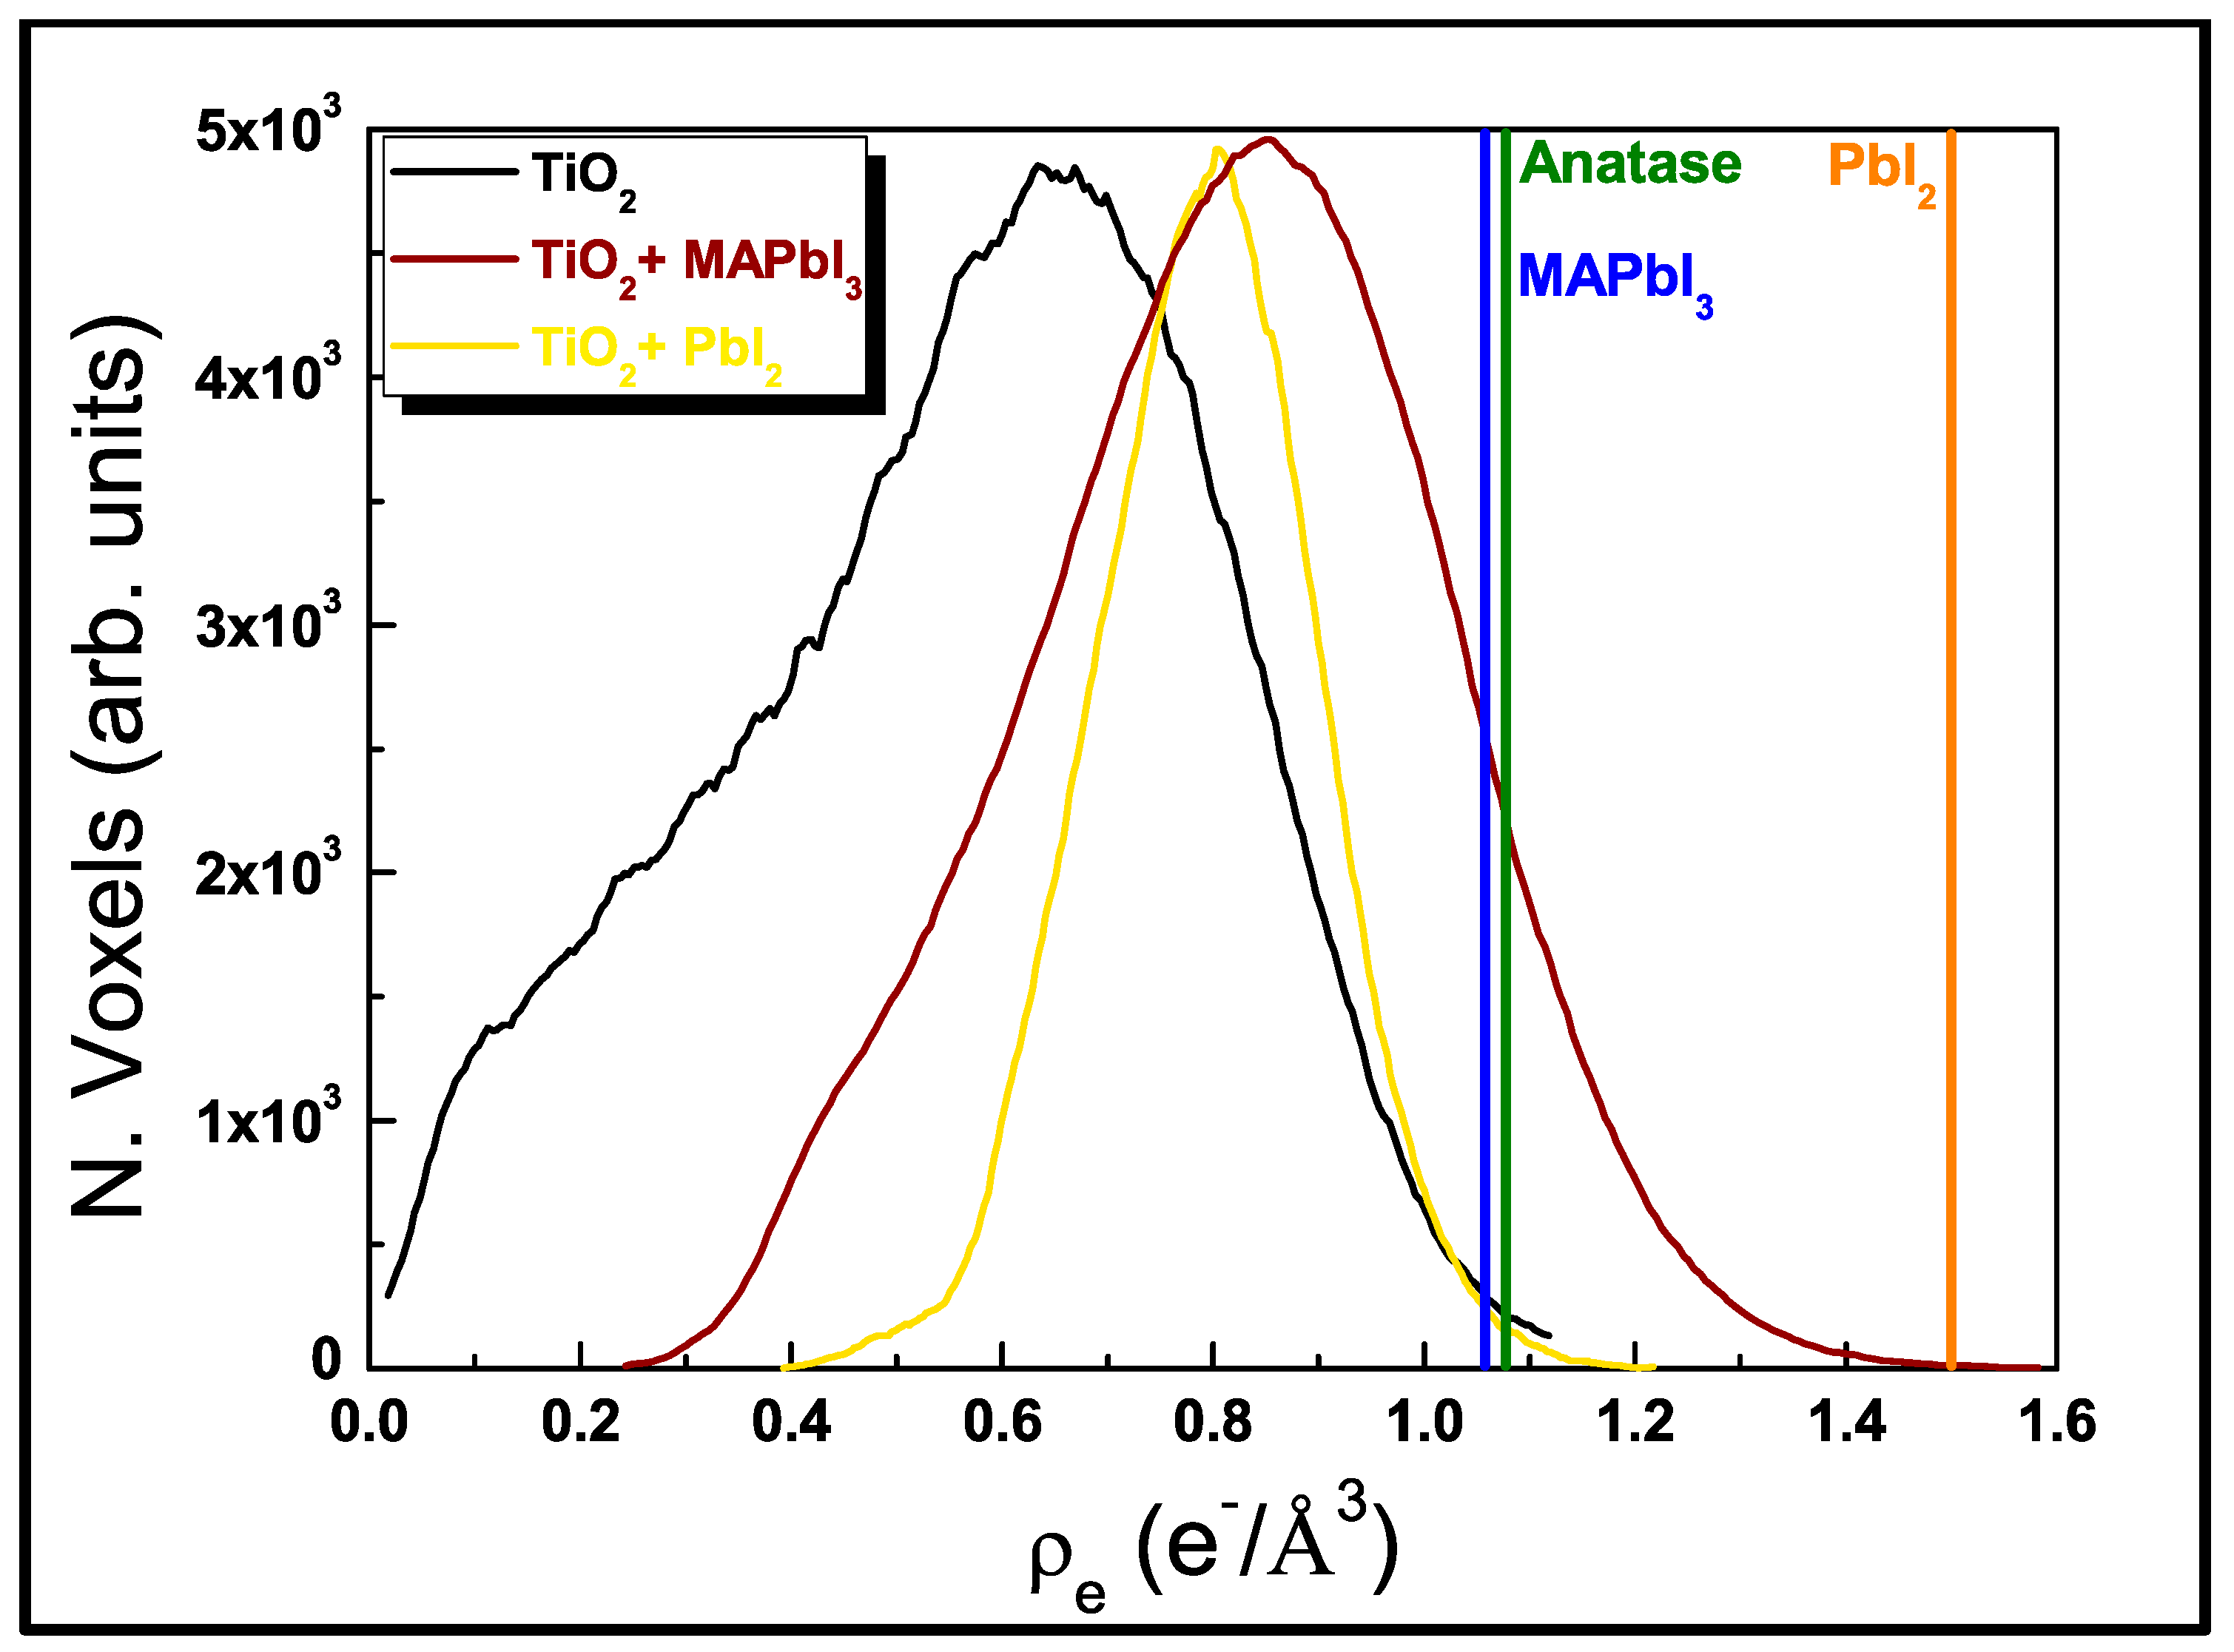
3.2.1. CXDI Analyses
3.2.2. EEP Analyses
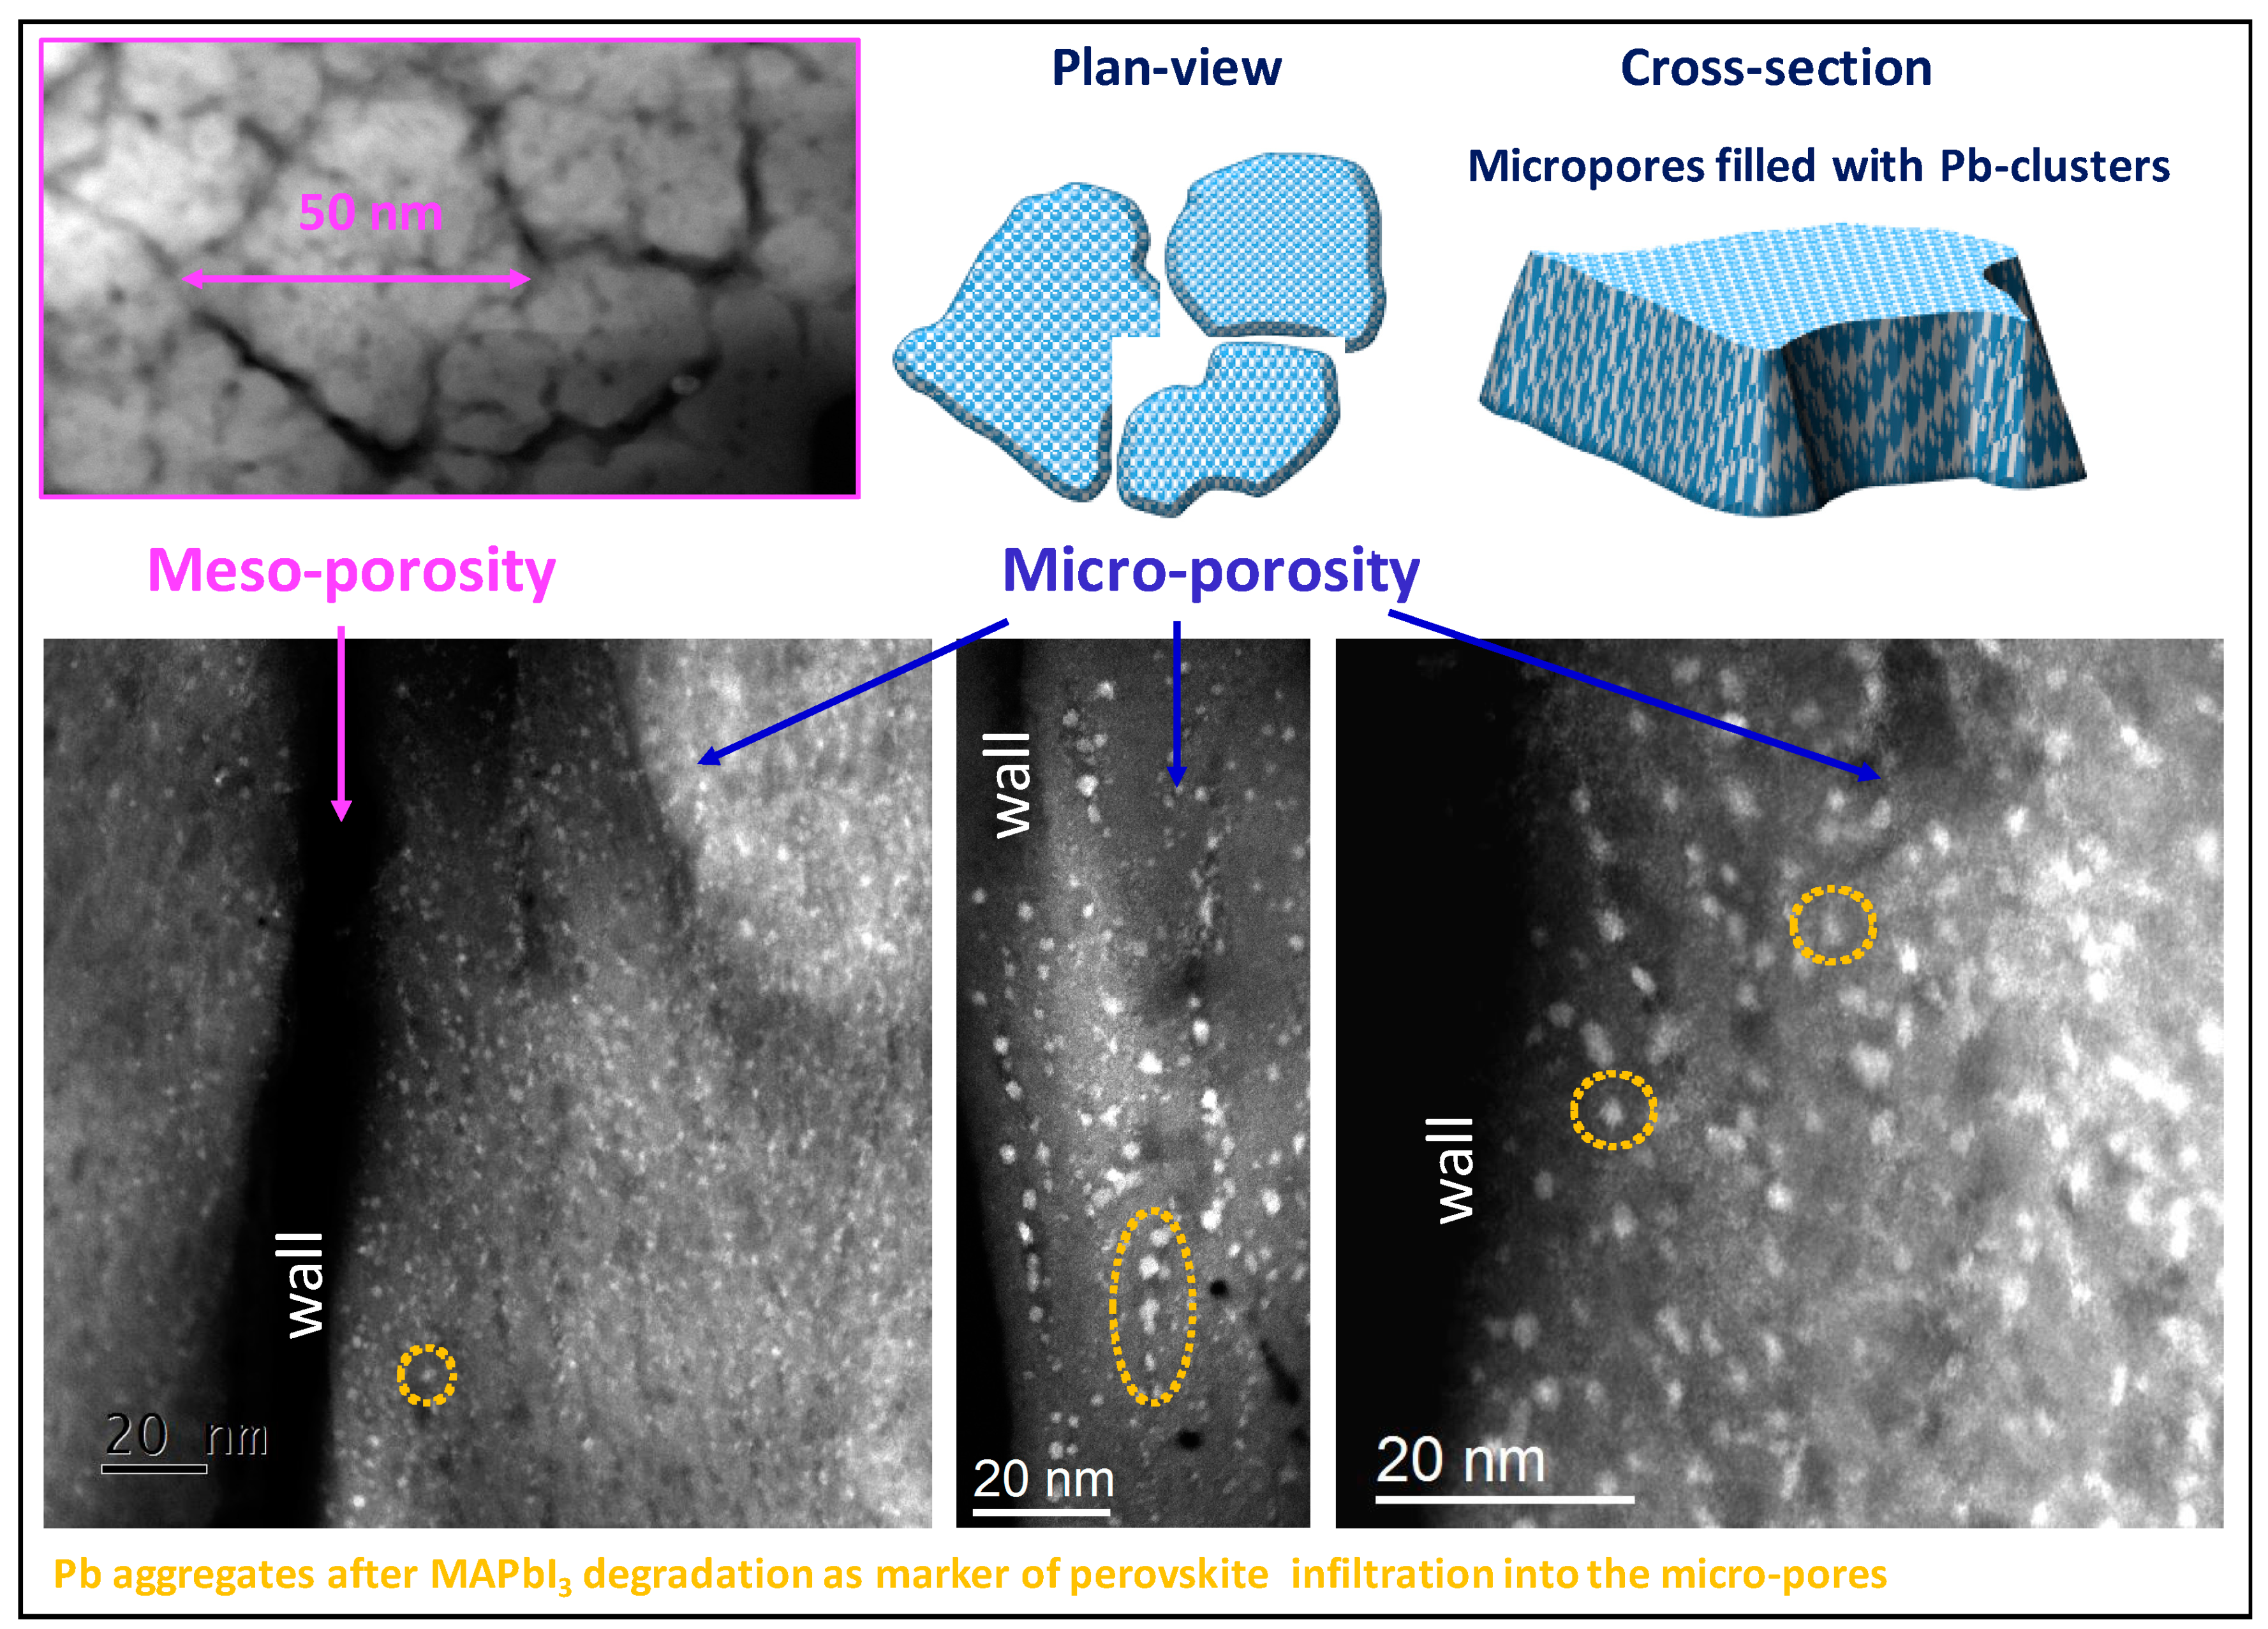
3.3. MAPbI3 Loading
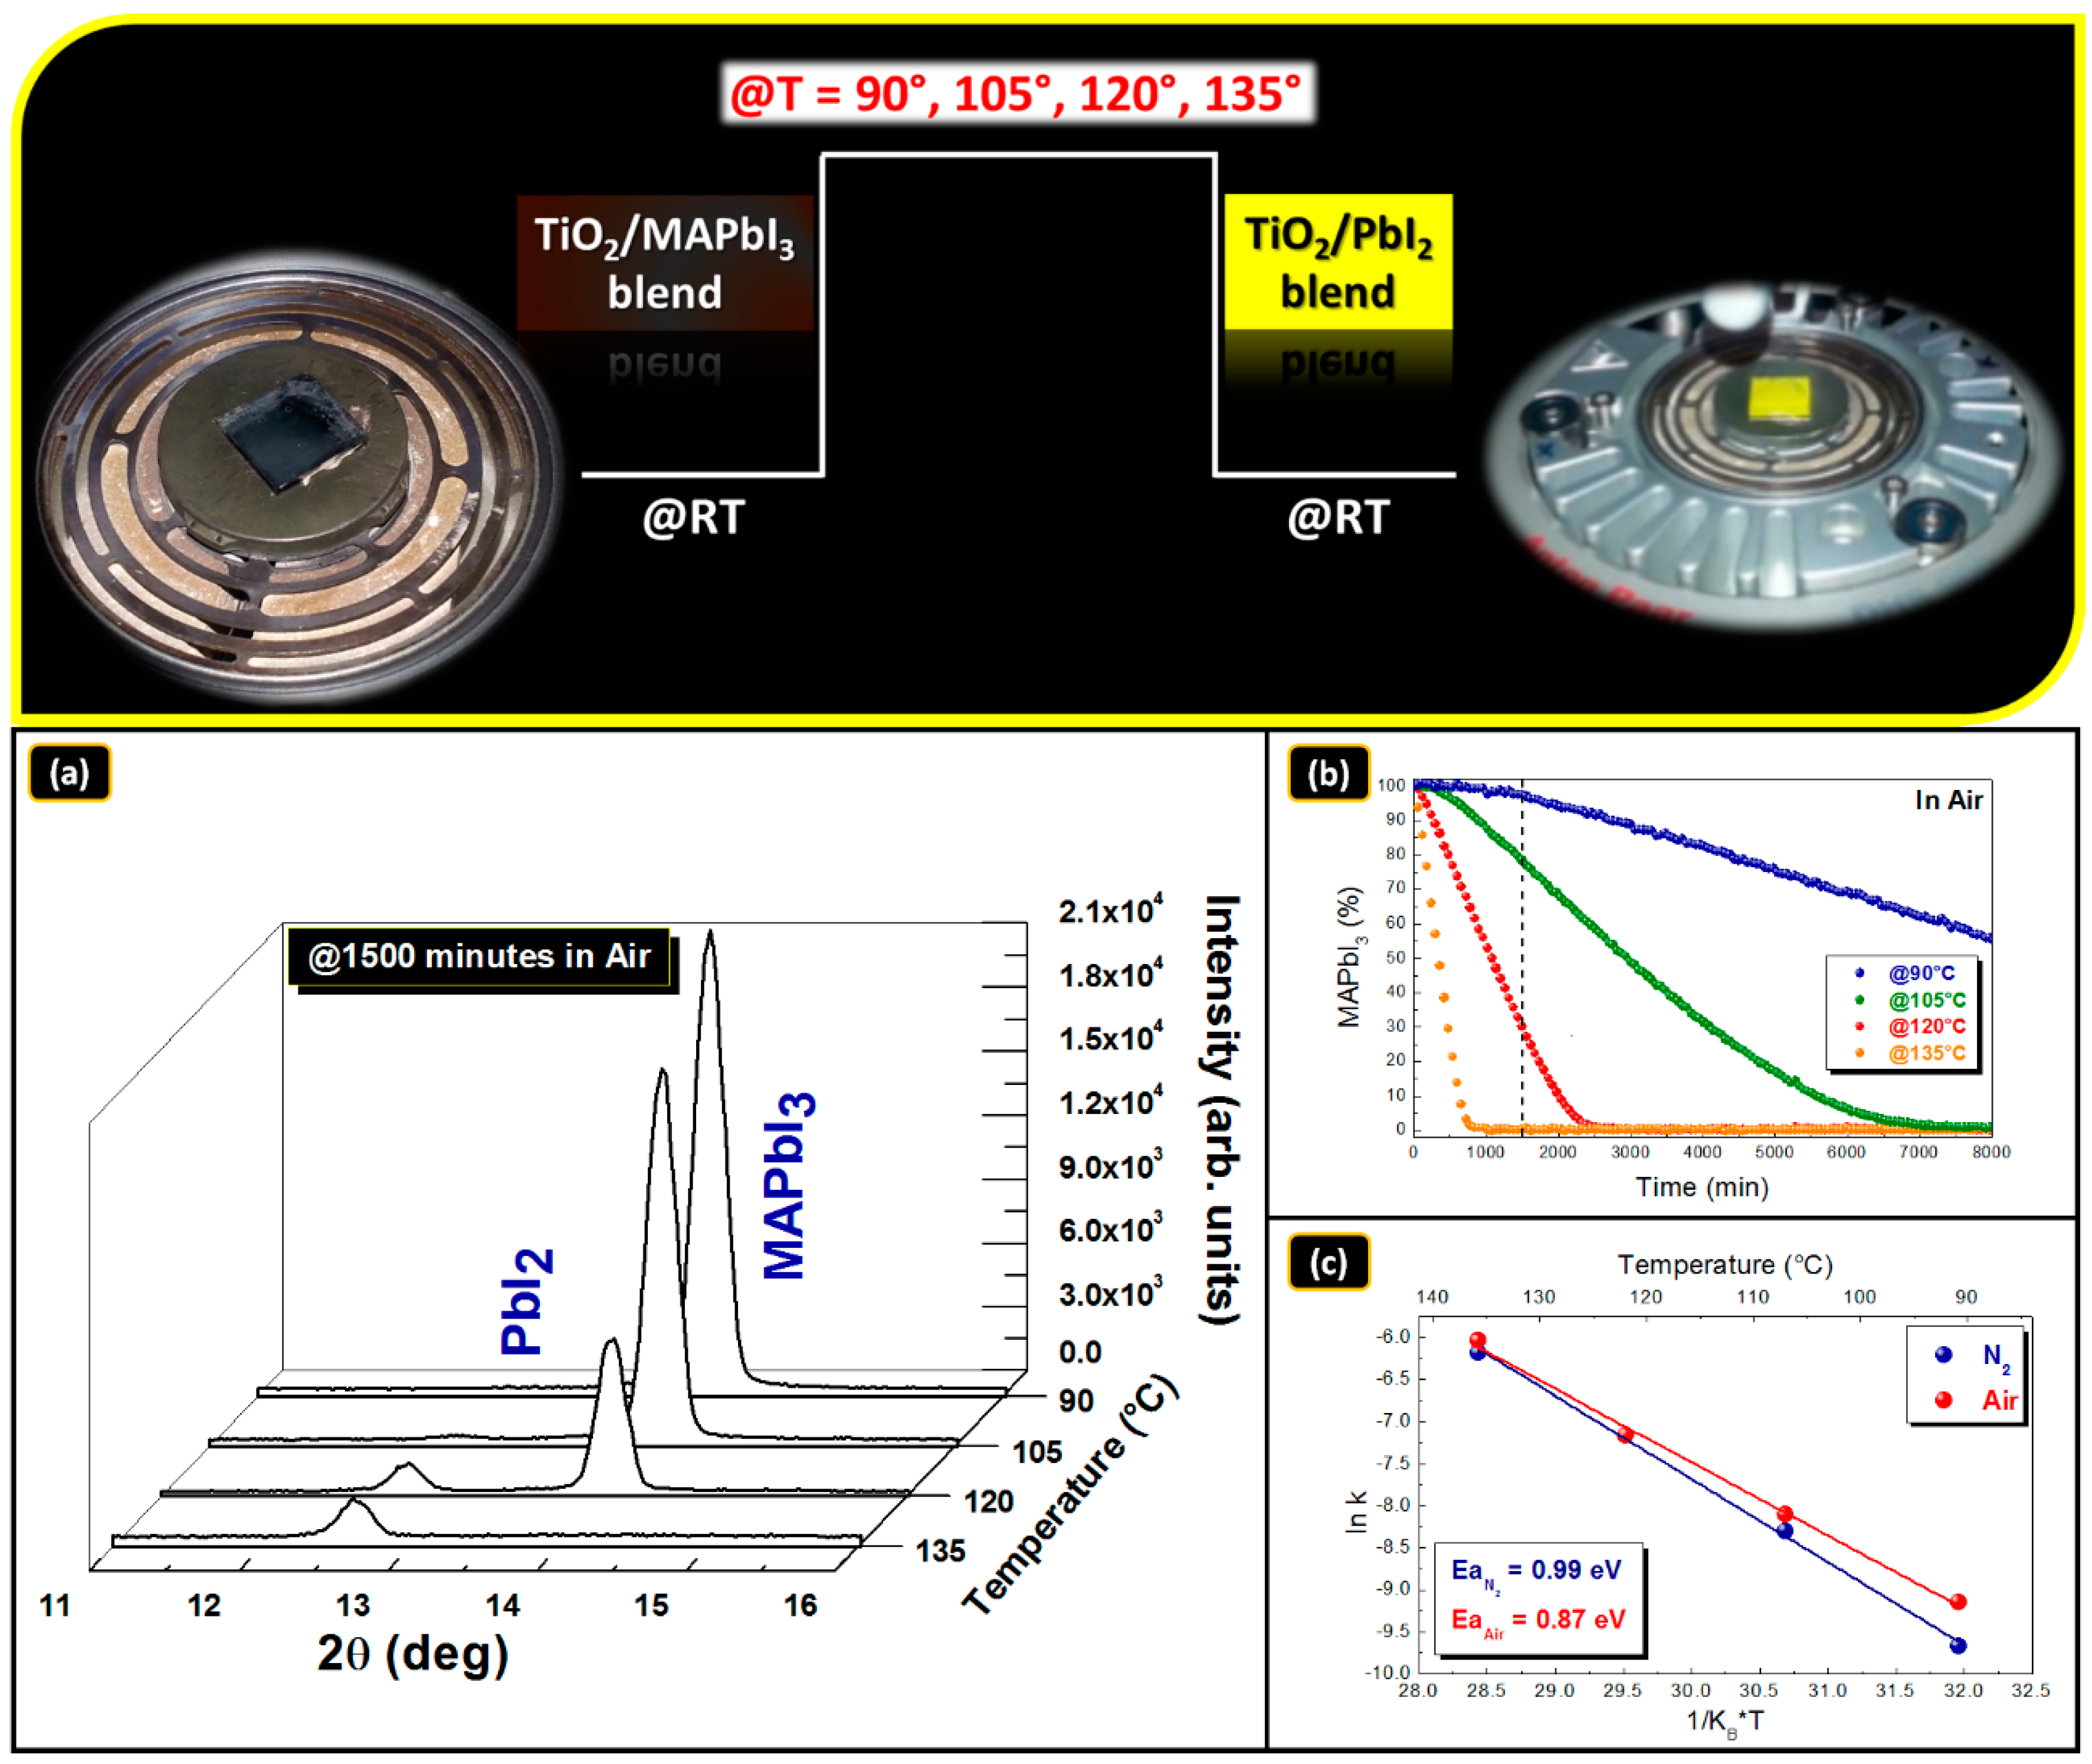
3.4. MAPbI3/TiO2 Blend Stability
4. Conclusions
Supplementary Materials
Author Contributions
Funding
Acknowledgments
Conflicts of Interest
References
- Fujishima, A.; Honda, K. Electrochemical Photolysis of Water at a Semiconductor Electrode. Nature 1972, 238, 37–38. [Google Scholar] [CrossRef] [PubMed]
- Liu, H.; Joo, J.B.; Dahl, M.; Fu, L.; Zeng, Z.; Yin, Y. Crystallinity control of TiO2 hollow shells through resin-protected calcination for enhanced photocatalytic activity. Energy Environ. Sci. 2015, 8, 286–296. [Google Scholar] [CrossRef]
- Zhuang, H.F.; Lin, C.J.; Lai, Y.K.; Sun, L.; Li, J. Some critical structure factors of titanium oxide nanotube array in its photocatalytic activity. Environ. Sci. Technol. 2007, 41, 4735–4740. [Google Scholar] [CrossRef] [PubMed]
- Alberti, A.; Bongiorno, C.; Pellegrino, G.; Sanzaro, S.; Smecca, E.; Condorelli, G.G.; Giuffrida, A.E.; Cicala, G.; Latteri, A.; Ognibene, G.; et al. Low temperature sputtered TiO2 nano sheaths on electrospun PES fibers as high porosity photoactive material. RSC Adv. 2015, 5, 73444–73450. [Google Scholar] [CrossRef]
- Ong, W.J.; Tan, L.L.; Chai, S.P.; Yong, S.T.; Mohamed, A.R. Facet-Dependent Photocatalytic Properties of TiO2-Based Composites for Energy Conversion and Environmental Remediation. Chemsuschem 2014, 7, 690–719. [Google Scholar] [CrossRef] [PubMed]
- Ong, W.J.; Tan, L.L.; Chai, S.P.; Yong, S.-T.; Mohamed, A.R. Self-assembly of nitrogen-doped TiO2 with exposed {001} facets on a graphene scaffold as photo-active hybrid nanostructures for reduction of carbon dioxide to methane. Nano Res. 2014, 7, 1528–1547. [Google Scholar] [CrossRef]
- Liu, N.; Li, K.; Li, X.; Chang, Y.; Feng, Y.; Sun, X.; Cheng, Y.; Wu, Z.; Zhang, H. Crystallographic Facet-Induced Toxicological Responses by Faceted Titanium Dioxide Nanocrystals. RSC Nano 2016, 10, 6062–6073. [Google Scholar] [CrossRef]
- Zhai, P.; Hsieh, T.Y.; Yeh, C.Y.; Reddy, K.S.K.; Hu, C.C.; Su, J.H.; Wei, T.C.; Feng, S.P. Trifunctional TiO2 Nanoparticles with Exposed {001} Facets as Additives in Cobalt-Based Porphyrin-Sensitized Solar Cells. Adv. Funct. Mater. 2015, 25, 6093–6100. [Google Scholar] [CrossRef]
- Seger, B.; Pedersen, T.; Laursen, A.B.; Vesborg, P.C.K.; Hansen, O.; Chorkendorff, I. Using TiO2 as a conductive protective layer for photocathodic H2 evolution. J. Am. Chem. Soc. 2013, 135, 1057–1064. [Google Scholar] [CrossRef]
- Kang, Q.; Cao, J.; Zhang, Y.; Liu, L.; Xu, H.; Ye, J. Reduced TiO2 nanotube arrays for photoelectrochemical water splitting. J. Mater. Chem. A 2013, 1, 5766. [Google Scholar] [CrossRef]
- Cho, I.S.; Choi, J.; Zhang, K.; Kim, S.J.; Jeong, M.J.; Cai, L.; Park, T.; Zheng, X.; Park, J.H. Highly Efficient Solar Water Splitting from Transferred TiO2 Nanotube Arrays. Nano Lett. 2015, 15, 5709–5715. [Google Scholar] [CrossRef]
- Ji, Y.; Zhang, M.; Cui, J.; Lin, K.-C.; Zheng, H.; Zhu, J.J.; Samia, A.C.S. Highly-ordered TiO2 nanotube arrays with double-walled and bamboo-type structures in dye-sensitized solar cells. Nano Energy 2012, 1, 796–804. [Google Scholar] [CrossRef]
- Roy, P.; Kim, D.; Lee, K.; Spiecker, E.; Schmuki, P. TiO2 nanotubes and their application in dye-sensitized solar cells. Nanoscale 2010, 2, 45–59. [Google Scholar] [CrossRef]
- Alberti, A.; Renna, L.; Sanzaro, S.; Smecca, E.; Mannino, G.; Bongiorno, C.; Galati, C.; Gervasi, L.; Santangelo, A.; La Magna, A. Innovative spongy TiO2 layers for gas detection at low working temperature. Sens. Actuators B Chem. 2018, 259, 658–667. [Google Scholar] [CrossRef]
- Smecca, E.; Sanzaro, S.; Grosso, D.; Bottein, T.; Mannino, G.; Condorelli, G.G.; La Magna, A.; Alberti, A. Nitrogen doped spongy TiO2 layers for sensors application. Mater. Sci. Semicond. Process. 2019, 98, 44–48. [Google Scholar] [CrossRef]
- Smecca, E.; Sanzaro, S.; Galati, C.; Renna, L.; Gervasi, L.; Santangelo, A.; Condorelli, G.G.; Grosso, D.; Bottein, T.; Mannino, G.; et al. Porous Gig-Lox TiO2 Doped with N2 at Room Temperature for P-Type Response to Ethanol. Chemosensors 2019, 7, 12. [Google Scholar] [CrossRef]
- Li, H.; Chen, Z.; Tsang, C.K.; Li, Z.; Ran, X.; Lee, C.; Nie, B.; Zheng, L.; Hung, T.; Lu, J.; et al. Electrochemical doping of anatase TiO2 in organic electrolytes for high-performance supercapacitors and photocatalysts. J. Mater. Chem. A 2014, 2, 229–236. [Google Scholar] [CrossRef]
- Chen, B.; Hou, J.; Lu, K. Formation mechanism of TiO2 nanotubes and their applications in photoelectrochemical water splitting and supercapacitors. Langmuir 2013, 29, 5911–5919. [Google Scholar] [CrossRef]
- Lai, Y.; Lin, L.; Pan, F.; Huang, J.; Song, R.; Huang, Y.; Lin, C.; Fuchs, H.; Chi, L. Bioinspired patterning with extreme wettability contrast on TiO2 nanotube array surface: A versatile platform for biomedical applications. Small 2013, 9, 2945–2953. [Google Scholar] [CrossRef]
- Huaqiong, X.W.; Huaqiong, L.P.T.; Yuekun Lai, L.; Huang, J.; Tang, Y.; Yang, L.; Chen, Z.; Zhang, K. Multifunctional wettability patterns prepared by laser processing on superhydrophobic TiO2 nanostructured surfaces. J. Mater. Chem. B Mater. Biol. Med. 2014, 3, 342–347. [Google Scholar]
- Gao, H.; Sun, M.; Lin, C.; Wang, S. Electrochemical DNA Biosensor Based on Graphene and TiO2 Nanorods Composite Film for the Detection of Transgenic Soybean Gene Sequence of MON89788. Electroanalysis 2012, 24, 2283–2290. [Google Scholar] [CrossRef]
- Chen, J.S.; Tan, Y.L.; Li, C.M.; Cheah, Y.L.; Luan, D.; Madhavi, S.; Boey, F.Y.C.; Archer, L.A.; Lou, X.W. Constructing hierarchical spheres from large ultrathin anatase TiO2 nanosheets with nearly 100% exposed (001) facets for fast reversible lithium storage. J. Am. Chem. Soc. 2010, 132, 6124–6130. [Google Scholar] [CrossRef] [PubMed]
- Wang, K.; Wei, M.; Morris, M.A.; Zhou, H.; Holmes, J.D. Mesoporous Titania Nanotubes: Their Preparation and Application as Electrode Materials for Rechargeable Lithium Batteries. Adv. Mater. 2007, 19, 3016–3020. [Google Scholar] [CrossRef]
- Guo, W.; Xue, X.; Wang, S.; Lin, C.; Wang, Z.L. An integrated power pack of dye-sensitized solar cell and Li battery based on double-sided TiO2 nanotube arrays. Nano Lett. 2012, 12, 2520–2523. [Google Scholar] [CrossRef] [PubMed]
- De Angelis, F.; Kamat, P.A. A Conversation with Michael Grätzel. RSC Energy Lett. 2017, 2, 1674–1676. [Google Scholar] [CrossRef]
- O’Regan, B.; Grätzel, M. A low-cost, high-efficiency solar cell based on dye-sensitized colloidal TiO2 films. Nature 1991, 353, 737–740. [Google Scholar] [CrossRef]
- Grätzel, M. Solar energy conversion by dye-sensitized photovoltaic cells. Inorg. Chem. 2005, 44, 6841–6851. [Google Scholar] [CrossRef] [PubMed]
- Miyasaka, T. Perovskite Photovoltaics: Rare Functions of Organo Lead Halide in Solar Cells and Optoelectronic Devices. Chem. Lett. 2015, 44, 720–729. [Google Scholar] [CrossRef]
- Idota, Y.; Kubota, T.; Matsufuji, A.; Maekawa, Y.; Miyasaka, T. Tin-based amorphous oxide: A high-capacity lithium-ion-storage material. Science 1997, 276, 1395–1397. [Google Scholar] [CrossRef]
- Kogo, A.; Iwasaki, S.; Ikegami, M.; Miyasaka, T. An Ultrathin Sputtered TiO2 Compact Layer for Mesoporous Brookite-based Plastic CH3NH3PbI3−xClx Solar Cells. Chem. Lett. 2017, 46, 530–532. [Google Scholar] [CrossRef]
- Sulaeman, U.; Zuhairi Abdullah, A. The way forward for the modification of dye-sensitized solar cell towards better power conversion efficiency. Renew. Sustain. Energy Rev. 2017, 74, 438–452. [Google Scholar] [CrossRef]
- Ge, M.; Cao, C.; Huang, J.; Li, S.; Chen, Z.; Zhang, K.Q.; Al-deyab, S.S.; Lai, Y. A Review of One-dimensional TiO2 Nanostructured Materials for Environmental and Energy Applications. J. Mater. Chem. A 2016, 4, 6772–6801. [Google Scholar] [CrossRef]
- Alberti, A.; De Marco, L.; Pellegrino, G.; Condorelli, G.G.; Giannuzzi, R.; Scarfiello, R.; Manca, M.; Spinella, C.; Gigli, G.; La Magna, A. Combined strategy to realize efficient photoelectrodes for low temperature fabrication of dye solar cells. RSC Appl. Mater. Interfaces 2014, 6, 6425–6433. [Google Scholar] [CrossRef] [PubMed]
- Alberti, A.; Pellegrino, G.; Condorelli, G.G.; Bongiorno, C.; Morita, S.; La Magna, A.; Miyasaka, T. Efficiency enhancement in ZnO:Al-based dye-sensitized solar cells structured with sputtered TiO2 blocking layers. J. Phys. Chem. C 2014, 118, 6576–6585. [Google Scholar] [CrossRef]
- Pellegrino, G.; Condorelli, G.G.; Privitera, V.; Cafra, B.; Di Marco, S.; Alberti, A. Dye-Sensitizing of Self-Nanostructured Ti(:Zn)O2/AZO Transparent Electrodes by Self-Assembly of 5,10,15,20-Tetrakis(4-carboxyphenyl)porphyrin. J. Phys. Chem. C 2011, 115, 7760–7767. [Google Scholar] [CrossRef]
- Pellegrino, G.; Condorelli, G.G.; De Rossi, F.; Brown, T.M.; Giovenale, F.; Bongiorno, C.; Alberti, A. Thermally induced structural modifications of nano-sized anatase films and the effects on the dye-TiO2 surface interactions. Appl. Surf. Sci. 2014, 296, 69–78. [Google Scholar] [CrossRef]
- Sanzaro, S.; La Magna, A.; Smecca, E.; Mannino, G.; Pellegrino, G.; Fazio, E.; Neri, F.; Alberti, A. Controlled Al3+ Incorporation in the ZnO Lattice at 188 °C by Soft Reactive Co-Sputtering for Transparent Conductive Oxides. Energies 2016, 9, 433. [Google Scholar] [CrossRef]
- Alberti, A.; Bongiorno, C.; Pellegrino, G. Anatase/Rutile nucleation and growth on (0002) and (11–20) oriented ZnO:Al/glass substrates at 150 °C. Thin Solid Film. 2014, 555, 3–8. [Google Scholar] [CrossRef]
- Colella, S.; Mosconi, E.; Pellegrino, G.; Alberti, A.; Guerra, V.L.P.; Masi, S.; Listorti, A.; Rizzo, A.; Condorelli, G.G.; De Angelis, F.; et al. Elusive presence of chloride in mixed halide perovskite solar cells. J. Phys. Chem. Lett. 2014, 5, 3532–3538. [Google Scholar] [CrossRef]
- Pellegrino, G.; Colella, S.; Deretzis, I.; Condorelli, G.G.; Smecca, E.; Gigli, G.; La Magna, A.; Alberti, A. Texture of MAPbI3 Layers assisted by Chloride on Flat TiO2 Substrates. J. Phys. Chem. C 2015, 119, 19808–19816. [Google Scholar] [CrossRef]
- Deretzis, I.; Alberti, A.; Pellegrino, G.; Smecca, E.; Giannazzo, F.; Sakai, N.; Miyasaka, T.; La Magna, A. Atomistic origins of CH3NH3PbI3 degradation to PbI2 in vacuum. Appl. Phys. Lett. 2015, 106, 131904–131917. [Google Scholar] [CrossRef]
- Smecca, E.; Numata, Y.; Deretzis, I.; Pellegrino, G.; Boninelli, S.; Miyasaka, T.; La Magna, A.; Alberti, A. Stability of solution-processed MAPbI3 and FAPbI3 layeres. Phys. Chem. Chem. Phys. 2016, 18, 13413–13422. [Google Scholar] [CrossRef] [PubMed]
- Deretzis, I.; Di Mauro, B.N.; Alberti, A.; Pellegrino, G.; Smecca, E.; La Magna, A. Spontaneous bidirectional ordering of CH3N in lead iodide perovskites at room temperature: The origins of the tetragonal phase. Sci. Rep. 2016, 6, 24443–24452. [Google Scholar] [CrossRef] [PubMed]
- Alberti, A.; Deretzis, I.; Mannino, G.; Smecca, E.; Sanzaro, S.; Numata, Y.; Miyasaka, T.; La Magna, A. Revealing a Discontinuity in the Degradation Behavior of CH3NH3PbI3 during Thermal Operation. J. Phys. Chem. C 2017, 121, 13577–13585. [Google Scholar] [CrossRef]
- Mannino, G.; Alberti, A.; Deretzis, I.; Smecca, E.; Sanzaro, S.; Numata, Y.; Miyasaka, T.; La Magna, A. First Evidence of CH3NH3PbI3 Optical Constants Improvement in a N2 Environment in the Range 40–80 °C. J. Phys. Chem. C 2017, 121, 7703–7710. [Google Scholar] [CrossRef]
- Alberti, A.; Mannino, G.; Dreretzis, I.; Smecca, E.; Sanzaro, S.; La Magna, A.; Numata, Y.; Miyasaka, T. Structural and Optical Behaviour of MAPbI3 Layers in Nitrogen and Humid Air. In Proceedings of the 2018 IEEE 4th International Forum on Research and Technology for Society and Industry (RTSI), Palermo, Italy, 10–13 September 2018. [Google Scholar]
- Alberti, A.; Deretzis, I.; Pellegrino, G.; Bongiorno, C.; Smecca, E.; Mannino, G.; Giannazzo, F.; Condorelli, G.G.; Sakai, N.; Miyasaka, T.; et al. Similar Structural Dynamics for the Degradation of CH3NH3PbI3 in Air and in Vacuum. Chemphyschem 2015, 16, 3064–3071. [Google Scholar] [CrossRef] [PubMed]
- Sanzaro, S.; Smecca, E.; Mannino, G.; Bongiorno, C.; Pellegrino, G.; Neri, F.; Malandrino, G.; Catalano, M.R.; Condorelli, G.G.; Iacobellis, R.; et al. Multi-Scale-Porosity TiO2 scaffolds grown by innovative sputtering methods for high throughput hybrid photovoltaics. Sci. Rep. 2016, 6, 39509–39524. [Google Scholar] [CrossRef]
- Sanzaro, S.; Fazio, E.; Neri, F.; Smecca, E.; Bongiorno, C.; Mannino, G.; Puglisi, R.A.; La Magna, A.; Alberti, A. Pervasive infiltration and multi-branch chemisorption of N-719 molecules into newly designed spongy TiO2 layers deposited by gig-lox sputtering processes. J. Mater. Chem. A 2017, 5, 25529–25538. [Google Scholar] [CrossRef]
- Palazon, F.; Pérez-del-Rey, D.; Marras, S.; Prato, M.; Sessolo, M.; Bolink, H.J.; Manna, L. Coating Evaporated MAPI Thin Films with Organic Molecules: Improved Stability at High Temperature and Implementation in High-Efficiency Solar Cells. ACS Energy Lett. 2018, 3, 835–839. [Google Scholar] [CrossRef]
- Alberti, A.; Bongiorno, C.; Smecca, E.; Deretzis, I.; La Magna, A.; Spinella, C. Pb clustering and PbI2 nanofragmentation during methylammonium lead iodide perovskite degradation. Nat. Commun. 2019, 10, 2196. [Google Scholar] [CrossRef]
- Alberti, A.; Deretzis, I.; Mannino, G.; Smecca, E.; Giannazzo, F.; Listorti, A.; Colella, S.; Masi, S.; La Magna, A. Nitrogen soaking promotes lattice recovery in polycrystalline hybrid perovskites. Adv. Energy Mater. 2019, 9, 1803450. [Google Scholar] [CrossRef]
- Alberti, A.; Smecca, E.; Sanzaro, S.; Mannino, G.; Deretzis, I.; La Magna, A. Hybrid perovskites for photovoltaics: Story, challenges and opportunities. La Riv. Nuovo Cimento 2019, 42, 301. [Google Scholar]
- Cao, Y.; Saygili, Y.; Ummadisingu, A.; Teuscher, J.; Luo, J.; Pellet, N.; Giordano, F.; Zakeeruddin, S.M.; Moser, J.-E.; Freitag, M.; et al. 11% efficiency solid-state dye-sensitized solar cells with copper(II/I) hole transport materials. Nat. Commun. 2017, 8, 15390–15404. [Google Scholar] [CrossRef] [PubMed]
- Lin, J.; Heo, Y.-U.; Nattestad, A.; Sun, Z.; Wang, L.; Kim, J.H.; Dou, S.X. 3D Hierarchical Rutile TiO2 and Metal-free Organic Sensitizer Producing Dye-sensitized Solar Cells 8.6% Conversion Efficiency. Sci. Rep. 2015, 4, 5769. [Google Scholar] [CrossRef] [PubMed]
- Lin, J.; Zhao, L.; Heo, Y.U.; Wang, L.; Bijarbooneh, F.H.; Mozer, A.J.; Nattestad, A.; Yamauchi, Y.; Dou, S.X.; Kim, J.H. Mesoporous anatase single crystals for efficient Co(2+/3+)-based dye-sensitized solar cells. Nano Energy 2015, 11, 557–567. [Google Scholar] [CrossRef]
- Lin, J.; Heo, Y.-U.; Nattestad, A.; Shahabuddin, M.; Yamauchi, Y.; Kim, J.H. N71- and D149-sensitized 3D hierarchical rutile TiO2 solar cells—A comparative study. Phys. Chem. Chem. Phys. 2015, 17, 7208–7213. [Google Scholar] [CrossRef] [PubMed]
- Thornton, J.A. The microstructure of sputter-deposited coatings. J. Vac. Sci. Technol. A Vac. Surf. Film. 1986, 4, 3059–3065. [Google Scholar] [CrossRef]
- Movchan, B.A.; Demchishin, A.V. Structure and Properties of Thick Condensates of Nickel, Titanium, Tungsten, Aluminum Oxides and Zirconium Dioxide in Vacuum. Fiz. Metal. Metalloved. 1969, 28, 83–90. [Google Scholar]
- Kang, S.H.; Kang, M.-S.; Kim, H.-S.; Kim, J.-Y.; Chung, Y.-H.; Smyrl, W.H.; Sung, Y.-E. Columnar rutile TiO2 based dye-sensitized solar cells by radio-frequency magnetron sputtering. J. Power Sources 2008, 184, 331–335. [Google Scholar] [CrossRef]
- Gómez, M.M.; Lu, J.; Olsson, E.; Hagfeldt, A.; Granqvist, C. High efficiency dye-sensitized nanocrystalline solar cells based on sputter deposited Ti oxide films. Sol. Energy Mater. Sol. Cells 2000, 64, 385–392. [Google Scholar] [CrossRef]
- González-García, L.; González-Valls, I.; Lira-Cantu, M.; Barranco, A.; González-Elipe, A.R. Aligned TiO2 nanocolumnar layers prepared by PVD-GLAD for transparent dye sensitized solar cells. Energy Environ. Sci. 2011, 4, 3426–3435. [Google Scholar] [CrossRef]
- Li, Z.; Teng, Y.; Xing, L.; Zhang, N.; Zhang, Z. Enhancement of the photocatalytic property of TiO2 columnar nanostructured films by changing deposition angle. Mater. Res. Bull. 2014, 50, 68–72. [Google Scholar] [CrossRef]
- Motemani, Y.; Greulich, C.; Khare, C.; Lopian, M.; Buenconsejo, P.J.S.; Schildhauer, T.A.; Ludwig, A.; Köller, M. Adherence of human mesenchymal stem cells on Ti and TiO2 nano-columnar surfaces fabricated by glancing angle sputter deposition. Appl. Surf. Sci. 2014, 292, 626–631. [Google Scholar] [CrossRef]
- Pihosh, Y.; Turkevych, I.; Ye, J.; Goto, M.; Kasahara, A.; Kondo, M.; Tosa, M. Photocatalytic Properties of TiO2 Nanostructures Fabricated by Means of Glancing Angle Deposition and Anodization. J. Electrochem. Soc. 2009, 156, K160–K165. [Google Scholar] [CrossRef]
- Sanchez-Sobrado, O.; Mendes, M.J.; Haque, S.; Mateus, T.; Araujo, A.; Aguas, H.; Fortunato, E.; Martins, R. Colloidal-lithographed TiO2 photonic nanostructures for solar cell light trapping. J. Mater. Chem. C 2017, 5, 6852–6861. [Google Scholar] [CrossRef]
- Nunes, D.; Pimentel, A.; Santos, L.; Barquinha, P.; Fortunato, E.; Martins, R. Photocatalytic TiO2 Nanorod Spheres and Arrays Compatible with Flexible Applications. Catalysts 2017, 7, 60. [Google Scholar] [CrossRef]
- Smecca, E.; Sanzaro, S.; Bongiorno, C.; Giannazzo, F.; Mannino, G.; La Magna, A.; Liu, M.; Vivo, P.; Listorti, A.; Calabrò, E.; et al. Nano-structured TiO2 grown by low-temperature reactive sputtering for planar perovskite solar cells. RSC Appl. Energy Mater. 2019, in press. [Google Scholar]
- Iza, D.C.; Muñoz-Rojas, D.; Musselman, K.P.; Weickert, J.; Jakowetz, A.C.; Sun, H.; Ren, R.L.Z.; Hoye, J.H.; Lee, X.; Wang, H.; et al. Nanostructured conformal hybrid solar cells: A promising architecture towards complete charge collection and light absorption. Nanoscale Res. Lett. 2013, 8, 359. [Google Scholar] [CrossRef]
- Biswas, S.; Jiménez, C.; Khan, A.; Forissier, S.; Kar, A.K.; Muñoz-Rojas, D.; Deschanvres, J.-L. Structural study of TiO2 hierarchical microflowers grown by aerosol-assisted MOCVD. Crystengcomm 2014, 19, 1535–1544. [Google Scholar] [CrossRef]
- Zhou, Q.; Li, Z.; Ni, J.; Zhang, Z. A Simple Model to Describe the Rule of Glancing Angle Deposition. Mater. Trans. 2011, 52, 469–473. [Google Scholar] [CrossRef]
- Chen, S.; Li, Z.; Zhang, Z. Anisotropic TixSn1-xO2 nanostructures prepared by magnetron sputter deposition. Nanoscale Res. Lett. 2011, 6, 326–330. [Google Scholar] [CrossRef] [PubMed]
- Sing, K.S.W.; Everett, D.H.; Haul, R.A.W.; Moscou, L.; Pierotti, R.A.; Rouquérol, J.; Siemieniewska, T. Reporting physisorption data for gas/solid systems with special reference to the determination of surface area and porosity. Pure Appl. Chem. 1985, 57, 603–619. [Google Scholar] [CrossRef]
- Following on Website: ISO/TS 80004-1:2010 Nanotechnologies-Vocabulary-Part 1: Core Terms. Available online: https://www.iso.org/standard/51240.html (accessed on 11 September 2019).
- Miao, J.; Charalambous, P.; Kirz, J.; Sayre, D. Extending the methodology of X-ray crystallography to allow imaging of micrometre-sized non-crystalline specimens. Nature 1999, 400, 342–344. [Google Scholar] [CrossRef]
- Sayre, D.; Chapman, H.N. X-ray microscopy. Acta Crystallogr. Sect. A Found. Adv. 1995, 51, 237–252. [Google Scholar] [CrossRef] [PubMed]
- Sayre, D.; Chapman, H.N.; Miao, J. On the Extendibility of X-ray Crystallography to Noncrystals. Acta Crystallogr. Sect. A Found. Crystallogr. 1998, 54, 232–239. [Google Scholar] [CrossRef]
- Chushkin, Y.; Zontone, F.; Lima, E.; De Caro, L.; Guardia, P.; Manna, L.; Giannini, C. Three-dimensional coherent diffractive imaging on non-periodic specimens at the ESRF beamline ID10. J. Synchrotron Radiat. 2014, 21, 594–599. [Google Scholar] [CrossRef] [PubMed]
- Boissiere, C.; Grosso, D.; Lepoutre, S.; Nicole, L.; Bruneau, A.B.; Sanchez, C. Porosity and mechanical properties of mesoporous thin films assessed by environmental ellipsometric porosimetry. Langmuir 2005, 21, 12362–12371. [Google Scholar] [CrossRef]
- Chapman, H.N.; Barty, A.; Marchesini, S.; Noy, A.; Hau-Riege, S.P. High-resolution ab initio three-dimensional X-ray diffraction microscopy. J. Opt. Soc. Am. A 2006, 23, 1179–1200. [Google Scholar] [CrossRef]
- Skjønsfjell, E.T.B.; Chushkin, Y.; Zontone, F.; Patil, N.; Gibaud, A.; Breiby, D.W. Wavefront metrology for coherent hard X-rays by scanning a microsphere. Opt. Express 2016, 24, 10710–10722. [Google Scholar] [CrossRef]
- Pettersen, E.F.; Goddard, T.D.; Huang, C.C.; Couch, G.S.; Greenblatt, D.M.; Meng, E.C.; Ferrin, T.E. UCSF Chimera—A visualization system for exploratory research and analysis. J. Comput. Chem. 2004, 25, 1605–1612. [Google Scholar] [CrossRef]
- De Jong, E.M.L.D.; Mannino, G.; Alberti, A.; Ruggeri, R.; Italia, M.; Zontone, F.; Chushkin, Y.; Pennisi, A.R.; Gregorkiewicz, T.; Faraci, G. Strong infrared photoluminescence in highly porous layers of large faceted Si crystalline nanoparticles. Sci. Rep. 2016, 6, 25664. [Google Scholar] [CrossRef] [PubMed]
- Schindelin, J.; Arganda-Carreras, I.; Frise, E.; Kaynig, V.; Longair, M.; Pietzsch, T.; Preibisch, S.; Rueden, C.; Saalfeld, S.; Schmid, B.; et al. Fiji: An open-source platform for biological-image analysis. Nat. Methods 2012, 9, 676–682. [Google Scholar] [CrossRef] [PubMed]
- Deretzis, I.; Smecca, E.; Mannino, G.; La Magna, A.; Miyasaka, T.; Alberti, A. Stability and Degradation in Hybrid Perovskites: Is the Glass Half-Empty or Half-Full? J. Phys. Chem. Lett. 2018, 9, 3000–3007. [Google Scholar] [CrossRef] [PubMed]
- Rothmann, M.U.; Li, W.; Zhu, Y.; Bach, U.; Spiccia, L.; Etheridge, J.; Cheng, Y.B. Direct observation of intrinsic twin domains in tetragonal CH3NH3PbI3. Nat. Commun. 2017, 8, 14547. [Google Scholar] [CrossRef] [PubMed]
- Leguy, A.M.A.; Hu, Y.; Campoy-Quiles, M.; Alonso, M.I.; Weber, O.J.; Azarhoosh, P.; Van Schilfgaarde, M.; Weller, M.T.; Bein, T.; Nelson, J.; et al. Reversible hydration of CH3NH3PbI3 in films, single crystals, and solar cells. Chem. Mater. 2015, 27, 3397–3407. [Google Scholar] [CrossRef]
- Yang, J.; Siempelkamp, B.D.; Liu, D.; Kelly, T.L. Investigation of CH3NH3PbI3 degradation rates and mechanisms in controlled humidity environments using in situ techniques. RSC Nano 2015, 9, 1955–1963. [Google Scholar] [CrossRef] [PubMed]
- Moore, D.T.; Sai, H.; Tan, K.W.; Smilgies, D.M.; Zhang, W.; Snaith, H.J.; Wiesner, U.; Estroff, L.A. Crystallization kinetics of organic-inorganic trihalide perovskites and the role of the lead anion in crystal growth. J. Am. Chem. Soc. 2015, 137, 2350–2358. [Google Scholar] [CrossRef] [PubMed]
- Ciccioli, A.; Latini, A. Thermodynamics and the Intrinsic Stability of Lead Halide Perovskites CH3NH3PbX3. J. Phys. Chem. Lett. 2018, 9, 3756–3765. [Google Scholar] [CrossRef] [PubMed]
- Frost, J.M.; Butler, K.T.; Brivio, F.; Hendon, C.H.; Van Schilfgaarde, M.; Walsh, A. Atomistic origins of high-performance in hybrid halide perovskite solar cells. Nano Lett. 2014, 14, 2584–2590. [Google Scholar] [CrossRef]


| T (°C) | N2 | Air |
|---|---|---|
| 30 | 8854 days | 1410 days |
| 60 | 210 days | 70 days |
| 80 | 25 days | 12 days |
© 2019 by the authors. Licensee MDPI, Basel, Switzerland. This article is an open access article distributed under the terms and conditions of the Creative Commons Attribution (CC BY) license (http://creativecommons.org/licenses/by/4.0/).
Share and Cite
Sanzaro, S.; Zontone, F.; Grosso, D.; Bottein, T.; Neri, F.; Smecca, E.; Mannino, G.; Bongiorno, C.; Spinella, C.; La Magna, A.; et al. Bimodal Porosity and Stability of a TiO2 Gig-Lox Sponge Infiltrated with Methyl-Ammonium Lead Iodide Perovskite. Nanomaterials 2019, 9, 1300. https://doi.org/10.3390/nano9091300
Sanzaro S, Zontone F, Grosso D, Bottein T, Neri F, Smecca E, Mannino G, Bongiorno C, Spinella C, La Magna A, et al. Bimodal Porosity and Stability of a TiO2 Gig-Lox Sponge Infiltrated with Methyl-Ammonium Lead Iodide Perovskite. Nanomaterials. 2019; 9(9):1300. https://doi.org/10.3390/nano9091300
Chicago/Turabian StyleSanzaro, Salvatore, Federico Zontone, David Grosso, Thomas Bottein, Fortunato Neri, Emanuele Smecca, Giovanni Mannino, Corrado Bongiorno, Corrado Spinella, Antonino La Magna, and et al. 2019. "Bimodal Porosity and Stability of a TiO2 Gig-Lox Sponge Infiltrated with Methyl-Ammonium Lead Iodide Perovskite" Nanomaterials 9, no. 9: 1300. https://doi.org/10.3390/nano9091300
APA StyleSanzaro, S., Zontone, F., Grosso, D., Bottein, T., Neri, F., Smecca, E., Mannino, G., Bongiorno, C., Spinella, C., La Magna, A., & Alberti, A. (2019). Bimodal Porosity and Stability of a TiO2 Gig-Lox Sponge Infiltrated with Methyl-Ammonium Lead Iodide Perovskite. Nanomaterials, 9(9), 1300. https://doi.org/10.3390/nano9091300