Abstract
Flavonoids play multiple roles in plant coloration and stress resistance and are closely associated with human health. Flavonoids and non-flavonoids (such as phenolic acids) are produced via the phenylpropanoid-derived pathway. Anthocyanidin synthase (ANS) catalyzes the synthesis of anthocyanins from leucoanthocyanidin in the flavonoids branched pathway. In this study, SmANS from Salvia miltiorrhiza was cloned and mainly localized in the endoplasmic reticulum (ER), plastids, Golgi, plasma membrane, and nucleus of tobacco epidermal cells, and was most highly expressed in purple petals in S. miltiorrhiza, whereas it showed almost no expression in white petals, green calyxes, and pistils in S. miltiorrhiza Bge f. alba. Overexpressed SmANS enhanced anthocyanin accumulation but reduced salvianolic acid B (SAB) and rosmarinic acid (RA) biosynthesis in S. miltiorrhiza and S. miltiorrhiza Bge f. alba plantlets, meanwhile, it restored the purple-red phenotype in S. miltiorrhiza Bge f. alba. These changes were due to reallocation of the metabolic flow, which was influenced by the SmANS gene. These findings indicate that SmANS not only plays a key role in anthocyanin accumulation in S. miltiorrhiza, but also acts as a “switch” for the coloration of S. miltiorrhiza Bge f. alba. This study provides baseline information for further research on flavonoids metabolism and improvement of anthocyanin or phenolic acid production by genetic engineering.
1. Introduction
Salvia miltiorrhiza Bunge (Danshen), which has purple flowers, is a traditional medicinal model plant with great medicinal and economic value, as well as an efficient genetic transformation system [1]. It has a white-flowered variant, named S. miltiorrhiza Bge f. alba (also called white-flowered Danshen in China) [2]. Although, the main effective compounds in Danshen medicinal materials are lipophilic tanshinones and hydrophilic phenolic acids, such as salvianolic acid B (SAB) and rosmarinic acid (RA) [3], abundant flavonoids components are distributed in their aerial parts [4]. However, these beneficial flavonoids are not well utilized because of the lack of awareness among people.
Flavonoids are also the major pigments responsible for the coloration of plant flowers, leaves, stems, fruits, and other organs [5]. They have been classified into different subgroups, including anthocyanin, proanthocyanidins, flavones, flavonols, flavanones, aurones, and isoflavones. Furthermore, they have various active biological roles in plant growth and development [6]. For instance, these flavonoids metabolites are involved in the color generation of plant tissues and organs, in attracting beneficial pollinators and symbionts, and in defending plants against biotic and abiotic stresses, such as insects, pathogens microbes, drought, cold, UV radiation, auxins, ABA, jasmonates, and so on [7,8,9,10]. In addition, flavonoids have a curative effect on many types of cancer, se-nilism, neuronal diseases, cardiovascular illnesses, diabetes, inflammation, and others diseases, and have been widely used for the prevention and treatment of diseases, as well as protection of human health [11].
Flavonoids and other non-flavonoids (phenolic acids and lignin) metabolites are produced via different branches of the phenylpropanoid biosynthetic pathway in S. miltiorrhiza (Figure 1) [12], and compete with each other for identical precursors (4-coumaroyl-CoA or 4-coumaric acid). The flavonoids branched pathway is controlled by a series of enzymes, such as chalcone synthase (CHS), chalcone isomerase (CHI), anthocyanidin synthase (ANS), and so on. In the phenolic acids branched pathway in S. miltiorrhiza, SAB biosynthesis has been thought to be derived from an RA precursor through two parallel pathways (phenylpropanoid-derived and tyrosine-derived pathways) [12]. Crosstalk of metabolic flow between flavonoids and other flavonoids pathways occurs regularly. In recent years, researchers have also focused on flavonoids biosynthesis because of the molecular and metabolic crosstalk. Based on the strategies of switching or reducing the synthesis of the flavonoids- or lignin-branched pathways, genetic engineering technology has been applied in S. miltiorrhiza to improve phenolic acids productions by the RNAi-mediated silencing of the SmCHS port enzyme gene in the flavonoids-branched pathway [13], co-suppression of two key endogenous enzymes (SmCCR and SmCOMT) in the lignin-branched pathway, plus ectopic expression of AtPAP1 [12]. Thus, these are also efficient methods to enhance the accumulation of SAB and RA bioactive compounds by intervening with other genes besides of the phenolic acids branched pathway. The key genes and their regulated transcription factors (myeloblastosis, helix−loop−helix, and WD repeat protein) involved in flavonoids and non-flavonoids biosynthesis, including the phenylpropanoid biosynthetic pathway, have been studied and reported in numerous plants [9,14,15,16]. MYB transcription factors often have a regulatory effect on the phenylpropanoid pathway, and interact with bHLH and WD to form MBW complexes [17,18]. In S. miltiorrhiza, SmTTG1 and SmMYB36 have been found to be involved in regulating the accumulation of both phenolic acids and anthocyanin [19,20,21].
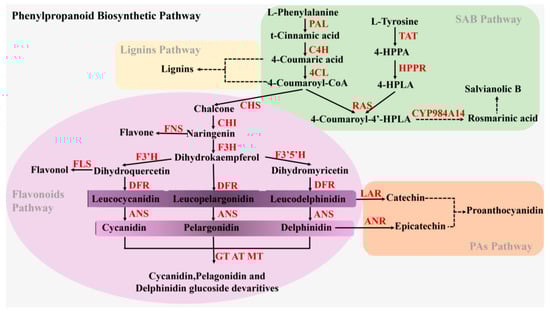
Figure 1.
The metabolic pathways of the flavonoids and phenolic acids in Salvia miltiorrhiza. Solid arrows and dashed arrows represent single-step reactions and multiple steps reactions, respectively. Multiple enzymes are indicated in red text. Abbreviations: PAL, phenylalanine ammonia-lyase; C4H, cinnamic acid 4-hydroxylase; 4CL, hydroxycinnamate coenzyme A ligase; CHS, chalcone synthase; CHI, chalcone isomerase; FNSII, Flavone synthase; F3H, flavanone 3-hydroxylase; F3’H, flavonoid 3′-hydroxylase; F3′5′H, flavonoid 3′5′-hydroxylase; DFR, dihydroflavonol reductase; ANS, anthocyanidin synthase; FLS, Flavonol synthase; GT, UDP-glucose: anthocyanidin/flavonol 3-O-glucosyltransferase; AT, acyltransferase; MT, methyltransferases; LAR, leucoanthocyanidin reductase; ANR, anthocyanidin reductase; TAT, tyrosine aminotransferase; HPPR, 4-hydroxyphenylpyruvate reductase; RAS, rosmarinic acid synthase; CYP98A14, a cytochrome P450-dependent monooxygenase.
However, ANS, which is one of the key enzyme genes downstream of the flavonoids-branched pathway, and catalyzes the transformation of leucoanthocyanidin to colored anthocyanidin before the final glycosylation steps, has been well studied in many plants, but not in S. miltiorrhiza [22,23,24,25]. This gene directly determines whether anthocyanin can be synthesized and whether plant tissues can be colored. The defects, absence, restriction, and up-regulation of ANS can change the color phenotype and the accumulation of anthocyanin, resulting in colorless, white, or other plants phenotypes [22,23,24,25]. Moreover, either the precursor substances (anthocyanin) or catalytic products (leucoanthocyanidin) of ANS can act as precursors for producing the subunits of proanthocyanidins. Previous studies have found that the ANS gene can determine the accumulation of proanthocyanidins, and affect the production of phenolic acid [26,27,28,29]. In recent years, on the basis of the databases of transcriptome and genome for S. miltiorrhiza, more and more genes and transcription factors involved in metabolic regulation have been excavated and studied [1,21,30,31]. Although, some flavonoid structure genes, including ANS, involved in flavonoids biosynthesis in S. miltiorrhiza have been identified or predicted [32], very little information is available to illuminate the functional characterization of ANS. It is extremely important to explore the role ANS plays in the color difference between S. miltiorrhiza and S. miltiorrhiza Bge f. alba. The regulatory networks of the secondary metabolism are extremely complex, and an imperceptible change in a small part can affect the whole metabolic network. Therefore, in view of the extremely important roles of ANS in plants, it is necessary to survey the functional mechanism of this gene, and its role in the regulation of other non-flavonoids branched metabolic pathways in S. miltiorrhiza.
In the present study, SmANS in S. miltiorrhiza was cloned, and we verified that its expression clearly differed in S. miltiorrhiza and S. miltiorrhiza Bge f. alba during the spatial-temporal development stages. Overexpression of SmANS was showed to promote anthocyanin concentration and alter phenolic acids accumulation both in transgenic plantlets of S. miltiorrhiza and heterogeneous S. miltiorrhiza Bge f. alba, respectively, meanwhile it restored the purple-red phenotype of S. miltiorrhiza Bge f. alba plantlets. These results suggest that SmANS is not only a key enzyme gene that controls the purple coloration of the aerial part in S. miltiorrhiza, but also acts as a switch that restricts anthocyanin accumulation and purple coloration in S. miltiorrhiza Bge f. alba white petals and green calyxes, thus providing valuable evidence for the molecular regulatory mechanism of the anthocyanin biosynthetic pathway, as well as the crosstalk between flavonoids and phenolic acid metabolism in S. miltiorrhiza.
2. Results
2.1. Isolation and Bioinformatics Analysis of SmANS
SmANS (GenBank accession number: MK704422) was cloned and identified from purple petals in S. miltiorrhiza, it contained a 1110 bp ORF encoding a protein of 369 amino acids with a predicted molecular mass of 41.489 kDa. SmANS, a single copy gene in S. miltiorrhiza, contained typical ANS-specific conserved motifs and belongs to the 2OG-Fe(II) oxygenase superfamily. In a comparative analysis of the sequences of SmANS and ANS from S. miltiorrhiza Bge f. alba, the results indicated that both of them were consistent and had 99.98% identity. To visually describe the evolutionary origins, a phylogenetic tree was constructed using the SmANS and the ANS protein sequences from the other species listed in Table A2. The results showed that SmANS was classified into the eudicots group and clearly differed from the monocotyledonous and phycophyta (Zostera marina) groups (Figure A1). The putative amino acid sequence of SmANS had the closest relationship to Plectranthus scutellarioides amino acid sequences with 86% identity. It showed 79% identity with the ANS from Arabidopsis thaliana.
2.2. Spatio-Temporal Expression of SmANS in S. miltiorrhiza and S. miltiorrhiza Bge f. alba
Quantitative real-time PCR (qRT-PCR) was conducted to investigate the spatial-temporal expression patterns of SmANS in various organs including the root, stem, leaf, calyx, petal, pistil, and stamen, as well as the full flower organs of four flowering stages from two-year-old S. miltiorrhiza and S. miltiorrhiza Bge f. alba. SmANS showed remarkably higher expression in the purple petals than the other tissues, and was the lowest in the roots of S. miltiorrhiza (Figure 2A). Moreover, SmANS was expressed at highest levels in the stamens (with yellow and purple blue pollen) compared with the leaves, stems, and roots, but showed almost no expression in the white petal, green calyx, and pistil of S. miltiorrhiza Bge f. alba (Figure 2B). During floral development, the expression of SmANS in purple flowers of S. miltiorrhiza displayed a slowly and then sharply rising trend from the F1 (young-bud) stage to the F3 (pre-bloom petal) stage, whereas it decreased in the F4 (full-bloom petal) stage (Figure 2C). However, the expression levels of SmANS in white flowers of S. miltiorrhiza Bge f. alba exhibited a quickly falling trend from the F1 to F2 (medium-bud) stage, a small increase in the F3 stage (Figure 2D), and a slight decrease again in the F4 stage. These findings uncover that the expression levels of SmANS may cause the color phenotypic differences between S. miltiorrhiza and S. miltiorrhiza Bge f. alba.
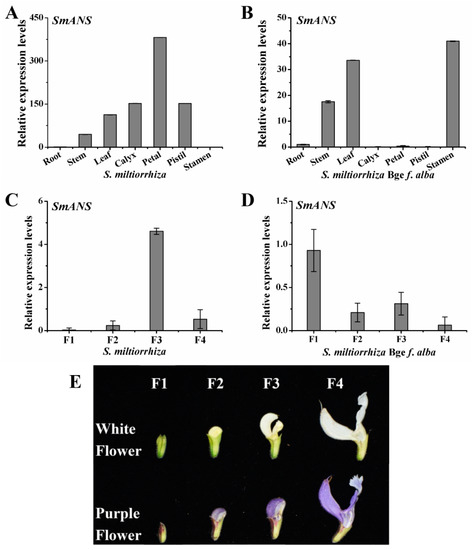
Figure 2.
Spatial-temporal expression of SmANS in Salvia miltiorrhiza and S. miltiorrhiza Bge f. alba. (A) Relative expression levels of SmANS in various organs of S. miltiorrhiza; (B) Relative expression levels of SmANS in various organs of S. miltiorrhiza Bge f. alba; (C,D) Relative expression levels of SmANS in flowers of four flowering stages from S. miltiorrhiza and S. miltiorrhiza Bge f. alba, respectively; (E) The purple flowers S. miltiorrhiza and white flowers S. miltiorrhiza Bge f. alba of four flowering stages. F1, young-bud; F2, medium-bud; F3, pre-bloom petal; and F4, full-bloom petal. The vertical bars show the SD values from three independent biological replicates.
2.3. Subcellular Location of SmANS Protein
For localization of the SmANS protein, the ORF of SmANS was fused to the 5′-terminus of the GFP reporter gene of pA7 vector controlled by the CaMV 35S promoter. The transient expression system of SmANS-GFP fusion proteins in Nicotiana benthamiana was performed to analyze in this study. The GFP fluorescence signals of the pA70390-GFP control were observed throughout the leaf epidermal cells of N. benthamiana (Figure 3B). In addition, the GFP fluorescence signals of SmANS were dispersed in the Golgi, ER (endoplasmic reticulum), and plastids of cytoplasm, as well as in the plasma membrane (Figure 3C–F). Moreover, the cell nucleus was full of strong fluorescent signals. Therefore, the SmANS protein was mainly localized in the Golgi, ER, plastids, plasma membrane, and nucleus. These results suggest that the anthocyanins synthesis was catalyzed by a multienzyme complex containing SmANS on the ER membranes, and was finally accumulated in the vacuole through transportation in and out of the cell.

Figure 3.
Subcellular localization of SmANS in Nicotiana benthamiana leaf epidermal cells. (A) Schematic representation of recombinant vector pA70390-GFP-SmANS; (B) Subcellular localization of pA70390 with the control (no SmANS inserted); (C–F) Golgi, endoplasmic reticulum (ER), plastids, and plasma membrane localization of PA70390-GFP-SmANS in N. benthamiana leaves epidermal cells (SmANS inserted), respectively. Merged, the overlapping field of GFP and mCherry. GFP, green fluorescent field. mCherry, red fluorescent channel field of Golgi, ER, plastids, and plasma membrane marker. Scale bars, 20 μm.
2.4. Generation of SmANS-Overexpressing Transgenic S. miltiorrhiza and S. miltiorrhiza Bge f. alba Plantlets
In the present study, independent transgenic plantlets exhibiting SmANS overexpression in S. miltiorrhiza and S. miltiorrhiza Bge f. alba were obtained and identified using PCR to investigate the potential functional roles of SmANS involved in the flavonoids biosynthesis of the two kinds of S. miltiorrhiza. The qRT-PCR results demonstrated that the expression levels of SmANS were significantly increased not only in overexpressed S. miltiorrhiza lines (A9, A34, and A64), but also in heterologously expressed S. miltiorrhiza Bge f. alba lines (A1-w; Figure 4A). The expression levels of SmANS in A9, A34, and A64 plantlets were increased 102.06-, 34.30-, and 12.88-fold compared with the Wt (the controls that were untransformed wild plants of S. miltiorrhiza) plantlets, respectively (Figure 4B). However, the SmANS expression in the A1-w line was significantly up-regulated up to >5000-fold compared with the Wt-w (the controls that were untransformed wild plants of S. miltiorrhiza Bge f. alba) plantlets (Figure 4B). Thus, the four efficient overexpressed lines were also selected for further functional analysis.

Figure 4.
The plantlets and expression levels of SmANS-overexpressing in Salvia miltiorrhiza and S. miltiorrhiza Bge f. alba transgenic lines and controls. (A) The three-month-old transgenic and controls plantlets of SmANS-overexpression in S. miltiorrhiza and S. miltiorrhiza Bge f. alba; (B) Relative expression analysis of SmANS in the transgenic and control plantlets of S. miltiorrhiza and S. miltiorrhiza Bge f. alba. Wt, the controls that were untransformed wild S. miltiorrhiza plants. Ev, the controls that only transformed the empty vector in S. miltiorrhiza. A9, A64, and A34, three transgenic lines of SmANS -overexpressed in S. miltiorrhiza. A1-w, transgenic line of SmANS-overexpressing in S. miltiorrhiza Bge f. alba. Ev-w, the controls that only transformed the empty vector in S. miltiorrhiza Bge f. alba. Wt-w, the controls that were untransformed wild S. miltiorrhiza Bge f. alba plants. The vertical bars show the SD values from three independent biological replicates. The ** indicates a very significant differences between transgenic and control plantlets (p < 0.01).
Furthermore, compared with the Wt controls, the three transgenic plantlets (A9, A64, and A34) of S. miltiorrhiza also showed obvious purple-red coloration, especially on the surface of the leaves. Interestingly, unlike the Wt-w phenotype of S. miltiorrhiza Bge f. alba, which had completely green leaf margins and stem segments, the A1-w plantlets showed obvious phenotypic changes in color and appearance. The differences in the leaf margins and stem segments in A1-w plantlets included purple-red coloration (Figure 4A), and stronger the stems and leaves as compared to the Wt-w controls. The concentrations of the total anthocyanin were all higher than their respective controls in the four independent transgenic plantlets (Figure 5A). These phenotypic changes indicate that SmANS plays extremely important roles in anthocyanin accumulation of S. miltiorrhiza and S. miltiorrhiza Bge f. alba.
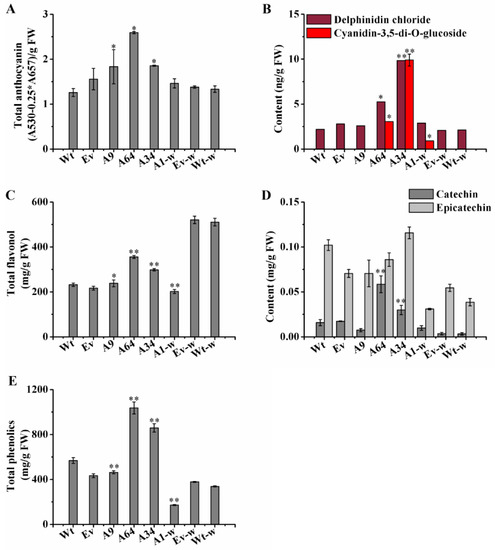
Figure 5.
Analysis of flavonoids and total phenolics in transgenic lines. (A) The content of total anthocyanin in controls and transgenic lines; (B) The contents of delphinidin and cyaniding 3,5-di-O-glucoside in controls and transgenic lines; (C) The content of total flavonoid from controls and transgenic lines; (D) The contents of catechin and epicatechin analyzed by HPLC; (E) Total phenolics content from controls and transgenic lines. Wt, the controls that were untransformed wild S. miltiorrhiza plants. Ev, the controls that only transformed the empty vector in S. miltiorrhiza. A9, A64, and A34, three transgenic lines of SmANS -overexpressed in S. miltiorrhiza. A1-w, transgenic line of SmANS-overexpressing in S. miltiorrhiza Bge f. alba. Ev-w, the controls that only transformed the empty vector in S. miltiorrhiza Bge f. alba. Wt-w, the controls that were untransformed wild S. miltiorrhiza Bge f. alba plants. FW, fresh weight. The vertical bars show the SD values from three independent biological replicates. (*) indicated a significant difference (0.01 < p < 0.05). (**) indicated a very significant difference (p < 0.01).
2.5. SmANS Overexpression Improves the Accumulation of Flavonoids in Transgenic S. miltiorrhiza and S. miltiorrhiza Bge f. alba Plantlets
To determine the effects of SmANS-overexpression on the accumulation of main anthocyanin and other flavonoids in transgenic lines, a microplate reader and HPLC were utilized to quantify these contents. Compared with the Wt of S. miltiorrhiza or the Wt-w of S. miltiorrhiza Bge f. alba, the concentration of cyanidin-3,5-di-O-glucoside and delphinidin chloride had different increases in the four independent SmANS-overexpression lines (Figure 5B). The concentration of cyanidin-3,5-di-O-glucoside in A9, Wt, and Vv (controls that only transformed the empty vector in S. miltiorrhiza) plantlets was almost undetected. The content of cyanidin-3,5-di-O-glucoside significantly increased, reaching 3.93- and 10.78-fold in the A64 and A34 lines, respectively, of Wt content. Meanwhile, compared with the Wt plantlets, the content of delphinidin chloride was remarkably improved up to 0.39-fold (A9), 3.06-fold (A64), and 7.66-fold (A34) of the Wt content, respectively. Moreover, the accumulation of cyanidin-3,5-di-O-glucoside and delphinidin chloride was respectively increased by 3.01 ng/g FW and 0.78 ng/g FW in A1-w line as compared to the Wt-w content. These results indicate that SmANS was the key gene controlling anthocyanin biosynthesis in the S. miltiorrhiza plantlets.
SmANS overexpression also enhanced the accumulation of total flavonoid in the three transgenic S. miltiorrhiza plantlets (A9, 64, and 34), reaching 1.03-, 1.53-, and 1.29-fold, respectively, of the Wt content. The total phenolics content increased only in S. miltiorrhiza transgenic plantlets (A64 and A34), up to 1.82-fold and 1.50-fold, respectively, of the Wt content (Figure 5E). However, the total flavonoid and total phenolics contents in the A1-w lines were reduced by 60.45%, and 48.92% of the Wt-w content, respectively (Figure 5C,E). In addition, the contents of catechin in the proanthocyanidin biosynthetic pathway were increased in part transgenic lines such as A64, A34, and A1-w, which had high anthocyanidin accumulation (Figure 5D). However, the epicatechin content was reduced in all lines except A34 (Figure 5D). These findings revealed that SmANS-overexpression could improve the accumulation of the other flavonoids such as flavonols and proanthocyanidin monomers in parts of the transgenic lines, and point to the metabolic flux flooding into the flavonoids branched pathway.
2.6. Overexpression of SmANS Up-Regulates Parts of Pathway Genes Involved in Flavonoids Biosynthesis
The flavonoids-branched pathway is derived from the phenylpropanoid biosynthetic pathway. To further confirm the effects of SmANS-overexpression on the flavonoids pathway, we analyzed the transcriptional levels of the 11 genes involved in the flavonoids pathway in the transgenic S. miltiorrhiza and S. miltiorrhiza Bge f. alba plantlets. The results are shown in Figure 6. The overexpression of SmANS significantly decreased the relative expression levels of the phenylpropanoid pathway genes (SmPAL, SmC4H, and Sm4CL) in all of the transgenic S. miltiorrhiza and S. miltiorrhiza Bge f. alba plantlets. However, the expression levels of SmCHS, SmCHI, SmF3’H, and SmDFR involved in the flavonoids pathway significantly increased in the three overexpressing S. miltiorrhiza plantlets as compared with the Wt expression levels. The expression levels of SmF3H, SmF3′5′H, and SmUF3GT were down-regulated in the S. miltiorrhiza plantlets as compared with the Wt group. In addition, the expression levels of SmFNSII (flavonols synthase) were increased in the A9 and 64 lines but reduced in the A34 lines as compared to the Wt lines. In addition, the heterologous overexpression of SmANS in S. miltiorrhiza Bge f. alba distinctly improved the expression levels of SmCHS and SmF3H. Both the accumulation of total flavonols and the expression levels of SmFNSII were reduced in the A1-w line as compared to the Wt-w controls. These results indicate that SmANS-overexpression improved the transcriptional levels of most pathway genes in flavonoids biosynthesis, and down-regulated the pathway genes in phenylpropanoid biosynthesis in transgenic lines.
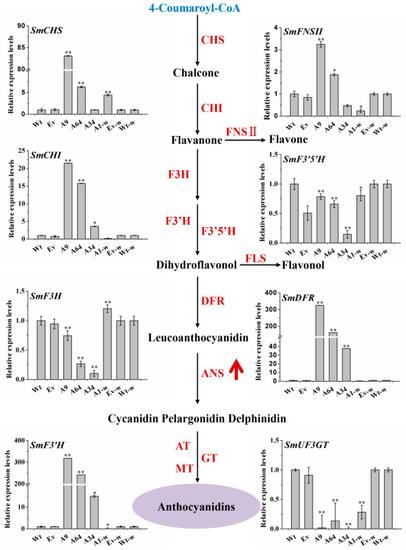
Figure 6.
The expression pattern of the flavonoids structure genes in the transgenic lines. The black solid arrows represent the catalytic reactions. The upward red arrow represents the overexpression of the SmANS gene. Wt, the controls that were untransformed wild Salvia miltiorrhiza plants. Ev, the controls that only transformed the empty vector in S. miltiorrhiza. A9, A64, and A34, three transgenic lines of SmANS-overexpressed in S. miltiorrhiza. A1-w, transgenic line of SmANS-overexpressing in S. miltiorrhiza Bge f. alba. Ev-w, the controls that only transformed the empty vector in S. miltiorrhiza Bge f. alba. Wt-w, the controls that were untransformed wild S. miltiorrhiza Bge f. alba plants. The vertical bars show the SD values from three independent biological replicates. (*) indicated a significant difference (0.01 < p < 0.05). (**) indicated a very significant difference (p < 0.01).
2.7. SmANS Overexpression Indirectly Affects the Salvianolic Acids Branched Pathway
To explore the changes in salvianolic acids pathway in the SmANS-overexpression plantlets, the contents of SAB and RA, as well as the transcriptional levels of the key genes involved in the salvianolic acids branched pathway were analyzed. HPLC results showed that the accumulation of RA and SAB in the three-month-old overexpressed S. miltiorrhiza and S. miltiorrhiza Bge f. alba plantlets were reduced in a different manner as compared to the controls (Figure 7). The transcriptional levels of SmPAL, SmC4H1, Sm4CL2, SmTAT, SmHPPR, SmRAS, and SmCYP98A14 involved in the phenylpropanoid and tyrosine-derived branches were significantly decreased in the SmANS overexpressed lines (A9, A64, A34, and A1-w) as compared to the Wt or Wt-w lines, respectively (Figure 7). The expression pattern of the eight genes involved in SAB biosynthesis was consistent with the accumulation of RA and SAB. The results suggest that the SAB branched pathway was indirectly affected by SmANS in the flavonoids pathway.
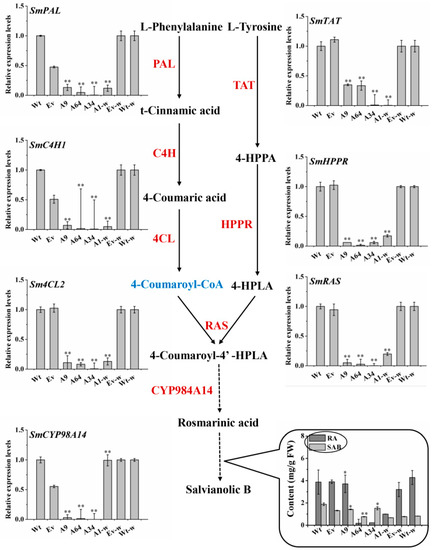
Figure 7.
The contents of phenolic acids and expression pattern of the structure genes involved in salvianolic acid biosynthesis in transgenic lines. Solid arrows and dashed arrows represent single-step reactions and multiple steps reactions, respectively. Wt, the controls that were untransformed wild S. miltiorrhiza plants. Ev, the controls that only transformed the empty vector in S. miltiorrhiza. A9, A64, and A34, three transgenic lines of SmANS-overexpressed in S. miltiorrhiza. A1-w, transgenic line of SmANS-overexpressing in S. miltiorrhiza Bge f. alba. Ev-w, the controls that only transformed the empty vector in S. miltiorrhiza Bge f. alba. Wt-w, the controls that were untransformed wild S. miltiorrhiza Bge f. alba plants. The vertical bars show the SD values from three independent biological replicates. (*) indicated a significant difference (0.01 < p < 0.05). (**) indicated a very significant difference (p < 0.01).
2.8. SmANS-Overexpression Down-Regulates the Expression Levels of Part Transcriptional Regulation Factors
The enzymatic activity of ANS and other genes involved in flavonoids was regulated by transcriptional regulation factors including MYB, bHLH, and WD. In the present study, the expression of SmPAP1 and SmMYB36 were all markedly decreased in the four SmANS-overexpression lines, as compared with the wild controls of S. miltiorrhiza and S. miltiorrhiza Bge f. alba, respectively (Figure 8). These suggested that the molecular and metabolic flow between the flavonoid pathway and salvianolic acids pathway was regulated by the two regulation factors.

Figure 8.
The expression levels of transcription factors in transgenic lines. Wt, the controls that were untransformed wild S. miltiorrhiza plants. Ev, the controls that only transformed the empty vector in S. miltiorrhiza. A9, A64, and A34, three transgenic lines of SmANS -overexpressed in S. miltiorrhiza. A1-w, transgenic line of SmANS-overexpressing in S. miltiorrhiza Bge f. alba. Ev-w, the controls that only transformed the empty vector in S. miltiorrhiza Bge f. alba. Wt-w, the controls that were untransformed wild S. miltiorrhiza Bge f. alba plants. The vertical bars show the SD values from three independent biological replicates. (**) indicated a very significant difference (p < 0.01).
3. Discussion
Anthocyanin and other flavonoids are the main pigments that determine the coloration of numerous plant tissues and organs. The key enzyme, ANS is responsible for the formation of anthocyanin from leucoanthocyanidin in the flavonoids biosynthetic pathway, and has been well studied in most plants [33,34,35,36]. Although, SmANS has been cloned and analyzed to its tissue-specific expression in S. miltiorrhiza [32], the functional molecular characteristics of this key gene are not well known. In S. miltiorrhiza, flavonoids and phenolic acids are all produced via the biosynthetic pathway of phenylpropane. In addition, S. miltiorrhiza is a model plant for traditional Chinese medicine plant research in view of its significant medicinal value, thus, we need to focus on the controlling influence of SmANS overexpression on the phenylpropanoid pathway, particularly relative to the accumulation of flavonoids and phenolic acids to survey the crosstalk of the flavonoids and phenolic acids pathways.
In this study, SmANS was successfully cloned and characterized from the purple flowers in S. miltiorrhiza. Using a comparative analysis of the expression pattern of SmANS in various organs of the S. miltiorrhiza and S. miltiorrhiza Bge f. alba during the full-bloom stage, we found that SmANS was highly expressed especially in the purple petals of S. miltiorrhiza, whereas, it showed almost no expression in the white petals, green calyxes, or pistils in S. miltiorrhiza Bge f. alba, suggesting that SmANS could be responsible for the accumulation of anthocyanin and the purple coloration. The coloration of flower and other organs is controlled or determined by the ANS transcriptional levels, which has been illuminated and verified in other plants. For instance, in Solanum melongena L, FAS is expressed more strongly in purple flowers than in white flowers, and controls the flower color [37]. In carrot taproots, LDOX1/LDOX2 along with other anthocyanin genes, is highly expressed in purple cultivars but not expressed or barely in non-purple cultivars [38]. Similar profiles in tree peony leaf, where ANS is the key gene that controls the anthocyanin levels, were more highly expressed in purplish red leaves than in yellowish green leaves [39]. Additionally, in Asiatic hybrid lilies, ANS, CHS, and DFR were expressed more highly in pigmented parts than in non-pigmented parts [40]. These suggested that SmANS may be a key gene in determining purple coloration degree in S. miltiorrhiza, also may be a limiting factor in the formation of the non- purple phenotype in S. miltiorrhiza Bge f. alba.
The accumulation of dominant anthocyanin occurs in the vacuole, but the synthesis of anthocyanin takes place on the cytosolic surface of the ER [41]. Transient expression analyses using tobacco leaf epidermal cells have shown that SmANS protein fused to GFP is not only localized in the cytosolic organelles (e.g., ER, plastids, and Golgi), but also in the plasma membrane and cell nucleus. This multi-subcellular-localization of ANS protein is also found in grape berries [42]. Much evidence also has proved that flavonoids structural genes containing ANS synthesized anthocyanin on the ER membranes by flavonoids biosynthetic enzyme complexes [43,44]. The SmANS protein distributed in different subcellular organelles suggest that the anthocyanin and other flavonoids may be synthesized in the ER, and stored in the vacuole using some kinds of transporter to move within and between cells.
To examine the possible functional roles of ANS in flavonoids biosynthesis in S. miltiorrhiza, we obtained transgenic plantlets both S. miltiorrhiza and S. miltiorrhiza bge f. alba with SmANS overexpression. By comparing the transgenic plantlets with their controls, respectively, we found that SmANS overexpression resulted in purple-red color phenotype (Figure 4B). It was closely linked with increases in cyanidin-3,5-di-O-glucoside, delphinidin, and total anthocyanin in the transgenic plantlets of two types of S. miltiorrhiza (Figure 5). The cyanidin-3,5-di-O-glucoside existed in the three-month-old plantlets of the A64, A34, and A1-w lines but not in wild-type or empty vector controls, and its concentration was positive relative to the expression levels of SmF3’H, which determines the cyaniding-based anthocyanin biosynthesis. The cyanidin-based anthocyanin was activated by the SmANS overexpression. In addition, the biosynthesis of delphinidin-based anthocyanin was enhanced by the SmANS overexpression. The purple-red phenotype in our transgenic plantlets was determined by the summation of the cyaniding-derivative and delphinidin-derivative. Previous studies have also shown that when ANS is overexpressed or up-regulated, carbon flux is directed towards anthocyanin biosynthesis [26,29,36,45,46]. The ANS enzyme gene has been shown to act as a key switch on the synthesis of anthocyanin in many other plants, such as red-fleshed kiwifruit [23], wintersweet flower [35], and crabapple petals [47]. Moreover, heterologous overexpression of SmANS in S. miltiorrhiza Bge f. alba restored color phenotype in leaf edges, and stem internodes followed the increase in anthocyanin (Figure 4B). Hence, we further confirmed that the expression of SmANS was restricted in three-month-old wild plantlets of S. miltiorrhiza Bge f. alba. Since SmANS expression levels were also limited in the white flowers and green calyxes of S. miltiorrhiza Bge f. alba, we propose that SmANS is a switch on anthocyanin biosynthesis in S. miltiorrhiza and S. miltiorrhiza Bge f. alba plantlets.
The metabolic crosstalk of the flavonoids with other pathways acts to mediate plants adaptation to their real estate [48]. The up- or down-regulation of the gene involved in all these pathways would reallocate the metabolic flux to each branched pathway, according to the source-sink theory. Phenolic acids branched pathway in S. miltiorrhiza are thought to be produced through two parallel pathways: The phenylpropanoid-derived and tyrosine-derived pathways. SAB biosynthesis is derived from its RA precursor. Although the accumulation of anthocyanins was enhanced, the accumulation of RA and SAB in SmANS-overexpressed plantlets was decreased (Figure 7). The expression of the key genes (SmPAL, SmC4H1, Sm4CL2, SmTAT, SmHPPR, SmRAS, and SmCYP98A14) involved in SAB biosynthesis was down-regulated, which was positive relative to the phenolic acids concentration (Figure 7). However, SmPAL, SmC4H1, and Sm4CL2 were also key genes in the early steps of flavonoids biosynthesis, as in SAB biosynthesis. These findings indicate that the enormous metabolic flux directly to the flavonoids-branched pathway and especially to the anthocyanin sub-branch, resulted in insufficient common source storage for phenolic acids biosynthesis. The metabolic flux between the flavonoids-branched pathway and SAB pathway could explain the effect of SmCHS silencing in S. miltiorrhiza [13]. Both the SmCHS port gene and its downstream genes, such as SmANS, have similar effects on the non-flavonoids branched pathway by virtue of regulating the metabolic flow distribution.
The similarity was that the metabolic crosstalk existed in both the anthocyanin and proanthocyanidins branched pathways because they share common substrates: Anthocyanin or leucoanthocyanidin. The transgenic plantlets with SmANS-overexpression had differing influence on the accumulation of the primary monomers (catechin and epicatechin) in proanthocyanidins biosynthesis, which was associated with the anthocyanin levels. Catechin was elevated in the A34, A64, and A1-W lines, which produced sufficient anthocyanin. However, the epicatechin content was improved only in the A34 line, which accumulated the highest levels of cyanidin-3,5-di-O-glucoside and delphinidin chloride. A sufficient anthocyanin intermediate could satisfy epicatechin monomers in proanthocyanidins biosynthesis. Owing to SmANS overexpression, the anthocyanin intermediate first met the supply of anthocyanidin synthesis, and then contributed additional parts to the epicatechin monomer biosynthesis. Here, the metabolic flow may have a preference for the anthocyanin biosynthesis.
The key genes of the secondary metabolic pathway are thought to be regulated by the relative transcription factors through interacting with cis-elements of these genes. SmPAP1 and SmMYB36 in S. miltiorrhiza have been reported to participate in regulating phenolic acids biosynthesis, yet the latter belonging to the S6 AtMYBs may be involved in anthocyanin biosynthesis [2,21]. In the four independent SmANS-overexpression lines, the transcription levels of SmPAP1 and SmMYB36 were significantly down-regulated, relative to the controls (Figure 8). It has been reported that SmPAP1 activates the promoters of SmPAL1 and SmC4H, and overexpression of this transcription factor can induce phenolic acids biosynthesis and accumulation in transgenic S. miltiorrhiza Bge f. alba roots [2]. The down-regulation of SmPAP1 in SmANS-overexpression lines was positively related with the decrease of RA and SAB concentrations as well as the expression of the key genes involved in SAB biosynthesis (Figure 7 and Figure 8). Our analysis further verified that SmPAP1 positively regulated phenolic acids biosynthesis and accumulation in S. miltiorrhiza plantlets. Previous research in our laboratory confirm that SmMYB36-overexpression inhibits phenolic acid and flavonoid biosynthesis in S. miltiorrhiza hairy roots [20]. It appears that SmMYB36 might be a negative regulator in phenolic acid biosynthesis. Our findings showed that SmANS overexpression decreased the expression of key genes (including SmPAL, SmC4H, Sm4CL, SmRAS, and SmCYP98A14) in phenolic acid biosynthesis and the accumulation of SAB and RA, whereas it increased the expression of most flavonoids genes and the concentrations of cyanidin-3,5-di-O-glucoside and delphinidin chloride. In addition, the transcriptional levels of SmMYB36 showed a negative correlation with the anthocyanidin concentration and total flavone in our transgenic lines, which indicated that this transcriptional factor was negatively regulated in anthocyanin and other flavonoids biosynthesis in S. miltiorrhiza. Thus, we propose that the expression levels of ANS are regulated by SmMYB36. This regulation may interact with other transcription factors (bHLH and WD) to form MBW complexes, which regulate anthocyanin biosynthesis [17,18,49,50,51]. The results of the present study imply that the SmMYB36 participates in regulating the metabolism flow between anthocyanin and SAB biosynthesis in the SmANS-overexpressed lines.
In conclusion, the analysis of spatio-temporal expression of SmANS suggested that this gene was one of the key genes in the purple formation in S. miltiorrhiza, and its lower or limited expression might be the most critical reason for the formation of the white petals and green calyx in S. miltiorrhiza Bge f. alba. Then we have characterized the function of SmANS by overexpression in S. miltiorrhiza and S. miltiorrhiza Bge f. alba. Overexpression of SmANS inhibited phenolic acid biosynthesis, enhanced the anthocyanin accumulation, and even improved flavonols and proanthocyanidins biosynthesis in parts plantlets, with the result that the metabolic flux was directed to the flavonoids pathway, and thereby reduced in phenolic acids biosynthesis. The purple-red phenotype in SmANS-overexpressed lines and the tissue-specific expression differences indicated that the SmANS was a “switch” on anthocyanin biosynthesis and color formation in S. miltiorrhiza and S. miltiorrhiza Bge f. alba. These results offer a promising strategy for producing beneficial flavonoids. The findings of this study aid better understanding of the roles of SmANS on color formation and the crosstalk of the flavonoids and phenolic acids biosynthesis pathways. Further experiments are needed to verify the transcription factors interacting with SmANS. This study provides new evidence for the molecular regulation mechanism involved in flavonoids and phenolic acids biosynthesis.
4. Materials and Methods
4.1. Plant Materials
Various fresh tissues of two-year-old S. miltiorrhiza and S. miltiorrhiza Bge f. alba were collected in May during flourishing florescence from the Institute of Soil and Water Conservation (Yangling, China). Species verification was performed by Zongsuo Liang of Northwest A&F University. Roots, stems, leaves, calyxes, petals, pistils, and stamens tissues were used for the analysis of the tissue-specific expression pattern of SmANS. In addition, the full flowers during the four flowering stages (F1: young-bud, F2: medium-bud, F3: pre-bloom petal, and F4: full-bloom petal) from the two types of S. miltiorrhiza were selected to investigate the temporal expression pattern of SmANS.
The mature seeds of S. miltiorrhiza and S. miltiorrhiza Bge f. alba cultivars were provided by Shaanxi Tasly plant medicine Co., Ltd. (Shangluo, China), and used to obtain sterile plantlets in the MS medium (pH 5.8) supplemented with 3% sucrose and 0.7% agar as previously described [3,52]. Then these sterile plantlets were sub-cultured in 1/2 MS medium (pH 5.8) supplemented with 3% sucrose and 0.75% agar. Leaves of the plantlets sub-cultured for 30 days were finally provided to the genetic transformation of S. miltiorrhiza and S. miltiorrhiza Bge f. alba cultivars through the A. tumefaciens-mediated method.
4.2. Total RNA and DNA Extraction
Total complete RNA was isolated from various tissues of S. miltiorrhiza and S. miltiorrhiza Bge f. alba by using the RNAprep pure Plant Kit (TIANGEN, China), and then reversely transcribed to generate cDNA according to the instruction of PrimeScriptTM RT Reagent Kit (Takara, Japan). The genomic DNA from the two kinds of S. miltiorrhiza and all the transgenic lines was isolated by employing the Genomic DNA Isolation Kit (Cowin Biotech, Beijing, China). The quality and concentration of the RNA and DNA were measured by means of gel electrophoresis and the nucleic acid spectrometer (NanoDrop ND-1000, Thermo Scientific, Woburn, MA, USA).
4.3. Isolation and Bioinformatics Analysis of SmANS
To obtain homologous fragments of SmANS from purple flowers in S. miltiorrhiza, the degenerate primers for Half’s Nest-PCR amplification were designed based on the conserved domains of ANS protein of other plant species using CODEHOP primer designer [53]. The first round amplification introduced the cDNA templates of purple flowers with the primers ANS-F1 and ANS-R2, and then the products were used as the templates for the second round PCR amplification with the primers ANS-F1 and ANS-R3. Based on the obtained fragments sequences and S. miltiorrhiza transcriptome database [30], we designed one pair of specific primers (SmANS-F1 and SmANS-R2) to isolate the length cDNA of SmANS from the purple flowers of S. miltiorrhiza. The primers in this study are all shown in Table A1. The ORF of ANS from S. miltiorrhiza was found with ORF (open reading frame)-finder (https://www.ncbi.nlm.nih.gov/orffinder/). Amino acid sequences of SmANS were performed in the DNAStar 7.1. The MEGA v 5.10 software was performed for the construction of phylogenetic trees by employing the neighbor-joining method with 1000 bootstrap replicates. The species in the phylogenetic trees are listed in Table A2.
4.4. QRT-PCR Analysis
QRT-PCR was performed on a CFX96 Real-time PCR system (Bio-RAD, Hercules, CA, USA) using the SYBR Premix Ex TaqTM II Kit (TaKaRa, Shiga, China), with SmActin as an internal reference to normalize the control samples [54]. All experiments were performed in triplicate, and the relative expression levels of the genes were calculated using the 2−ΔΔCt method [55]. The gene-specific primers of the genes involved in flavonoids biosynthesis are shown in Table A1. The other primers of the phenylpropanoid biosynthesis pathway genes (SmPAL, SmC4H, Sm4CL, SmTAT, SmHPPR, SmRAS, SmCYP98A14, SmCHS, SmF3’5’H, and SmPAP1) were used according to previous reports [2,3,13].
4.5. Subcellular Localization Analysis
In this study, the complete ORF sequence of SmANS containing the SalI and SpeI restriction enzymes sites was firstly amplified with gene-specific primers SmANS-GFPf and SmANS-GFPr, and then sub-cloned into the PMD 19T-Simple vector. The PCR product of SmANS was fused to the SalI-SpeI restrictions sites of the pA7-GFP with the CaMV 35S promoter and GFP gene. Both the pA7-GFP-SmANS and pCAMBIA0390 plasmid were digested by HindIII-Eco RI restriction enzymes and then linked to produce the recombinant plasmid p0390A7-GFP-SmANS. The identified positive recombinant plasmid, markers (Golgi: pG-rk-CD3-967, ER: pER-rb-CD3-960, plastids: pt-rk-CD3-999, plasma membrane: pm-rk CD3-1007) [56], and pA7-0390 empty plasmid were finally transformed into A. tumefaciens strain EHA105, respectively, and further expand-cultured in the dark to an OD600 of 0.6 at 28 °C. Then the precipitate was collected and re-suspended in injection solution (0.5 M MES/KOH pH 5.6, 100 mM MgCl2, 100 mM acetosyringone) to an OD600 of 1.0, and kept in the dark for 3 h [57]. Finally, the suspensions of pA7-GFP-SmANS-0390 and a different marker were mixed in equal ratios, respectively, and injected into the leaves of a 30-day-old N. benthamiana. The empty pA7-GFP-0390 plasmids were used as a control. After four days of incubation, the leaves of N. benthamiana were observed under a confocal laser scanning microscope (Nikon A1R, Tokyo, Japan). The relative GFP fusions signals were excited at wavelengths of 488 nm and 561 nm, respectively.
4.6. Acquisition of Positive Transgenic Lines
To construct the plant-overexpressing vector, the complete ORF of SmANS was amplified with gene-specific primers (Table A1), and then cloned into the restriction sites BamHI and KpnI of the pCAMBIA2300 binary vector.
The Agrobacterium-mediated transformation method was performed for transgenic S. miltiorrhiza and S. miltiorrhiza Bge f. alba plantlets according to previously described methods [3,52], with minor modifications. The identified recombinant plasmid SmANS-2300 and pCAMBIA2300 empty vector were transformed into an A. tumefaciens strain (EH105), respectively. Three-month-old plantlets were prepared for PCR identification, PCR screening, expression analysis, and quantification of the secondary metabolites of flavonoids, phenolic acids, and PAs. The primers used for the PCR identification of transgenic lines are listed in Table A1.
4.7. Extraction and Determination Anthocyanin, Catechin, and Epicatechin
A liquid nitrogen grinding sample (0.2 g) was extracted in 1 mL of acidified methanol (1% HCl, v/v) at 4 °C in the dark for 12 h with manual shaking three times. The extract liquor was centrifuged at 1000 rpm at 4 °C for 2 min, the supernatant was collected, and the precipitate was re-extracted in an equal volume of extracting solution. Each extract was performed in triplicate. The combined-supernatant solutions were evaporated to concentrate using a rotary evaporator (RE52AA, Yarong, Shanghai, China) at 30 °C. Then the concentrate was re-dissolved in 0.8 mL extracting solution and filtered through a 0.22 μm microporous membrane (Jinteng, Tianjin, China) for the following analysis.
Quantification of the total anthocyanin was performed according to previously reported protocols [2,19,58], with minor modification. Absorption of the extracts at wavelengths of 530 nm and 657 nm was measured at 25 °C using Multimode Microplate Readers (Spectra Max M 2, Hercules, CA, USA). The concentration of the total anthocyanin was calculated according to the following formula: (A530 − 0.25 × A657)/FW. A530 and A657 are the absorptions at the 530 nm and 657 nm wavelengths, respectively. FW is the fresh weight (in grams) of the plant tissues used for the extraction.
The contents of delphinidin chloride, cyanidin-3,5-di-O-glucoside, catechin, and epicatechin were all detected on Waters HPLC 1525 system (Milford, MA, USA), equipped with a Waters 2996 photodiode array detector. Chromatographic separation was performed with a Waters Xbridge C18 column (4.6 mm × 250 mm, 5 μm particle size) a column temperature of 30 °C and 20 μL injection volume at a flow rate of 1.0 mL/min. The mobile phase consisted of 0.5% trifluoroacetic acid in water (A) and 100% acetonitrile (B). The gradient profile as follows (all concentrations are v/v): 0–3 min, 0% to 86% A; 3–10 min, 86% to 85% A; 10–30 min, 85% to 70% A; 30–45 min, 70% to 95% A; 45–46 min, 95% to 100% A. The spectra were scanned from 210 nm to 600 nm. The detection of anthocyanin, catechin, and epicatechin was carried out at 520 nm, 280 nm and 280 nm, respectively. All reagents were of HPLC grade. Standards of delphinidin chloride and cyanidin-3,5-di-O-glucoside were purchased from Sigma-Aldrich (St. Louis, MO, USA). Standards catechin and epicatechin were purchased from Yuanye Shanghai.
4.8. Extraction and Determination of Phenolic Acids and Total Flavonoid
To quantity the main phenolic acid contents RA and SAB in the transgenic and controls, HPLC was performed according to the general method in our laboratory [59]. The only difference is that 0.2 g sample obtained through the liquid nitrogen grounding method, was extracted in 4 mL 70% methanol for 12 h, and filtered through a 0.22 μm microporous membrane (Jinteng, Tianjin, China) for the RA and SAB analysis. Part of the extract was also used for the measure of total phenolics and total flavonoid according to the methods of previously reported [13,31], using the standard gallic acid (Sigma, St. Louis, MO, USA) and quercetin (Sigma, St. Louis, MO, USA), respectively.
4.9. Statistical Analysis
The statistical analyses of qRT-PCR and secondary metabolic components detection data were performed by SPSS (version 16.0). p < 0.05 was considered statistically significant.
Author Contributions
H.L., R.H. and Z.L. designed this study. H.L. performed the main experiments in this study. J.L. purchased reagents and consumables. H.L., T.P. and Z.B. contributed in the scanning of the LSCM experiments. H.L. drafted the manuscript. All authors read and approved the final manuscript.
Funding
This work was financially supported by grants from the National Natural Science Foundation of China (81773835), and the Major Program of the State Administration of Traditional Chinese Medicine of People’s Republic of China (ZYBZH-C-TJ-55).
Conflicts of Interest
The authors declare no conflict of interest.
Appendix A

Figure A1.
The phylogenetic tree of SmANS protein in Salvia miltiorrhiza and ANS protein in other plants. The red marke represents SmANS protein.

Table A1.
The primers used in this study.
Table A1.
The primers used in this study.
| Primer | Sequence (5′ to 3′) | Note |
|---|---|---|
| ANS-F1 | CGTGATGCACCTGGTCaaycayggnrt | Homologous cloning of SmANS |
| ANS-R2 | GGACAGGATCTCGATGGTGtcnccdatrtg | |
| ANS-R3 | CAGGCCGGGCaccatrttrtg | |
| SmANS-F1 | CTGAAGCGGGAAGGGACT | Full length cDNA cloning of SmANS |
| SmANS-R1 | GAGGACCTAACAGAACTCGCC | |
| SmANS-GFPf | TTTTTTGTCGACATGGTTGCTACACCGG (SalI site underlined) | Construction of subcellular localization vector |
| SmANS-GFPr | GGGACTAGTGCACTCGATTTATCATAATCAGGC (SpeI site underlined) | |
| SmANS-OE-F | TTTTGGATCCATGGTTGCTACACCGG (BamHI site underlined) | Construction of overexpression vector |
| SmANS-OE-R | CGCGGGGTACCTCAACTCGATTTATCA (KpnI site underlined) | |
| 2300NPTII-F | ATACCGTAAAGCACGAGGAAG | Transgenic lines identification |
| 2300NPTII-R | CTGAAGCGGGAAGGGACT | |
| CaMV35S-F | GAGGACCTAACAGAACTCGCC | |
| SmANS-O-R | CCAAATAGACAAGTCCCTCT | |
| SmCHI-F | TTCCATTCCAGAGCAAGGCG | qRT-PCR analysis |
| SmCHI-R | CCTTGCAGTAGGCGACACTCCTT | |
| SmUF3GT-F | AGCCAAAACCGCCCTAATTCAGTA | |
| SmUF3GT-R | ATGGGAATCCGCATGTTTCTAGG | |
| SmFSNII-F | TCGACCCGATCATCACCAAAGAC | |
| SmFSNII-R | GGGAATCCGCATGTTTCTAGG | |
| SmDFR-F | TAAACTTCATCAGCATCATACCACC | |
| SmDFR-R | TCCTTGCTTTATGATGGAGTAGTG | |
| SmANS-F | CTTGTCTATTTGGCCCAAGCACC | |
| SmANS-R | CTGAGGGCATTTCGGGTAGAAG | |
| SmF3H-F | AAAGCGTGCGTTGATATGG | |
| SmF3H-R | GATCCATGTATTACCACCATCC | |
| SmF3’H-F | TGCCACGAACGCAATAGCTC | |
| SmF3’H-R | TTGAATACTCCAGCCAACGACA | |
| SmActin-F | GGTGCCCTGAGGTCCTGTT | |
| SmActin-R | AGGAACCACCGATCCAGACA |
Table A2.
The ANS protein sequence for constructing phylogenetic tree.
Table A2.
The ANS protein sequence for constructing phylogenetic tree.
| ANS Protein | Species Names | GenBank ID |
|---|---|---|
| SmANS | Salvia miltiorrhiza | MK704422 |
| PsANS | Paeonia suffruticosa | AEN71543.1 |
| PrANS | Paeonia rockii | AIL29326.1 |
| PlANS | Paeonia lactiflora | AFI71900.1 |
| CsANS | Citrus sinensis | NP_001275784.1 |
| TcANS | Theobroma cacao | ADD51356.1 |
| VvhANS | Vitis vinifera | ABV82967.1 |
| FeANS | Fagopyrum esculentum | ADT63066.1 |
| FdANS | Fagopyrum dibotrys | AHH30830.1 |
| GeANS | Gypsophila elegans | AAP13054.1 |
| MiANS | Matthiola incana | AAB82287.1 |
| AtANS | Arabidopsis thaliana | NP_194019.1 |
| GmANS3 | Glycine max | AAR26527.1 |
| GmANS2 | Glycine max | AAR26526.1 |
| GmANS | Triticum aestivum | BAE98273.1 |
| GbANS | Ginkgo biloba | ACC66093.1 |
| LsANS | Lactuca sativa | AVV62510.1 |
| IbANS | Ipomoea batatas | BAA75305.1 |
| IcANS | Ipomoea coccinea | BAL43066.1 |
| IhANS | Ipomoea horsfalliae | ACS71531.1 |
| IpANS | Ipomoea purpurea | ABW69684.1 |
| InANS | Ipomoea nil | BAB71806.1 |
| IheANS | Ipomoea hederacea | AAP82029.1 |
| StANS | Solanum tuberosum | NP_001274859.1 |
| NtANS1 | Nicotiana tabacum | AFM52334.1 |
| NtANS2 | Nicotiana tabacum | AFM52335.1 |
| ElANS | Erythranthe lewisii | AHJ80980.1 |
| SsANS | Solenostemon scutellarioides | ABP57081.1 |
| SsANS1 | Solenostemon scutellarioides | ABP57079.1 |
| DcANS1 | Daucus carota | AF184273_1 |
| DcANS2 | Daucus carota | AF184274_1 |
| PpANS | Prunus persica | XP_007210520.1 |
| PaANS | Prunus avium | ADZ54785.1 |
| PcANS | Pyrus communis | AGL50919.1 |
| MdANS | Malus domestica | XP_008356542.1 |
| TaANS | Triticum aestivum | BAE98273.1 |
| LsANS | Lactuca sativa | AVV62510.1 |
| DpANS | Dahlia pinnata | BAJ21536.1 |
| RrANS | Rosa rugosa | AKT74337.1 |
| OsANS | Oryza sativa | CAA69252.1 |
| PgANS | Punica granatum | AHZ97874.1 |
| AcANS | Allium cepa | ABM66367.1 |
| MtANS | Medicago truncatula | ABU40983.1 |
| MaANS | Morus alba | AOV62765.1 |
| LcANS | Lycoris chinensis | AGD99672.1 |
| LrANS | Lycoris radiata | AIA59795.1 |
| OoANS | Oryza officinalis | ANY30309.1 |
| ZmaANS | Zostera marina | KMZ76142.1 |
| PxhANS | Petunia x hybrida | P51092.1 |
| ZmANS | Zea mays | NP_001106074.1 |
References
- Ma, Y.; Yuan, L.; Wu, B.; Li, X.E.; Chen, S.; Lu, S. Genome-wide identification and characterization of novel genes involved in terpenoid biosynthesis in Salvia miltiorrhiza. J. Exp. Bot. 2012, 63, 2809–2823. [Google Scholar] [CrossRef]
- Hao, G.P.; Jiang, X.Y.; Feng, L.; Tao, R.; Li, Y.L.; Huang, L.Q. Cloning, molecular characterization and functional analysis of a putative R2R3-MYB transcription factor of the phenolic acid biosynthetic pathway in S. miltiorrhiza Bge f. alba. Plant Cell Tissue Organ Cult. 2016, 124, 151–168. [Google Scholar] [CrossRef]
- Zhang, S.; Ma, P.; Yang, D.; Li, W.; Liang, Z.; Liu, Y.; Liu, F. Cloning and characterization of a putative R2R3 MYB transcriptional repressor of the rosmarinic acid biosynthetic pathway from Salvia miltiorrhiza. PLoS ONE 2013, 8, e73259. [Google Scholar] [CrossRef]
- Ravipati, A.S.; Zhang, L.; Koyyalamudi, S.R.; Jeong, S.C.; Reddy, N.; Bartlett, J.; Smith, P.T.; Shanmugam, K.; Munch, G.; Wu, M.J.; et al. Antioxidant and anti-inflammatory activities of selected Chinese medicinal plants and their relation with antioxidant content. BMC Complement. Altern. Med. 2012, 12, 173. [Google Scholar] [CrossRef] [PubMed]
- Tanaka, Y.; Sasaki, N.; Ohmiya, A. Biosynthesis of plant pigments: anthocyanins, betalains and carotenoids. Plant J. 2008, 54, 733–749. [Google Scholar] [CrossRef]
- Veitch, N.C.; Grayer, R.E.J. Flavonoids and their glycosides, including anthocyanins. Nat. Prod. Rep. 2008, 25, 555–611. [Google Scholar] [CrossRef] [PubMed]
- Winkel-Shirley, B. Flavonoid biosynthesis. A colorful model for genetics, biochemistry, cell biology, and biotechnology. Plant Physiol. 2001, 126, 485–493. [Google Scholar] [CrossRef] [PubMed]
- Nakabayashi, R.; Saito, K. Integrated metabolomics for abiotic stress responses in plants. Curr. Opin. Plant Biol. 2015, 24, 10–16. [Google Scholar] [CrossRef]
- Medina-Puche, L.; Cumplido-Laso, G.; Amil-Ruiz, F.; Hoffmann, T.; Ring, L.; Rodriguez-Franco, A.; Luis Caballero, J.; Schwab, W.; Munoz-Blanco, J.; Blanco-Portales, R. MYB10 plays a major role in the regulation of flavonoid/phenylpropanoid metabolism during ripening of Fragaria ananassa fruits. J. Exp. Bot. 2014, 65, 401–417. [Google Scholar] [CrossRef] [PubMed]
- Qi, T.; Song, S.; Ren, Q.; Wu, D.; Huang, H.; Chen, Y.; Fan, M.; Peng, W.; Ren, C.; Xie, D. The Jasmonate-ZIM-Domain Proteins Interact with the WD-Repeat/bHLH/MYB Complexes to Regulate Jasmonate-Mediated Anthocyanin Accumulation and Trichome Initiation in Arabidopsis thaliana. Plant Cell 2011, 23, 1795–1814. [Google Scholar] [CrossRef] [PubMed]
- Yousuf, B.; Gul, K.; Wani, A.A.; Singh, P. Health benefits of anthocyanins and their encapsulation for potential use in food systems: A review. Crit. Rev. Food Sci. 2016, 56, 2223–2230. [Google Scholar] [CrossRef]
- Zhang, Y.; Yan, Y.P.; Wu, Y.C.; Hua, W.P.; Chen, C.; Ge, Q.; Wang, Z.Z. Pathway engineering for phenolic acid accumulations in Salvia miltiorrhiza by combinational genetic manipulation. Metab. Eng. 2014, 21, 71–80. [Google Scholar] [CrossRef] [PubMed]
- Zhang, S.; Li, H.; Liang, X.; Yan, Y.; Xia, P.; Jia, Y.; Liang, Z. Enhanced production of phenolic acids in Salvia miltiorrhiza hairy root cultures by combing the RNAi-mediated silencing of chalcone synthase gene with salicylic acid treatment. Biochem. Eng. J. 2015, 103, 185–192. [Google Scholar] [CrossRef]
- Wang, N.; Xu, H.; Jiang, S.; Zhang, Z.; Lu, N.; Qiu, H.; Qu, C.; Wang, Y.; Wu, S.; Chen, X. MYB12 and MYB22 play essential roles in proanthocyanidin and flavonol synthesis in red-fleshed apple (Malus sieversii f. niedzwetzkyana). Plant J. 2017, 90, 276–292. [Google Scholar] [CrossRef] [PubMed]
- Li, P.; Chen, B.; Zhang, G.; Chen, L.; Dong, Q.; Wen, J.; Mysore, K.S.; Zhao, J. Regulation of anthocyanin and proanthocyanidin biosynthesis by Medicago truncatula bHLH transcription factor MtTT8. New Phytol. 2016, 210, 905–921. [Google Scholar] [CrossRef]
- Wang, N.; Qu, C.; Jiang, S.; Chen, Z.; Xu, H.; Fang, H.; Su, M.; Zhang, J.; Wang, Y.; Liu, W.; et al. The proanthocyanidin-specific transcription factor MdMYBPA1 initiates anthocyanin synthesis under low-temperature conditions in red-fleshed apples. Plant J. 2018, 96, 39–55. [Google Scholar] [CrossRef]
- Xu, W.; Grain, D.; Bobet, S.; Le Gourrierec, J.; Thevenin, J.; Kelemen, Z.; Lepiniec, L.; Dubos, C. Complexity and robustness of the flavonoid transcriptional regulatory network revealed by comprehensive analyses of MYB-bHLH-WDR complexes and their targets in Arabidopsis seed. New Phytol. 2014, 202, 132–144. [Google Scholar] [CrossRef]
- Xu, W.; Dubos, C.; Lepiniec, L. Transcriptional control of flavonoid biosynthesis by MYB-bHLH-WDR complexes. Trends Plant Sci. 2015, 20, 176–185. [Google Scholar] [CrossRef] [PubMed]
- Li, S.; Wu, Y.; Kuang, J.; Wang, H.; Du, T.; Huang, Y.; Zhang, Y.; Cao, X.; Wang, Z. SmMYB111 is a key factor to phenolic acid biosynthesis and interacts with both SmTTG1 and SmbHLH51 in Salvia miltiorrhiza. J. Agric. Food Chem. 2018, 66, 8069–8078. [Google Scholar] [CrossRef] [PubMed]
- Ding, K.; Pei, T.; Bai, Z.; Jia, Y.; Ma, P.; Liang, Z. SmMYB36, a Novel R2R3-MYB transcription factor, enhances tanshinone accumulation and decreases phenolic acid content in Salvia miltiorrhiza hairy roots. Sci. Rep. 2017, 7, 5104. [Google Scholar] [CrossRef]
- Li, C.; Lu, S. Genome-wide characterization and comparative analysis of R2R3-MYB transcription factors shows the complexity of MYB-associated regulatory networks in Salvia miltiorrhiza. BMC Genom. 2014, 15. [Google Scholar] [CrossRef]
- Ben-Simhon, Z.; Judeinstein, S.; Trainin, T.; Harel-Beja, R.; Bar-Ya’akov, I.; Borochov-Neori, H.; Holland, D. A "White" anthocyanin-less pomegranate (Punica granatum L.) caused by an insertion in the coding region of the leucoanthocyanidin dioxygenase (LDOX; ANS) gene. PLoS One 2015, 10, 1–21. [Google Scholar] [CrossRef] [PubMed]
- Li, Y.; Fang, J.; Qi, X.; Lin, M.; Zhong, Y.; Sun, L. A key structural gene, AaLDOX, is involved in anthocyanin biosynthesis in all red-fleshed kiwifruit (Actinidia arguta) based on transcriptome analysis. Gene 2018, 648, 31–41. [Google Scholar] [CrossRef] [PubMed]
- Rafique, M.Z.; Carvalho, E.; Stracke, R.; Palmieri, L.; Herrera, L.; Feller, A.; Malnoy, M.; Martens, S. Nonsense mutation inside anthocyanidin synthase gene controls pigmentation in yellow raspberry (Rubus idaeus L.). Front. Plant Sci. 2016, 7, 1892. [Google Scholar] [CrossRef]
- Yu, Z.; Liao, Y.; da Silva, J.A.T.; Yang, Z.; Duan, J. Differential accumulation of anthocyanins in dendrobium officinale stems with red and green peels. Int. J. Mol. Sci. 2018, 19, 2857. [Google Scholar] [CrossRef] [PubMed]
- Liu, Y.; Shi, Z.; Maximova, S.; Payne, M.J.; Guiltinan, M.J. Proanthocyanidin synthesis in Theobroma cacao: genes encoding anthocyanidin synthase, anthocyanidin reductase, and leucoanthocyanidin reductase. BMC Plant Biol. 2013, 13, 1–19. [Google Scholar] [CrossRef] [PubMed]
- Jun, J.H.; Xiao, X.; Rao, X.; Dixon, R.A. Proanthocyanidin subunit composition determined by functionally diverged dioxygenases. Nat. Plants 2018, 4, 1034–1043. [Google Scholar] [CrossRef] [PubMed]
- Szankowski, I.; Flachowsky, H.; Li, H.; Halbwirth, H.; Treutter, D.; Regos, I.; Hanke, M.-V.; Stich, K.; Fischer, T.C. Shift in polyphenol profile and sublethal phenotype caused by silencing of anthocyanidin synthase in apple (Malus sp.). Planta 2009, 229, 681–692. [Google Scholar] [CrossRef]
- Giampieri, F.; Gasparrini, M.; Forbes-Hernandez, T.Y.; Mazzoni, L.; Capocasa, F.; Sabbadini, S.; Alvarez-Suarez, J.M.; Afrin, S.; Rosati, C.; Pandolfini, T.; et al. Overexpression of the anthocyanidin synthase gene in strawberry enhances antioxidant capacity and cytotoxic effects on human hepatic cancer cells. J. Agric. Food Chem. 2018, 66, 581–592. [Google Scholar] [CrossRef]
- Shao, Y.X.; Wei, J.B.; Wu, F.L.; Zhang, H.H.; Yang, D.F.; Liang, Z.S.; Jin, W.B. DsTRD: Danshen transcriptional resource database. PLoS ONE 2016, 11, 1–8. [Google Scholar] [CrossRef]
- Pei, T.; Ma, P.; Ding, K.; Liu, S.; Jia, Y.; Ru, M.; Dong, J.; Liang, Z. SmJAZ8 acts as a core repressor regulating JA-induced biosynthesis of salvianolic acids and tanshinones in Salvia miltiorrhiza hairy roots. J. Exp. Bot. 2018, 69, 1663–1678. [Google Scholar] [CrossRef] [PubMed]
- Deng, Y.; Li, C.; Li, H.; Lu, S. Identification and characterization of flavonoid biosynthetic enzyme genes in Salvia miltiorrhiza (Lamiaceae). Molecules 2018, 23, 1467. [Google Scholar] [CrossRef]
- Nakatsuka, T.; Nishihara, M.; Mishiba, K.; Yamamura, S. Two different mutations are involved in the formation of white-flowered gentian plants. Plant Sci. 2005, 169, 949–958. [Google Scholar] [CrossRef]
- Jiang, S.-H.; Sun, Q.-G.; Chen, M.; Wang, N.; Xu, H.-F.; Fang, H.-C.; Wang, Y.-C.; Zhang, Z.-Y.; Chen, X.-S. Methylome and transcriptome analyses of apple fruit somatic mutations reveal the difference of red phenotype. BMC Genom. 2019, 20, 1–13. [Google Scholar] [CrossRef] [PubMed]
- Yang, N.; Zhao, K.; Li, X.; Zhao, R.; Aslam, M.Z.; Yu, L.; Chen, L. Comprehensive analysis of wintersweet flower reveals key structural genes involved in flavonoid biosynthetic pathway. Gene 2018, 676, 279–289. [Google Scholar] [CrossRef]
- Reddy, A.M.; Reddy, V.S.; Scheffler, B.E.; Wienand, U.; Reddy, A.R. Novel transgenic rice overexpressing anthocyanidin synthase accumulates a mixture of flavonoids leading to an increased antioxidant potential. Metab. Eng. 2007, 9, 95–111. [Google Scholar] [CrossRef] [PubMed]
- Chen, M.; Xu, M.; Xiao, Y.; Cui, D.; Qin, Y.; Wu, J.; Wang, W.; Wang, G. Fine mapping identifies smfas encoding an anthocyanidin synthase as a putative candidate gene for flower purple color in Solanum melongena L. Int. J. Mol. Sci. 2018, 19, 789. [Google Scholar] [CrossRef] [PubMed]
- Xu, Z.-S.; Huang, Y.; Wang, F.; Song, X.; Wang, G.-L.; Xiong, A.-S. Transcript profiling of structural genes involved in cyanidin-based anthocyanin biosynthesis between purple and non-purple carrot (Daucus carota L.) cultivars reveals distinct patterns. BMC Plant Biol. 2014, 14, 262. [Google Scholar] [CrossRef]
- Luo, J.R.; Shi, Q.Q.; Niu, L.X.; Zhang, Y.L. Transcriptomic analysis of leaf in tree peony reveals differentially expressed pigments genes. Molecules 2017, 22, 324. [Google Scholar] [CrossRef]
- Suzuki, K.; Suzuki, T.; Nakatsuka, T.; Dohra, H.; Yamagishi, M.; Matsuyama, K.; Matsuura, H. RNA-seq-based evaluation of bicolor tepal pigmentation in Asiatic hybrid lilies (Lilium spp.). BMC Genom. 2016, 17, 611. [Google Scholar] [CrossRef]
- Sun, Y.; Li, H.; Huang, J.-R. Arabidopsis TT19 functions as a carrier to transport anthocyanin from the cytosol to tonoplasts. Mol. Plant 2012, 5, 387–400. [Google Scholar] [CrossRef]
- Wang, H.L.; Wang, W.; Zhang, P.; Pan, Q.H.; Zhan, J.C.; Huang, W.D. Gene transcript accumulation, tissue and subcellular localization of anthocyanidin synthase (ANS) in developing grape berries. Plant Sci. 2010, 179, 103–113. [Google Scholar] [CrossRef]
- Hrazdina, G.; Wagner, G.J. Metabolic pathways as enzyme complexes: evidence for the synthesis of phenylpropanoids and flavonoids on membrane associated enzyme complexes. Arch. Biochem. Biophys. 1985, 237, 88–100. [Google Scholar] [CrossRef]
- Fujino, N.; Tenma, N.; Waki, T.; Ito, K.; Komatsuzaki, Y.; Sugiyama, K.; Yamazaki, T.; Yoshida, S.; Hatayama, M.; Yamashita, S.; et al. Physical interactions among flavonoid enzymes in snapdragon and torenia reveal the diversity in the flavonoid metabolon organization of different plant species. Plant J. 2018, 94, 372–392. [Google Scholar] [CrossRef]
- Chen, C.; Wei, K.; Wang, L.; Ruan, L.; Li, H.; Zhou, X.; Lin, Z.; Shan, R.; Cheng, H. Expression of key structural genes of the phenylpropanoid pathway associated with catechin epimerization in tea cultivars. Front. Plant Sci. 2017, 8, 702. [Google Scholar] [CrossRef]
- Li, J.; Zhao, A.; Yu, M.; Li, Y.; Liu, X.; Chen, X. Function analysis of anthocyanidin synthase from Morus alba L. by expression in bacteria and tobacco. Electron. J. Biotechn. 2018, 36, 9–14. [Google Scholar] [CrossRef]
- Zhang, J.; Han, Z.Y.; Tian, J.; Zhang, X.; Song, T.-T.; Yao, Y.C. The expression level of anthocyanidin synthase determines the anthocyanin content of crabapple (Malus sp.) petals. Acta Physiol. Plant. 2015, 37, 109. [Google Scholar] [CrossRef]
- Mouradov, A.; Spangenberg, G. Flavonoids: A metabolic network mediating plants adaptation to their real estate. Front. Plant Sci. 2014, 5, 620. [Google Scholar] [CrossRef] [PubMed]
- Strygina, K.V.; Boerner, A.; Khlestkina, E.K. Identification and characterization of regulatory network components for anthocyanin synthesis in barley aleurone. BMC Plant Biol. 2017, 17, 110–155. [Google Scholar] [CrossRef]
- Jun, J.H.; Liu, C.; Xiao, X.; Dixon, R.A. The Transcriptional repressor MYB2 regulates both spatial and temporal patterns of proanthocyandin and anthocyanin pigmentation in Medicago truncatula. Plant Cell 2015, 27, 2860–2879. [Google Scholar] [CrossRef]
- Lim, S.H.; Kim, D.H.; Kim, J.K.; Lee, J.Y.; Ha, S.H. A radish basic helix-loop-helix transcription factor, RsTT8 acts a positive regulator for anthocyanin biosynthesis. Front. Plant Sci. 2017, 8. [Google Scholar] [CrossRef]
- Yan, Y.; Wang, Z. Genetic transformation of the medicinal plant Salvia miltiorrhiza by Agrobacterium tumefaciens-mediated method. Plant Cell Tissue Organ Cult. 2007, 88, 175–184. [Google Scholar] [CrossRef]
- Staheli, J.R.; Boyce, R.; Kovarik, D.; Rose, T.M. CODEHOP PCR and CODEHOP pcr primer design. Meth. Mol. Biol. 2011, 687, 57–73. [Google Scholar] [CrossRef]
- Yang, Y.F.; Hou, S.; Cui, G.H.; Chen, S.L.; Wei, J.H.; Huang, L.Q. Characterization of reference genes for quantitative real-time pcr analysis in various tissues of Salvia miltiorrhiza. Mol. Biol. Rep. 2010, 37, 507–513. [Google Scholar] [CrossRef] [PubMed]
- Livak, K.J.; Schmittgen, T.D. Analysis of relative gene expression data using real-time quantitative pcr and the 2(T)(-delta delta c) method. Methods 2001, 25, 402–408. [Google Scholar] [CrossRef] [PubMed]
- Nelson, B.K.; Cai, X.; Nebenfuehr, A. A multicolored set of in vivo organelle markers for co-localization studies in Arabidopsis and other plants. Plant J. 2007, 51, 1126–1136. [Google Scholar] [CrossRef]
- Ru, M.; Wang, K.; Bai, Z.; Peng, L.; He, S.; Pei, T.; Jia, Y.; Li, H.; Liang, Z. Molecular cloning and characterisation of two enzymes involved in the rosmarinic acid biosynthesis pathway of Prunella vulgaris L. Plant Cell Tissue Organ Cult. 2017, 128, 381–390. [Google Scholar] [CrossRef]
- Mano, H.; Ogasawara, F.; Sato, K.; Higo, H.; Minobe, Y. Isolation of a regulatory gene of anthocyanin biosynthesis in tuberous roots of purple-fleshed sweet potato. Plant Physiol. 2007, 143, 1252–1268. [Google Scholar] [CrossRef]
- Xing, B.; Liang, L.; Liu, L.; Hou, Z.; Yang, D.; Yan, K.; Zhang, X.; Liang, Z. Overexpression of SmbHLH148 induced biosynthesis of tanshinones as well as phenolic acids in Salvia miltiorrhiza hairy roots. Plant Cell Rep. 2018, 37, 1681–1692. [Google Scholar] [CrossRef]
© 2019 by the authors. Licensee MDPI, Basel, Switzerland. This article is an open access article distributed under the terms and conditions of the Creative Commons Attribution (CC BY) license (http://creativecommons.org/licenses/by/4.0/).