A Survey on Power System Blackout and Cascading Events: Research Motivations and Challenges
by
 , and
, and
Hassan Haes Alhelou
1,2 ,
,
Mohamad Esmail Hamedani-Golshan
1,
Takawira Cuthbert Njenda
1 and
and
Pierluigi Siano
3,* 1
Department of Electrical and Computer Engineering, Isfahan University of Technology, Isfahan 84156-83111, Iran
2
Department of Electrical Power Engineering, Faculty of Mechanical and Electrical Engineering, Tishreen University, Lattakia 2230, Syria
3
Department of Management & Innovation Systems, University of Salerno, 84084 Salerno, Italy
*
Author to whom correspondence should be addressed.
Energies 2019, 12(4), 682; https://doi.org/10.3390/en12040682
Submission received: 31 December 2018
/
Revised: 15 February 2019
/
Accepted: 17 February 2019
/
Published: 20 February 2019
(This article belongs to the Special Issue 10 Years Energies - Horizon 2028)
Abstract
:Power systems are the most complex systems and have great importance in modern life. They have direct impacts on the modernization, economic, political and social aspects. To operate such systems in a stable mode, several control and protection techniques are required. However, modern systems are equipped with several protection schemes with the aim of avoiding the unpredicted events and power outages, power systems are still encountering emergency and mal-operation situations. The most severe emergencies put the whole or at least a part of the system in danger. If the emergency is not well managed, the power system is likely to have cascading failures that might lead to a blackout. Due to the consequences, many countries around the world have research and expert teams who work to avoid blackouts on their systems. In this paper, a comprehensive review on the major blackouts and cascading events that have occurred in the last decade are introduced. A particular focus is given on the US power system outages and their causes since it is one of the leading power producers in the world and it is also due to the ready availability of data for the past events. The paper also highlights the root causes of different blackouts around the globe. Furthermore, blackout and cascading analysis methods and the consequences of blackouts are surveyed. Moreover, the challenges in the existing protective schemes and research gaps in the topic of power system blackout and cascading events are marked out. Research directions and issues to be considered in future power system blackout studies are also proposed.
1. Introduction
1.1. An Overview and Motivations
The ability of power systems to maintain stability and to ensure continuous supply of electrical power to customers in the event of a disturbance is of critical importance [1,2,3]. As the power system is spread over large geographic regions, the probability of facing different types of faults and failures is high [4]. Unfortunately, unpredictable faults and cascading events usually lead to a blackout which might affect modern life.
As the demand for energy grows, modern power systems are operated close to steady state stability, which can easily lead to a critical situation [5,6,7,8,9]. Therefore, modern power systems must be equipped with suitable control and protection schemes in order to cope with disturbances. The ability of a power system to maintain steady state and transient stability is the subject of decades of research [10,11]. In power systems, frequency, voltage and rotor angle of synchronous generating units are the most important quantities that should be properly controlled in order to maintain the power system stability [5]. Power imbalance between demand and generation directly affect the frequency stability, while the voltage is directly affected by the reactive power imbalance [12,13,14,15]. The rotor angle behavior is also a representative of the stability and synchronism in the whole power system. If the power system is subjected to an abnormal condition such as an overload due to sudden load reconnection, a generator outage or a transmission line tripping, the frequency and voltage instabilities must be quickly addressed [14]. In situations where these abnormal conditions are not addressed in time, the system would experience cascading events which might lead to a blackout [16,17,18].
Power system protection schemes are the final defense for preventing the cascading events [19,20]. Under frequency load shedding (UFLS) and under voltage load shedding (UVLS) techniques are in use to maintain the frequency and voltage of the system in case of large disturbances. From the onset of frequency/voltage decline, up until the predefined threshold is violated, there is a small time window to implement all required restorative actions [21,22,23]. Protective schemes have been implemented for different power systems across the world [19]. They are aimed at preventing the system from further separation in the event of a disturbance [20,24]. To achieve this goal, portions of load are carefully relieved from the system until the balance level between the demand and generation is satisfied. If the deficit between the generation and demand still exists, protective schemes must be operated again to achieve a suitable balance; otherwise, the whole, or at least a portion of, the system might face collapse [14]. In such emergency situations, it is better to lose portions of load while maintaining stability of the whole system to avoid undesired collapses. Protection techniques that are properly designed and implemented can bring both economic and technical benefits to the power system operators. To curb the negative effects of blackouts, protective schemes were widely developed and implemented in reality [25,26,27]. The most commonly referred to protective plan is the one by Western Electricity Coordinating Council (WECC) [28]. This plan was developed in response to three major system-wide disturbances that occurred in 1996. The plan was updated in 2011 to meet modern standards, which indicates the importance of managing frequency to avoid total system collapse. The primary objective of the frequency protection scheme as presented in the WECC plan is to minimize the risk of total system collapse, which can result in socio-economic problems [28].
In order to adhere to standards, power systems’ operators have designed protective plans similar to WECC that best suit the nature of their systems. In addition to the protective plans, all of the power system equipment has nominal working conditions and, if these are violated, the equipment might be damaged and result in huge losses to the operators. It is key that all power systems’ operators work to improve overall system reliability. A reliable system must be able to meet customer energy requirements on demand. Blackouts pose a question on the reliability of conventional and adaptive protection techniques in avoiding such power outages.
1.2. Survey Methodology
It is important to follow a specific methodology for conducting a useful survey on a research topic. In literature, there are some methodologies that have been suggested for concluding useful systematical state of the arts [29,30,31,32,33,34]. In what follows, the methodology adopted for creating state of the art on power system blackout and cascading events is introduced. It is worth mentioning that the search has focused on the online published materials such as research articles, review papers, conference papers, scientific books, and standards.
As a first step, databases, i.e., Scopus, IEEE Explore, Science Direct, Springer, Taylor and Francis, and Wiley publishers are comprehensively searched in order to conclude this review. In the search stage, keywords and scientific terms such as “power system blackout”, “power outages”, “power system emergency”, “cascading events”, and “methods for blackout and cascading events” are used. In order to guarantee the research quality, we have searched for materials published in ISI and “Q1, and Q2” journals. In addition, IEEE conferences’ materials are searched for useful materials. Furthermore, IEEE standards and reports from energy sectors in different countries are carefully checked. The keywords lists, topics of interest, searched databases and other information about the adopted methodology are given in Table 1.
The initial search using the aforementioned review methodology yielded 368 papers, in which 136 papers remained after removing the duplication. In the next step, their titles, abstracts and contributions are checked for removing the unrelated works, which resulted in exclusion of 103 papers. Afterward, the remaining material was screened and fully reviewed by a team of experts on this topic. Figure 1 shows the flowchart of the review process adopted for reaching this comprehensive survey on power system blackout and cascading events.
As mentioned above, different types of publications are used in this comprehensive review introduced in Table 2. As seen from Table 2, the journal article covers the majority of the reviewed materials, while only 17 conference papers are selected as useful papers.
This review covers the materials that have been published online from year 2001 to 2018. It should be mentioned that the subject of the paper is too specific and we try to survey the major blackout around the globe with more focus on the US Energy system due to the availability of its data and information. In addition, the paper tries to highlight the reasons behind such creditable power outages and cascading events. Furthermore, the analysis of the collected materials shows that there are great research activities in the topic of electric power outages including cascading modeling, and online major event monitoring.
1.3. Contributions and Review Structure
In this subsection, the specific topic and main contributions of the paper are briefly introduced. Electric power system contingency and security is a wide research field in which analysis of power outages and cascading failure play a vital role in shaping the future of such systems and guaranteeing their operation in stable and safe mode. Nowadays, power system emergency, security and protection topics have gained considerable attention from researchers for developing new methods that can prevent the cascading failure and avoid blackout and its consequences. In this paper, we mark out three specific points, i.e., a survey on blackouts and their causes, cascading analysis methods, and the importance of emerging technologies such as wide-area monitoring systems. Therefore, we first introduce the most important power system blackouts that have been recorded in the last several decades around the globe. Then, a focus on blackouts in US power systems with analysis study is provided. Furthermore, the causes of blackouts and the methods that can be adopted for modeling the cascading events are reviewed. This paper also highlights the consequences of power system blackout and cascading events for motivating the research in these specific topics. In this review, we mark out the challenges of protective actions used to avoid power system blackout events. Moreover, the research gaps in the topic of power system blackouts and cascading failures are introduced. Finally, some research directions are proposed which can be a good guideline for the researchers. A summary of the paper contribution and its content is shown in Figure 2.
The paper is organized as follows. An overview and motivations of this work is provided in Section 1.1, the methodology adopted for conducting this survey is in Section 1.2, and the paper contribution and organization (Section 1.3) are given in the Introduction (Section 1). A survey on the blackouts around the globe is given in Section 2. Then, a focus is given on the US blackouts in Section 3. The major recorded blackouts around the globe presented in Section 4. Section 5 introduces the major blackout causes. The cascading event modeling and analysis methods are reviewed in Section 6. Section 7 marks out the impacts of blackouts. The research gaps and directions are introduced in Section 8, while Section 9 provides the conclusions.
2. Blackouts around the Globe
The ability of power systems to maintain stability and to ensure continuous supply of electrical power to customers in the event of a disturbance is of critical importance [5,14]. In light of this fact, when a power system blackout occurs, the consequences can be far reaching. Causes of power system blackouts include transmission line tripping or overloading, control and protection systems mal-operation, lightning strikes on power systems equipment, poor maintenance, human error, voltage collapse, equipment failure, cyber-attacks, quick-frequency declines, and others [5]. As of 2010, several power systems blackouts have occurred, which left millions of customers stranded for hours. For instance, a power outage occurred in the Pacific Southwest on 8 September 2011, which lasted for about 12 h affecting 2.7 million residents of San Diego, California, Arizona and Mexico [35,36,37]. In this event, tripping of a major transmission line during peak load led to the system collapse. During that time, San Diego experienced a total blackout and simulations in [35] showed that insufficient load shedding led to the cascading effects. Earlier in the same year on 4 February 2011, power system blackout occurred in Brazil due to flaws in the transmission lines and it lasted for about 16 h [38]. About 53 million customers were directly affected [38,39]. On 30 July 2012, a blackout, which lasted for about 15 h, occurred, affecting nearly 620 million residents of the north and east of India [40]. The blackout was due to overloading of one of the 400 kV Gwali–Binar transmission lines while the other transmission line was out for maintenance [41,42]. The system failed again the following day due to demand-generation imbalance and about 700 million people were affected when nearly 32 GW of energy was interrupted [43]. This blackout is the largest power outage in terms of people affected ever-recorded [40]. In Vietnam, a 500 kV line tripped on 22 May 2013, separating the northern and southern grid of Vietnam power system [44]. The same year, in the Philippines, 14 power plants were curtailed affecting their capital city Manila and nearly 40 % of the Luzon islands [45]. The number of affected people was estimated to be 8 million [45]. The tripping of generators and transmission lines led to the overall voltage collapse in the system [45]. A lightning bolt struck the Thailand power system in 2013 affecting almost 8 million people in 14 provinces [44,46]. Bangladesh Power System (BPS) experienced a total system collapse on 1 November 2014, which lasted for about 24 h [47]. According to findings in [47], this was due to unplanned high voltage direct current (HVDC) station outage. The unresponsive spinning reserve and the fact that some generators were under-maintenance worsened the situation [47]. The total amount of load shed after all the under frequency load shedding (UFLS) stages were activated was less compared to the disturbance that was experienced and this led to the blackout [47]. An improvement of the BPS load shedding scheme was proposed as a long-term solution in case of similar outages in the future in [47]. The power outage in BPS affected almost 150 million people. A technical fault at a power station in Sindh affected nearly 140 million people in Pakistan on 26 January 2015 [10,48,49,50]. In Turkey, nearly 70 million people had to endure power outages on 31 March 2016 due to power system failure [51]. Nevertheless, some regions which are linked to the Iran power network such as Hakkari and Van did not experience the blackout [51]. About 10 million Kenyans had their power supply interrupted for more than 4 h on 7 June 2016 when a monkey fell on a transformer in Gitaru hydro power station leading to the subsequent tripping of the transformer and interrupting 180 MW of power [52,53]. Uncontrolled events following the 180 MW power loss worsened the situation and led to system collapse [53].
Table 3 shows the number of power outages recorded across the globe in 2011. The average duration for each outage is given in hours in the same table. From the Table 3, it can be seen that, regardless of the lower number of outages recorded in Latin America and Caribbean, the average time taken during each outage was much longer than the other areas. About 1200 power outages with a much lesser duration were experienced in South Asia. The table is to show the reality of the wide prevalence of power systems blackouts across the globe. Based on a report published by Eaton in 2015, a total of 1673 power outages were recorded out of the selected top 10 most affected states in the USA [54]. Due to its high number of recorded blackout and cascading events, the US energy system is the focus of the next section.
3. US Blackouts
In this section, we consider some of the blackouts that have occurred in the USA. Table 4 shows the total number of blackouts recorded in the USA from 2008 to 2015 [54,56]. The least amount of power outages was 2169, recorded in 2008 and it left 25.8 million people stranded. The following year, 2840 outages were recorded and 13.5 million people were affected [54]. This was the least number of people affected as recorded from 2008 to 2015 [56]. Out of the 3149 outages that occurred in 2010, 17.5 million people were affected [54]. The highest recorded number of people affected was 41.8 million when 3071 outages occurred in 2011. In 2012, 2808 outages were recorded leaving 25.0 million people without power. Of the 3236 power outages that occurred in 2013, 14.0 million people were affected. The largest number of power outages occurred in 2014 and 14.2 million people were affected [56]. Lastly, in 2015 out of the 3571 recorded power outages a total of 13.2 million people were affected [56]. The numbers are just not mere statistics but indicate the severity of the recorded power outages. Even though Table 4 focuses on the number of outages and the people affected, the impacts of these outages can be far reaching [57]. USA is used as a case study example but different countries across the globe experience similar power outage with some resulting in the total collapse of the power system.
Table 5 shows the summary of the recorded outages in 2015 [56]. Of the 3571 recorded outages a total of 13,263,473 customers were affected. In total, the outages lasted for approximately 122 days in terms of lost time [54]. An average of 3714 people were affected per each outage that occurred and each outage lasted for at least 49 min [54]. The loss in monetary value amount to billions of US$ [54].
Of the 3571 outages recorded in 2015, we also considered the top ten states with the highest number of recoded outages [54]. In Figure 3, it can be seen that California was the most affected with 417-recorded outages which is about 25% of the recorded outage. Indiana had the least amount of recorded outages amounting to 100 in the same year. From the analysis of blackouts, the major cause was weather conditions. Therefore, the areas with the highest number of outages indicated areas that had more abnormal weather conditions.
In what follows, we show the major causes and events that might lead to a blackout situation. We firstly highlight the significant causes that led to blackouts in USA in 2015. As explained earlier, power outages affect millions of customers and have serious further economic effects [54,56,58,59]. Generally, the causes of power outages range from natural disasters, aging power systems, and maloperation of protection systems or operators. Some of the major causes of power system blackouts as recorded in the USA in 2015 are described in what follows. On 17 November, a windstorm with a speed of about 70 mph destroyed electrical power lines leaving nearly 180,000 customers affected [54,56]. Trees falling on electrical power lines further worsened the effect. A storm which was classified as more severe than Hurricane Sandy left 280,000 people without power after destroying electrical power infrastructure on 23 June [54]. During the same period, 250,000 customers were affected in the Philadelphia region [54]. A power outage, which was caused by an underground fire on 15 July, left 30,000 people without power [54]. Further investigations indicated that the problem was aging equipment. An increased demand of power on 20 September when the weather temperatures were very high led the utility to curtail some loads in order to balance the generation and demand. About 150 MW of power was curtailed, leaving 115,000 San Diego customers without power [57]. On 7 April, a metal said to have broken loose from a power line at a switching station led to the interruption of power supply from two power stations [56]. Thousands of people were affected in Washington DC and Maryland. On 14 July, Birmingham experienced severe power cuts due to bad weather. A frosty storm which hit Oklahoma city on 28 November led to power cuts which affected 110,000 residents [54]. The main reason was that power lines were coated with ice to an extent that they became heavy and broke. Similarly, on 14 February, a cold front which brought severe winds of over 50 mph left 103,000 customers in need of power [56]. On 24 December, 60 mph winds led to power cuts leaving nearly 105,000 homes and businesses without power.
4. Major Recorded Blackout Events
4.1. Major Blackout in the U.S.-Canadian System
The most severe major blackout that occurred in the U.S.-Canadian grid was the blackout on 14 August 2003 [58,60,61,62,63,64]. At least 50 million people were affected out of the eight U.S. states and two Canadian provinces affected. An estimated 63 GW of power was curtailed [61]. This power is nearly 11% of the total demand of the Eastern interconnection of the North America system [61]. According to the reports published, more than 400 transmission lines and 531 generating units at 261 power plants tripped. Before the event, the system is said to have been operating according to the North American Electric Reliability Council (NERC) standards [65,66]. Nevertheless, reactive power supply challenges had been noted before. Another issue was of the faulty operating of a Midwest ISO (MISO) state estimator and the real-time contingency analysis (RTCA) software [67]. These software problems together with others led to the unavailability of the real time system information. Outage of the Eastlake Unit 5 generator was initially recorded. This unit and other units in Northern Ohio had been operating under stressed reactive power conditions [61,62,63]. The units were producing high reactive power outputs and this led to the tripping of the voltage regulator to manual due to over excitation. After intervention by the operator to try to restore the voltage regulator to automatic, the unit then tripped [64]. Cascading faults further followed, leading to a severe blackout. Coincidentally, three 345 kV transmission lines also tripped after contact with a tree further worsening the disturbance situation. Cascading faults further followed with many 345 kV lines tripping due to overload at under voltage. Furthermore, out of step oscillations resulted and the system split into several islands leading to a severe blackout [68]. The task force on power outage conclude that the major cause of this blackout was inadequate understanding of the system and lack of situation awareness [62,64]. Other challenges were poorly maintained vegetation and lack of support from the reliability coordinator.
4.2. Major Blackout in the Swedish-Danish System
A blackout occurred on 23 September 2003 in the Swedish/Danish system [64,69]. The system was operating under normal conditions, but some system components and two 400 kV transmission lines and HVDC links that connect this system with continental Europe were out of service on maintenance [70,71]. Regardless of these conditions, the system was not heavily loaded. The initial failure started when a 1200 MW nuclear unit in southern Sweden tripped due to problems with a steam valve [69]. Even after this failure, the system was still operating normally, but a few minutes later a double bus bar fault occurred at one of the substations [69]. Consequently, some lines were lost and other units also tripped. Under these conditions, the only line left was the 400 kV transmission line which transfers power from north to south [69]. The line was heavily loaded and later failed and caused system separation due to voltage collapse. The south of Sweden and the east of Denmark were separated [69]. In both countries, a total of about 6500 MW was lost affecting, almost 4 million customers.
4.3. Major Blackout in Italy
In addition occurring on 23 September 2003 in Italy, a tree flashover caused the tripping of a major tie-line between Italy and Switzerland [45,72,73,74,75,76]. The failures started to progress when the automatic breaker failed to reclose the line [72]. The synchronization failed due to the phase angle differences. According to [68], the tripping of 380 kV Lukmanier line was initially recorded at 03:01:20. About 25 min later, another 380 kV San Bernadino transmission line was interrupted after delays in power re-dispatching [45,68]. The effects continued and the Italian system lost synchronism with the other parts of Europe. A cascade tripping of 16 transmission lines to Italy was recorded. The tripping was due to system overload and instabilities. After the continued system separation, the Italian power system was left with a deficit of almost 6400 MW [72,73]. The system frequency started to fall and was not corrected in time leading to the total collapse of the Italian power system [73].
4.4. Major Blackout in India
The largest blackout in terms of lost power and affected people occurred in India in 2012 [77,78,79,80]. India is the third largest power producing country after China and USA with a yearly production of 1423 TWh [41,78]. The Indian grid has experienced several power blackouts with the worst experienced in 2012. During the summer of 2012, extreme weather conditions led to a high demand in power for cooling systems. In the same season due to limited water supplies, the hydro power plants were generating below their full capacity [41,42]. On 30 July 2012, around 2:00 a.m. in the morning, a 400 kV Gwalior–Binar circuit breaker tripped, triggering a series of events, which later led to a system collapse [42,43]. The major power stations in the area were affected leading to a loss of 32 GW in generated power. Because of this power loss, nearly 300 million customers were left without power. Serious consequences were experienced due to this power loss. Railways, airports, passenger trains and traffic signals were all shutdown causing commotion in business areas [42]. Hospitals without reliable power back up supplies had to endure 3 to 5 h of no power. After restorative actions, about 80% of the power was restored after almost 15 h [43]. The following day on 31 July, at around 1:02 p.m., the power system experienced another disturbance [43]. This was due to a relay problem near the Taj Mahal and several power stations were again grounded [41,43]. More than 600 million individuals lost their power. The failure severely affected the basic infrastructure facilities like railways, metro rail system, lifts in multi-storey buildings, and movement of vehicular traffic. Some miners were trapped underground and had to be later rescued, passengers traveling with the metro had to be rescued as well. An investigation that was carried out later on after these disturbances had occurred drew conclusions on the cause. The first cause was of the weaker power transmission line. As of 29 July, the high loading of the Gwalior–Binar led to the tripping action [41,42,43]. The failure to respond in time of the state load dispatch centers to manage the power flows led to the line tripping.
4.5. Major Blackout in the Brazilian Grid
Though not very common, power outages continue to be witnessed across the globe. The main challenge with power outages and blackouts is that they lead to heavy economic losses. On 21 March 2018, more than 10 million customers were affected when a power outage struck the Brazilian power system [39,81,82,83]. The power outage started at 3:40 p.m. due to a failure of a transmission line near the Belo Monte hydro power station. About 18,000 MW of power was curtailed during this disturbance [39]. The Brazilian power system demand is mainly supplied by hydro generators and has been studied for years. The first special protection scheme (SPS) was implanted in Brazil in 1974 and it was a three-stage under-frequency load-shedding scheme [84]. In 1975, only five SPS were in operation and, by the year 2005, they had increased to 133. The use of SPS in Brazil was proven to be superior in minimizing the impacts of blackouts from the examined various multiple contingency situations. An upgrade from n-1 to n-2 contingency was also proposed as a possible way of enhancing power systems reliability during disturbances. Other blackouts that occurred in Brazil on 10 November 2009 and 4 February 2011 also lead to recommendations on enhancing the system against major disturbances as well as improving the black-start restoration capabilities [85]. In modern systems, proper maximization of wide area measurement systems can go a long way in improving system reliability.
5. Major Blackout Causes around the Globe
Major power outages that affected people around the world from 2011 to 2018 have been comprehensively reviewed. Table 6 summarizes the most well-known blackout and cascading events in this decade. In addition, the blackout duration per hour for each event is given in Table 6. It can be seen that the blackout occurred in Bangladesh on 1 November 2014 has the highest duration of 24 h [47]. The Indian blackout on 30 July 2012 has impacted the highest number of people during history (620 million). The majority of causes of the blackout are related to transmission system operation, control and protection. Other useful information about the major blackouts in this decade are given in Table 6.
In addition, Table 6 gives a summary of the causes of power cuts and blackouts recorded across the globe [112]. Generally, all these causes end up in transmission line overload and tripping or generator tripping [64,113,114].
Table 7 shows 66 surveyed major power systems blackouts in some parts of the world from 2011 to 2019. The survey is not a comprehensive of all the power systems blackouts in the world but is a good indicative tool in analyzing the causes of power system blackouts. It can be seen that the highest number of blackouts was due to abnormal weather conditions such as severe winds and heavy storms and trees falling on transmissions line. However, bad weather conditions cannot be predicted with absolute certainty, therefore having a forecast of them and an improved power system monitoring a control platform can significantly safeguard power systems against such events.
In power systems, large disturbances are usually followed by series of events called cascading events. If these events are not well managed, the system would encounter a blackout. However, the initiating conditions vary and may include bad weather, animals shorting system equipment, operation errors or technical faults indicated under major causes of power systems collapse. Whenever a power system disturbance occurs, a deficit between the generation and the demand occurs resulting in unsecure operation of the system. This deficit can lead to overloading of generators and transmission lines causing the system frequency and voltages at respective buses in the system to drop. In order to keep the frequency and voltage within acceptable thresholds, emergency load tripping is done through relay action. If the curtailed load is not sufficient or if the relay action is delayed, subsequent transmission lines and generators trip. The situation will dramatically develop into cascading events, which, if not addressed, the system will collapse. From the time of the disturbance until the system collapses, the major physical phenomena of concern are mainly [114,115,116]:
- Transmission lines overloading or online generator tripping,
- Increase or decrease of the system frequency,
- Power system voltage collapse,
- Generators losing synchronism,
- Growing low-frequency oscillation of large power systems.
In addition to the major physical phenomena of concern, the general events which occur before and after the beginning of a cascade are nearly similar for the major recorded large scale power system blackouts. The main events before the cascade include excessive power transfers and lines tripping by tree contact (or unit tripping) (this occurs at below normal system voltage), which is mainly due to lack dynamic reactive power reserves [68]. In substation bus-bar fault or line fault, the tripping of lines tripping led to reversed power transfers or load transfer to parallel lines. The overall consumption of the reactive power increased. After the start of a cascade, protective relays operated on overload and the system integrity is severely compromised. Impedance relays also operated by out of step oscillation. Generating units also trips on under-frequency or under-voltage. Further investigations show that, in cascade events, the protective relays play a significant role in compounding and propagation of cascading blackouts [68].
Table 8 gives a summarized overview of the initial disturbances and the subsequent cascading events lead to the major blackouts around the globe.
In most cases when a power system is subjected to transmission lines overloading or tripping of connected generators, the frequency begins to decrease and this calls for the operation of UFLS techniques [58,116,117]. Other modern techniques in smart grids include demand side management, fast spinning reserve, and modern energy storage systems. UFLS techniques must be fast enough to arrest frequency decline; otherwise, the system will collapse. The voltage collapse of different bus bars has been also considered as one of the major causes leading to total power system collapse. Due to lack of information of all the systems across the globe, we considered the prevalence of some of the major cause of power outages as witnessed in the US.
There were about seven major causes of power outages recorded in the US in 2015. These causes are weather conditions or trees, too much demand, vehicle accidents, planned outages, faulty equipment or human error, animals and other unknown causes as shown in Figure 4. Weather conditions and trees contributed to the largest number of outages. About 1069 were due to weather conditions and trees. Improperly maintained trees can interfere with transmission or distribution lines leading to their tripping. Weather conditions such as storms, snows or other severe conditions can again affect transmission lines. Another 942 power cuts were due to faulty equipment and human error. Decisions by human operators that are ill timed or wrong can lead to unwanted tripping of units. Plant equipment must be properly and constantly maintained and, if not, can fail during operation leading to unplanned power cuts. Vehicle accidents such as cranes interfering with transmission lines or cars ramming onto power lines poles can interrupt the normal operation of this equipment. In 2015, 419 of these vehicle accidents together with others were recorded [54]. Power system equipment can be taken out on planned outages or statutory maintenance and this reduces the overall reliability of the system in which a disturbance occurring during this period might lead to cascading events, leaving a number of customers without power. Planned outages accounted for about 224 power cuts experienced in 2015. Animals can cause a power cut when they come in contact with energized equipment. In such cases, the electrical path is shorted through the animal body [56]. Of the power cuts recorded, 179 of them were related to animals. During peak hours or when an online unit is tripped, an imbalance between the demand and generation occurs. To prevent the decline of frequency, some system loads are intentionally shed to restore the system to normal operating conditions. Only nine power cuts were a result of over demand in 2015. Lastly, almost 714 power outages were due to unknown causes [54,56]. This poses a huge threat to the secure operation of power systems. There is a need to fully understand the power systems dynamics, causes of disturbances and how they can be prevented in the future.
Although the blackout tracker lists seven major causes of power systems disturbances and blackouts, in [118], eleven causes are stated. The given causes are more specific rather than generalized. The initial causes are primary equipment failure, design and application error, secondary equipment failure, communication and/or control system failures as well as natural phenomena beyond those designed. Other causes include operator errors, errors in maintenance, security related such as cyber-attacks, inadequate investment and complexity of systems, excessive risk taking and/or inappropriate risk management and others, which can be insufficient training of personnel. Of the 33 assessed power system blackouts in [118] the most common causes of system disturbances are natural phenomena, communication/control System failure, design and application error, operator error, primary equipment failure and insufficient training. The major causes in [57], which focus only on the U.S. system and [118], which focus on all continents are similar. It should be noted that the natural phenomena also include the conditions of weather as stated in the U.S blackout tracker.
6. Cascading Event Modeling and Analysis
Several critical cascading failures have been recorded in literature; therefore, it is of great importance to come up with appropriate models which helps to identify the critical initial disturbances, and helps to eliminate the cascading blackout of power systems in advance. Initially, the cause and the cascading process of blackouts must be known. Generally, a blackout usually starts as a single system failure, which can, in turn, lead to cascading failures [119,120,121]. These cascading blackouts leave many people affected and can result in heavy economic losses.
Before making the model, figuring out the cause and process of cascading blackout in power systems is essential. Based on the literature review, there are three types of main models that characterize power systems cascading failures. The first type of the models only describes the topological properties of power networks and ignores the underlying laws of physics and the principles of electrotechnics [122,123]. The second type of model considers the quasi-steady-state of power systems and calculates the power flow by solving the direct current (DC) or the alternate current (AC) power flow equations [124,125,126]. The third model focuses on investigating the emergence of cascading failures through dynamic modeling of power system components [127,128]. Nevertheless, the approaches of complex networks analysis in power grids was studied by [129] and it was deduced that it is necessary to incorporate the physical and electrical properties. In previous decades, researchers from various fields were attracted to coordination and control of multi-agent systems [130,131,132]. Since a bus in power grids can be considered a smart agent able to communicate and interact with its neighbors, a multi-agent system approaches can be applied to power system control and protection as in [133].
It is important for the industry and research institutions to have a thorough knowledge about the cascading outages [117]. Electrical power systems cover vast geographical areas and consist of different types of equipment inter-linked together. Due to this structure and nature, it is difficult to comprehend the way by which cascading outages evolve [120]. In this regard, researchers have come up with a variety of cascading failure-modeling approaches [117,134]. The most common approach for analyzing cascading failures is the quasi-steady-state (QSS) DC power flow models [119,135,136]. These models are simple and robust in describing cascading overloads. The major challenge with QSS-DC power flow is that they fail to capture nonlinear mechanisms. To model these nonlinear mechanisms, such as voltage collapse or dynamic instability, QSS-AC power flow models are used. In [137,138,139,140,141], QSS-AC power flow models are used in cascading effect analysis. Even though they can handle nonlinear effects, QSS-AC models have convergence problems. As a result, they require some assumption in machine modeling. In [140], a combination of both DC and AC models is proposed. This allows the under frequency load shedding and under voltage scenarios to the accurately modeled. These techniques are more superior to DC models but do not account for the effects of voltage collapse. Some proposed techniques rely on historical or simulation data to come up with the overall features of the cascading effects [141,142,143]. The techniques are generally known as statistical methods. In [132,133,144,145] topological models have been proposed. However when applied to power systems’ vulnerability assessment, they require enough grid information; otherwise, the results will be useless [136]. To understand the mid- to long-term stability impact on cascading outages, dynamic and numerical techniques have been applied [146,147,148,149]. It is important, however, to also do concurrent modeling of the system dynamics and the protection operation as in [150].
7. Impacts of Blackouts
Unplanned power outages and blackouts have significant impacts on businesses operating in the affected areas [151,152,153]. Human activities globally are highly dependent on power supply to an extent that, when a power system collapses, many effects are experienced [63,152,154,155]. In Figure 5, it can be seen that power blackouts have social, economic and political impacts on today’s human activities.
Socially, when a blackout is experienced, medical systems, rail and road traffic systems are heavily affected [151,156]. Facilities in big cities and towns, like water supply, depend on electricity to treat and pump water for domestic and industry use. The loss of power results in such facilities grounding to a halt. Loss of water for big cities pose a big health risk—for example, in some countries, outbreaks of diseases occur, which can take lives in a matter of hours. Vaccines and drugs that require refrigeration are at risk in the event of a prolonged blackout. The loss is also in monetary value, as new vaccines and drugs will be needed for replacement, creating artificial shortages for people in need of such drugs. Modern equipment in hospitals like X-rays, ventilators and theaters depend on electricity, thus paralyzing the hospital and causing danger to life [157]. The use of backup generators, which have a high cost, is also a financial burden on the already expensive costs of accessing health to a majority of people in the world. The backup generators require continuous maintenance and testing to ensure they will work in the event of a power outage. Patient data and lives are all on the line when the power goes out. In addition, without working telephone lines, people will not be able to call emergency services for help.
In business, huge economic losses occur due to internet breakdown, failure of payment systems and down time of manufacturing and production industries [151,158,159]. Industries, despite having backup generators, can still lose production hours resulting in losses in revenue from failing to meet demand or targets. Ports of entry (sea/air/road/rail) drive economies and heavily depend on electricity from control towers to handling containers that require cranes to move goods. The delay in loading/offloading of goods at seaports can have cascading effects i.e., critical goods like oil, medicines, and food. Perishable goods at ports are at risk due to a loss of refrigeration and delay in shipping or delivery [151,160,161]. Data center infrastructure that supports an organization’s IT operations are also affected. Data centers store, organize, manage and process a company’s information/data. The loss of data center due to a power outage results in loss of mission-critical data. Companies in the 21st century rely heavily on data stored in their data centers, and losing this crucial information could have long-term effects on the company’s daily operations. An example of this is that most project teams in an organization depend on these data centers to operate from different places across the world, thus also resulting in time lost in implementing projects causing delays and poor customer satisfaction. Financial companies involved in the stock market can lose out on thousands/millions of dollars in seconds due to blackouts. Transactions happen every second; even a short-term outage can have a drastic impact on businesses on the stock market. Companies in the retail industry suffer lost sales revenue with unplanned outages. For larger retail companies, a few minutes of downtime can lead to tens of thousands of dollars in lost revenue. The loss come from the loss in possible transactions and from perishable goods that require refrigeration.
Agriculture in the 21st century has become heavily dependent on mechanization to reach sufficient yield required to feed the growing population. Critical equipment such as irrigation makes use of pumps to get water from boreholes and rivers for crops and animals to process the harvest. The loss of power can cause devastating loss to a farmer in the line of farm production [162]. The blackouts also have even more serious impacts on the utility companies that are required to deal with the blackouts [163,164]. The blackouts have effects on costs from litigation, loss of equipment, overtime works for the employees, loss of generation and loss of revenue. The hydro plants can quickly recover from blackouts, but thermal plants take longer to bring units back online, and high costs of startups after a black out are experienced.
During a blackout, the security systems are disabled, and, if there are no standby power sources, this can be a political threat to a nation [58,165]. Electricity is used to operate military bases where government officials work to support and maintain deployment of weapons and oversee combat forces. The equipment also includes data centers, and outages can cause valuable weaponry and equipment to become useless in the event of an attack [154,166,167]. With non-functioning equipment, military personnel could be left defenseless from attacks. The bases may have also important facilities like airports and hospitals that also require electricity.
8. Research Gaps and Directions
It is with a great importance to present the most critical, practical and research gaps in the field of blackout and cascading studies in modern and future smart grids. By presenting such gaps, the future studies of blackout and design of the protective function would be better shaped. Therefore, we start with introducing the research gaps of blackout studies topic in Section 8.1, followed by some research direction for solving such gaps in Section 8.2.
8.1. Practical Challenges and Research Gaps
Traditional power systems have been known as vertically integrated utilities. In these types of power systems, one utility had a monopoly on the industry and handled all the functions. The operation and coordination of generation, transmission and distribution within a certain geographical area were under a single operator. Protective functions were simple and easily implemented without facing many challenges [1,124,168]. In contrast to traditional power systems, modern power systems face new complexities. Due to the ever-increasing demand for energy, modern power systems are usually operating near the steady state stability margins [169]. In case of major imbalance, the power systems do not have enough reserve/time to close the deficit and this may lead to cascading failures. To compensate the increasing demand and reduce the effects of conventional generation units, many countries have increased the penetration of renewable energy resources in their systems. Such high penetration results in high reduction in the total system inertia, which leads to noticeable fluctuation in the frequency and active power.
The main challenge in modern power systems is the existence of the traditional protective functions that can not adapt to the deregulation concept and the new types of generations. Unfortunately, there is no coordination between the different protective functions that result in erroneous operation. In some practical cases, it has been shown that the maloperation of some protective functions is the main reason behind blackouts. Therefore, the reliability of both control and protective functions need further investigations and improvements. The reliability is another important factor and has a direct impact on the occurrence of blackout and cascading events [16,170,171]. One element with low reliability rate is enough to make the overall ratability of the system worse. Therefore, there is a need for online assessment of the overall reliability of the system in order to reduce the power outage rate in modern power systems.
These are some of the challenges and gaps, which still need thorough attention of researchers in the implementation of control and protective schemes in order to reduce the power outages in modern power systems and future smart grids. The aforementioned most recent practical challenges associated with protective and operation functionalities are presented below as research gaps as follows:
- Considering the high penetration of renewable energy resource and distributed generation in blackout studies and planning of power system protection schemes.
- Considering the fluctuations of some important parameters in the modern power systems such as total inertia, damping coefficient, and stability indices.
- Investigating other indices for online stability and reliability assessment.
- Online coordination of the different control schemes in power systems can help with reduction of power outages.
- Online coordination of the different protective functions has a direct impact on the rate of blackout cascading events.
- Considering the real-time monitoring technologies for improving decision-making in the emergency situations in power systems.
- Investigating the ability of wide-area measurement systems in improving the reliability and security of the modern power system.
- Investigating the possibility of online coordination of protective functions for improving their performance in modern and future power systems.
- Considering the smart grid features in future protective function design.
- Proposing new protective methods that make use of wide area measurement system (WAMS) technologies.
- Increasing the protection against the cyber-attack issues.
8.2. Future Research Directions
Currently, there are noticeable research activities in investigating the ability of WAMS in providing new tools for online assessment of power system reliability, monitoring, and security [172,173,174,175]. The main point that can be raised in this topic is improving the dynamic and static monitoring of power systems during the disturbance and maloperation situations. There is a great need for reducing the time of a decision-making stage during the emergency situations. The future power system is in need of modern protective functions and schemes that can update their coordination online where the maloperation of protection schemes during the emergency state was one of the main reasons for blackout and cascading events.
Smart grid and WAMS technologies can provide effective solutions for reducing the blackout rate in modern and future smart power systems. In this regard, the smart grid enables demand side participation in providing some ancillary services for independent system operators (ISOs) such as primary and secondary reserves, and emergency demand response. The activation of such services might bring some advantages such as improving the stability margin and giving more time for decision-making during the emergency stage for choosing the best solution. Likewise, the infrastructures of modern power systems need more investigations in order to implement new technologies for avoiding the cascading events.
Electric system authorities in some countries have recently reported that their systems are under possible risk due to cyber-attack issues. It has been reported that some blackouts occurred due to cyber/physical attack issues. Therefore, there is a need for proposing new tools and protective functions that can prevent or at least mitigate the impact of such issues in modern power systems.
9. Conclusions
In this paper, the state of the art on blackout and cascading events in modern power systems is presented. Due to their importance, blackout and cascading events in power systems around the globe are completely reviewed. Different causes and reasons behind the different blackout in power systems are marked out. Furthermore, classical and modern methods for modeling the cascading events are surveyed. The challenges in protective functions and research gaps related to power systems blackout and cascading failures are highlighted. Finally, some research directions in the topic of modern load frequency control systems are proposed as motivation for research in this important topic. The main points that can be derived from this survey are:
- Most power system blackouts start due to bad weather followed by subsequent cascading events; therefore, weather forecasting techniques must be updated and power systems operators must have this information to prepare for such events.
- The other major cause was faulty equipment and human error, power system equipment is rated to operate under specific conditions and for specific durations before periodic checks or planned maintenance. These issues must be emphasized in power systems and standards adhered to.
- An upgrade of the power system monitoring, control and protection schemes is required to enhance system reliability. The wide area measurement systems (WAMS) platform is one of the promising platforms.
- Customers must be encouraged to participate in the demand side management programs such as the emergency demand response.
- Reserve management of most power systems must be improved—at any time, a specific share of generation must be allocated as a reserve. Ways to minimize the initial costs of renewable energies to be found and renewables must be used to supplement conventional generation.
- Pre-disturbance systems studies must be done and also include the possible cascading events.
- UFLS techniques must be improved so that they can quickly respond and shed enough load in emergencies.
Author Contributions
All authors have worked on this manuscript together and all authors have read and approved the final manuscript.
Funding
This research received no external funding.
Conflicts of Interest
The authors declare no conflict of interest.
Abbreviations
The following abbreviations are used in this manuscript:
| AC | Alternate Current |
| AI | Artificial Intelligence |
| ACE | Area Control Error |
| AE | aqua Electrolyzer |
| AGC | Automatic Generation Control |
| BPS | Bangladesh Power System |
| DC | Direct Current |
| FACTS | Flexible AC Transmission System |
| HVDC | High Voltage Direct Current |
| QSS | Quasi-Steady-State |
| RTCA | Real Time Contingency Analysis |
| SG | Smart Grid |
| MISO | Midwest ISO |
| NERC | North American Electric Reliability Council |
| DG | Distributed Generation |
| PMU | Phasor Measurement System |
| UFLS | Under Frequency Load Shedding |
| UVLS | Under Voltage Load shedding |
| WAMS | Wide-Area Measurement System |
| WAMCPS | Wide-Area Monitoring, Control, and Protection System |
| WECC | Western Electricity Coordinating Council |
References
- Salimian, M.R.; Aghamohammadi, M.R. A Three Stages Decision Tree-Based Intelligent Blackout Predictor for Power Systems Using Brittleness Indices. IEEE Trans. Smart Grid 2018, 9, 5123–5131. [Google Scholar] [CrossRef]
- Zhang, Y.; Xu, Y.; Dong, Z.Y. Robust Ensemble Data Analytics for Incomplete PMU Measurements-Based Power System Stability Assessment. IEEE Trans. Power Syst. 2018, 33, 1124–1126. [Google Scholar] [CrossRef]
- Amini, S.; Pasqualetti, F.; Mohsenian-Rad, H. Dynamic load altering attacks against power system stability: Attack models and protection schemes. IEEE Trans. Smart Grid 2018, 9, 2862–2872. [Google Scholar] [CrossRef]
- Billinton, R.; Li, W. Basic concepts of power system reliability evaluation. In Reliability Assessment of Electric Power Systems Using Monte Carlo Methods; Springer: New York, NY, USA, 1994; pp. 9–31. [Google Scholar]
- Kundur, P.; Balu, N.J.; Lauby, M.G. Power System Stability and Control; McGraw-Hill: New York, NY, USA, 1994; Volume 7. [Google Scholar]
- Makdisie, C.; Haidar, B.; Alhelou, H.H. An Optimal Photovoltaic Conversion System for Future Smart Grids. In Handbook of Research on Power and Energy System Optimization; IGI Global: Hershey, PA, USA, 2018; pp. 601–657. [Google Scholar]
- Alhelou, H.H. An Overview of Wide Area Measurement System and Its Application in Modern Power Systems. In Handbook of Research on Smart Power System Operation and Control; IGI Global: Hershey, PA, USA, 2019; pp. 289–307. [Google Scholar]
- Alhelou, H.H. Under Frequency Load Shedding Techniques for Future Smart Power Systems. In Handbook of Research on Smart Power System Operation and Control; IGI Global: Hershey, PA, USA, 2019; pp. 188–202. [Google Scholar]
- Mahfoud, F.; Guzun, B.D.; Lazaroiu, G.C.; Alhelou, H.H. Power Quality of Electrical Power Systems. In Handbook of Research on Smart Power System Operation and Control; IGI Global: Hershey, PA, USA, 2019; pp. 265–288. [Google Scholar]
- Ahmad, I.; Khan, F.; Khan, S.; Khan, A.; Tareen, A.W.; Saeed, M. Blackout Avoidance through Intelligent Load Shedding in Modern Electrical Power Utility Network. J. Appl. Emerg. Sci. 2018, 8, 48–57. [Google Scholar]
- Shaikh, F.; Alam, M.S.; Asghar, M.; Ahmad, F. Blackout Mitigation of Voltage Stability Constrained Transmission Corridors through Controlled Series Resistors. Recent Adv. Electr. Electron. Eng. 2018, 11, 4–14. [Google Scholar] [CrossRef]
- Alhelou, H.H.; Golshan, M.; Fini, M.H. Wind Driven Optimization Algorithm Application to Load Frequency Control in Interconnected Power Systems Considering GRC and GDB Nonlinearities. Electr. Power Compon. Syst. 2018. [Google Scholar] [CrossRef]
- Alhelou, H.H.; Golshan, M. Hierarchical plug-in EV control based on primary frequency response in interconnected smart grid. In Proceedings of the 2016 24th Iranian Conference on Electrical Engineering (ICEE), Shiraz, Iran, 10–12 May 2016; pp. 561–566. [Google Scholar]
- Alhelou, H.; Hamedani-Golshan, M.E.; Zamani, R.; Heydarian-Forushani, E.; Siano, P. Challenges and Opportunities of Load Frequency Control in Conventional, Modern and Future Smart Power Systems: A Comprehensive Review. Energies 2018, 11, 2497. [Google Scholar] [CrossRef]
- Zamani, R.; Hamedani-Golshan, M.E.; Alhelou, H.H.; Siano, P.; Pota, H.R. Islanding detection of synchronous distributed generator based on the active and reactive power control loops. Energies 2018, 11, 2819. [Google Scholar] [CrossRef]
- Carreras, B.A.; Reynolds-Barredo, J.M.; Dobson, I.; Newman, D.E. Validating the OPA cascading blackout model on a 19402 bus transmission network with both mesh and tree structures. In Proceedings of the 52nd Hawaii International Conference on System Sciences (HICSS), Wailea, HI, USA, 8–11 January 2019. [Google Scholar]
- Xu, D.; Wang, H. Blackout Risk Assessment of Cascading Outages Considering Wind Power Uncertainty. In Proceedings of the 2018 IEEE International Conference on Energy Internet (ICEI), Beijing, China, 20–22 October 2018; pp. 252–257. [Google Scholar]
- Ellis, M.D.; Radloff, J.P. Systems and Methods for Providing Blackout Support in Video Mosaic Environments. U.S. Patent 15/690,523, 4 January 2018. [Google Scholar]
- Kiliçkiran, H.C.; Şengör, İ.; Akdemir, H.; Kekezoğlu, B.; Erdinç, O.; Paterakis, N.G. Power system protection with digital overcurrent relays: A review of non-standard characteristics. Electr. Power Syst. Res. 2018, 164, 89–102. [Google Scholar] [CrossRef]
- Kirschen, D.S.; Strbac, G. Fundamentals of Power System Economics; John Wiley & Sons: New York, NY, USA, 2018. [Google Scholar]
- Alhelou, H.H.; Golshan, M.H.; Askari-Marnani, J. Robust sensor fault detection and isolation scheme for interconnected smart power systems in presence of RER and EVs using unknown input observer. Int. J. Electr. Power Energy Syst. 2018, 99, 682–694. [Google Scholar] [CrossRef]
- Alhelou, H.S.H.; Golshan, M.; Fini, M.H. Multi agent electric vehicle control based primary frequency support for future smart micro-grid. In Proceedings of the Smart Grid Conference (SGC), Tehran, Iran, 22–23 December 2015; pp. 22–27. [Google Scholar]
- Fini, M.H.; Yousefi, G.R.; Alhelou, H.H. Comparative study on the performance of many-objective and single-objective optimisation algorithms in tuning load frequency controllers of multi-area power systems. IET Gener. Transm. Distrib. 2016, 10, 2915–2923. [Google Scholar] [CrossRef]
- Alhelou, H.H. Fault Detection and Isolation in Power Systems Using Unknown Input Observer. In Advanced Condition Monitoring and Fault Diagnosis of Electric Machines; IGI Global: Hershey, PA, USA, 2018; p. 38. [Google Scholar]
- Hain, Y.; Schweitzer, I. Analysis of the power blackout of June 8, 1995 in the Israel Electric Corporation. IEEE Trans. Power Syst. 1997, 12, 1752–1758. [Google Scholar] [CrossRef]
- White, D.; Roschelle, A.; Peterson, P.; Schlissel, D.; Biewald, B.; Steinhurst, W. The 2003 blackout: Solutions that won’t cost a fortune. Electr. J. 2003, 16, 43–53. [Google Scholar] [CrossRef]
- Bompard, E.; Joint Research Center of the European Commission. A Perspective Overview of Topological Approaches for Vulnerability. Networks 2018, 66, 65102. [Google Scholar]
- Miller, N.; Shao, M.; Venkataraman, S.; Loutan, C.; Rothleder, M. Frequency response of California and WECC under high wind and solar conditions. In Proceedings of the 2012 IEEE Power and Energy Society General Meeting, San Diego, CA, USA, 22–26 July 2012; pp. 1–8. [Google Scholar]
- Denyer, D.; Tranfield, D. Producing a systematic review. In The Sage Handbook of Organizational Research Methods; Sage Publications Ltd.: Thousand Oaks, CA, USA, 2009. [Google Scholar]
- Shamseer, L.; Moher, D.; Clarke, M.; Ghersi, D.; Liberati, A.; Petticrew, M.; Shekelle, P.; Stewart, L.A. Preferred reporting items for systematic review and meta-analysis protocols (PRISMA-P) 2015: Elaboration and explanation. BMJ 2015, 349, g7647. [Google Scholar] [CrossRef] [PubMed]
- Moher, D.; Shamseer, L.; Clarke, M.; Ghersi, D.; Liberati, A.; Petticrew, M.; Shekelle, P.; Stewart, L.A. Preferred reporting items for systematic review and meta-analysis protocols (PRISMA-P) 2015 statement. Syst. Rev. 2015, 4, 1. [Google Scholar] [CrossRef] [PubMed] [Green Version]
- Kirkham, J.J.; Dwan, K.M.; Altman, D.G.; Gamble, C.; Dodd, S.; Smyth, R.; Williamson, P.R. The impact of outcome reporting bias in randomised controlled trials on a cohort of systematic reviews. BMJ 2010, 340, c365. [Google Scholar] [CrossRef] [PubMed]
- Kirkham, J.J.; Altman, D.G.; Williamson, P.R. Bias due to changes in specified outcomes during the systematic review process. PLoS ONE 2010, 5, e9810. [Google Scholar] [CrossRef] [PubMed]
- Jain, S.K.; Chakrabarti, S.; Singh, S. Review of load frequency control methods, Part-I: Introduction and pre-deregulation scenario. In Proceedings of the 2013 International Conference on Control, Automation, Robotics and Embedded Systems (CARE), Jabalpur, India, 16–18 December 2013; pp. 1–5. [Google Scholar]
- Portante, E.C.; Folga, S.F.; Kavicky, J.A.; Malone, L.T. Simulation of the september 8, 2011, san diego blackout. In Proceedings of the 2014 Winter Simulation Conference (WSC), Savannah, GA, USA, 7–10 December 2014; pp. 1527–1538. [Google Scholar]
- Papic, M. Pacific southwest blackout on September 8, 2011 at 15: 27. In Proceedings of the IEEE PES General Meeting, Vancouver, BC, Canada, 21–25 July 2013. [Google Scholar]
- Aoyama, M.; Hamajima, Y.; Hult, M.; Uematsu, M.; Oka, E.; Tsumune, D.; Kumamoto, Y. 134 Cs and 137 Cs in the North Pacific Ocean derived from the March 2011 TEPCO Fukushima Dai-ichi Nuclear Power Plant accident, Japan. Part one: surface pathway and vertical distributions. J. Oceanogr. 2016, 72, 53–65. [Google Scholar] [CrossRef]
- Lin, W.; Tang, Y.; Sun, H.; Guo, Q.; Zhao, H.; Zeng, B. Blackout in Brazil power grid on February 4, 2011 and inspirations for stable operation of power grid. Autom. Electr. Power Syst. 2011, 35, 1–5. [Google Scholar]
- Liu, B.; Zhou, B.; Jiang, D.; Yu, Z.; Yang, X.; Ma, X. Distributed Accommodation for Distributed Generation–From the View of Power System Blackouts. In Advances in Green Energy Systems and Smart Grid; Springer: New York, NY, USA, 2018; pp. 236–246. [Google Scholar]
- Wu, Y.K.; Chang, S.M.; Hu, Y.L. Literature Review of Power System Blackouts. Energy Procedia 2017, 141, 428–431. [Google Scholar] [CrossRef]
- Lai, L.L.; Zhang, H.T.; Mishra, S.; Ramasubramanian, D.; Lai, C.S.; Xu, F.Y. Lessons learned from July 2012 Indian blackout. In Proceedings of the 9th IET International Conference on Advances in Power System Control, Operation and Management (APSCOM 2012), Hong Kong, China, 30–31 July 2012. [Google Scholar]
- Tang, Y.; Bu, G.; Yi, J. Analysis and lessons of the blackout in Indian power grid on July 30 and 31, 2012. Proc. Chin. Soc. Electr. Eng. 2012, 32, 167–174. [Google Scholar]
- Romero, J.J. Blackouts illuminate India’s power problems. IEEE Spectr. 2012, 49, 11–12. [Google Scholar] [CrossRef]
- Trung, S.P.; Voropai, N. The Major Outage in South Vietnam in 2013: The Nature of Blackout, Security Measures and Strategy of National Power System Modernization. In Proceedings of the International Conference on Problems of Critical Infrastructures (ICCIP 2015), Arlington, VA, USA, 16–18 March 2015. [Google Scholar]
- Gomes, P. New strategies to improve bulk power system security: Lessons learned from large blackouts. In Proceedings of the 2004 IEEE Power Engineering Society General Meeting, Denver, CO, USA, 6–10 June 2004; pp. 1703–1708. [Google Scholar]
- Phuangpornpitak, N.; Tia, S. Opportunities and challenges of integrating renewable energy in smart grid system. Energy Procedia 2013, 34, 282–290. [Google Scholar] [CrossRef]
- Kabir, M.A.; Sajeeb, M.M.H.; Islam, M.N.; Chowdhury, A.H. Frequency transient analysis of countrywide blackout of Bangladesh Power System on 1st November, 2014. In Proceedings of the 2015 International Conference on Advances in Electrical Engineering (ICAEE), Dhaka, Bangladesh, 17–19 December 2015; pp. 267–270. [Google Scholar]
- Marwat, I.; Khan, F.; Rehman, A. Avoidance of blackout using Automatic node switching technique through ETAP. Int. J. Sci. Eng. Res. 2017, 10, 715–720. [Google Scholar]
- Masood, S. Rebels tied to blackout across most of pakistan. New York Times, 25 January 2015. [Google Scholar]
- Veloza, O.P.; Santamaria, F. Analysis of major blackouts from 2003 to 2015: Classification of incidents and review of main causes. Electr. J. 2016, 29, 42–49. [Google Scholar] [CrossRef]
- Baojie, L.; Jinbo, L.; Hongjie, L. Analysis of Turkey Blackout on March 31 2015 and Lessons on China Power Grid. Proc. CSEE 2016, 36, 5788–5795. [Google Scholar]
- Miguel, E.; Wolfram, C.; Lee, K. Experimental Evidence on the Demand for and Costs of Rural Electrification; National Bureau of Economic Research: Cambridge, MA, USA, 2016. [Google Scholar]
- Okumu, J.O.; Hood, A. Strategic Management Factors Affecting Performance of Thermal Power Generation Companies in Kenya; Elixir Publisher: Tamilnadu State, India, 2017. [Google Scholar]
- Eaton, B.T. United States Annual Report 2013; Technical Report. 2013. Available online: http://powerquality.eaton.com (accessed on 10 February 2018).
- Laghari, J.; Mokhlis, H.; Bakar, A.; Mohamad, H. Application of computational intelligence techniques for load shedding in power systems: A review. Energy Convers. Manag. 2013, 75, 130–140. [Google Scholar] [CrossRef]
- Eaton, B.T. United States Annual Report 2015; Technical Report. 2015. Available online: http://powerquality.eaton.com (accessed on 03 February 2018).
- Eaton, B.T. United States Annual Report 2013; Technical Report. 2013. Available online: http://powerquality.eaton.com/blackouttracker/default.asp (accessed on 19 January 2018).
- Pourbeik, P.; Kundur, P.S.; Taylor, C.W. The anatomy of a power grid blackout-Root causes and dynamics of recent major blackouts. IEEE Power Energy Mag. 2006, 4, 22–29. [Google Scholar] [CrossRef]
- Liu, Y.; Zhong, J. Risk assessment of power systems under extreme weather conditions—A review. In Proceedings of the 2017 IEEE Manchester PowerTech, Manchester, UK, 18–22 June 2017; pp. 1–6. [Google Scholar]
- Imai, S. TEPCO observations on August 14 blackout and recommendations to prevent future blackouts based on TEPCO’s experience. In Proceedings of the IEEE PES General Meeting, Denver, CO, USA, 6–10 June 2004. [Google Scholar]
- Bhatt, N. August 14, 2003 US-Canada blackout. In Proceedings of the IEEE PES General Meeting, Denver, CO, USA, 6–10 June 2004. [Google Scholar]
- US-Canada Power System Outage Task Force. Final Report on the August 14, 2003 Blackout in the United States and Canada: Causes and Recommendations; US-Canada Power System Outage Task Force: Ottawa, ON, Canada, 2004.
- Yang, B.; Vittal, V.; Heydt, G.T. Slow-coherency-based controlled islanding—A demonstration of the approach on the August 14, 2003 blackout scenario. IEEE Trans. Power Syst. 2006, 21, 1840–1847. [Google Scholar] [CrossRef]
- Andersson, G.; Donalek, P.; Farmer, R.; Hatziargyriou, N.; Kamwa, I.; Kundur, P.; Martins, N.; Paserba, J.; Pourbeik, P.; Sanchez-Gasca, J.; et al. Causes of the 2003 major grid blackouts in North America and Europe, and recommended means to improve system dynamic performance. IEEE Trans. Power Syst. 2005, 20, 1922–1928. [Google Scholar] [CrossRef]
- Chassin, D.P.; Posse, C. Evaluating North American electric grid reliability using the Barabási–Albert network model. Phys. A Stat. Mech. Appl. 2005, 355, 667–677. [Google Scholar] [CrossRef] [Green Version]
- Jaleeli, N.; VanSlyck, L.S. NERC’s new control performance standards. IEEE Trans. Power Syst. 1999, 14, 1092–1099. [Google Scholar] [CrossRef]
- Sahraei-Ardakani, M.; Li, X.; Balasubramanian, P.; Hedman, K.; Abdi-Khorsand, M. Real-time contingency analysis with transmission switching on real power system data. IEEE Trans. Power Syst. 2016, 31, 2501–2502. [Google Scholar] [CrossRef]
- Meng, D. Maintaining system integrity to prevent cascading blackout. In Proceedings of the Cigre Conference, Paris, France, 27 August–2 September 2006. [Google Scholar]
- Larsson, S.; Danell, A. The blackout in southern Sweden and eastern Denmark, September 23, 2003. In Proceedings of the 2006 Power Systems Conference and Exposition (PSCE’06), Atlanta, GA, USA, 29 October–1 November 2006; pp. 309–313. [Google Scholar]
- Hansen, K.T.; Waade, A.M. Funding Models and Increasing Transnationalism. In Locating Nordic Noir; Springer: New York, NY, USA, 2017; pp. 145–159. [Google Scholar]
- Atputharajah, A.; Saha, T.K. Power system blackouts-literature review. In Proceedings of the 2009 International Conference on Industrial and Information Systems (ICIIS), Peradeniya, Sri Lanka, 28–31 December 2009; pp. 460–465. [Google Scholar]
- Corsi, S.; Sabelli, C. General blackout in italy sunday september 28, 2003, h. 03: 28: 00. In Proceedings of the 2004 IEEE Power Engineering Society General Meeting, Denver, CO, USA, 6–10 June 2004; pp. 1691–1702. [Google Scholar]
- Berizzi, A. The italian 2003 blackout. In Proceedings of the 2004 IEEE Power Engineering Society General Meeting, Denver, CO, USA, 6–10 June 2004; pp. 1673–1679. [Google Scholar]
- Taylor, C. Preventing blackouts. In Proceedings of the IEEE PES General Meeting, Denver, CO, USA, 6–10 June 2004. [Google Scholar]
- Dagle, J.E. Data management issues associated with the august 14, 2003 blackout investigation. In Proceedings of the 2004 IEEE Power Engineering Society General Meeting, Denver, CO, USA, 6–10 June 2004; pp. 1680–1684. [Google Scholar]
- Hauer, J.F.; Bhatt, N.B.; Shah, K.; Kolluri, S. Performance of “WAMS East” in providing dynamic information for the North East blackout of August 14, 2003. In Proceedings of the 2004 IEEE Power Engineering Society General Meeting, Denver, CO, USA, 6–10 June 2004; pp. 1685–1690. [Google Scholar]
- Kathuria, R.; Kedia, M.; Varma, G.; Bagchi, K.; Sekhani, R. The Anatomy of an Internet Blackout: Measuring the Economic Impact Of Internet Shutdowns in India; Indian Council for Research on International Economic Relations: New Delhi, India, 2018. [Google Scholar]
- Nagpal, M.; Martinich, T.G.; Jiao, Z.; Manuel, S.H.; Zhang, H.A.; Alimardani, A. Lessons Learned From a Regional System Blackout and Restoration in BC Hydro. IEEE Trans. Power Deliv. 2018, 33, 1954–1961. [Google Scholar] [CrossRef]
- Nandi, A.; Mazumdar, S.; Behrman, J.R. The effect of natural disaster on fertility, birth spacing, and child sex ratio: Evidence from a major earthquake in India. J. Popul. Econ. 2018, 31, 267–293. [Google Scholar] [CrossRef]
- Nikolakakis, T.; Chattopadhyay, D.; Bazilian, M. A review of renewable investment and power system operational issues in Bangladesh. Renew. Sustain. Energy Rev. 2017, 68, 650–658. [Google Scholar] [CrossRef]
- Chen, B.; Chen, H. Impact of Cyber System Failure on Cascading Blackout of Power Grid. In Proceedings of the 2018 2nd IEEE Conference on Energy Internet and Energy System Integration (EI2), Beijing, China, 20–22 October 2018; pp. 1–5. [Google Scholar]
- Gawanmeh, A.; Alomari, A. Taxonomy analysis of security aspects in cyber physical systems applications. In Proceedings of the 2018 IEEE International Conference on Communications Workshops (ICC Workshops), Kansas City, MO, USA, 20–24 May 2018; pp. 1–6. [Google Scholar]
- Miranda, V.A.; Oliveira, A.V. Airport slots and the internalization of congestion by airlines: An empirical model of integrated flight disruption management in Brazil. Transp. Res. Part A Policy Pract. 2018, 116, 201–219. [Google Scholar] [CrossRef]
- Gomes, P.; Cardoso, G., Jr. Reducing Blackout Risk by System Protection Schemes-Detection And Mitigation of Critical System Conditions; CIGR: East Lansing, MI, USA, 2006; pp. 2–201. [Google Scholar]
- Antonio, C. Lessons Learned in Restoration from Recent Blackout Incidents in Brazilian Power System; e-Cigre: Paris, France, 2012. [Google Scholar]
- Leelawat, N.; Mateo, C.M.R.; Gaspay, S.M.; Suppasri, A.; Imamura, F. Filipinos’ Views on the Disaster Informationfor the 2013 Super Typhoon Haiyan in the Philippines. Int. J. Sustain. Futur. Hum. Secur. 2014, 2, 16–28. [Google Scholar] [CrossRef]
- Shao, Y.; Tang, Y.; Yi, J.; WANG, A. Analysis and lessons of blackout in Turkey power grid on March 31, 2015. Autom. Electr. Power Syst. 2016, 40, 9–14. [Google Scholar]
- Liang, G.; Weller, S.R.; Zhao, J.; Luo, F.; Dong, Z.Y. The 2015 ukraine blackout: Implications for false data injection attacks. IEEE Trans. Power Syst. 2017, 32, 3317–3318. [Google Scholar] [CrossRef]
- Sullivan, J.E.; Kamensky, D. How cyber-attacks in Ukraine show the vulnerability of the US power grid. Electr. J. 2017, 30, 30–35. [Google Scholar] [CrossRef]
- Bråten, D.P. Taser or shock collar? Energy as a weapon and interdependence in the Ukraine crisis 2014–2015. Master’s Thesis, University of Oslo, Oslo, Norway, 2017. [Google Scholar]
- Sheng-jie, Z.; Bing, H.; Li-fu, W.; Liang-tao, G. Enlightenments of the Ukraine Blackout to Cyber Security of Global Energy Interconnection. Electr. Power Inf. Commun. Technol. 2016, 14, 77–83. [Google Scholar]
- Bambaravanage, T.; Kumarawadu, S.; Rodrigo, A. Comparison of three Under-Frequency Load Shedding Schemes referring to the Power System of Sri Lanka. Eng. J. Inst. Eng. 2016, 49, 41–52. [Google Scholar] [CrossRef]
- Rampurkar, V.; Pentayya, P.; Mangalvedekar, H.A.; Kazi, F. Cascading failure analysis for Indian power grid. IEEE Trans. Smart Grid 2016, 7, 1951–1960. [Google Scholar] [CrossRef]
- Marikkar, N.; Jayath, T.; Egodawatta, K.; Vierling, M.; Aboujaib, M.; Sokolov, D.; Meskers, D.; Russell, R.; Moliere, M. A Review of the Experience Achieved at the Yugadanavi 300 MW CCGT in Sri Lanka: Increasing the Firing Temperature of Gas Turbines Using a Novel Vanadium Inhibitor. In Proceedings of the ASME Turbo Expo 2017: Turbomachinery Technical Conference and Exposition, Charlotte, NC, USA, 26–30 June 2017; American Society of Mechanical Engineers: New York, NY, USA, 2017; p. V003T03A005. [Google Scholar]
- Yan, R.; Al Masood, N.; Saha, T.K.; Bai, F.; Gu, H. The Anatomy of the 2016 South Australia Blackout: A Catastrophic Event in a High Renewable Network. IEEE Trans. Power Syst. 2018, PP, 1. [Google Scholar] [CrossRef]
- Lucas, A. Confected conflict in the wake of the South Australian blackout: Diversionary strategies and policy failure in Australia’s energy sector. Energy Res. Soc. Sci. 2017, 29, 149–159. [Google Scholar] [CrossRef]
- Jamborsalamati, P.; Moghimi, M.; Hossain, M.; Taghizadeh, S.; Lu, J.; Konstantinou, G. A Framework for Evaluation of Power Grid Resilience Case Study: 2016 South Australian Blackout. In Proceedings of the 2018 IEEE International Conference on Environment and Electrical Engineering and 2018 IEEE Industrial and Commercial Power Systems Europe (EEEIC/I&CPS Europe), Palermo, Italy, 12–15 June 2018; pp. 1–6. [Google Scholar]
- Zeng, H.; Sun, F.; Li, T.; Zhang, Q.; Tang, J.; Zhang, T. Analysis of “9. 28” blackout in South Australia and its enlightenment to China. Autom. Electr. Power Syst. 2017, 41, 1–6. [Google Scholar]
- Reese, A. Blackouts cast Australia’s green energy in dim light. Science 2017, 355, 1001–1002. [Google Scholar] [CrossRef]
- Dobson, I.; Newman, D.E. Cascading blackout overall structure and some implications for sampling and mitigation. Int. J. Electr. Power Energy Syst. 2017, 86, 29–32. [Google Scholar] [CrossRef] [Green Version]
- Tras ApagóN Restituyen EnergíA; OSE Dice Que Se Solucionaron Fallas; Technical Report. 26 August 2017. Available online: http://www.elpais.com.uy/informacion/apagon-sur-ute-lluvias.html (accessed on 10 December 2017).
- Major Power Outage Events; Technical Report. 2018. Available online: https://poweroutage.us/about/majorevent (accessed on 5 December 2018).
- Sudan. Complete Power Blackout Hits Sudan; Technical Report. 26 August 2018. Available online: http://xinhuanet.com/english/2018/02/28/c137004277.htm (accessed on 10 January 2019).
- Osman, M.A.A. Contingency Analysis In Presence Of SVC Controller of Sudan National Grid For Electricity. Ph.D. Thesis, Sudan University of Science and Technology, Khartoum, Sudan, 2018. [Google Scholar]
- Yagoub, M.A.; Tao, Z. Modeling and Mitigation of Geomagnetically Induced Currents (GICs) for Single-Phase Power Transformer. In Proceedings of the 2018 International Conference on Computer, Control, Electrical, and Electronics Engineering (ICCCEEE), Khartoum, Sudan, 12–14 August 2018; 2018; pp. 1–6. [Google Scholar]
- Mohammed, K.E. An Intelligent Load Shedding System Application in Sudan National Grid. Ph.D. Thesis, Sudan University of Science and Technology, Khartoum, Sudan, 2018. [Google Scholar]
- Power Reported Restored after Baku Hit With Partial Second Blackout; Technical Report. 4 July 2018. Available online: https://www.rferl.org/amp/29334268.html (accessed on 3 January 2019).
- Hyndle-Hussein, J.; Kardaś, S.; Kłysiński, K. Troublesome Investment. The Belarusian Nuclear Power Plant in Astravyets. OSW Studies 74, July 2018; University of Pittsburgh: Pittsburgh, PA, USA, 2018. [Google Scholar]
- Carlson, S. Powerful ties: Eu-turkey energy relations. Turk. Policy Q. 2018, 17, 105–115. [Google Scholar]
- Hunt, J.D.; Stilpen, D.; de Freitas, M.A.V. A review of the causes, impacts and solutions for electricity supply crises in Brazil. Renew. Sustain. Energy Rev. 2018, 88, 208–222. [Google Scholar] [CrossRef]
- BC Hyro. BC Hydro Crews Continue to Repair Damage After Historic Windstorm, Extended Outages Expected; Technical Report; BC Hyro: Vancouver, BC, Canada, 2018; Available online: https://www.bchydro.com/news/presscentre/newsreleases/2018/bc-hydro-crews-continue-to-repair-damage-after-historic-windstorm.html (accessed on 15 January 2018).
- Johnson, C.W. Analysing the causes of the Italian and Swiss blackout, 28 th september 2003. In Proceedings of the Twelfth Australian Workshop on Safety Critical Systems and Software and Safety-Related Programmable Systems, Adelaide, Australia, 30–31 August 2007; Australian Computer Society, Inc.: Darlinghurst, Australia, 2007; Volume 86, pp. 21–30. [Google Scholar]
- Sforna, M.; Delfanti, M. Overview of the events and causes of the 2003 Italian blackout. In Proceedings of the 2006 IEEE Power Systems Conference and Exposition (PSCE’06), Atlanta, GA, USA, 29 October–1 November 2006; pp. 301–308. [Google Scholar]
- Tang, S.Q.; Zhang, M.; Li, J.S.; Wu, X.C.; Jiang, K.; Shu, S.Y. Review of Blackout in Hainan on September 26th—Causes and Recommendations. Autom. Electr. Power Syst. 2006, 1, 1–7. [Google Scholar]
- Bennet, J. The agency of assemblages and the North American blackout. Public Cult. 2005, 17, 445–465. [Google Scholar] [CrossRef]
- Hartunian, R.; Stewart, G.; Fergason, S.; Curtiss, T.; Seibold, R. Causes and Mitigation of Radio Frequency (RF) Blackout During Reentry of Reusable Launch Vehicles; Technical Report; Aerospace Corporation: Segundo, CA, USA, 2007. [Google Scholar]
- Liscouski, B.; Elliot, W. Final Report on the August 14, 2003 Blackout in the United States And Canada: Causes and Recommendations; US Department of Energy: Washington, DC, USA, 2004; Volume 40, p. 86.
- Li Convenor, B.; Gomes Secretary, P.; Baumann, R.; Phillips, W.; Guarini, A.; Hayden, M. Lessons Learnt from Recent Emergencies and Blackout Incidents; Cigre, Working Group C2.21; CIGR: East Lansing, MI, USA, 2015; pp. 1–39. [Google Scholar]
- Vaiman, M.; Bell, K.; Chen, Y.; Chowdhury, B.; Dobson, I.; Hines, P.; Papic, M.; Miller, S.; Zhang, P. Risk assessment of cascading outages: Methodologies and challenges. IEEE Trans. Power Syst. 2012, 27, 631. [Google Scholar] [CrossRef]
- Dobson, I.; Carreras, B.A.; Lynch, V.E.; Newman, D.E. Complex systems analysis of series of blackouts: Cascading failure, critical points, and self-organization. Chaos Interdiscip. J. Nonlinear Sci. 2007, 17, 026103. [Google Scholar] [CrossRef] [Green Version]
- Eppstein, M.J.; Hines, P.D. A “random chemistry” algorithm for identifying collections of multiple contingencies that initiate cascading failure. IEEE Trans. Power Syst. 2012, 27, 1698–1705. [Google Scholar] [CrossRef]
- Carreras, B.A.; Lynch, V.E.; Dobson, I.; Newman, D.E. Critical points and transitions in an electric power transmission model for cascading failure blackouts. Chaos Interdiscip. J. Nonlinear Sci. 2002, 12, 985–994. [Google Scholar] [CrossRef] [Green Version]
- Yan, J.; Tang, Y.; He, H.; Sun, Y. Cascading failure analysis with DC power flow model and transient stability analysis. IEEE Trans. Power Syst. 2015, 30, 285–297. [Google Scholar] [CrossRef]
- Nedic, D.P.; Dobson, I.; Kirschen, D.S.; Carreras, B.A.; Lynch, V.E. Criticality in a cascading failure blackout model. Int. J. Electr. Power Energy Syst. 2006, 28, 627–633. [Google Scholar] [CrossRef] [Green Version]
- Chen, Q.; Mili, L. Composite power system vulnerability evaluation to cascading failures using importance sampling and antithetic variates. IEEE Trans. Power Syst. 2013, 28, 2321–2330. [Google Scholar] [CrossRef]
- Mei, S.; Ni, Y.; Wang, G.; Wu, S. A study of self-organized criticality of power system under cascading failures based on AC-OPF with voltage stability margin. IEEE Trans. Power Syst. 2008, 23, 1719–1726. [Google Scholar]
- Bienstock, D. Adaptive online control of cascading blackouts. In Proceedings of the 2011 IEEE Power and Energy Society General Meeting, Detroit, MI, USA, 24–29 July 2011; pp. 1–8. [Google Scholar]
- Fitzmaurice, R.; Cotilla-Sanchez, E.; Hines, P. Evaluating the impact of modeling assumptions for cascading failure simulation. In Proceedings of the 2012 IEEE Power and Energy Society General Meeting, San Diego, CA, USA, 22–26 July 2012; pp. 1–8. [Google Scholar]
- Rahnamay-Naeini, M.; Wang, Z.; Ghani, N.; Mammoli, A.; Hayat, M.M. Stochastic analysis of cascading-failure dynamics in power grids. IEEE Trans. Power Syst. 2014, 29, 1767–1779. [Google Scholar] [CrossRef]
- Hines, P.D.; Dobson, I.; Cotilla-Sanchez, E.; Eppstein, M. “Dual Graph” and “Random Chemistry” Methods for Cascading Failure Analysis. In Proceedings of the 2013 46th Hawaii International Conference on System Sciences (HICSS), Wailea, HI, USA, 7–10 January 2013; pp. 2141–2150. [Google Scholar]
- Dobson, I. Estimating the propagation and extent of cascading line outages from utility data with a branching process. IEEE Trans. Power Syst. 2012, 27, 2146–2155. [Google Scholar] [CrossRef]
- Boccaletti, S.; Latora, V.; Moreno, Y.; Chavez, M.; Hwang, D.U. Complex networks: Structure and dynamics. Phys. Rep. 2006, 424, 175–308. [Google Scholar] [CrossRef] [Green Version]
- Hines, P.; Cotilla-Sanchez, E.; Blumsack, S. Topological models and critical slowing down: Two approaches to power system blackout risk analysis. In Proceedings of the 2011 44th Hawaii International Conference on System Sciences (HICSS), Kauai, HI, USA, 4–7 January 2011; pp. 1–10. [Google Scholar]
- Hines, P.D.; Rezaei, P. Cascading failures in power systems. In Smart Grid Handbook; Wiley: New York, NY, USA, 2016; pp. 1–20. [Google Scholar]
- Yu, Y.; Xiao, G.; Zhou, J.; Wang, Y.; Wang, Z.; Kurths, J.; Schellnhuber, H.J. System crash as dynamics of complex networks. Proc. Natl. Acad. Sci. USA 2016, 113, 11726–11731. [Google Scholar] [CrossRef] [PubMed] [Green Version]
- Hines, P.; Cotilla-Sanchez, E.; Blumsack, S. Do topological models provide good information about electricity infrastructure vulnerability? Chaos Interdiscip. J. Nonlinear Sci. 2010, 20, 033122. [Google Scholar] [CrossRef] [PubMed] [Green Version]
- Soltan, S.; Mazauric, D.; Zussman, G. Cascading failures in power grids: Analysis and algorithms. In Proceedings of the 5th International Conference on Future Energy Systems, Cambridge, UK, 11–13 June 2014; pp. 195–206. [Google Scholar]
- Zhai, C.; Zhang, H.; Xiao, G.; Pan, T.C. Modeling and Identification of Worst-Case Cascading Failures in Power Systems. arXiv, 2017; arXiv:1703.05232. [Google Scholar]
- Cate, E.G.; Hemmaplardh, K.; Manke, J.W.; Gelopulos, D. Time frame notion and time response of the models in transient, mid-term and long-term stability programs. IEEE Trans. Power Appar. Syst. 1984, 1, 143–151. [Google Scholar] [CrossRef]
- Ouyang, M.; Zhao, L.; Pan, Z.; Hong, L. Comparisons of complex network based models and direct current power flow model to analyze power grid vulnerability under intentional attacks. Phys. A Stat. Mech. Appl. 2014, 403, 45–53. [Google Scholar] [CrossRef]
- Pagani, G.A.; Aiello, M. The power grid as a complex network: A survey. Phys. A Stat. Mech. Appl. 2013, 392, 2688–2700. [Google Scholar] [CrossRef]
- Zhai, C.; Hong, Y. Decentralized sweep coverage algorithm for uncertain region of multi-agent systems. In Proceedings of the 2012 IEEE American Control Conference (ACC), Montreal, QC, Canada, 27–29 June 2012; pp. 4522–4527. [Google Scholar]
- Zhang, H.T.; Zhai, C.; Chen, Z. A general alignment repulsion algorithm for flocking of multi-agent systems. IEEE Trans. Autom. Control 2011, 56, 430–435. [Google Scholar] [CrossRef]
- Wang, J.W.; Rong, L.L. Cascade-based attack vulnerability on the US power grid. Saf. Sci. 2009, 47, 1332–1336. [Google Scholar] [CrossRef]
- Albert, R.; Albert, I.; Nakarado, G.L. Structural vulnerability of the North American power grid. Phys. Rev. E 2004, 69, 025103. [Google Scholar] [CrossRef]
- Ma, H.T.; Crow, M.L.; Chowdhury, B.H.; Lininger, A. Cascading line outage prevention with multiple UPFCs. In Proceedings of the 2007 39th North American Power Symposium (NAPS’07), Las Cruces, NM, USA, 30 September–2 October 2007; pp. 273–278. [Google Scholar]
- Fabozzi, D.; Van Cutsem, T. Simplified time-domain simulation of detailed long-term dynamic models. In Proceedings of the 2009 Power & Energy Society General Meeting (PES’09), Calgary, AB, Canada, 26–30 July 2009; pp. 1–8. [Google Scholar]
- Khaitan, S.K.; Fu, C.; McCalley, J. Fast parallelized algorithms for on-line extended-term dynamic cascading analysis. In Proceedings of the 2009 Power Systems Conference and Exposition (PSCE’09), Seattle, WA, USA, 15–18 March 2009; pp. 1–7. [Google Scholar]
- Abhyankar, S.; Flueck, A.J. Real-time power system dynamics simulation using a parallel block-jacobi preconditioned Newton-GMRES scheme. In Proceedings of the 12 SC Companion: High Performance Computing, Networking, Storage and Analysis (SCC), Salt Lake City, UT, USA, 10–16 November 2012; pp. 299–305. [Google Scholar]
- Parmer, C.; Cotilla-Sanchez, E.; Thornquist, H.K.; Hines, P.D. Developing a dynamic model of cascading failure for high performance computing using trilinos. In Proceedings of the First International Workshop on High Performance Computing, Networking and Analytics for the Power Grid, Seattle, WA, USA, 13 Novembe 2011; pp. 25–34. [Google Scholar]
- Rose, A.; Oladosu, G.; Liao, S.Y. Business interruption impacts of a terrorist attack on the electric power system of Los Angeles: Customer resilience to a total blackout. Risk Anal. Int. J. 2007, 27, 513–531. [Google Scholar] [CrossRef]
- Hines, P.; Apt, J.; Talukdar, S. Large blackouts in North America: Historical trends and policy implications. Energy Policy 2009, 37, 5249–5259. [Google Scholar] [CrossRef]
- Anderson, C.W.; Santos, J.R.; Haimes, Y.Y. A risk-based input–output methodology for measuring the effects of the August 2003 northeast blackout. Econ. Syst. Res. 2007, 19, 183–204. [Google Scholar] [CrossRef]
- Joo, S.K.; Kim, J.C.; Liu, C.C. Empirical analysis of the impact of 2003 blackout on security values of US utilities and electrical equipment manufacturing firms. IEEE Trans. Power Syst. 2007, 22, 1012–1018. [Google Scholar] [CrossRef]
- Yamashita, K.; Joo, S.K.; Li, J.; Zhang, P.; Liu, C.C. Analysis, control, and economic impact assessment of major blackout events. Eur. Trans. Electr. Power 2008, 18, 854–871. [Google Scholar] [CrossRef]
- Attia, A.M.; Aziz, N.; Friedman, B.A. The impact of social networks on behavioral change: A conceptual framework. World Rev. Bus. Res. 2012, 2, 91–108. [Google Scholar]
- Corwin, J.L.; Miles, W.T. Impact Assessment of the 1977 New York City Blackout; Technical Report; System Control, Inc.: Arlington, VA, USA, 1978. [Google Scholar]
- Vogel, C. Business and climate change: Initial explorations in South Africa. Clim. Dev. 2009, 1, 82–97. [Google Scholar] [CrossRef]
- Adibi, M.; Martins, N. Impact of power system blackouts. In Proceedings of the 2015 IEEE Power & Energy Society General Meeting, Denver, CO, USA, 26–30 July 2015; pp. 1–15. [Google Scholar]
- Rose, A.; Oladosu, G.; Liao, S.Y. Regional economic impacts of terrorist attacks on the electric power system of Los Angeles: A computable general disequilibrium analysis. In Proceedings of the Second Annual Symposium of the DHS Center for Risk and Economic Analysis of Terrorism Events, USC, Los Angeles, CA, USA, 17–18 August 2005. [Google Scholar]
- Von Ketelhodt, A.; Wöcke, A. The impact of electricity crises on the consumption behaviour of small and medium enterprises. J. Energy South. Afr. 2008, 19, 4–12. [Google Scholar]
- Yin, Y.H.; Guo, J.B.; Zhao, J.J.; BU, G.Q. Preliminary analysis of large scale blackout in interconnected North America power grid on August 14 and lessons to be drawn. Power Syst. Technol. 2003, 10, 1. [Google Scholar]
- Posthumus, H.; Morris, J.; Hess, T.; Neville, D.; Phillips, E.; Baylis, A. Impacts of the summer 2007 floods on agriculture in England. J. Flood Risk Manag. 2009, 2, 182–189. [Google Scholar] [CrossRef]
- Kezunovic, M.; Dobson, I.; Dong, Y. Impact of extreme weather on power system blackouts and forced outages: New challenges. In Proceedings of the 7th Balkan Power Conference, Šibenik, Croatia, 10–12 September 2008. [Google Scholar]
- Boqiang, L. Power Sector Development in PRC: Impact of Tariff Increase and Blackout. Econ. Res. J. 2006, 5, 11. [Google Scholar]
- Taylor, C.W. Power System Voltage Stability; McGraw-Hill: New York, NY, USA, 1994. [Google Scholar]
- Shahidehpour, M.; Tinney, W.F.; Fu, Y. Impact of security on power systems operation. Proc. IEEE 2005, 93, 2013–2025. [Google Scholar] [CrossRef]
- Mousa, A.M.; Nagpal, M.; Jiao, Z.T. A Blackout caused by Multiple Lightning Strikes to a Lightly-loaded Interconnection Consisting of Three 500 kV Power Lines in a Joint Corridor. In Proceedings of the 2018 34th International Conference on Lightning Protection (ICLP), Rzeszow, Poland, 2–7 September 2018; pp. 1–8. [Google Scholar]
- Wang, H.; Thorp, J.S. Optimal locations for protection system enhancement: A simulation of cascading outages. IEEE Trans. Power Deliv. 2001, 16, 528–533. [Google Scholar] [CrossRef]
- Faza, A. A probabilistic model for estimating the effects of photovoltaic sources on the power systems reliability. Reliab. Eng. Syst. Saf. 2018, 171, 67–77. [Google Scholar] [CrossRef]
- Musharraf, M.; Smith, J.; Khan, F.; Veitch, B.; MacKinnon, S. Incorporating individual differences in human reliability analysis: an extension to the virtual experimental technique. Saf. Sci. 2018, 107, 216–223. [Google Scholar] [CrossRef]
- Hariharan, R.; Rani, P.U.; Kannan, P.M. Sustain the Critical Load in Blackout Using Virtual Instrumentation. In Intelligent and Efficient Electrical Systems; Springer: New York, NY, USA, 2018; pp. 77–88. [Google Scholar]
- Phadke, A.G.; Tianshu, B. Phasor measurement units, WAMS, and their applications in protection and control of power systems. J. Mod. Power Syst. Clean Energy 2018, 6, 619–629. [Google Scholar] [CrossRef]
- Gupta, S.; Kazi, F.; Wagh, S.; Singh, N. Augmenting WAMPAC with machine learning tools for early warning and mitigation of blackout events. Int. J. Hum. Technol. 2018, 1, 83–100. [Google Scholar] [CrossRef]
- Sun, K. WAMS-Based Controlled System Separation to Mitigate Cascading Failures in Smart Grid. In Smart Grid Control; Springer: New York, NY, USA, 2019; pp. 185–195. [Google Scholar]
Figure 1.
The flowchart of the review methodology used.
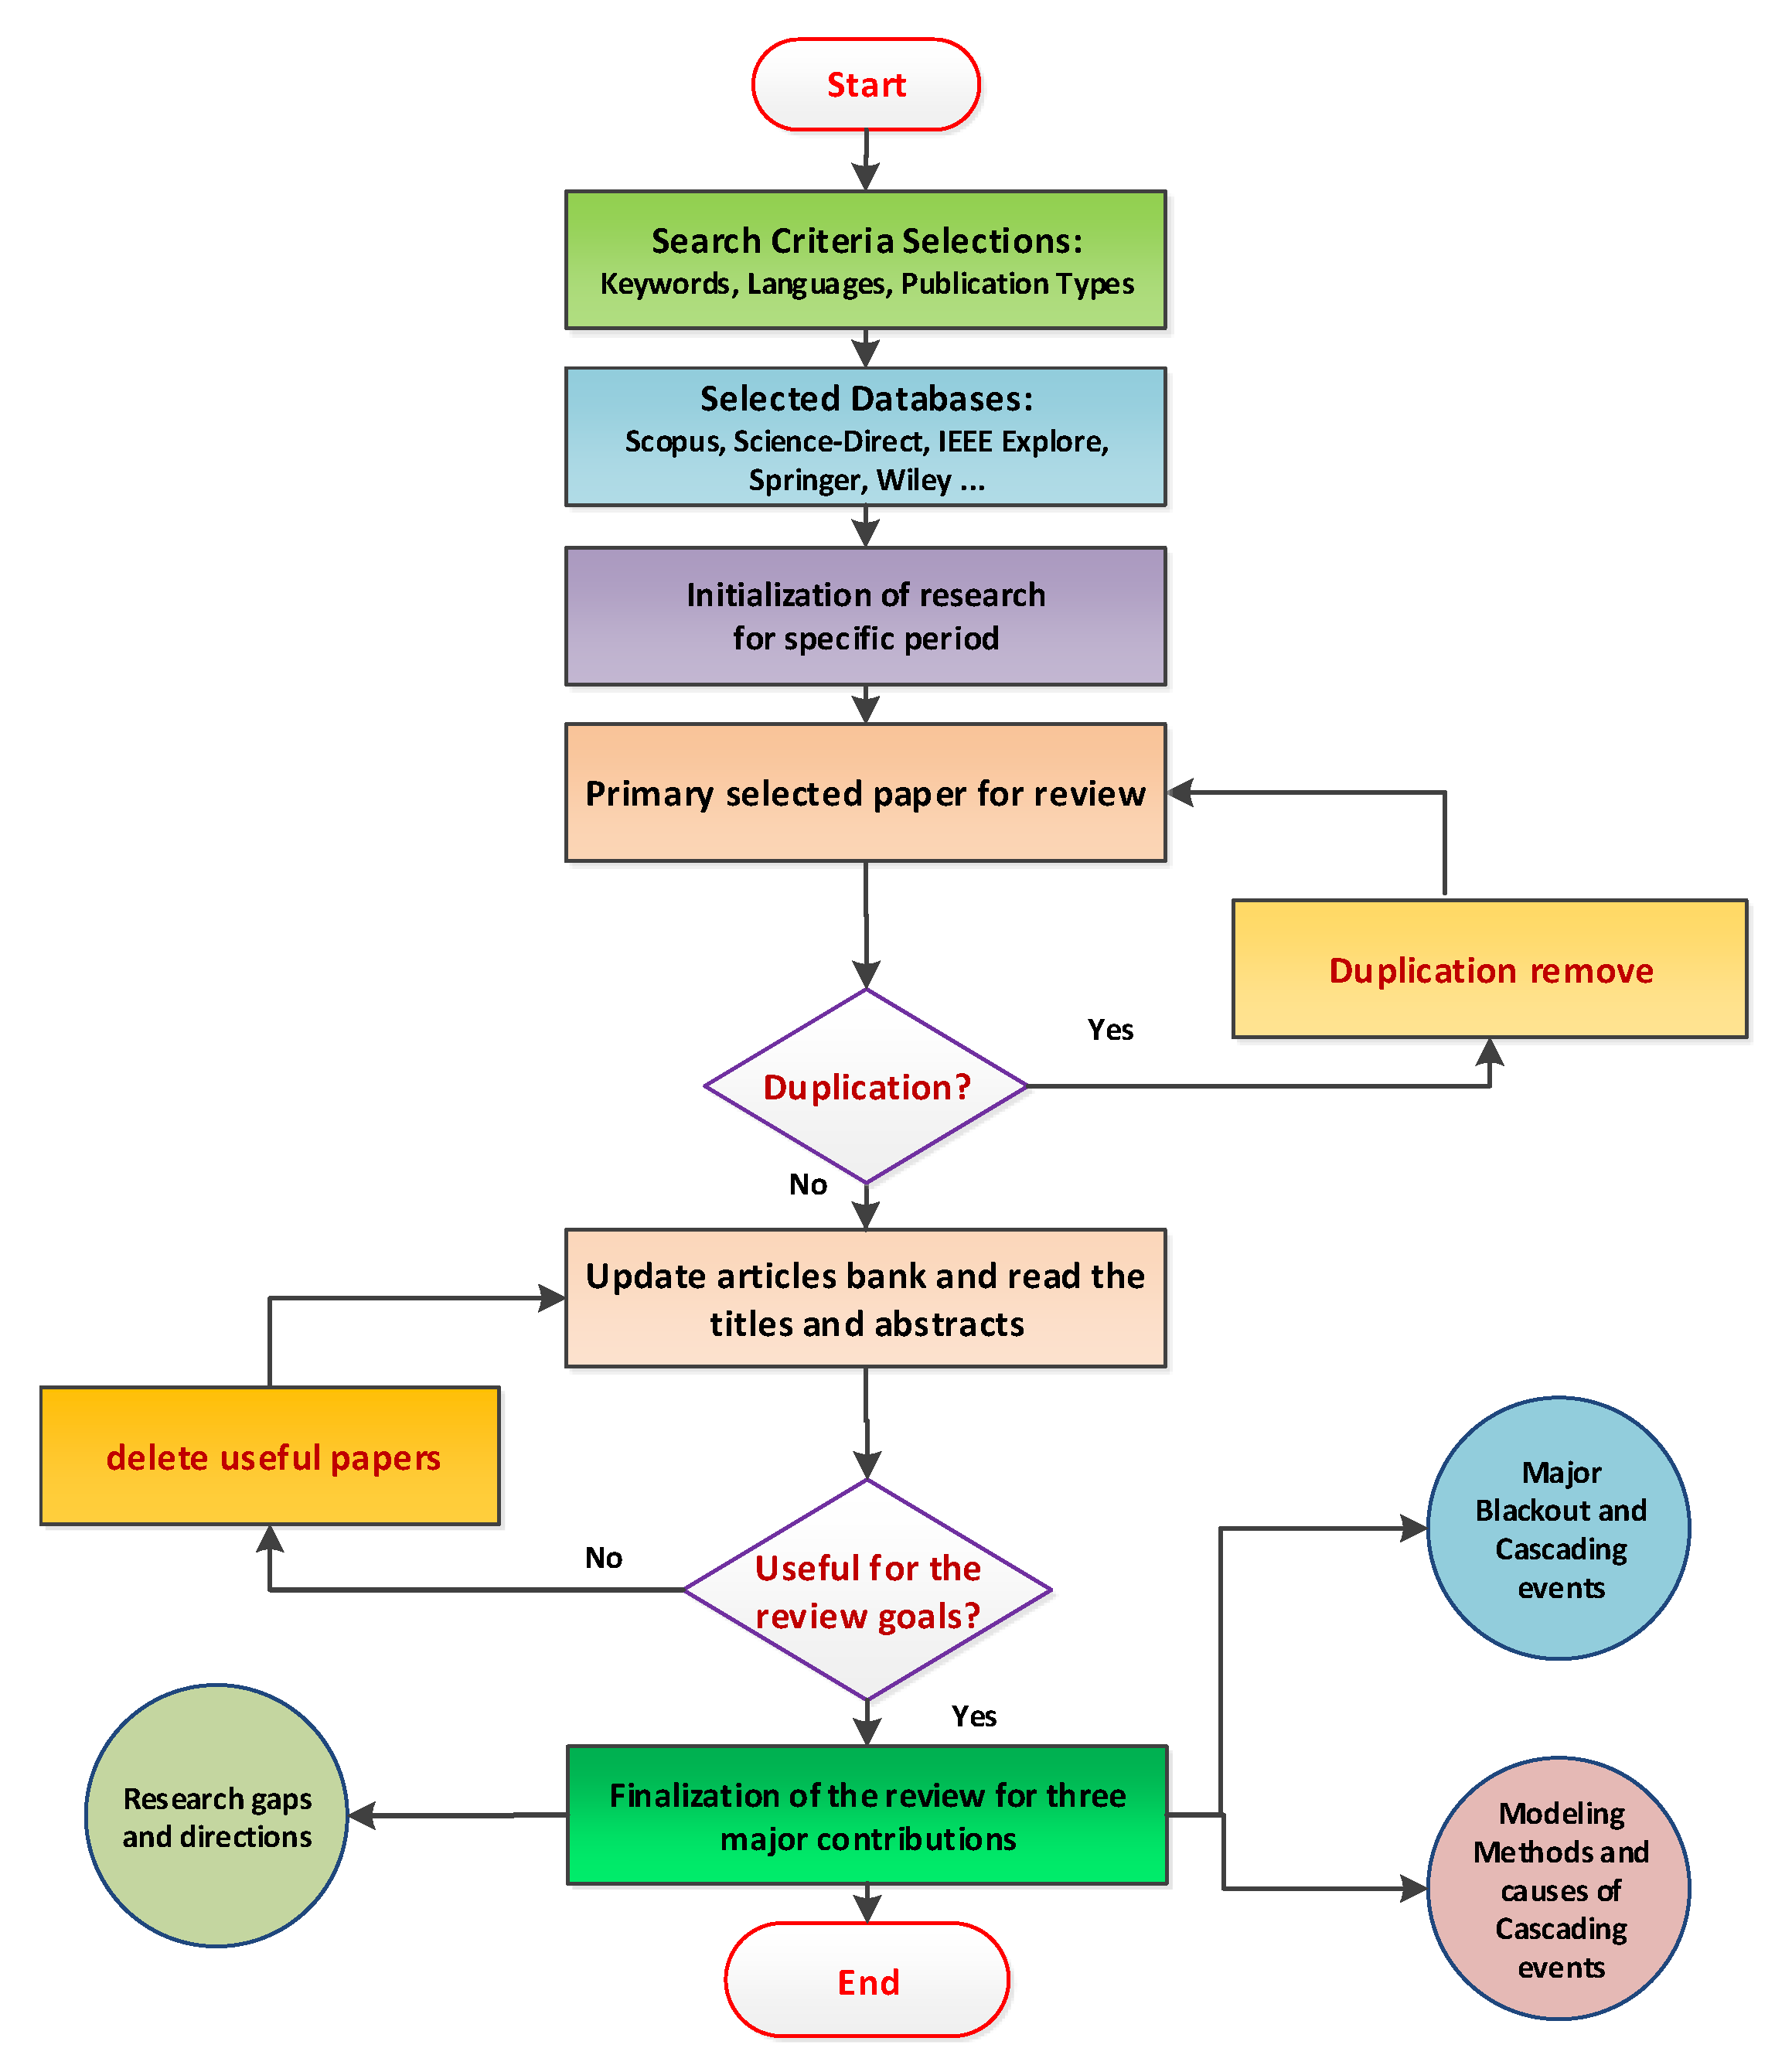
Figure 2.
State-of-the-art flow chart of power systems blackout and cascading events: motivations and challenges.
Figure 2.
State-of-the-art flow chart of power systems blackout and cascading events: motivations and challenges.

Figure 3.
Blackout events in different USA states [54].
Figure 3.
Blackout events in different USA states [54].
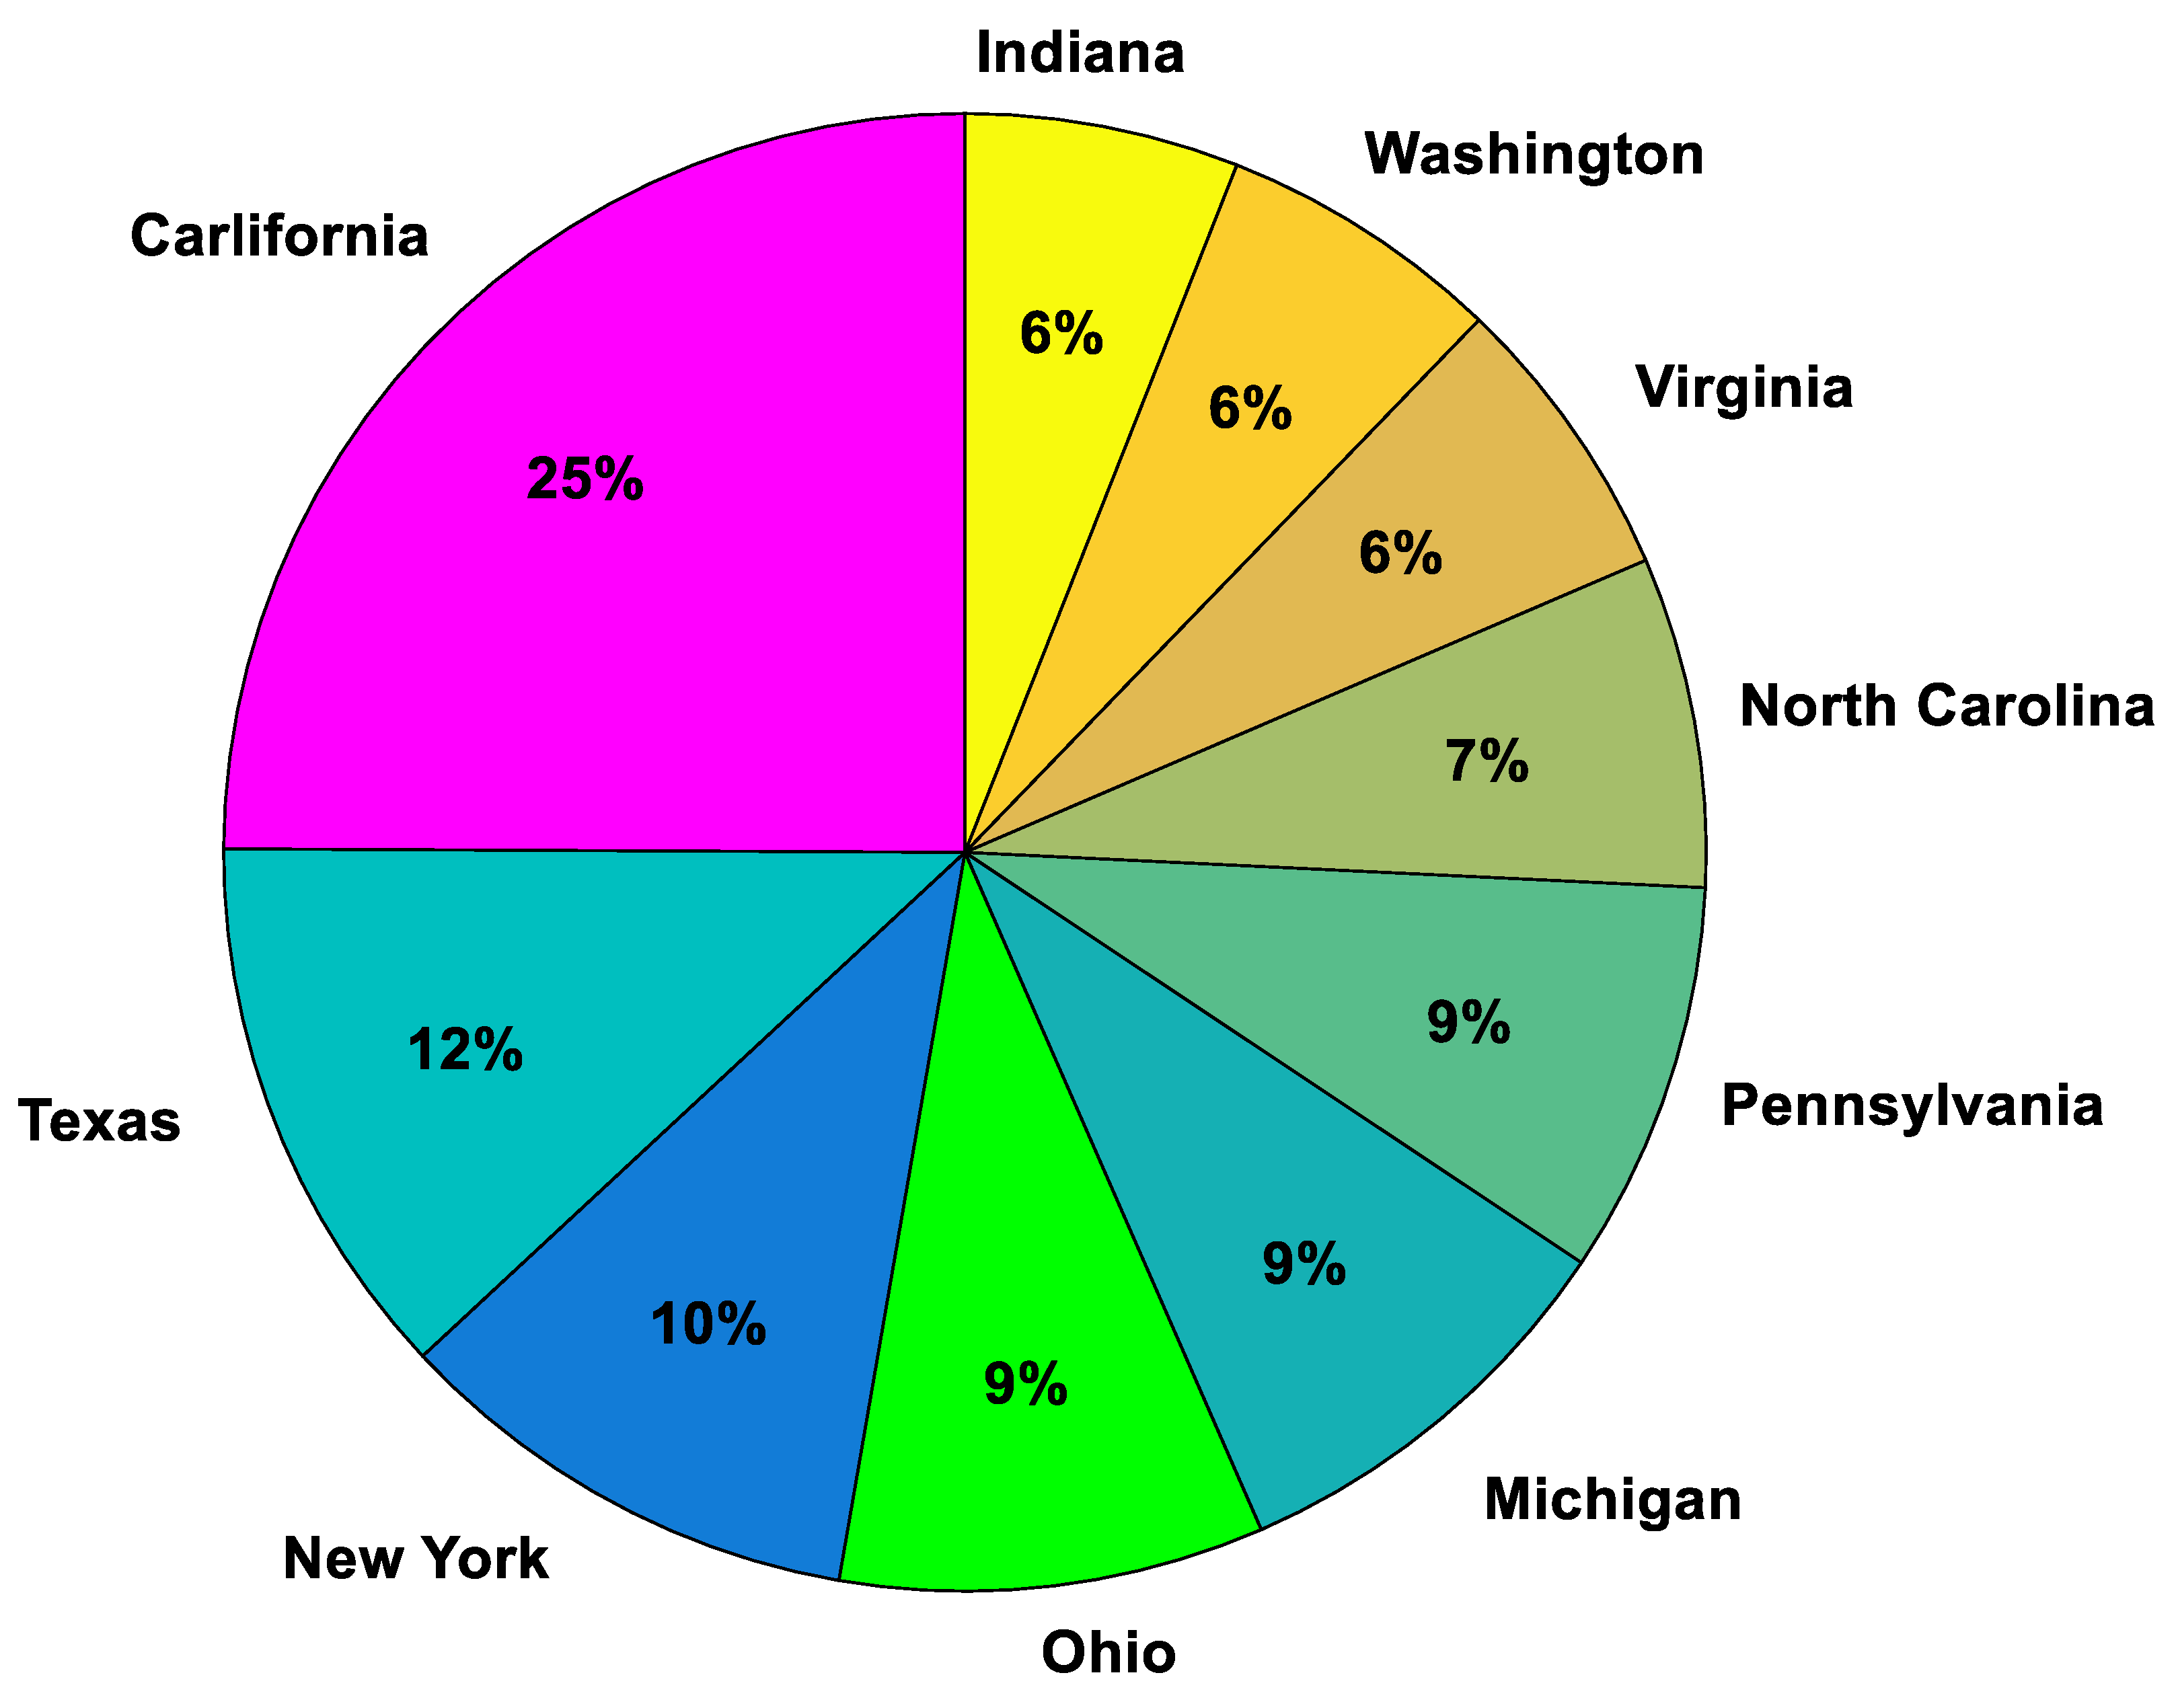

Figure 5.
Major electric power system blackout causes.
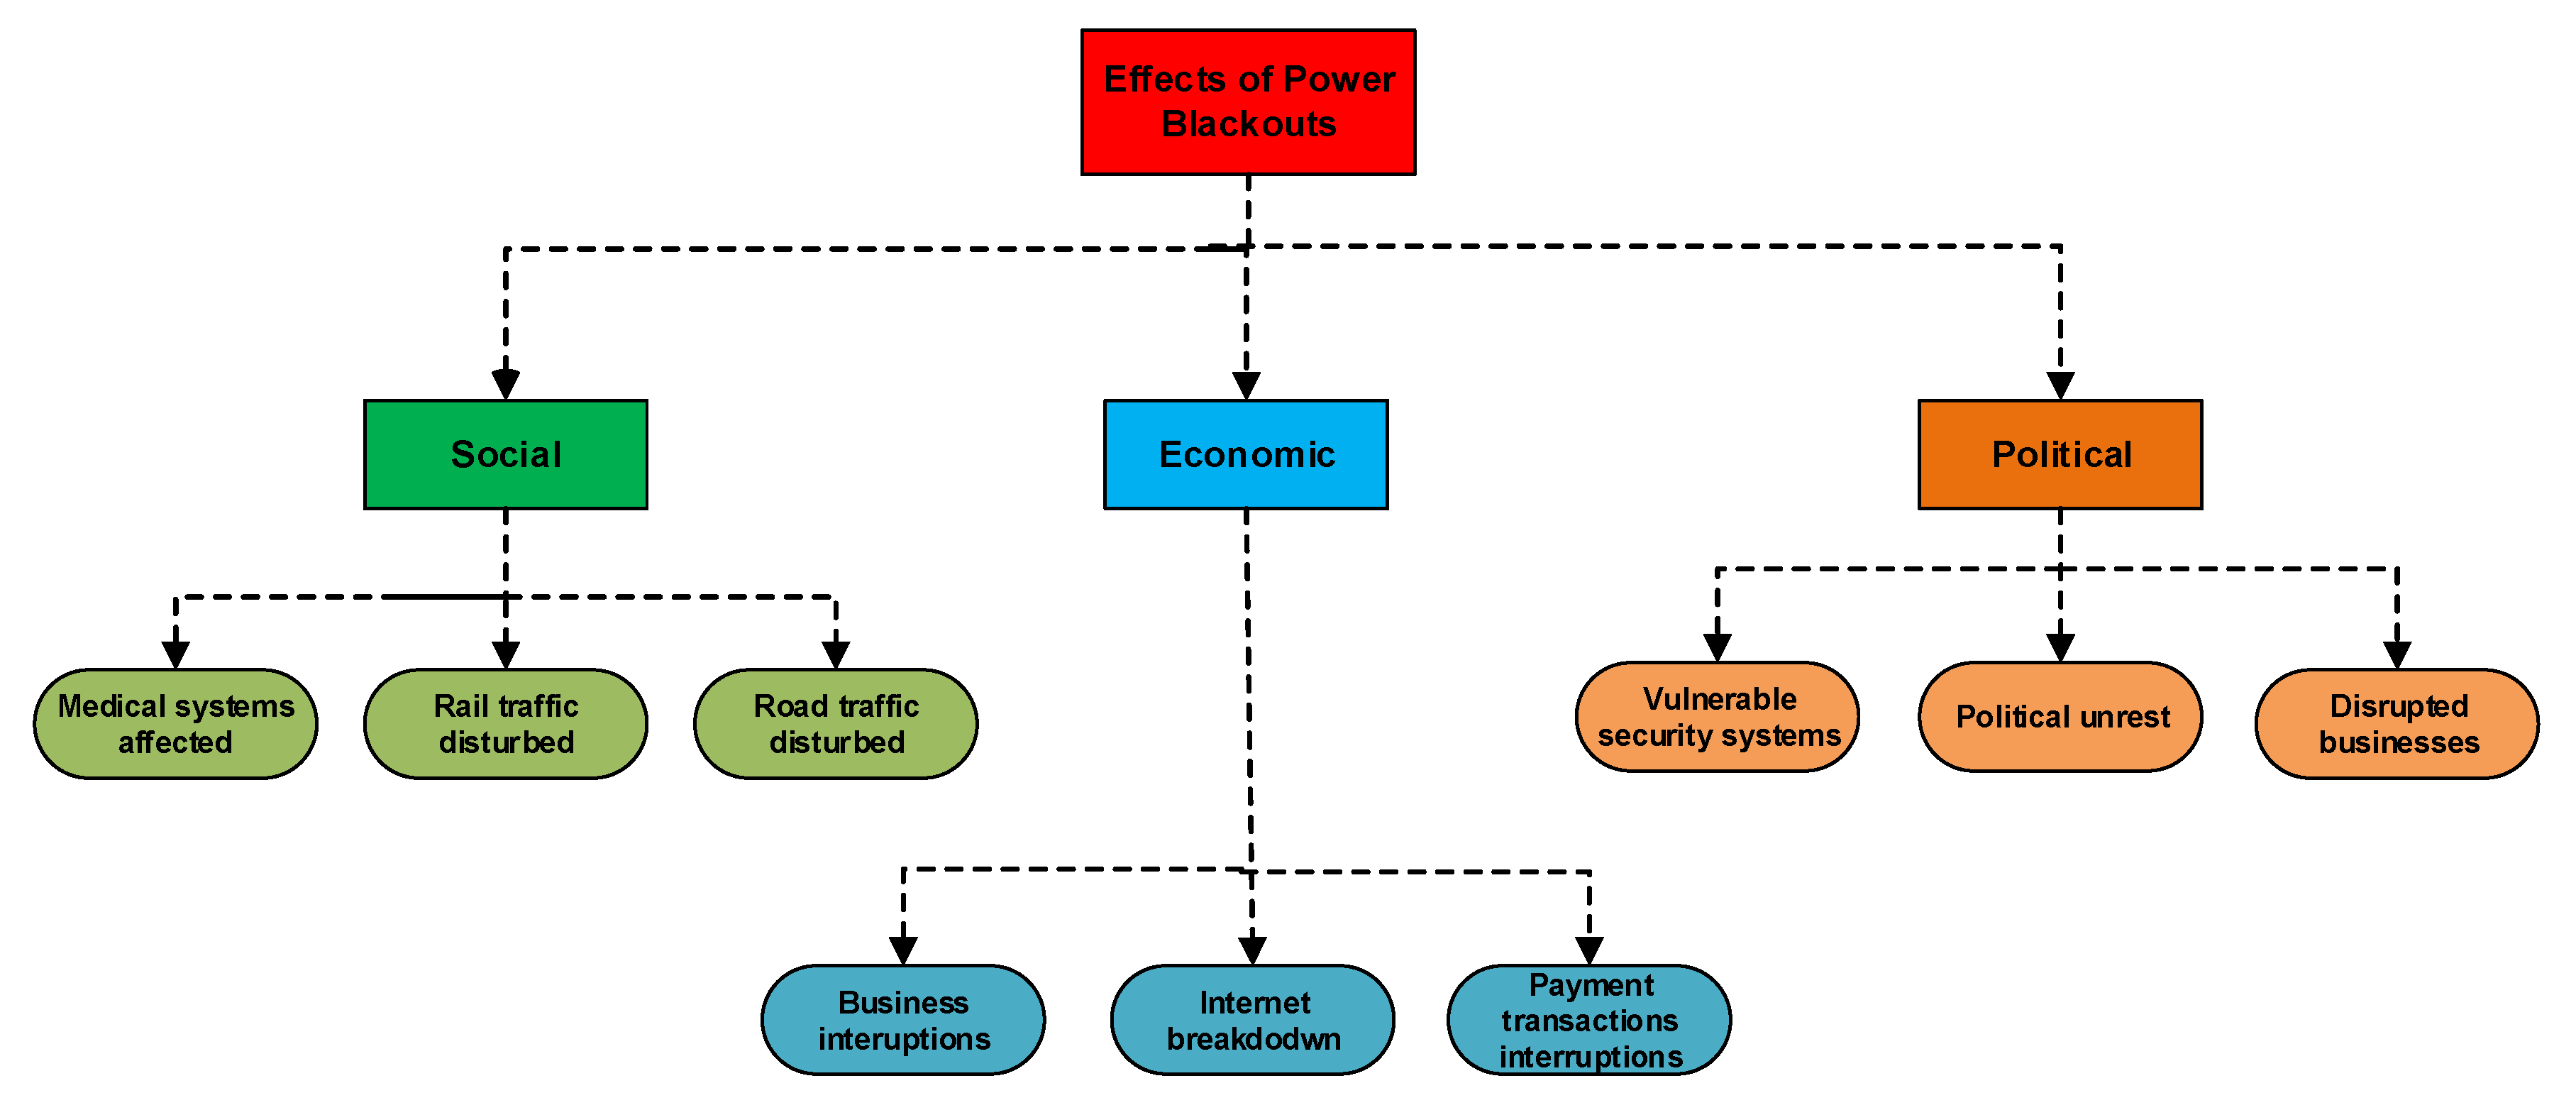

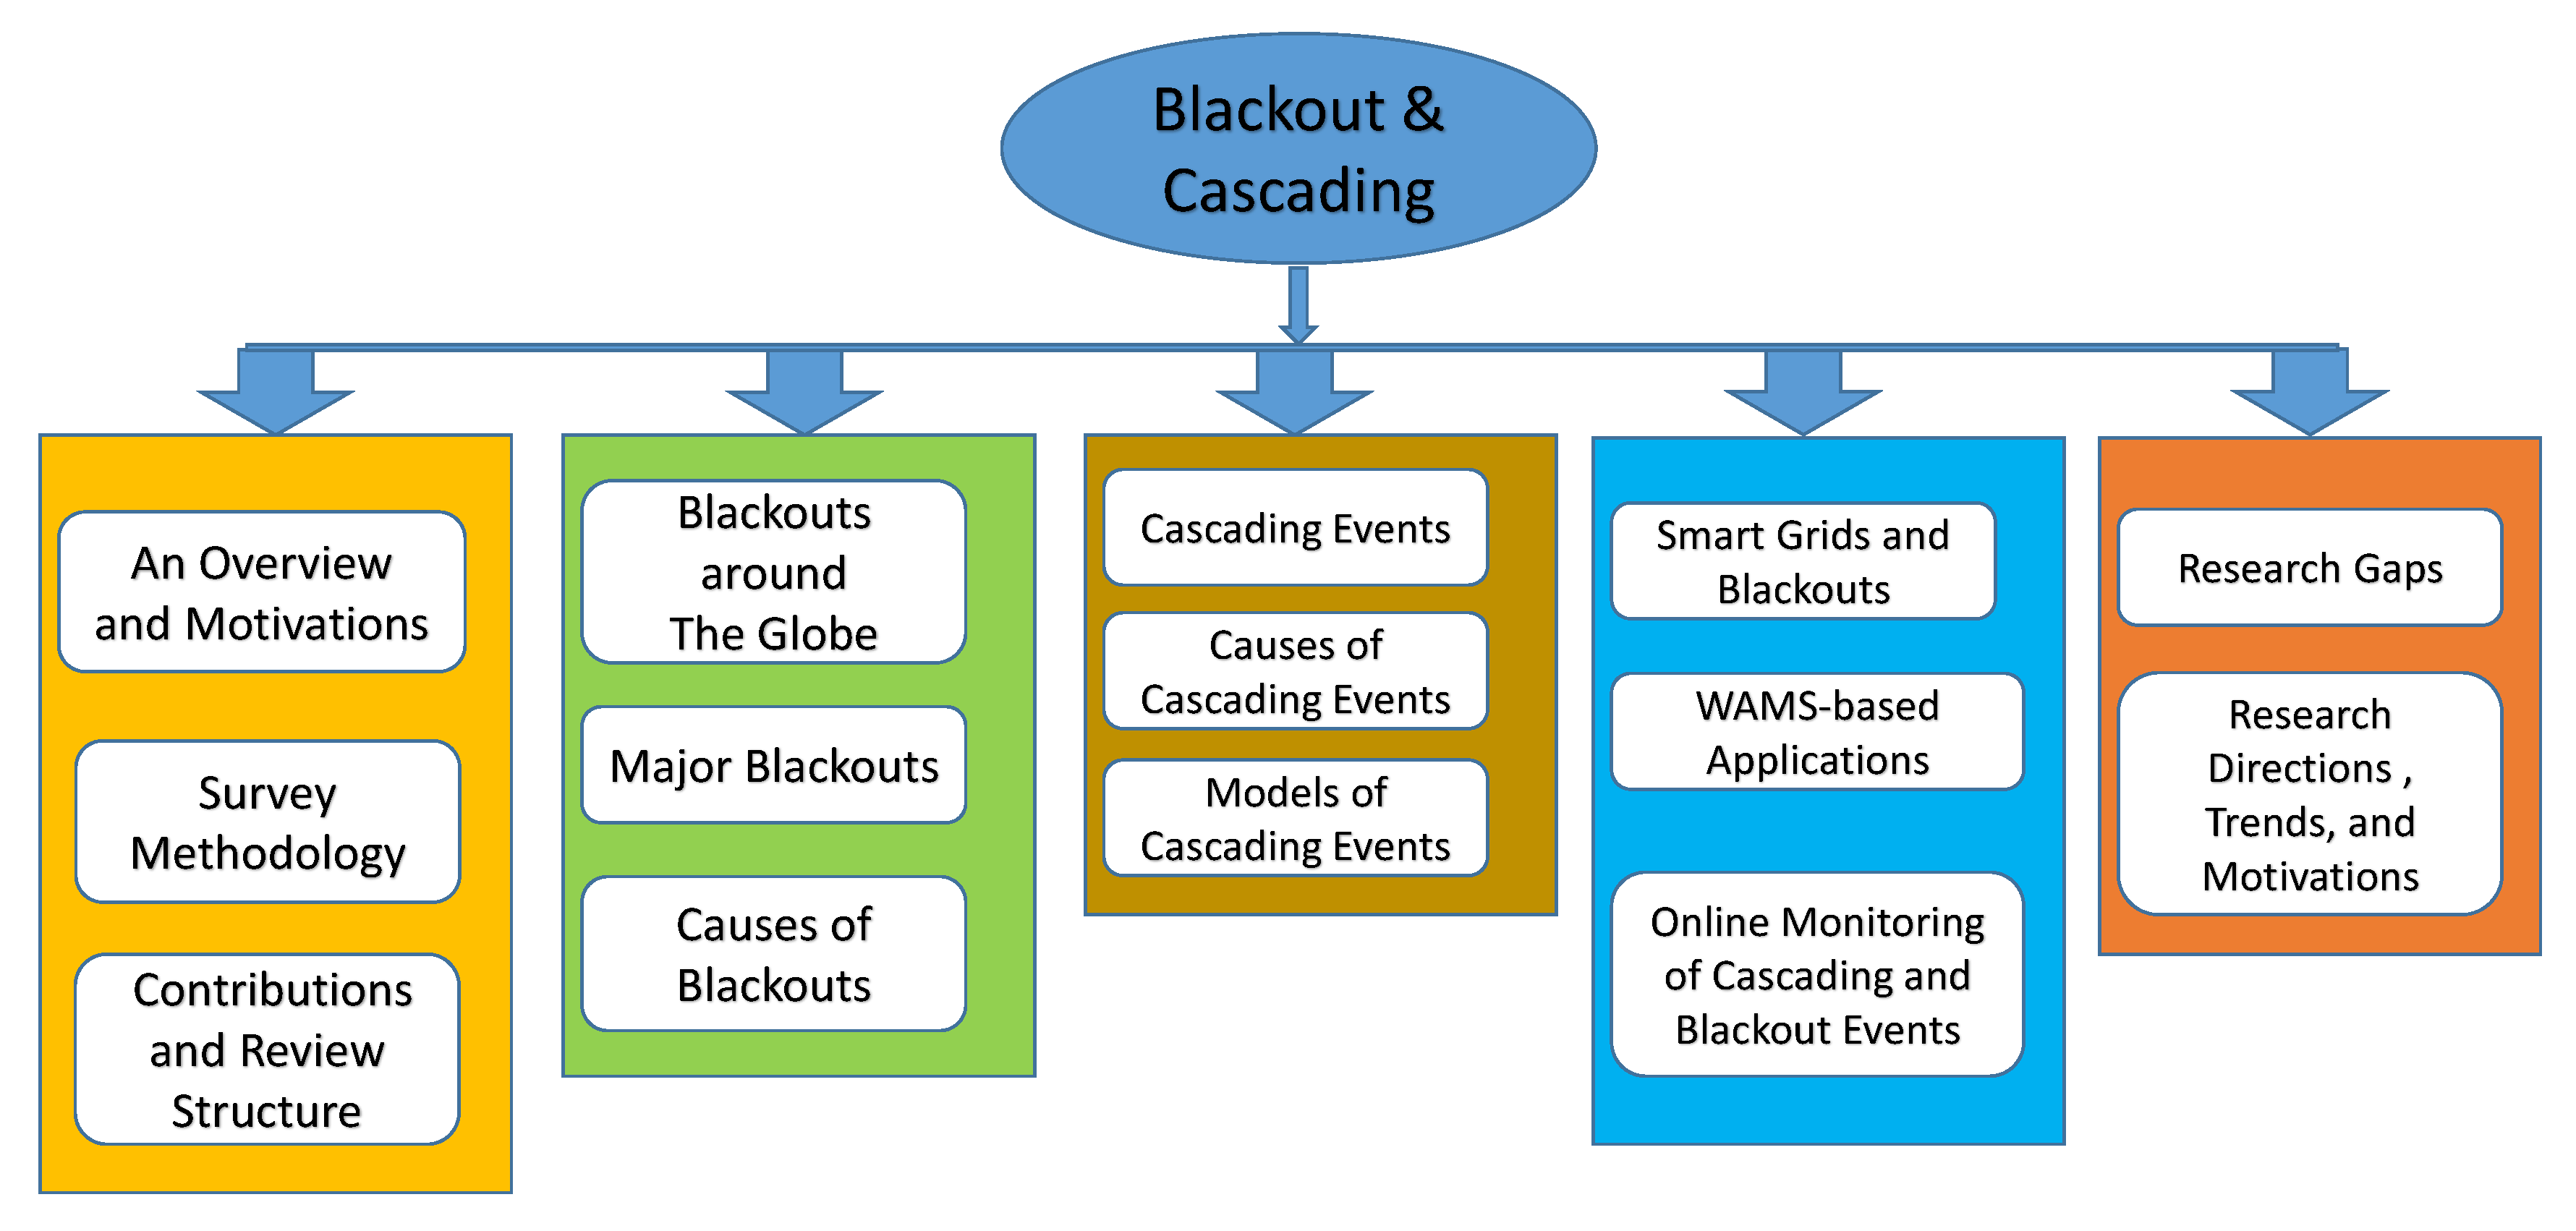
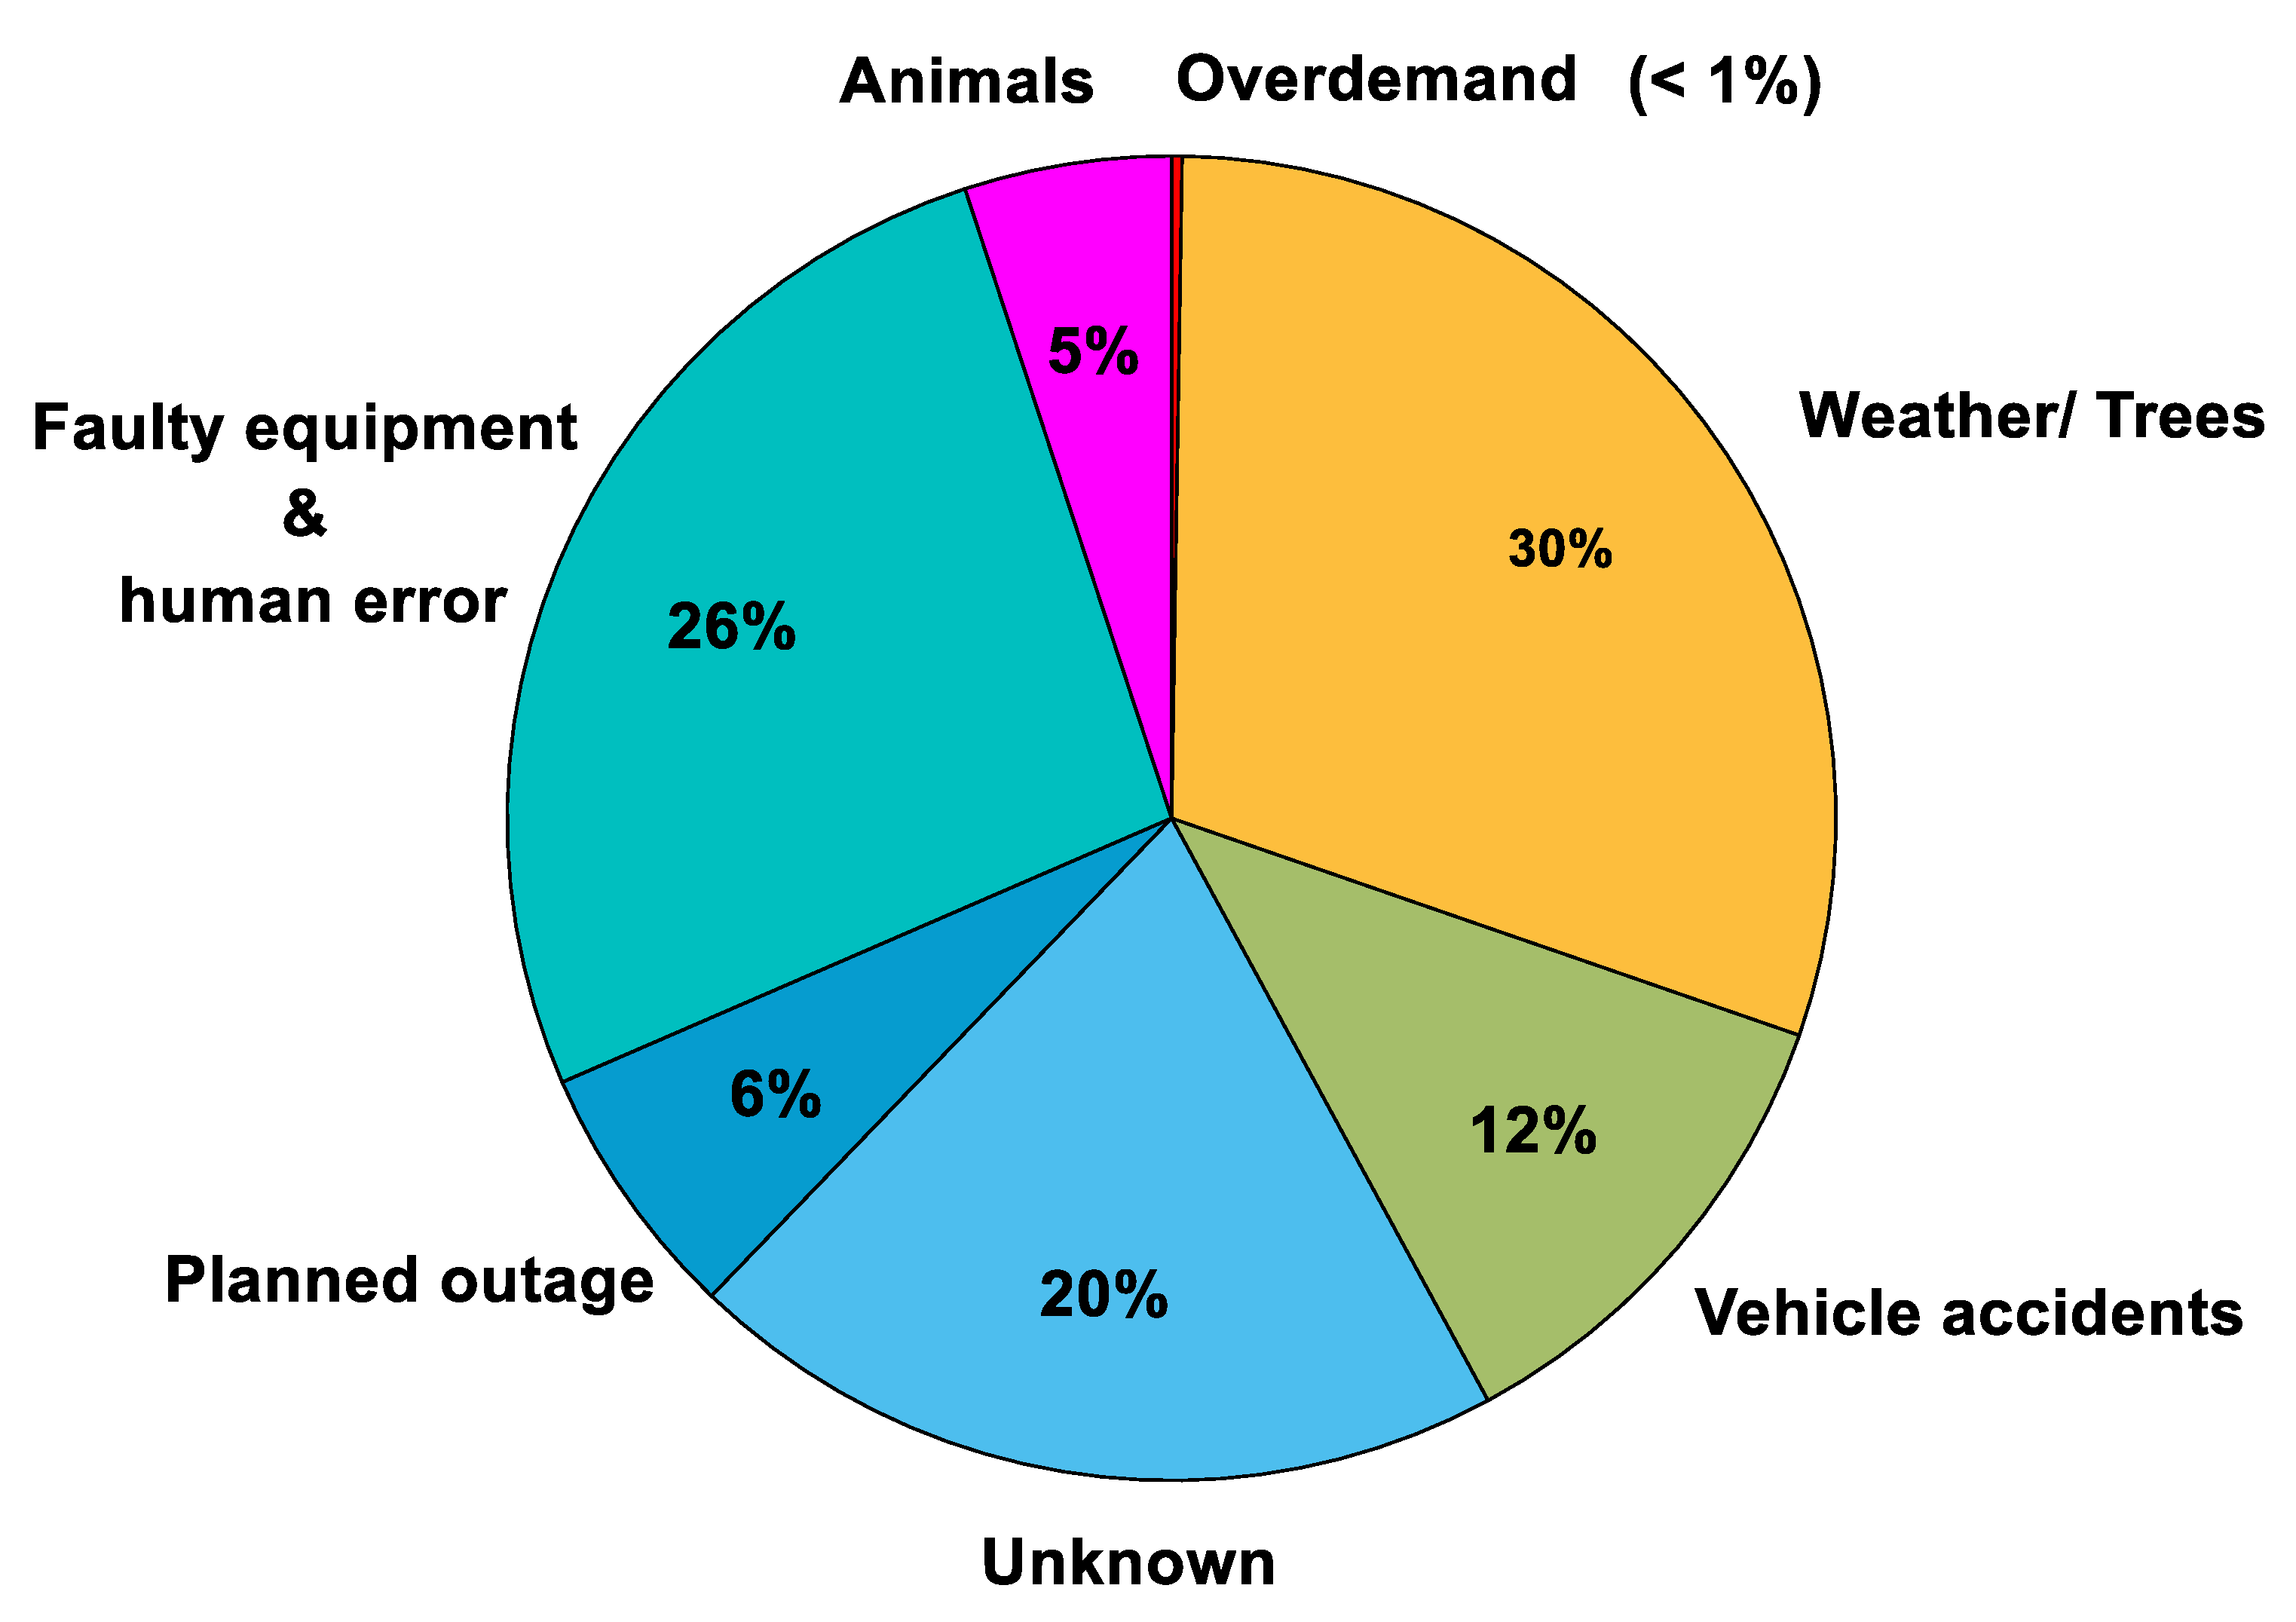
Table 1.
Terms and searched databases used in the review methodology.
| Issue | Criterion |
|---|---|
| Sector | Electric Power System (EPS) |
| General Topic | Power system contingency, security and protection |
| Discipline | Power system failure and disturbances |
| Very specific topic | Blackout & Cascading Events |
| Keywords I | Power system emergency, power system security, power system stability |
| Keywords II | Blackout, power outages, power cuts, cascading events |
| Language | English (En) |
| Availability | Online available only |
| Databases | IEEE, MDPI, Scopus, ScienceDirect, Springer, Wiley, and Taylor and Francis |
| Publication type | Research articles, Books, Conference papers and Standards |
Table 2.
Analysis on the literature used in the review.
| Issue | Number | Percentage |
|---|---|---|
| Articles | 101 | 78.29 |
| Conference papers | 54 | 13.17 |
| Standards | 8 | 6.24 |
| Books and book chapters | 3 | 2.3 |
Table 3.
Number of power outages recorded in different parts of world in 2011 [55].
Table 3.
Number of power outages recorded in different parts of world in 2011 [55].
| Region | Number of Power Outages | Duration of Each Power Outage (hours) |
|---|---|---|
| East Asia and Pacific | 200 | 6.00 |
| Eastern Europe and Central Asia | 100 | 6.50 |
| Latin America and Caribbean | 40 | 8.00 |
| Middle East & North Africa | 50 | 4.00 |
| South Asia | 1200 | 2.50 |
| Sub Saharan Africa | 210 | 7.50 |
| The rest of the countries | 250 | 5.00 |
| Year | Total Number of Outages | People Affected (million) |
|---|---|---|
| 2008 | 2169 | 25.8 |
| 2009 | 2840 | 13.5 |
| 2010 | 3149 | 17.5 |
| 2011 | 3071 | 41.8 |
| 2012 | 2808 | 25.0 |
| 2013 | 3236 | 14.0 |
| 2014 | 3634 | 14.2 |
| 2015 | 3571 | 13.2 |
| Issue | Criterion |
|---|---|
| Total number of people affected by outages | 13,263,473 |
| Total duration of outages | 175,821 min |
| Total number of outages | 3571 |
| Average number of people affected per outage | 3714 |
| Average duration of outage | 49 min |
Table 6.
A summary of recorded major (most severe) power outages around the globe in this decade.
| References | Country/Region | Date | Duration (hours) | Affected People (million) | Causes |
|---|---|---|---|---|---|
| [35,36] | Mexico & the USA | 8 September 2011 | 12 | 2.7 | Transmission line tripping |
| [38,83] | Brazil | 4 February 2011 | 16 | 53 | Transmission line fault and fluctuated power flow |
| [41,42,43] | India | 30 July 2012 | 15 | 620 | Transmission line overload |
| [44] | Vietnam | 22 May 2013 | 10 | 10 | Crane operator |
| [45,86] | Philippines | 6 August 2013 | 12 | 8 | Voltage collapse |
| [44,46] | Thailand | 2013 | 10 | 8 | Lightning strike |
| [47] | Bangladesh | 1 November 2014 | 24 | 150 | HVDC station outage |
| [49,50] | Pakistan | 26 January 2015 | 2 | 140 | Plant technical fault |
| [39] | Holland | 27 March 2015 | 1.5 | 1 | Bad weather conditions |
| [51,87] | Turkey | 31 March 2015 | 4 | 70 | Power system failure |
| [88,89] | Ukraine | 21 November 2015 | 6 | 1.2 | Power system failure |
| [88,90,91] | Ukraine | 23 December 2015 | 6 | 230 | Cyber-attack |
| [52,53] | Kenya | 7 June 2016 | 4 | 10 | Animal shorted the transformer |
| [92,93,94] | Sri Lanka | 3 March 2016 | 16 | 10 | A severe thunderstorm |
| [95,96,97,98,99] | South Australia | 28 September 2016 | 6.1 | 1.7 | Storm damage to transmission infrastructure & cascading events |
| [57,100] | the US (NY) | 1 March 2017 | 11 | 21 | Cascading failure in transmission system |
| [101] | Uruguay | 26 August 2017 | 4 | 3.4 | Bad weather conditions lead to cascading failures |
| [57,102] | US (southeast) | 10 September 2017 | 5 | 7.6 | Cascading events and transmission tripping |
| [103,104,105,106] | Sudan | 10 January 2018 | 24 | 41.5 | Cascading failures |
| [107,108,109] | Azerbaijan | 3 July 2018 | 8 | 8 | Unexpectedly high temperatures |
| [81,82,83,110] | Brazil | 21 March 2018 | 1 | 10 | Transmission line failure |
| [78,111] | Canada (BC) | 20 December 2018 | 4 | 0.6 | Winds reached speeds of 100 km/h |
Table 7.
Analysis on blackouts around the globe and their percentage from 2011 to 2019.
| Blackout Cause | Number Recorded | % of the Recorded Number |
|---|---|---|
| Weather/Trees | 33 | 50 |
| Faulty equipment or human error | 21 | 31.8 |
| Vehicle/Accidents | 7 | 10.6 |
| Animals | 1 | 1.5 |
| Over demand | 4 | 6.1 |
| Total | 66 | 100 |
Table 8.
An overview of the initial disturbances and the cascading events led to the major blackouts around the globe.
Table 8.
An overview of the initial disturbances and the cascading events led to the major blackouts around the globe.
| References | Blackout | Initial Cause | Cascading Events |
|---|---|---|---|
| [61,62] | the US & Canada (2003) | East lake Generator tripping due to incorrect data from monitoring system | i—Transmission line trips after contact with a tree ii—Alarm system failure iii—345 kV Chamberli-Harding linie sags on to a tree and trips iv—Voltage dips and no AVR action v—Successive line trip due to under voltage |
| [64,69] | Sweden–Denmark (2003) | 1200 MW Nuclear power plant trips due to problems with steam valve | i— A double bus-bar fault on one of the substations ii—Transmission line tripping due to overload iii—Generator tripping due to under frequency iv—400 kV north-south interconnecting transmission line trips |
| [72,73] | Italy (September 2003) | Tree flashover caused the tripping of a major transmission line | i—Automatic breaker failed to re-close due to synchronization problems ii—380 kV transmission line failure due to delayed re-dispatch of power iii—Loss of synchronism with the other parts of Europe iv—Frequency fell to 49 Hz and then to 47.5 in 2.5 min and generators tripped |
| [41,42,43] | India (July 2012) | Circuit breaker on 400 kV Bina-Gwalior tripped | i—Tripping of Agra Bareilly breakers ii—Power failure cascading through the grid due to under voltage iii—The following day a relay failure occurred near Taj Mahal iv—Power stations across affected parts went offline |
| [44,46] | Thailand (2013) | Failure in major AC tie-line | i—A 500 MW power station was interrupted ii—Major tie line for power distribution was affected iii—Further system generator tripped on under voltage and frequency |
| [47] | BPS (November 2014) | HVDC lines outage | i—Insufficient load shedding ii—Subsequent generator tripping on overload iii—Transmission lines disconnection due to under voltage |
| [52,53] | Kenya (June 2016) | Monkey led to tripping of the transformer | i—Generators at the plant tripped on overload ii—180 MW lost from Gitaru iii—Voltage drop led to subsequent transmissions tripping |
© 2019 by the authors. Licensee MDPI, Basel, Switzerland. This article is an open access article distributed under the terms and conditions of the Creative Commons Attribution (CC BY) license (http://creativecommons.org/licenses/by/4.0/).
Share and Cite
MDPI and ACS Style
Haes Alhelou, H.; Hamedani-Golshan, M.E.; Njenda, T.C.; Siano, P. A Survey on Power System Blackout and Cascading Events: Research Motivations and Challenges. Energies 2019, 12, 682. https://doi.org/10.3390/en12040682
AMA Style
Haes Alhelou H, Hamedani-Golshan ME, Njenda TC, Siano P. A Survey on Power System Blackout and Cascading Events: Research Motivations and Challenges. Energies. 2019; 12(4):682. https://doi.org/10.3390/en12040682
Chicago/Turabian StyleHaes Alhelou, Hassan, Mohamad Esmail Hamedani-Golshan, Takawira Cuthbert Njenda, and Pierluigi Siano. 2019. "A Survey on Power System Blackout and Cascading Events: Research Motivations and Challenges" Energies 12, no. 4: 682. https://doi.org/10.3390/en12040682
Note that from the first issue of 2016, this journal uses article numbers instead of page numbers. See further details here.