Article

From Early Contraction to Post-Folding Fluid Evolution in the Frontal Part of the Bóixols Thrust Sheet (Southern Pyrenees) as Revealed by the Texture and Geochemistry of Calcite Cements

by
Nicholas Nardini
1,
Daniel Muñoz-López
1,*,
David Cruset
1,
Irene Cantarero
1,
Juan Diego Martín-Martín
1,
Antonio Benedicto
2,
Enrique Gomez-Rivas
1,3,
Cédric M. John
4 and
Anna Travé
1
1
Departament de Mineralogia, Petrologia i Geologia Aplicada, Facultat de Ciències de la Terra, Universitat de Barcelona (UB), Martí i Franquès s/n, 08028 Barcelona, Spain
2
UMR Geops, Université Paris Sud, 91405 Orsay, France
3
School of Geosciences, King’s College, University of Aberdeen, Aberdeen AB24 3UE, UK
4
Department of Earth Science and Engineering, Imperial College London, London SW7 2BP, UK
*
Author to whom correspondence should be addressed.
Minerals 2019, 9(2), 117; https://doi.org/10.3390/min9020117
Submission received: 28 December 2018 / Revised: 7 February 2019 / Accepted: 14 February 2019 / Published: 16 February 2019

Abstract

:
Structural, petrological and geochemical (δ13C, δ18O, clumped isotopes, 87Sr/86Sr and ICP-MS) analyses of fracture-related calcite cements and host rocks are used to establish a fluid-flow evolution model for the frontal part of the Bóixols thrust sheet (Southern Pyrenees). Five fracture events associated with the growth of the thrust-related Bóixols anticline and Coll de Nargó syncline during the Alpine orogeny are distinguished. These fractures were cemented with four generations of calcite cements, revealing that such structures allowed the migration of different marine and meteoric fluids through time. During the early contraction stage, Lower Cretaceous seawater circulated and precipitated calcite cement Cc1, whereas during the main folding stage, the system opened to meteoric waters, which mixed with the connate seawater and precipitated calcite cement Cc2. Afterwards, during the post-folding stages, connate evaporated marine fluids circulated through newly formed NW-SE and NE-SW conjugate fractures and later through strike-slip faults and precipitated calcite cements Cc3 and Cc4. The overall paragenetic sequence reveals the progressive dewatering of Cretaceous marine host sediments during progressive burial, deformation and fold tightening and the input of meteoric waters only during the main folding stage. This study illustrates the changes of fracture systems and the associated fluid-flow regimes during the evolution of fault-associated folds during orogenic growth.

1. Introduction

Fluids play an important role on the Earth’s crust as, on one hand, they transport solutes and distribute heat, controlling mineral reactions including precipitation and dissolution [1,2,3,4,5,6,7,8], and on the other hand, they can change the effective stress, favoring the reactivation of existing fractures and the formation of new ones [9,10,11,12].
During the geodynamic evolution of fold and thrust belts and related foreland basins, fluid migration controls diagenetic processes and the propagation of fractures and faults. In turn, the fracture geometry and architecture conditions their role as either conduits or seals for fluids, thus controlling fluid distribution [13,14]. In this geodynamic setting, the fluid sources change with time as foreland basins usually evolve from marine to continental conditions [15,16]. Moreover, thrusts may act also as paths for deep-sourced fluids while fold-associated fractures for low-temperature meteoric fluids [17,18].
Structural analysis of fractures, together with petrographical and geochemical studies of vein calcite cements and their host rocks, allow to assess the interplay between rock deformation and diagenetic reactions, the degree of fluid-rock interaction, the fluid-flow regime during deformation and the relative timing of fluid circulation [18,19,20]. Likewise, the type and origin of fluids can be unraveled [21,22,23], and thus decipher if the fluids that formed the different veins flowed locally in a closed paleohydrogeological regime [24,25,26] or in a relatively open system with possible interaction between fluids from different sources [16,27]. Studies integrating the evolution of fracture systems and related cements are needed to constrain the fluid-flow history of an area during orogenic growth and, therefore, understand the nature and origin of fluids that circulate through time, the diagenetic process evolution, changes in reservoir properties such as porosity and permeability and the distribution of minerals and hydrocarbons [28,29].
During recent years, the interest in this topic has significantly increased [30,31,32,33], giving rise to many new studies that have tackled this topic in compressional, extensional and strike-slip tectonic settings worldwide. Some recent examples are from the Ionian fold and thrust belt in Albania [22,34,35], the Apennines [36,37,38,39,40], the Alps [41,42], the Zagros Mountains [43], the Sicilian belt [44], the Oman Mountains [45,46,47,48], the Catalan Coastal Range [49,50,51,52,53] and the Pyrenees [16,17,19,24,54,55,56,57]. The South Pyrenean fold and thrust belt is well known as an outstanding field analogue for the study of fluid migration during orogenic compression due to the excellent preservation of its sedimentary record, the high-quality exposure of structures and the complex relationships between folding and thrusting and syntectonic sediments [19,58]. This contribution presents a detailed case study of the frontal part of the Bóixols thrust sheet to decipher the fluid-flow regime during the earliest stages of the evolution of the South-Central Pyrenean Unit (Figure 1), as it corresponds to the oldest emplaced thrust sheet in the area. The analyzed structures include the southern limb of the fault-related Bóixols anticline and its associated footwall, the Coll de Nargó syncline. We combine structural field data with the petrological and geochemical study of involved host rocks and fracture-filling cements in order to: (1) constrain the fracture network developed during the tectonic evolution of the study area, (2) characterize the type of fluid system and their origin, their flow pathways and the degree of fluid-rock interaction and, (3) propose a conceptual model that explains the fracture-controlled fluid-flow evolution of the frontal part of the Bóixols thrust sheet.

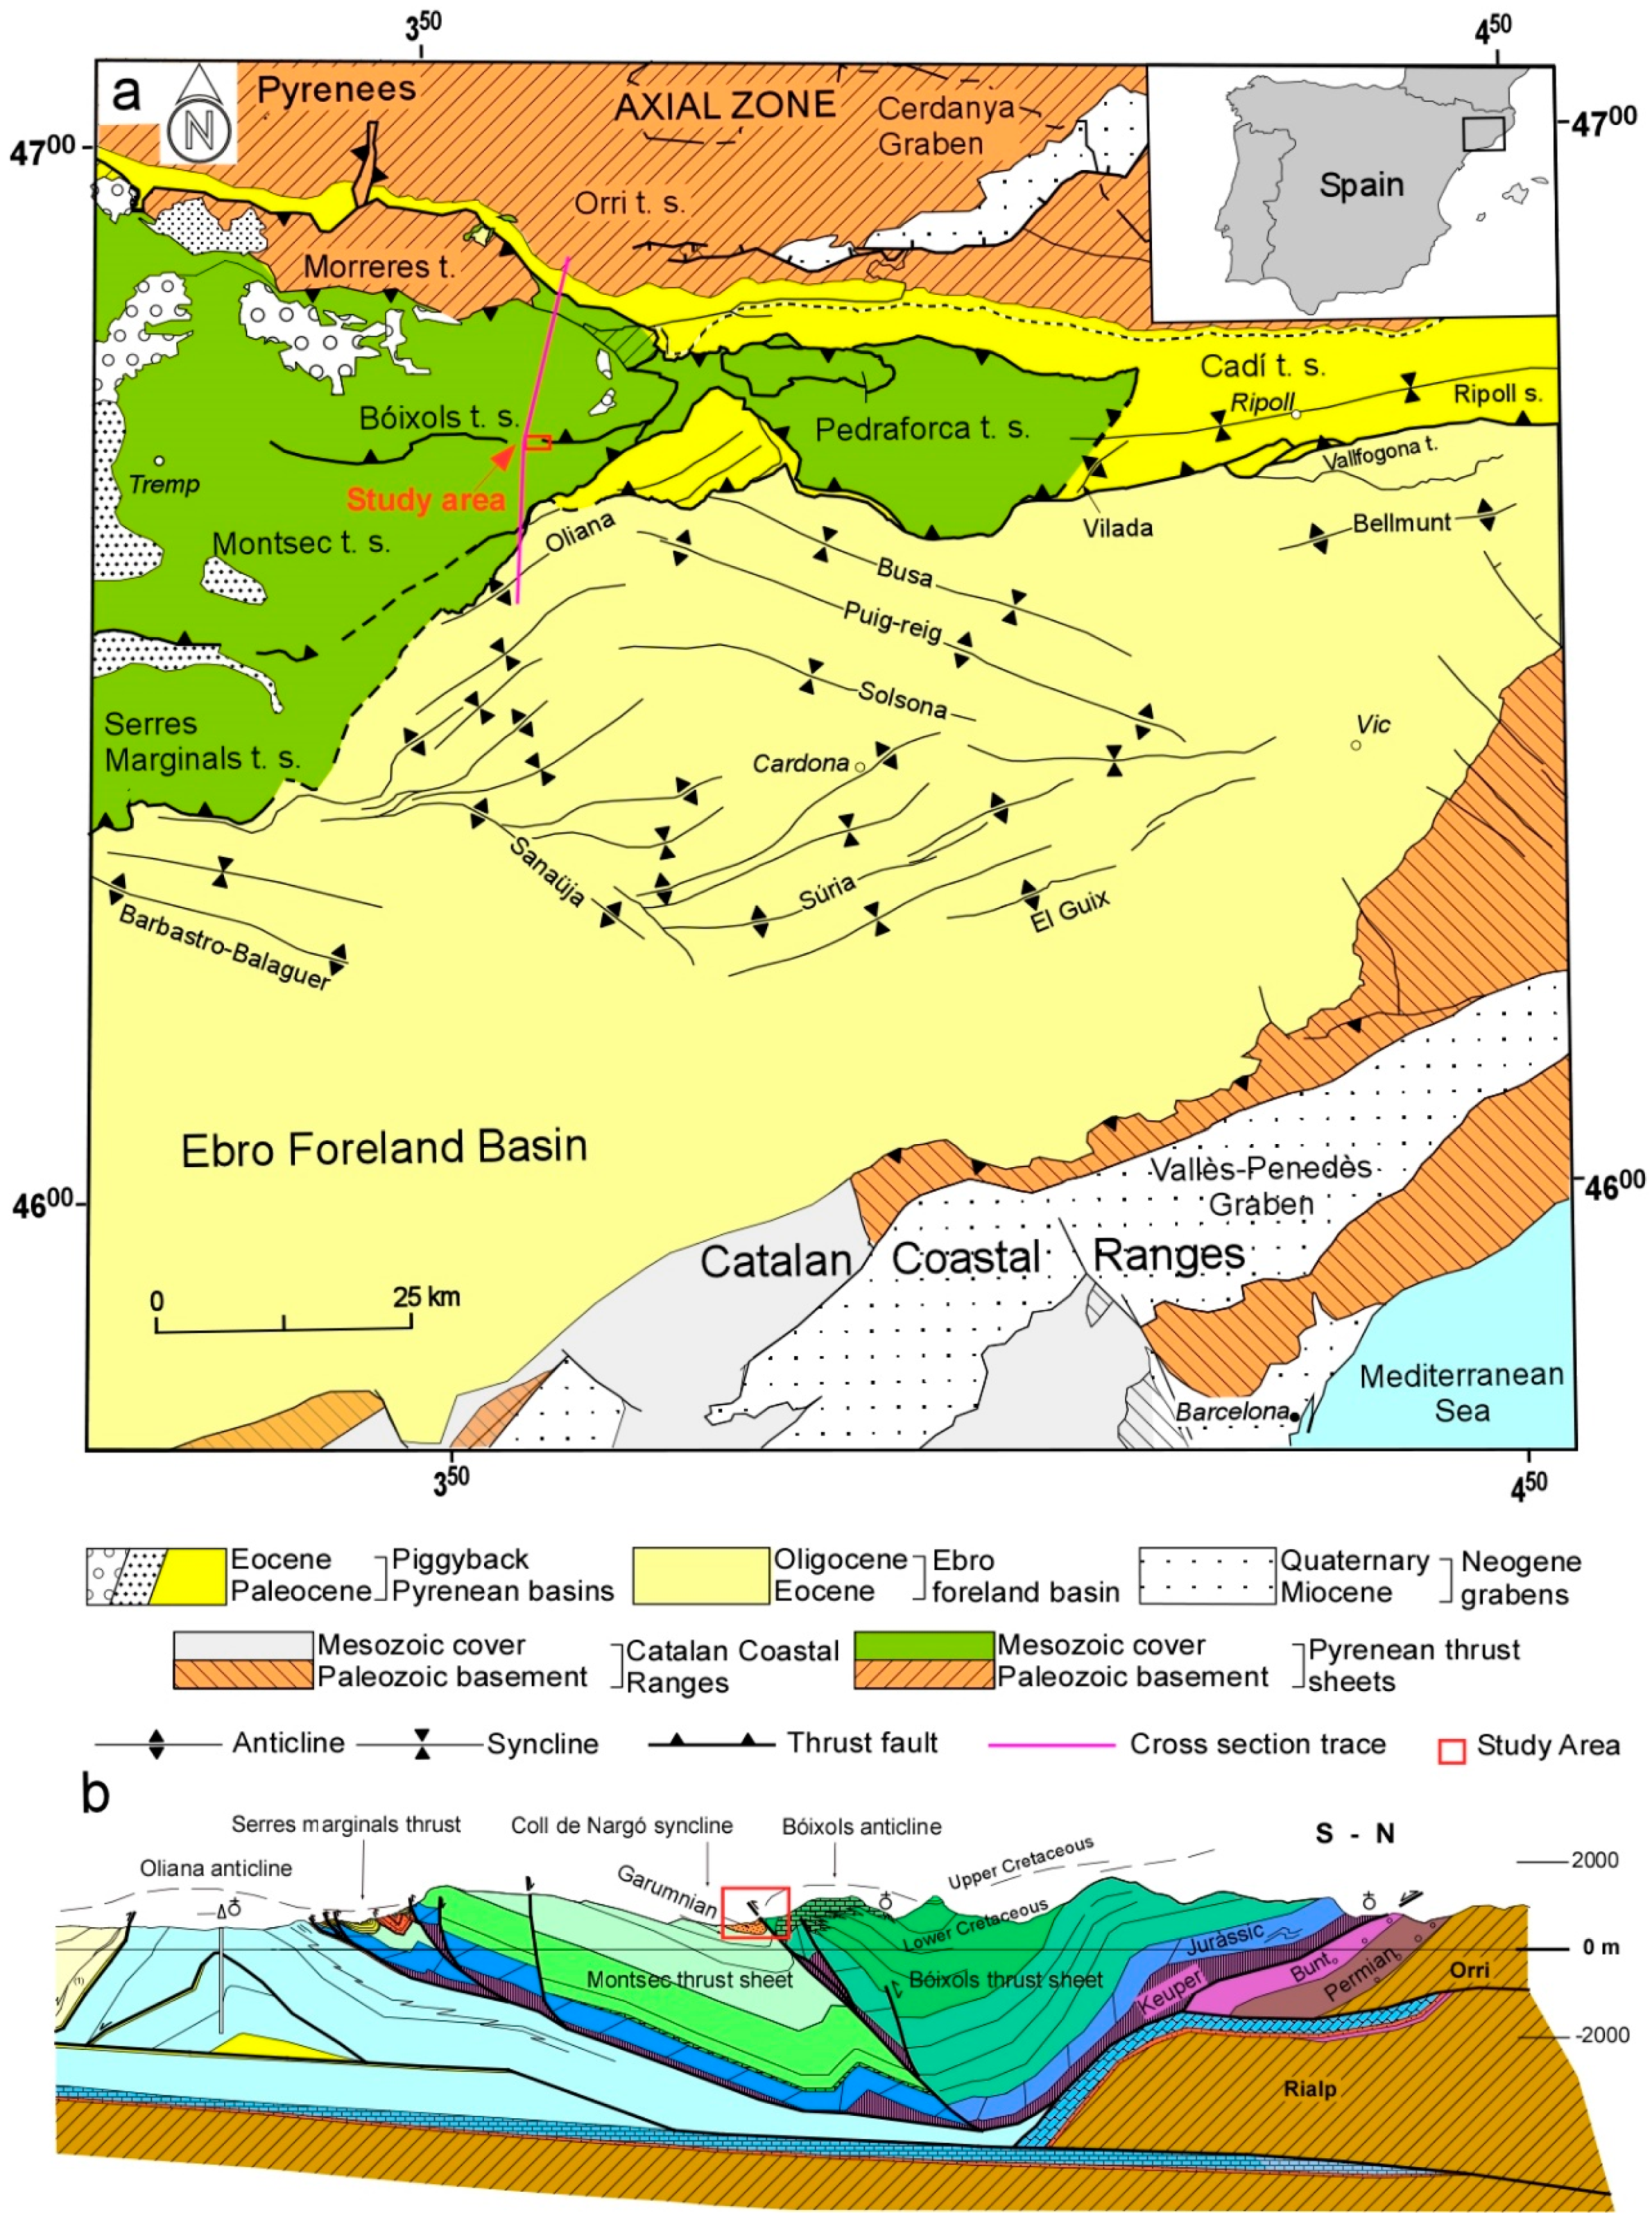
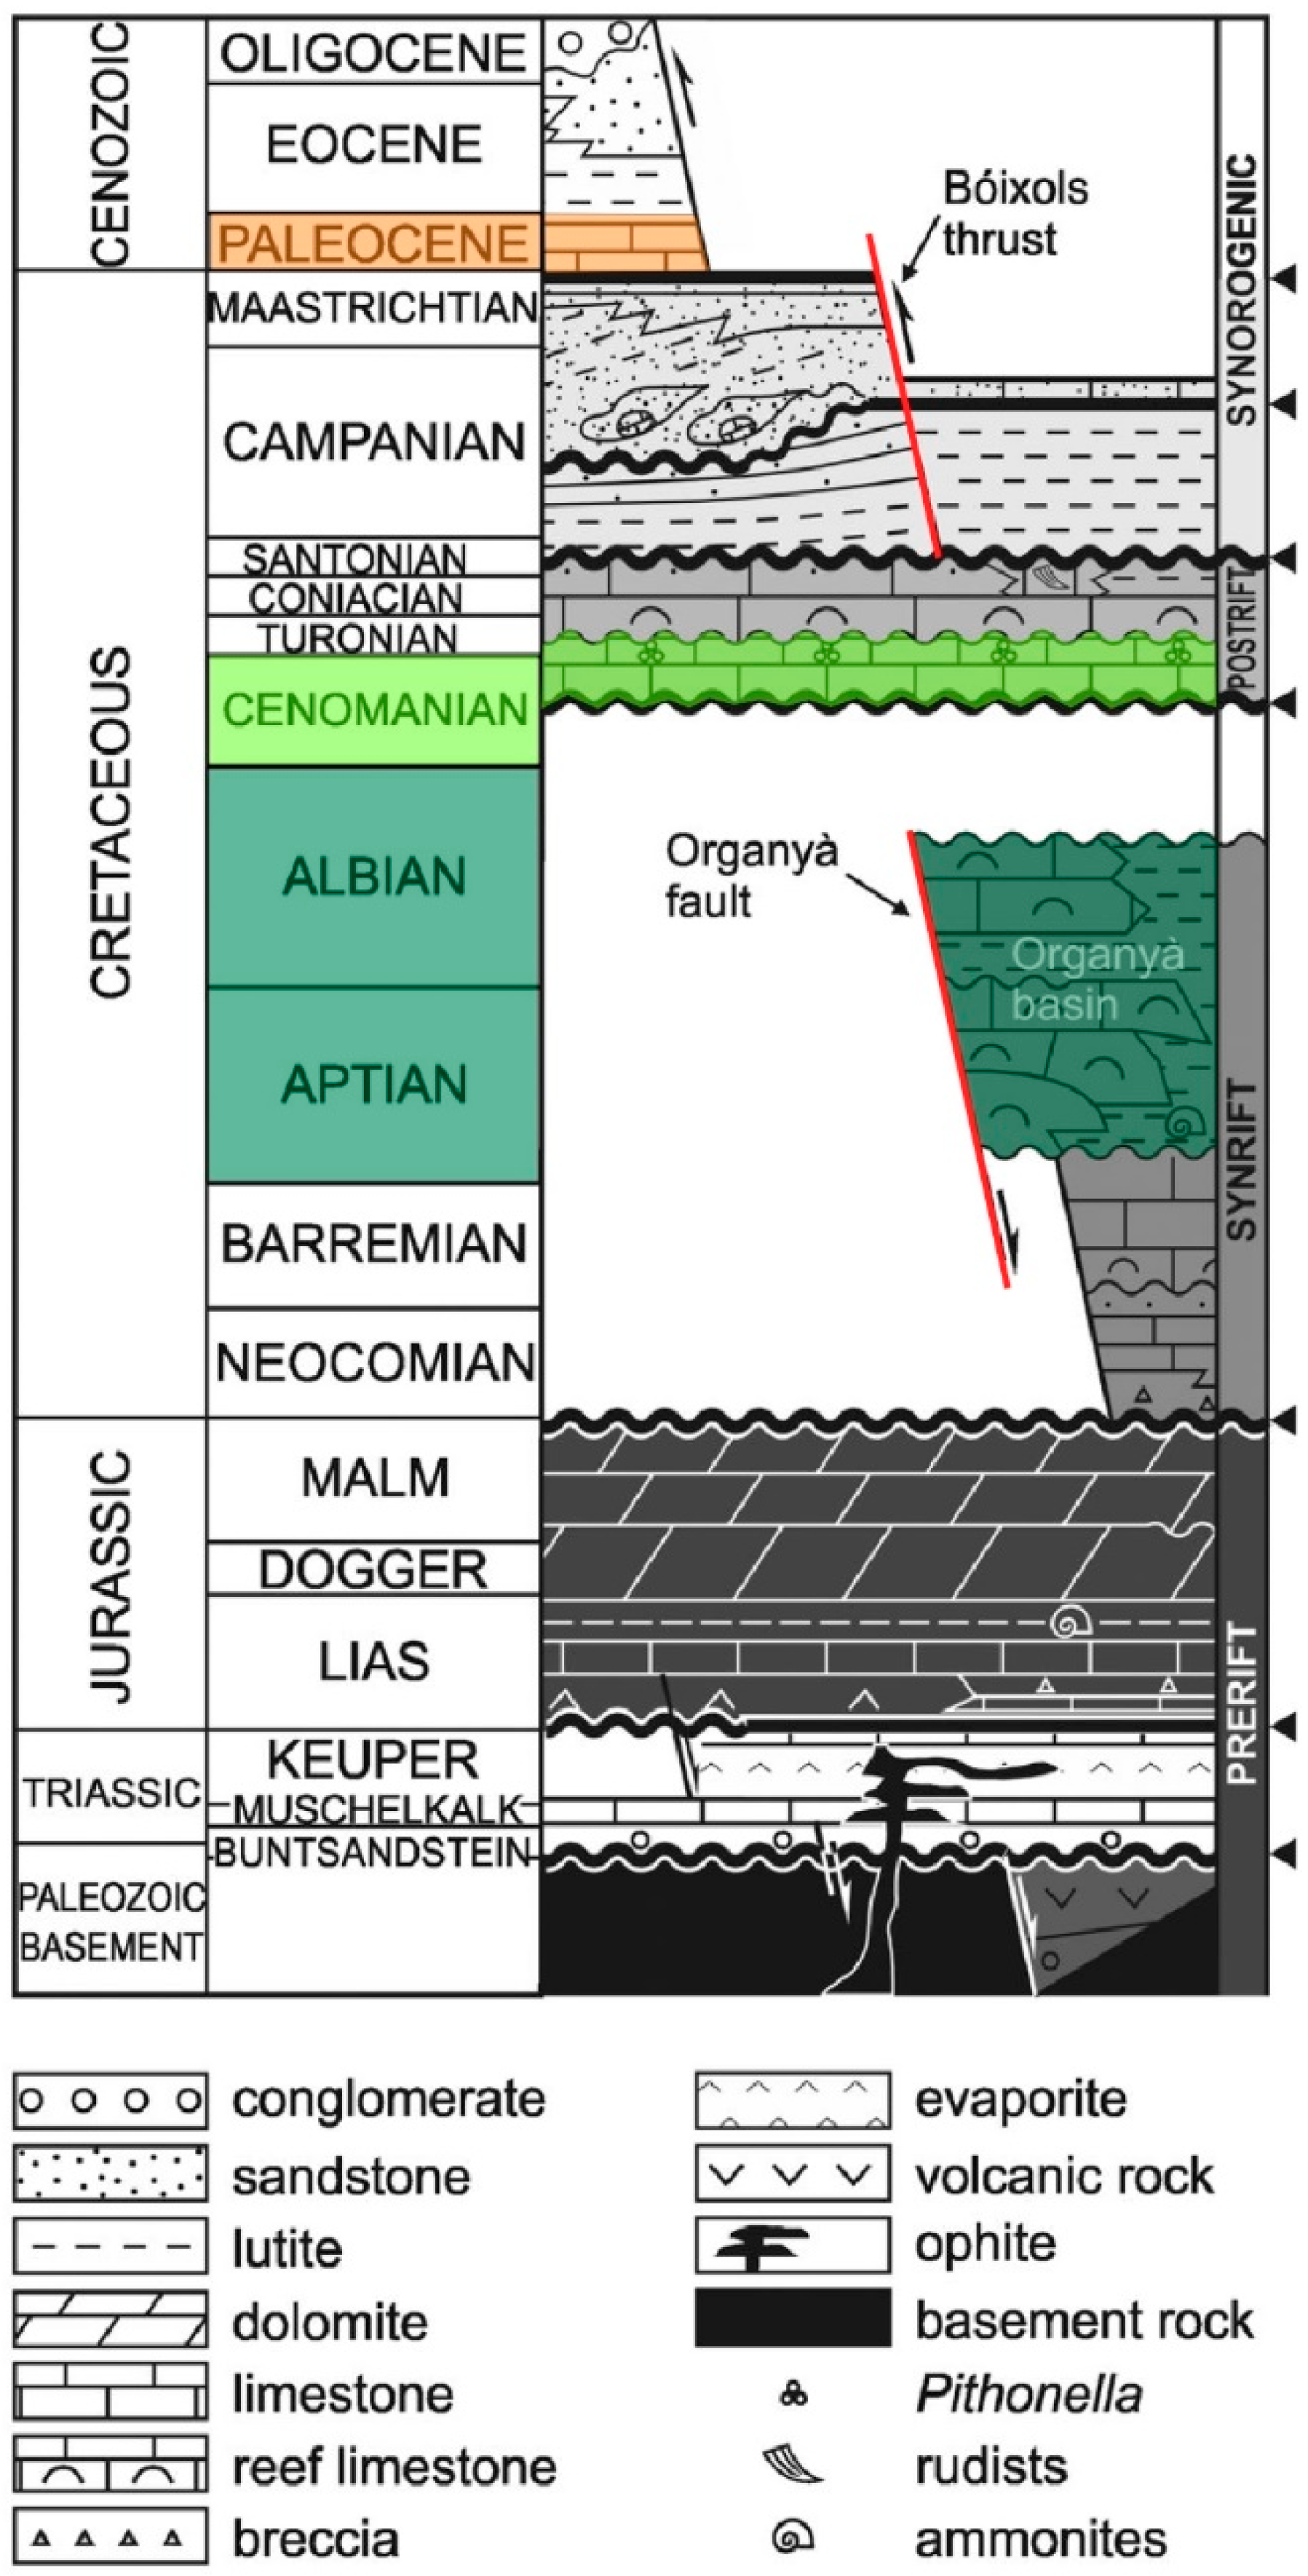
2. Geological Setting

The Pyrenees formed by the continental collision between the Iberian and European plates and consist of an asymmetrical and doubly-verging orogenic system generated from the Late Cretaceous to the Oligocene [60,61,62,63]. This orogen is constituted by an antiformal stack of basement-involved thrusts (i.e., Axial Zone) surrounded by two fold and thrust belts that were transported to the north and south over the Aquitanian and Ebro foreland basins, respectively [61,64,65]. The South-Central Pyrenean Unit consists of three south-verging imbricated thrust sheets detached over Triassic evaporites: Bóixols, Montsec and Serres Marginals [66]. The Bóixols thrust sheet represents the northernmost and oldest emplaced structure and was originated by the inversion of the Organyà extensional basin during the Upper Santonian [59,67,68,69]. It is bounded to the south by the Bóixols thrust and to the north by the Morreres back-thrust and is characterized by a set of structures roughly striking E-W [66]. The study area is located in the frontal part of the Bóixols thrust sheet and comprises the southern limb of the Bóixols anticline and the northern limb of the Coll de Nargó syncline (Figure 1). Existing stratigraphic data [70,71] reveals that the main stage of development of the Bóixols thrust was from the Campanian (83.6–72.1 Ma) to the late Maastrichtian (72.1–66 Ma) [72]. Additionally, authigenic illite dating of the above-mentioned fault gouge indicates an age of 71.2 ± 6.4 Ma [73]. This result is consistent with the age estimated through stratigraphic data, confirming the onset of the Pyrenean convergence and associated deformation by the Late Cretaceous.

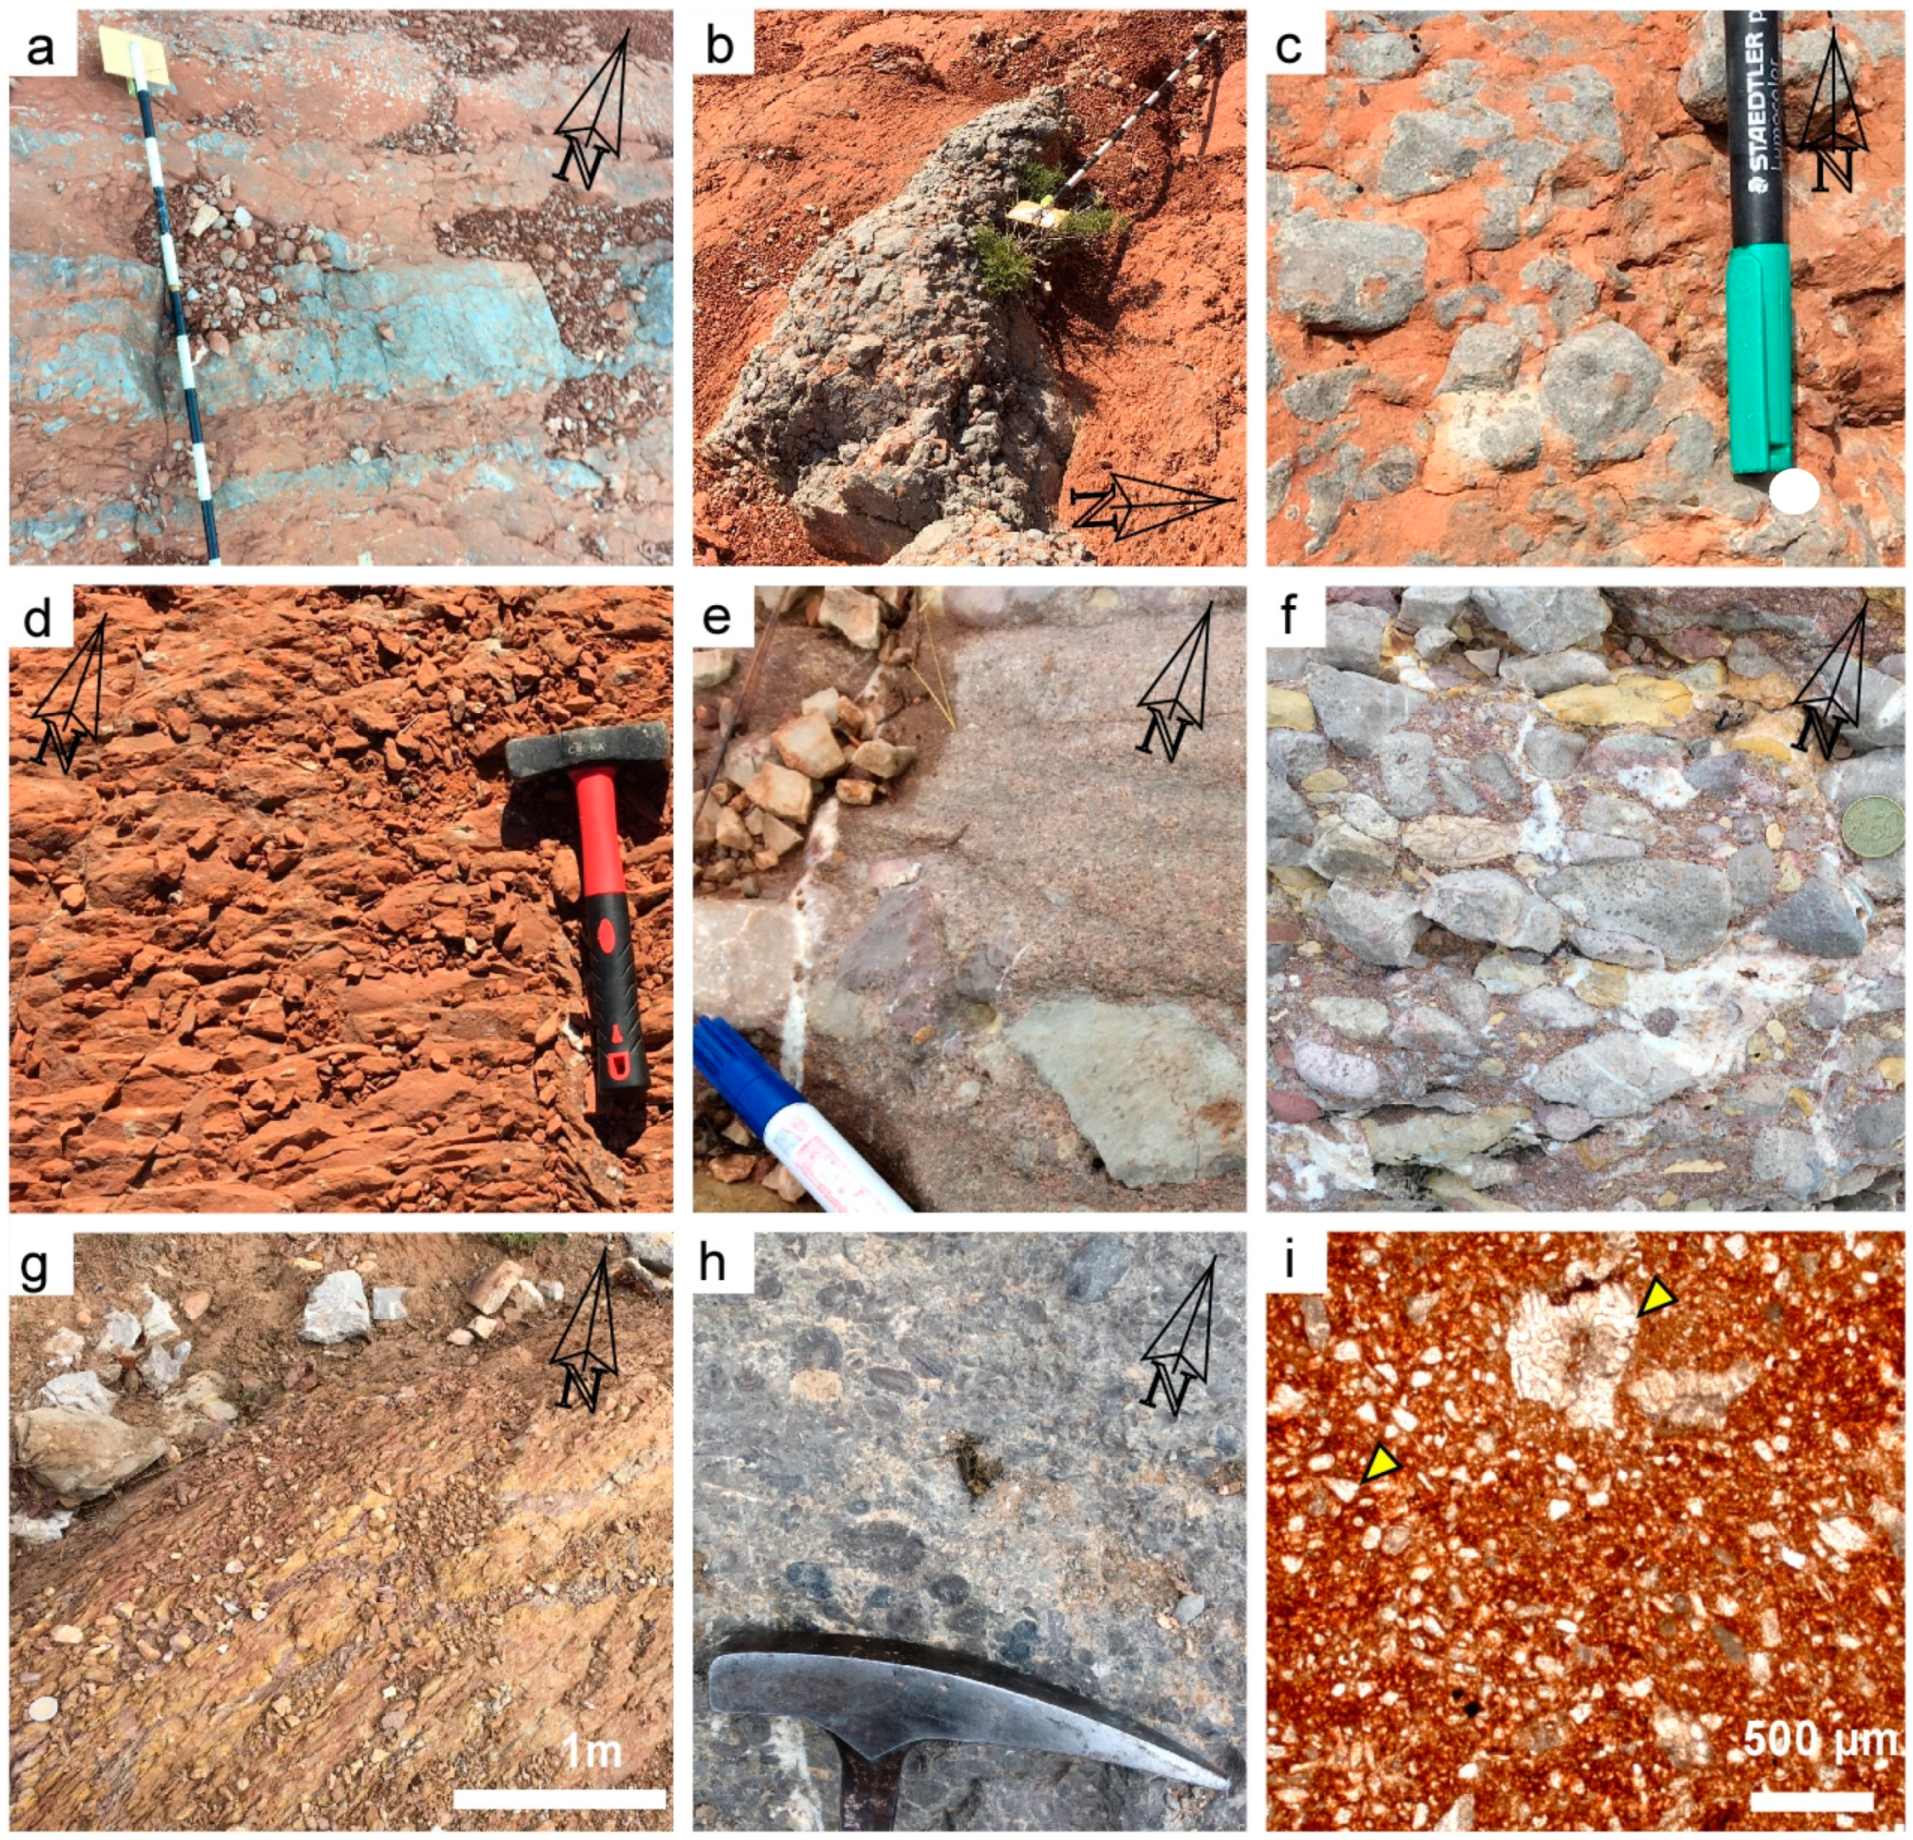
2.1. Lithology and Petrography

The stratigraphic record in the Bóixols thrust sheet has been divided into four main sequences related to the main tectonic events (Figure 2) [67,72,74]: (1) The pre-rift sequence mainly consists of evaporites and clays of the Triassic Keuper facies, which acted as a detachment level of the Bóixols thrust [75], and Jurassic dolostones; (2) The Lower Cretaceous syn-rift sequence is represented by platform carbonates and basinal marls [67,69]; (3) The post-rift sequence, with an age from Upper Cenomanian to Early Santonian, is composed of limestones, sandstones and marls [69]; and, finally, (4) the syn-orogenic sequence is represented by Upper Santonian to Campanian turbiditic deposits [76], Late Campanian to Maastrichtian shallow marine sequences and uppermost Maastrichtian to Paleocene fluvial lacustrine red beds. The succession cropping out in the study area (Figure 3 and Figure 4) is described as follows. The Jurassic pre-rift sequence mainly consists of limestones, marls and dolostones with a thickness ranging from 600 to 1,200 m [72]. However, this unit often appears incomplete in the study area because of erosion [69,72]. These sediments were incorporated into the hanging wall of the Bóixols thrust sheet during the Alpine orogeny. The Lower Cretaceous syn-rift Lluçà Formation (Aptian-Albian in age) consists of a rhythmic alternation of dark grey marls, marly limestones and limestones containing silt to fine quartz grains and sporadic glauconite grains, representing water depth variations. The abundant fossiliferous content (ammonites, sponges, rudists and isolated calcispheres) suggests that these sediments were deposited from a shallow to deeper marine environment below the wave action zone [69].The Upper Cretaceous post-rift Santa Fe Formation deposited prior to the Alpine compression [58]. It is bounded by two unconformities and consists of a rigid 30-m thick succession of grey homogeneous bioclastic wackestones constituted of miliolida, bivalves, bryozoans, echinoderms, Textularia and Praealveolina. Bio-erosion evidence on fossil fragments suggests that deposition of this unit took place during low sedimentation rates and/or shallow conditions.
The uppermost Cretaceous to Paleocene syn-orogenic Garumnian facies (i.e., Tremp Formation) are composed of fluvial-alluvial and lacustrine facies comprising red mudstones, limestones, sandstones, conglomerates and versicolored clays (Figure 5a–g). Conglomerates are polymictic, clast-supported and formed by 70–80% of Mesozoic extrabasinal calcareous pebbles, characterized by a wide grain size range (1–20 cm) and shape varying from sub-angular to sub-rounded with low to high sphericity. The remaining part is constituted by 10–30% matrix, 10–20% calcite cement and negligible porosity (0–5%). Red-brick floodplain mudstones are characterized by high iron oxide concentration. Lacustrine limestones generally occur interbedded with red and nodular mudstones. Petrographically, they consist of wackestones composed of fragments of bivalves and gastropods, which originally were composed of low-Mg calcite [77]. Locally they change to oncolitic packstones (Figure 5h) displaying a peloidal fabric related to microbial processes. Fine and coarse-grained sandstones are stacked in tabular and channelized bodies. Versicolored clays appear altered by oxide-reduction processes related to paleo-soils. Locally, packstone with Microcodium is also observed (Figure 5i).

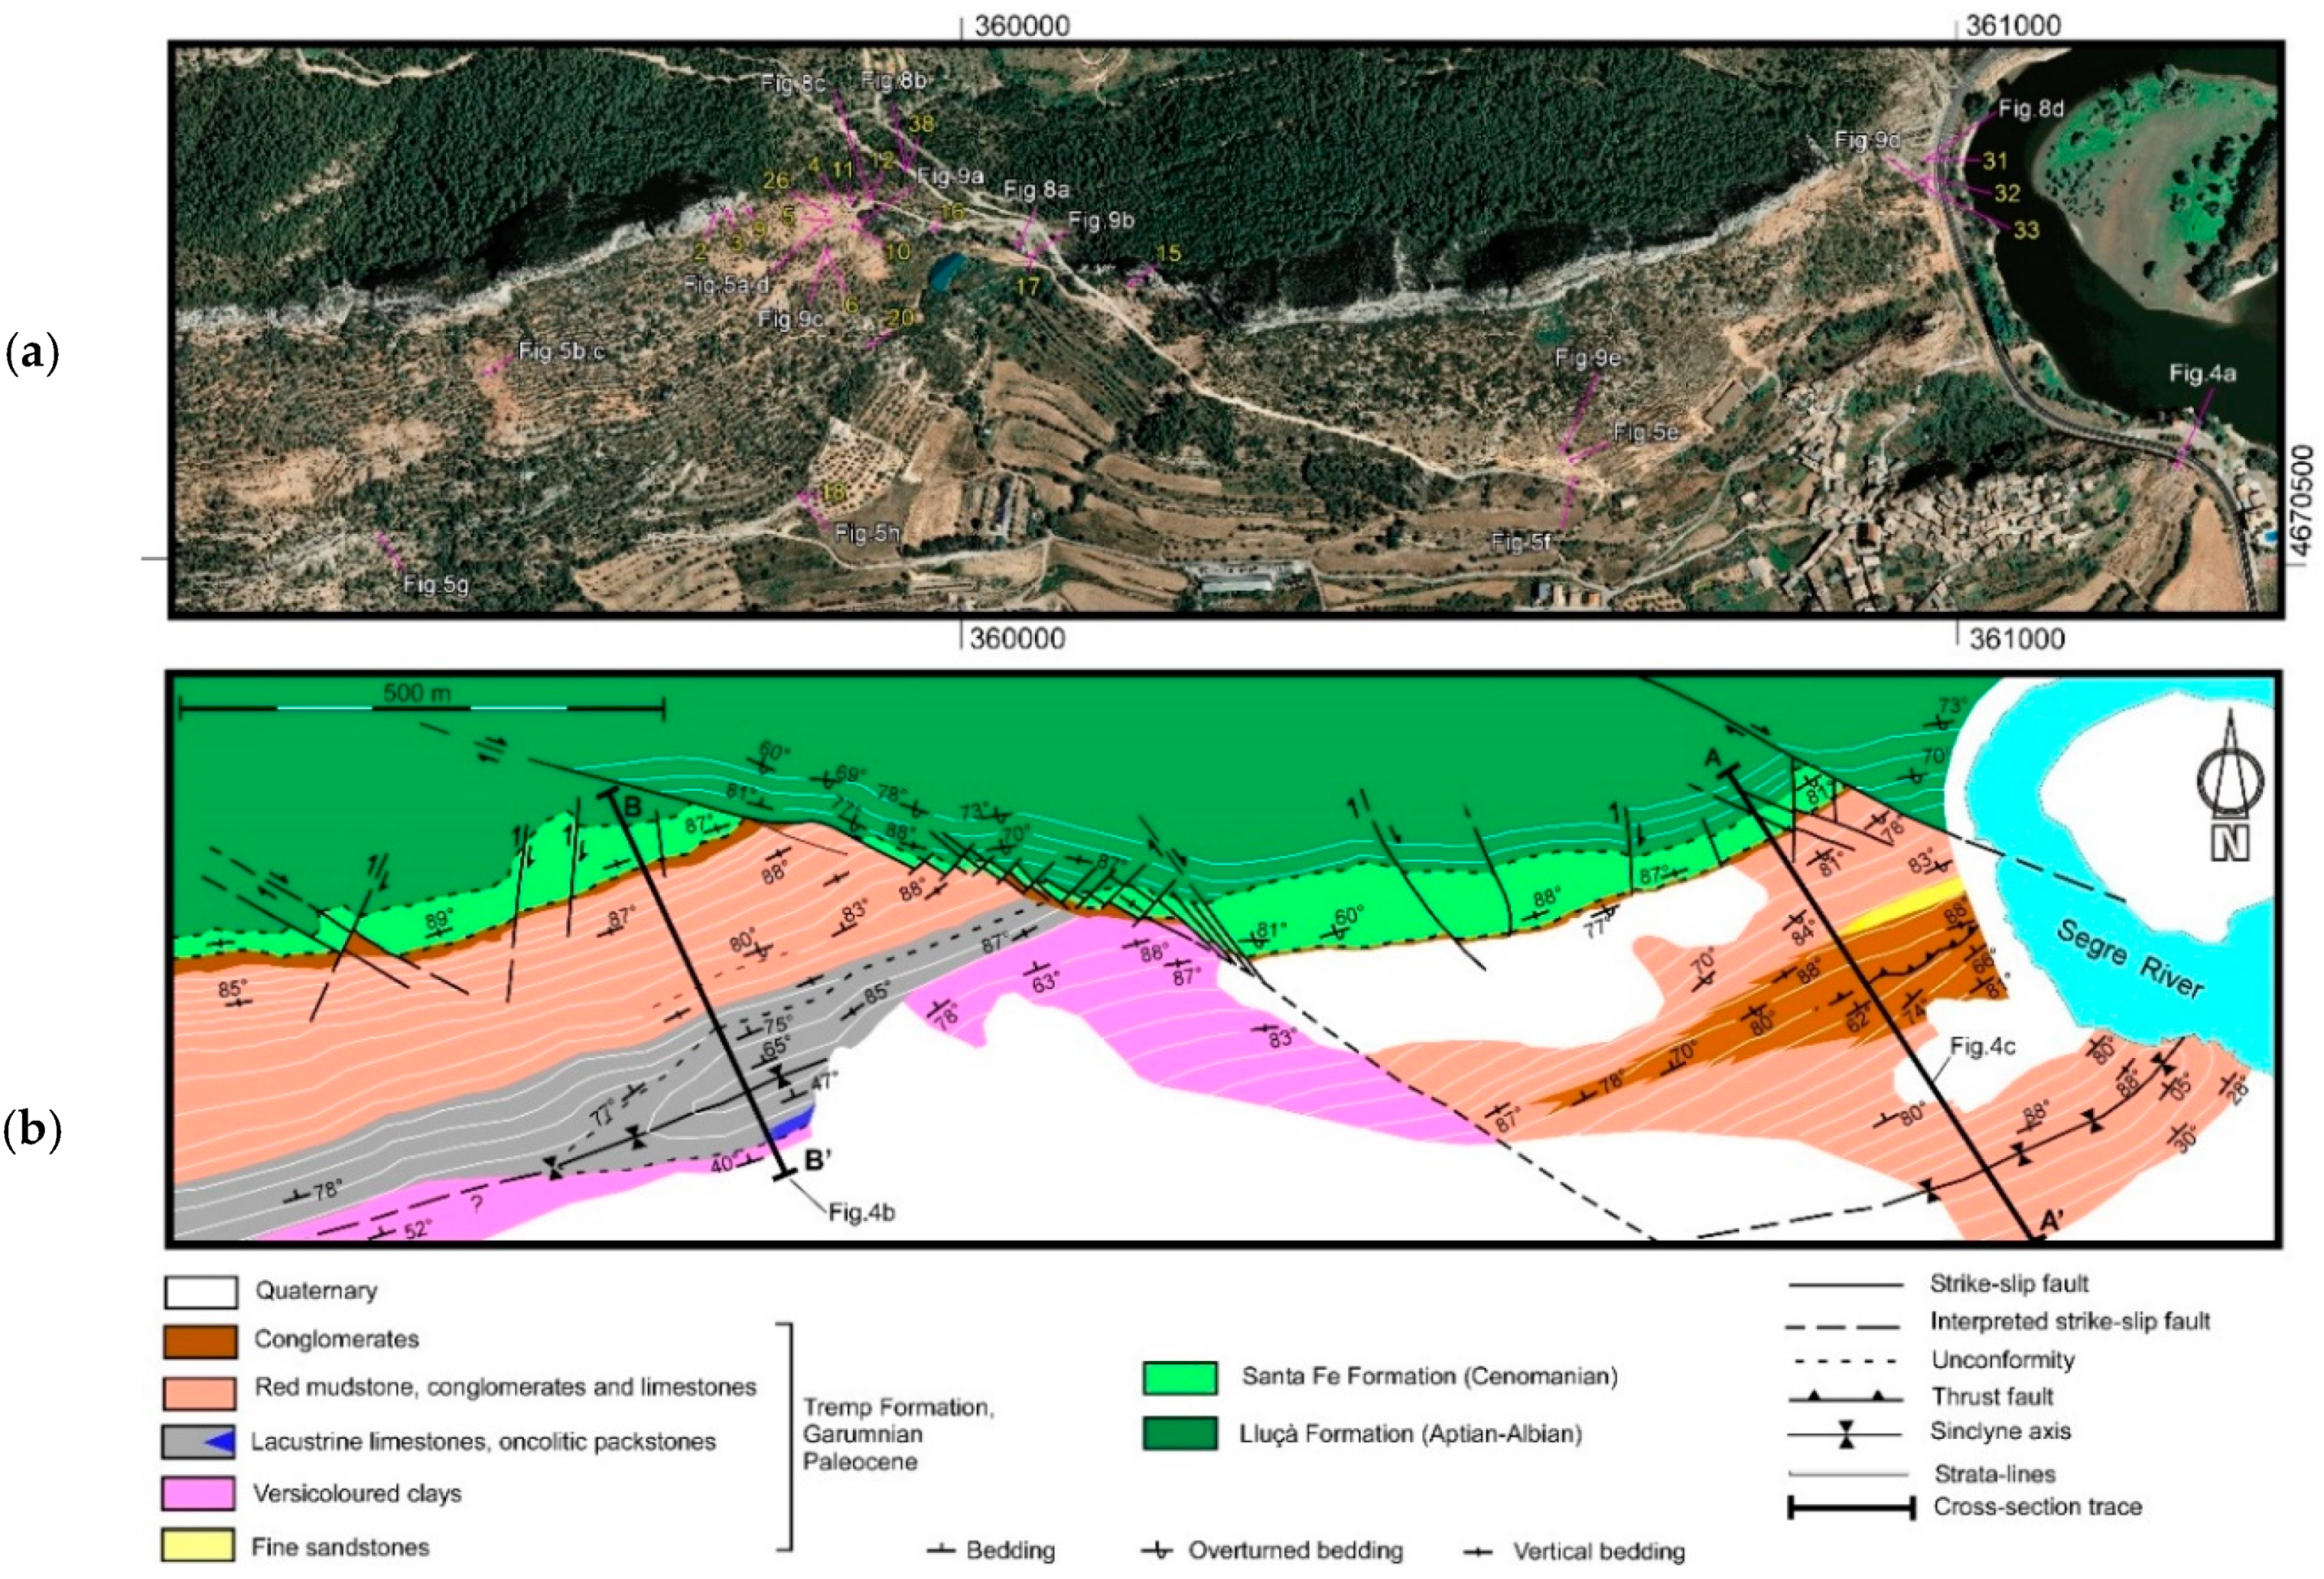
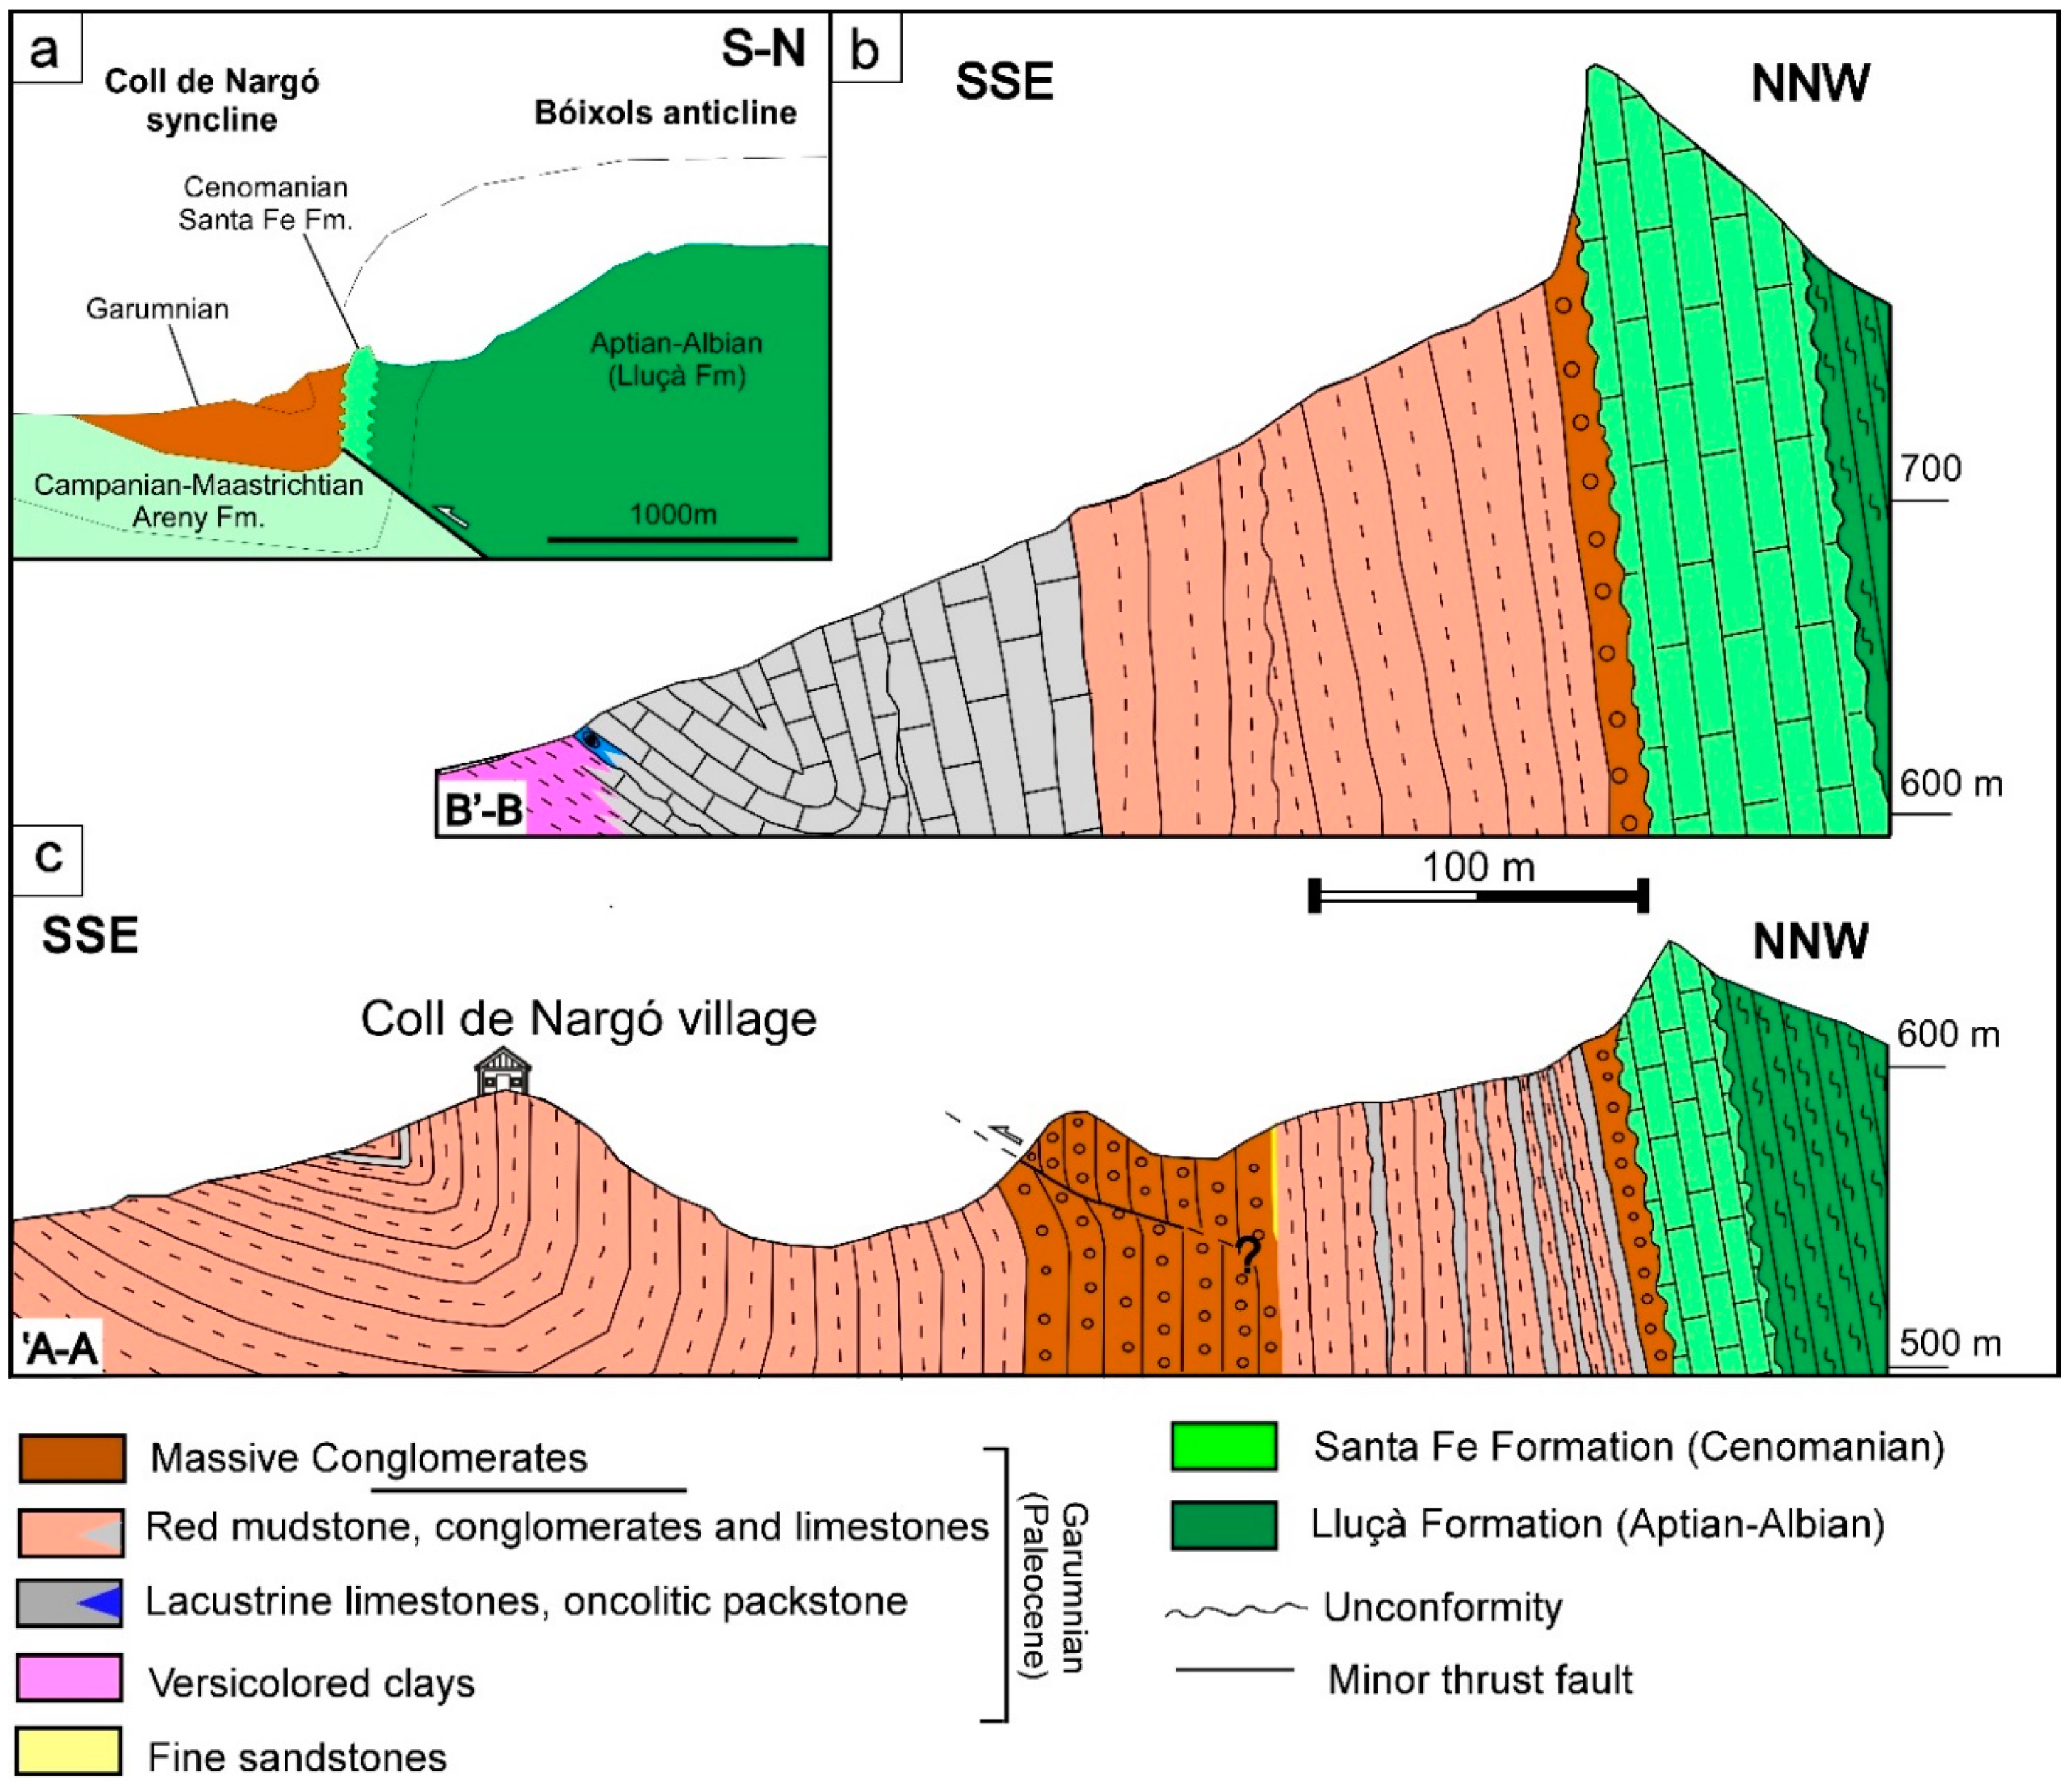
2.2. The Coll de Nargó Syncline

The Coll de Nargó syncline is a narrow, asymmetric and E-W oriented fold formed in response to the Bóixols thrusting and located at the north-eastern boundary of the Montsec thrust sheet (Figure 3 and Figure 4). It includes the Areny Formation (Maastrichtian) and the Garumnian facies (Paleocene), which unconformably overly the Santa Fe Formation (Cenomanian). In the northern limb, bedding ranges from vertical to slightly overturned, while it gently dips (30–40°) towards the north in the southern flank (Figure 4). The syntectonic deposition of the Garumnian facies is highlighted through successive unconformities registered along the sedimentary record.

3. Methods

This study has been carried out by an integrated geological approach. Structural data were collected in the field including fracture and bedding orientation, types, crosscutting relationships between different fracture sets and kinematics when possible. Structural data were plotted and analyzed with the software Win-Tensor (v.5.8.8) [78]. Host rocks and vein calcite cements were systematically sampled for petrographical and geochemical analyses.

3.1. Petrography

In order to distinguish different calcite cement generations, forty polished thin-sections (notated as CN1 to CN40) were prepared and analyzed with a Zeiss Axiophot optical microscope and a Technosyn Cold Cathodoluminescence microscope, model 8200 Mk5-1 operating between 16–18 kV and 250 μA gun current. The terminology of vein types and vein microstructures is based on the classification of Reference [79].

3.2. Carbon and Oxygen Isotopes

The calcite cements and their related carbonate host rocks were carefully sampled for carbon and oxygen isotopic analysis using a 400/500 μm-diameter dental drill to extract 50–100 μg of powder. Calcite powders were reacted with 100% phosphoric acid for two minutes at 70 °C. The resultant CO2 was analyzed using an automated Kiel Carbonate Device attached to a Thermal Ionization Mass Spectrometer Thermo Electron MAT-252 (Thermo Fisher Scientific, Bremen, Germany) following the method of [80]. The International Standard NBS-18 and the internal standard RC-1, traceable to the International Standard NBS-19, were used for calibration. The standard deviation is ±0.03‰ for δ13C and ±0.05‰ for δ18O expressed with respect to the VPDB standard (Vienna Pee Dee Belemnite). The list of analyzed samples is shown in Table 1.

3.3. Clumped Isotope Thermometry

Clumped isotope thermometry was carried out in order to calculate temperatures and δ18O values of the fluids from which the different generations of calcite cements precipitated. This technique is giving good results in this kind of study [16,17,81] and it is becoming a key method in order to establish temperature and fluid composition in carbonate cements, where usually fluid inclusion microthermometric analyses cannot be performed due to stretching. Samples CN33, CN38, CN20 and CN15 were chosen as representative of each calcite cement generation (Cc1 to Cc4, respectively). For this, 2–3 mg aliquots from cements were measured with the Imperial Batch Extraction system (IBEX), an automated line developed at Imperial College. Each sample was dropped in 105% phosphoric acid at 90 °C and reacted for 30 min. The reactant CO2 was separated using a poropak-Q column, and transferred into the bellows of a Thermo Scientific MAT 253 mass spectrometer (Thermo Fisher GmbH, Bremen, Germany). The characterization of a replicate consisted of 8 acquisitions in dual inlet mode with 7 cycles per acquisition. The post-acquisition processing was completed with a software for clumped isotope analysis named Easotope [82]. Δ47 values were corrected for isotope fractionation during phosphoric acid digestion employing a phosphoric acid correction of 0.069 ‰ at 90 °C for calcite [83], the data were also corrected for non-linearity applying the heated gas method [84] and projected into the reference frame of [85]. Carbonate δ18O values were calculated with the acid fractionation factors of [86]. Samples were measured two times, except CN38 with only one replicate, and the average result was converted to temperatures with the calibration method of [87]. Calculated δ18O values of the fluid are expressed in ‰ with respect to the VSMOW standard (Vienna Standard Mean Ocean Water).

3.4. Strontium Isotopes

Ten representative samples of calcite cements (samples CN6, CN12, CN15, CN18, CN20, CN27, CN33, CN38) and host rocks (CN12 and CN16) were sampled for 87Sr/86Sr analyses. Powdered samples were completely dissolved in 5 mL of 10% acetic acid, dried and again dissolved in 1 mL of 65% HNO3. After evaporation, the resulted solid residue was diluted in 3 mL of 3M HNO3 to be charged in the chromatographic columns in order to obtain the Sr. In the chromatographic columns, a SrResinTM (Triskem Internacional) (crown-ether (4,4′(5′)-di-t-butylcyclohexano-18-crown-6)) resin was used and Sr was recovered using 0.05M HNO3 as an eluent. After evaporation, samples were loaded onto a Re filament with 1 μL of 1 M phosphoric acid and 2 μL of Ta2O5. Isotopic ratio measurements were carried out in a TIMS-Phoenix mass spectrometer (Isotopx, Cheshire, UK) with a dynamic multicollection during 10 blocks of 16 cycles each one, with a 88Sr beam intensity of 3 V. Isotopic ratios were corrected from 87Rb interferences and normalized using the measured value of 88Sr/86Sr = 0.1194 to correct for the possible mass fractionation during loading and analysis of the sample. During sample analysis, the isotopic standard NBS-987 was measured six times, obtaining a media of 0.710243 and a standard deviation 2σ of 0.000009. These values have been used for the correction of the analyzed values in the samples. The analytical error in the 87Sr/86Sr ratio, referred to two standard deviations, is 0.01%. The standard error or internal precision is 0.000003.

3.5. Elemental Composition

Eight samples (CN6, CN12, CN15, CN18, CN20, CN27, CN33, CN38), two from each calcite cement, were analyzed for major, trace and rare earth element geochemistry using HR-ICP-MS in order to obtain a range of compositions for each cement generation. This technique was chosen due to its higher resolution compared to other methods (i.e., electron microprobe) and the possibility to perform a multielemental analysis including rare earth elements (REE), which give important information about fluid origin and redox conditions. Trims were sampled using a 400/500 μm-diameter dental drill to extract 100 mg of powder. Powdered samples were dried at 40 °C during 24 h and later 100 mg of sample were acid digested in closed polytetrafluoroethylene (PTFE) vessels with a combination of HNO3 + HF + HClO4 (2.5 mL: 5 mL: 2.5 mL v/v). The samples were evaporated and, 1 mL of HNO3 was added to make a double evaporation. Finally, the sample was re-dissolved and diluted with MilliQ water (18.2 MΩ cm−1) and 1 mL of HNO3 in a 100 mL volume flask. Analyses were performed using a high resolution inductively coupled plasma-mass spectrometry (HR-ICP-MS, model Element XR, Thermo Fisher Scientific, Bremen, Germany). In order to improve the sensitivity of the ICP-MS, a tuning solution containing 1 g L−1 Li, B, Na, K, Sc, Fe, Co, Cu, Ga, Y, Rh, In, Ba, Tl, U was used, and as internal standard, 20 mg L−1 of a monoelemental solution of 115In. Reference materials are the BCS-CRM n° 393 (ECRM 752-1) limestone, JA-2 Andesite and JB-3 Basalt. The precision of the results was expressed in terms of two standard deviations of a set of eight reference materials measurements (reference material JA-2), whereas accuracy (%) was calculated using the absolute value of the difference between the measured values obtained during the analysis and the certified values of a set of eight reference material analysis (reference material BCS-CRM n° 393 for major oxides and JA-2 for trace elements). The detection limit (DL) was calculated as three times the standard deviation of the average of ten blanks. Detection limits and two standard deviations of each element are shown in Supplementary Data. Several commercial solutions were used in order to perform the different calibration curves. Calibration standards for Fe, Al, P, Ti, Na, K, Ca, Mg were Monoelemental Solutions (10,000 µg/mL) of Inorganic Ventures; for Sr, Ba, Li, Be, V, Cr, Ni, Cu, Ga, As, Se, Rb, Cs, Bi Monoelemental Solutions (1000 µg/mL) of Inorganic Ventures; for Ce, Dy, Er, Eu, Gd, Ho, La, Lu, Nd, Pr, Sm, Sc, Tb, Th, U, Y a Multielemental Solution IV-CCS-1 Rare Earths Standard in HNO3, 125 mL (100 µg/mL) of Inorganic Ventures; for Sb, Ge, Hf, Mo, Nb, Re, Ta, Sn a Multielemental Solution IV-CCS-5 (100 µg/mL) Fluoride Soluble ICP-MS Std 1.2% HF(v/v) 7.14% HNO3(v/v), 125 mL of Inorganic Ventures; and, finally, for Cd, Cr, Cu Co a Multielemental Solution IV-CCS-6 (100 µg/mL) Transition Elements ICP-MS Standard in HNO3, 125 mL of Inorganic Ventures.

4. Results

4.1. Fracture Sets and Calcite Cements

Five fracture sets (F1–F5) have been identified in the study area (Figure 6) and correlated with other fractures recognized in the western part of the Sant Corneli-Bóixols anticline in previous structural studies [88,89]. We use the term “fracture set” to include both unfilled and cemented fractures (i.e., veins).

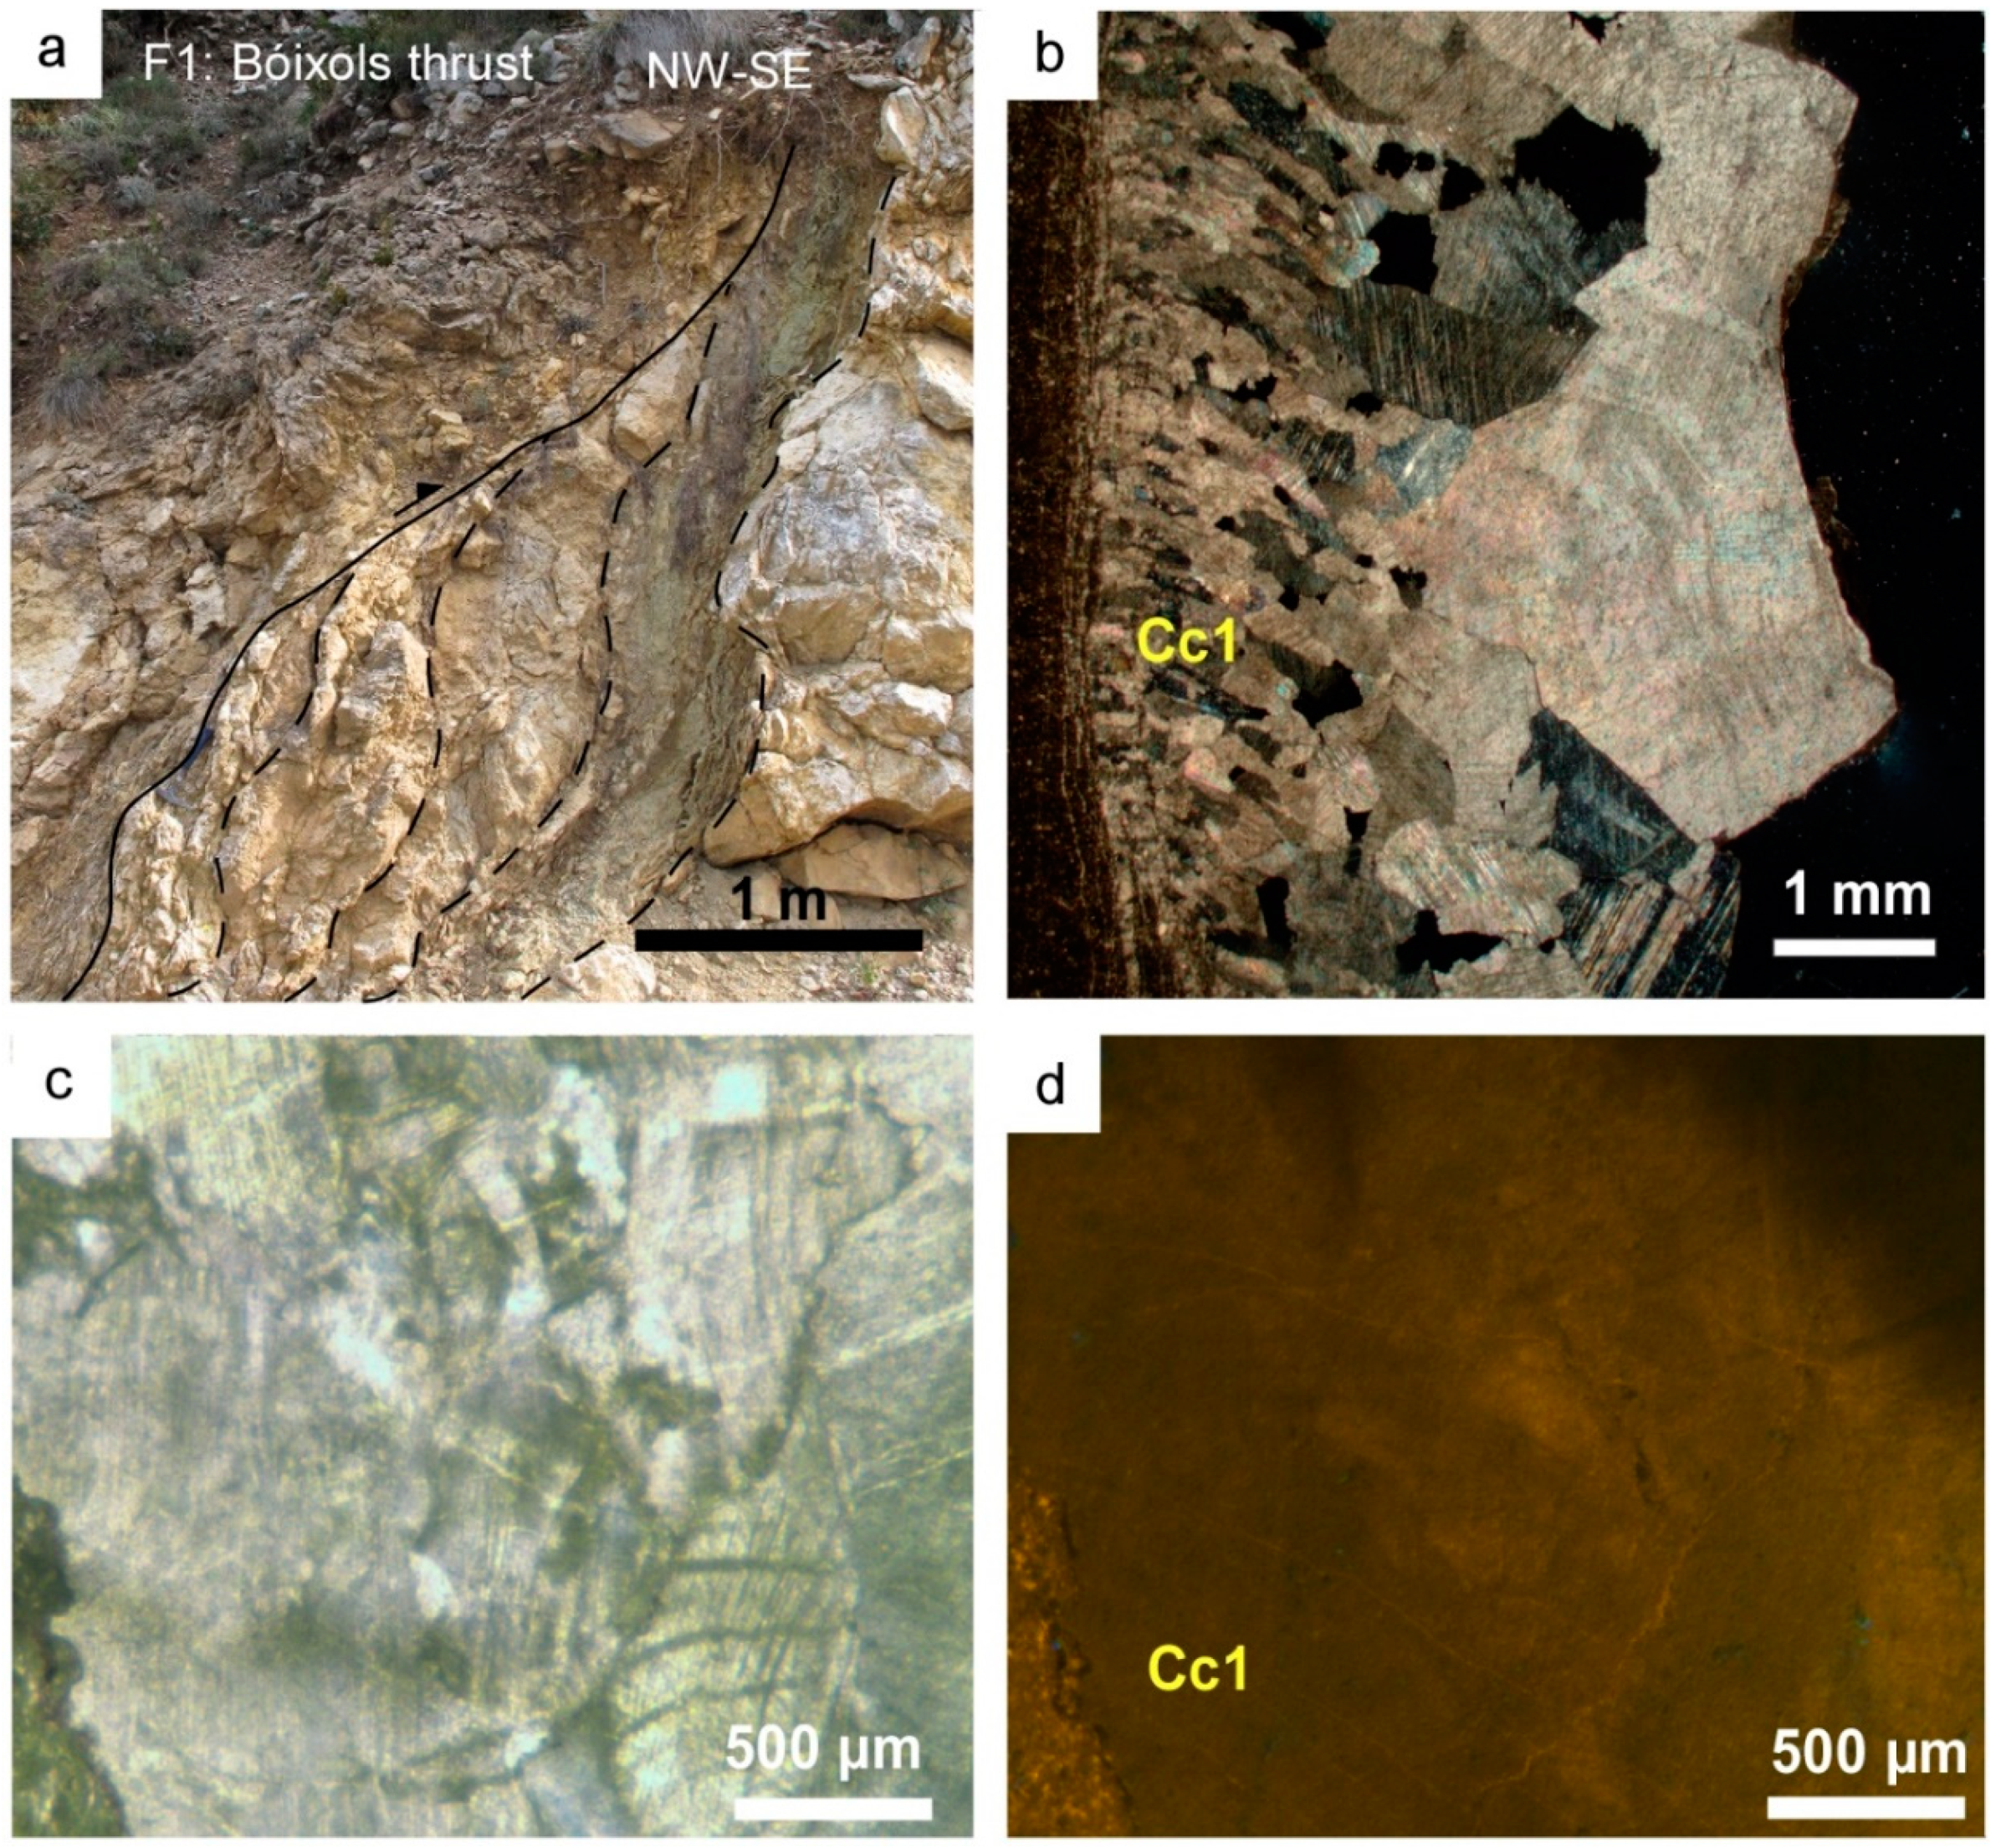
4.1.1. Fracture Set 1 (F1): ENE-WSW Reverse Faults and Related Calcite Cement Cc1

This set is represented by the Bóixols thrust and minor E-W reverse faults dipping to the NNW affecting the Lluçà Formation. The Bóixols thrust is a nearly 40 km long, E-W trending, south-verging reverse fault associated with the growth of the Bóixols anticline and Coll de Nargó syncline. Although most of the Bóixols structure has been sealed by synorogenic sediments, it emerges 3 km east of the village of Bóixols and 12 km west of the Coll de Nargó (Figure 7a). There, Jurassic dolomitic limestones from the hanging wall cut through Santonian limestones interbedded with shales of the footwall. The fault damage zone is nearly 15 m thick with a 0.5 m thick fault core, which contains dark grey-greenish gouge. The outcropping part of the thrust-related veins were sampled in order to compare them with the vein-related cements from the Coll de Nargó area.
The calcite cement Cc1 is identified in reverse faults F1 and precipitated in irregular-shaped and centimetric veins. This cement consists of: (a) elongate blocky crystals with the c-axis perpendicular to the fracture walls, ranging from 0.1 to 0.15 mm wide and from 1 to 1.5 mm long (Figure 7b), and (b) anhedral to subhedral blocky calcite crystals ranging in size from 0.1 to 4 mm with dirty yellowish-brown color and thin mechanical twin planes at the microscopic scale (Figure 7c). Most of the crystals are affected by dissolution along the edges and are crosscut by tectonic stylolites sub-parallel to the thrust trend. Elongate blocky crystals can either completely fill the fractures or partially grow from the vein edges inwards (i.e., syntaxially), where the remaining space is filled by blocky crystals. Cc1 shows a nearly black to dull-orange luminescence (Figure 7d).

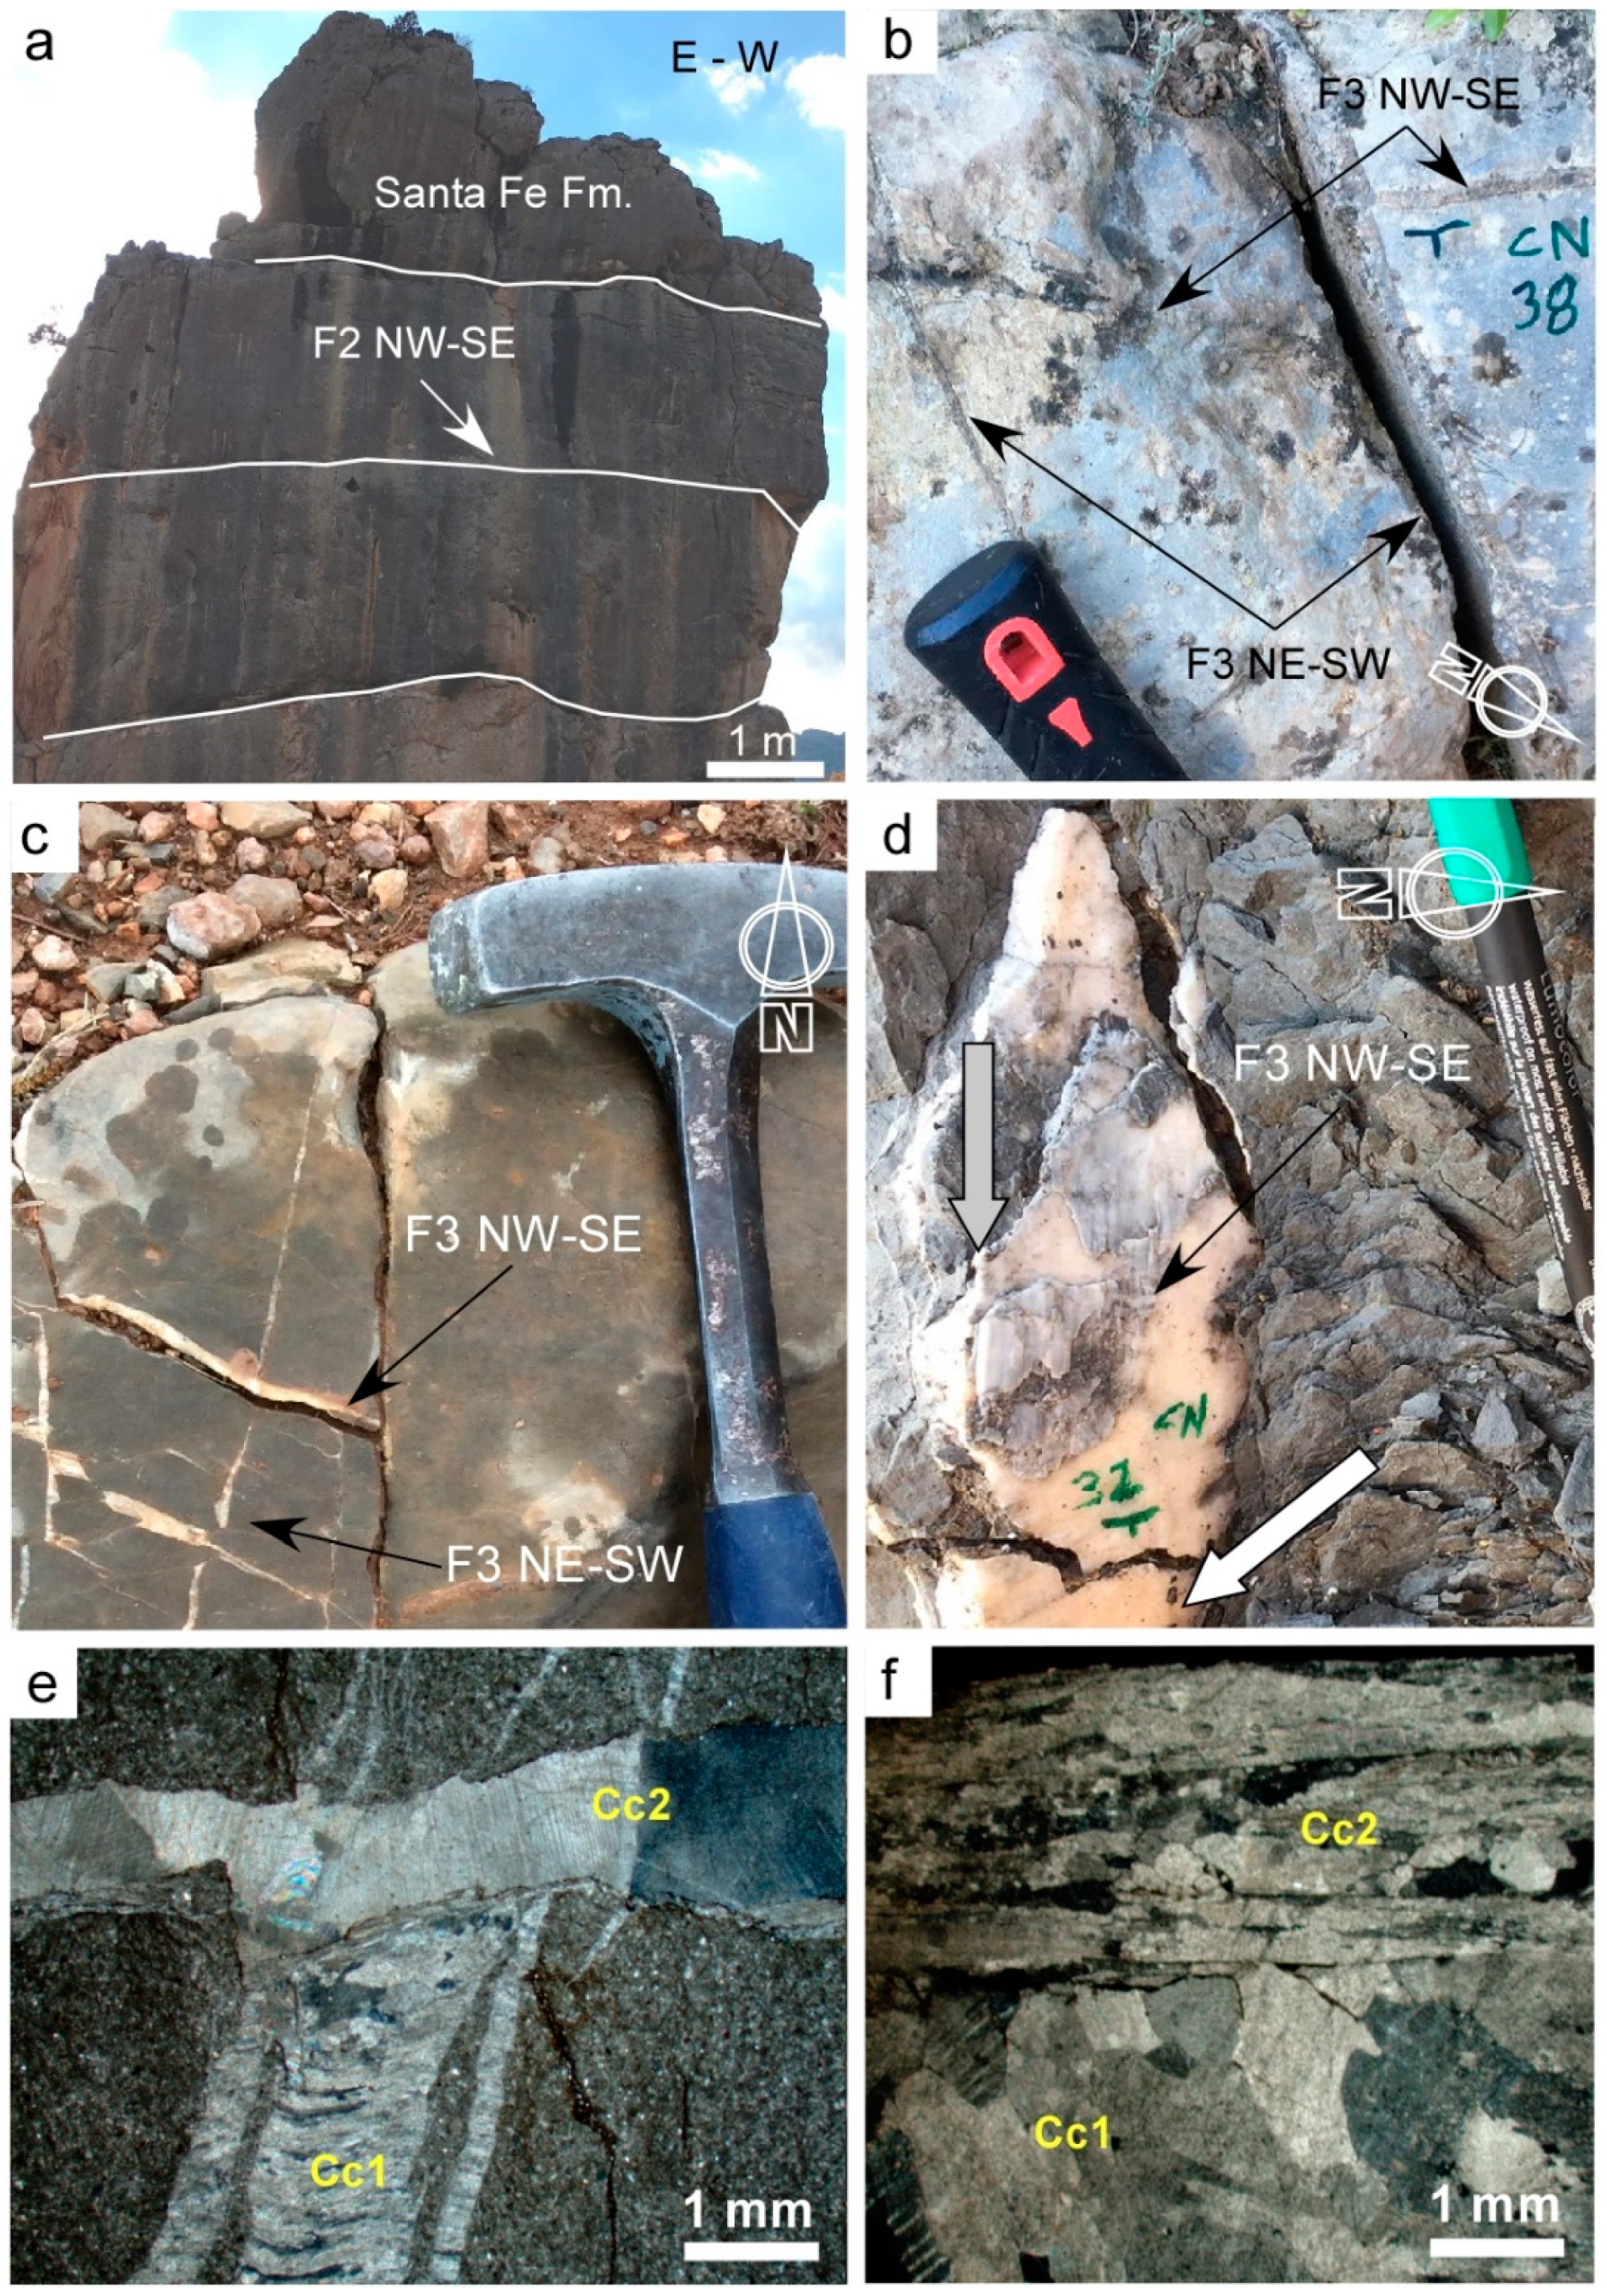
4.1.2. Fracture Set 2 (F2): NW-SE Fractures

Fracture set 2 (F2) is formed by bed-perpendicular, NW-SE trending fractures dipping from 50 to 90° to the NE, affecting the verticalized Santa Fe Formation (Figure 8a). They are open and locally filled with pedogenic nodules.

4.1.3. Fracture Set 3 (F3): NW-SE and NE-SW Conjugate Fractures and Related Calcite Cements Cc1 and Cc2

Fracture Set 3 consists of NW-SE and NE-SW conjugate fractures, dipping between 40° and 80° and affecting only the Lluçà Formation (Figure 8b,c). Once fracture data is rotated so that bedding is horizontal, all the data from the different outcrops fit well with a strike-slip stress field (Figure 6). These fractures have a regular shape, straight walls and openings ranging from 1 to 15 mm. Their occurrence is concentrated in competent layers of marly limestones. Besides, some of these fractures were reactivated first as strike-slip structures and afterwards with minor dip-slip movement, as highlighted by slickenlines and overprinting striae sets on fracture planes (Figure 8d).
F3 fractures contain two generations of calcite cements: Cc1 (described above) and Cc2, represented by a white-greyish calcite in hand sample, characterized by 0.1–0.7 mm in size elongate crystals and up to 2 mm in size blocky crystals. Evidence of dissolution along crystal edges is common. Cc2 is almost entirely non-luminescent and clearly crosscuts, and therefore postdates, Cc1 (Figure 8e,f).

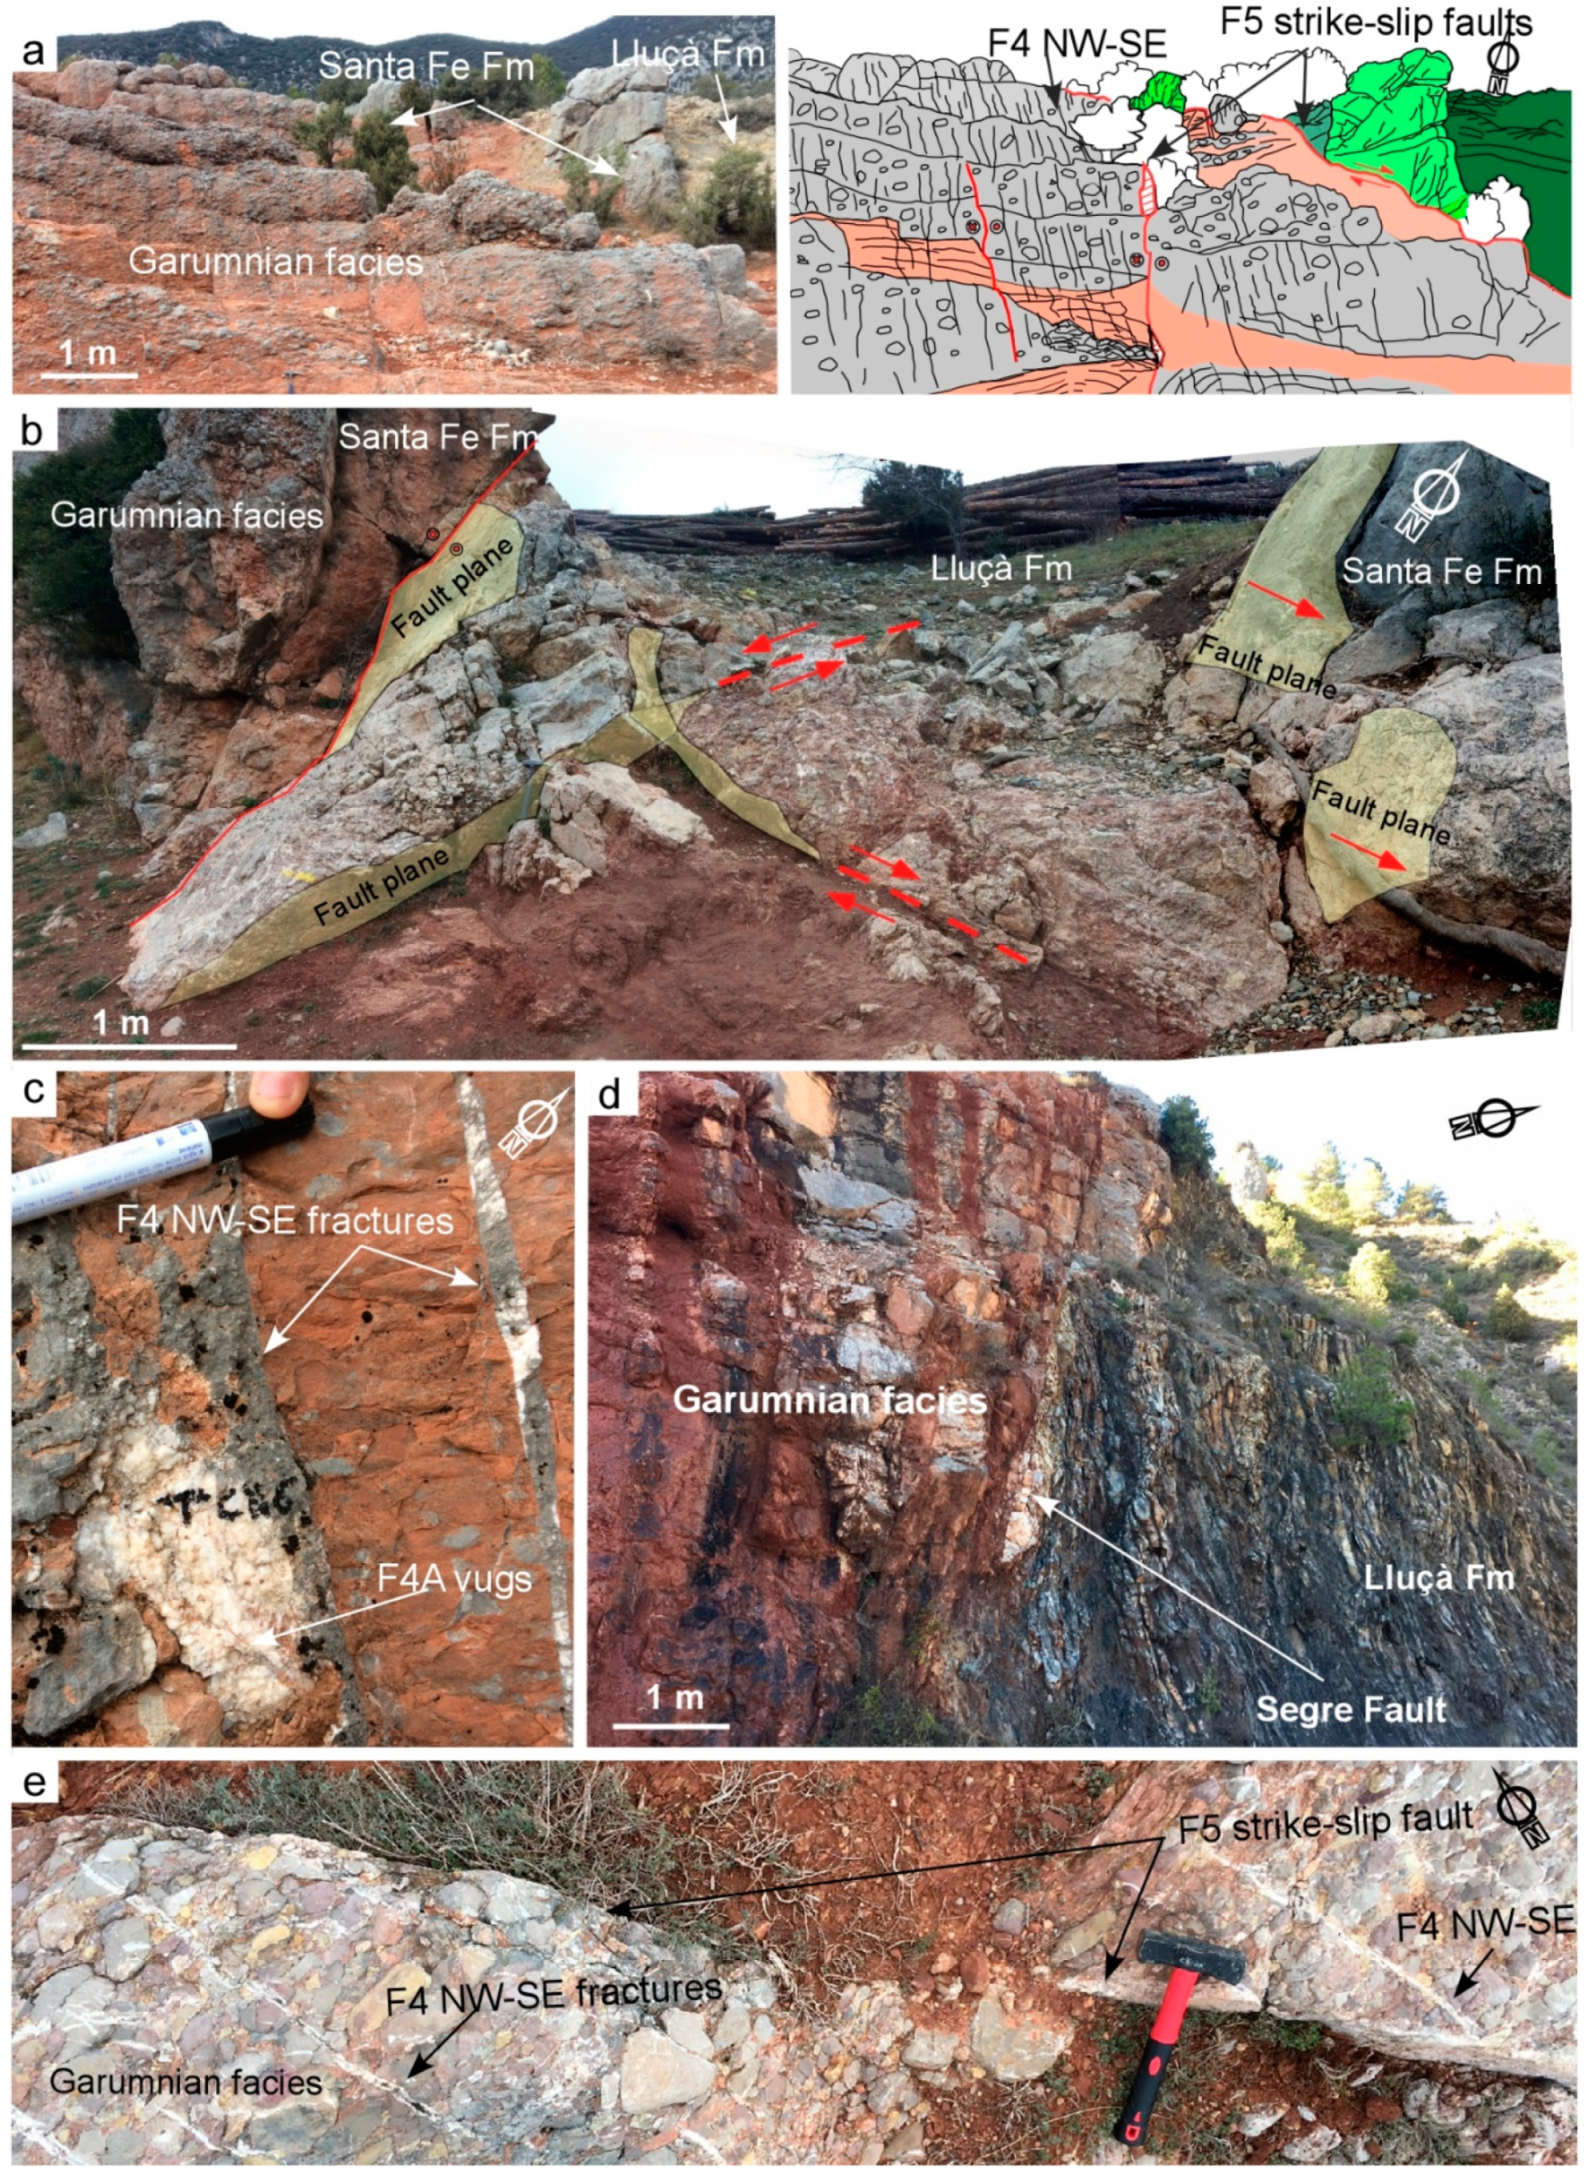
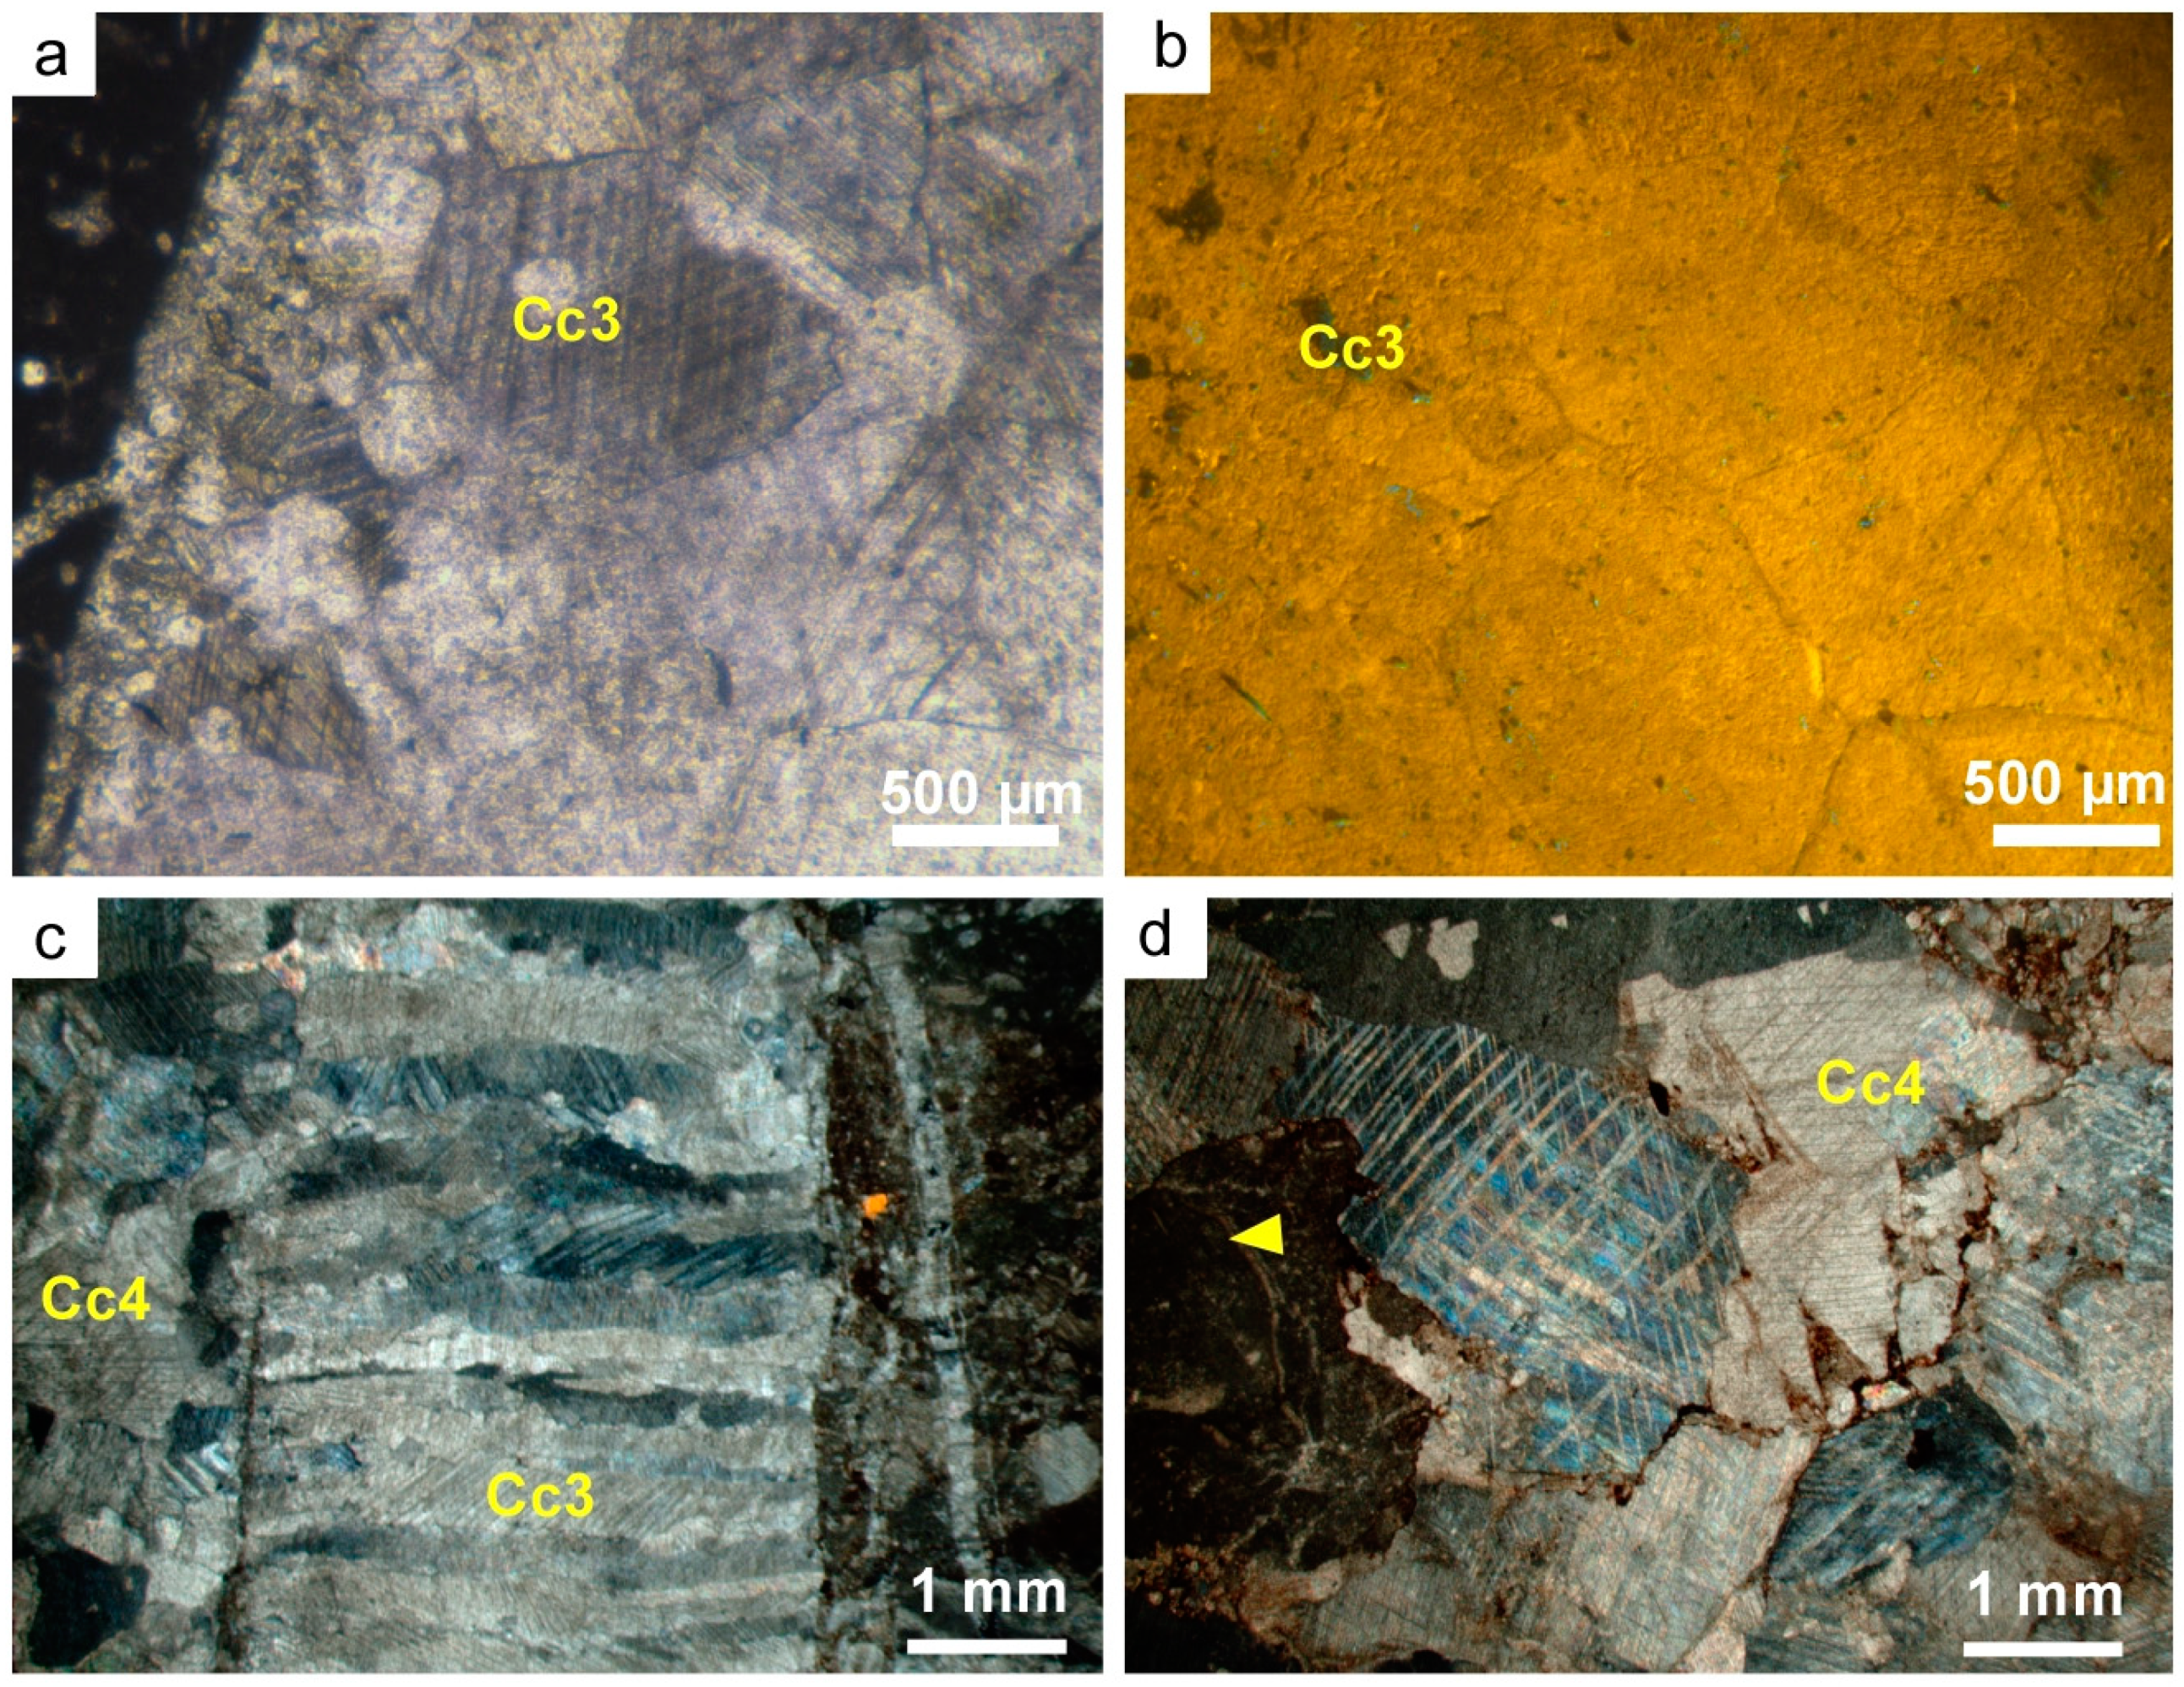
4.1.4. Fracture Set 4 (F4): NE-SW and NW-SE Conjugate Fractures and Related Calcite Cements Cc3 and Cc4

Fracture Set 4 affects the entire Garumnian sequence and corresponds to NE-SW and NW-SE conjugate fractures dipping between 60° and 85°, which formed as well under a strike-slip stress field (Figure 6). They are 20–40 cm spaced with increasing density towards fault segments of Fracture Set 5 (F5) (Figure 9a) and have opening widths from 3 to 20 mm. Fracture edges are sharp in competent layers, such as conglomerates and lacustrine limestones, whereas in red-mudstones pressure-solution seams create fuzzy edges. Centimetric-scale vuggy porosity is associated with this type of fractures and developed by partial rock dissolution (Figure 9c).
F4 fractures and the associated dissolution vugs are filled with two generations of calcite cements: Cc3 and Cc4. Cc3 consists of both blocky and elongate crystals growing with the c-axis perpendicular to the fracture walls and ranging from 1 to 4 mm long and 0.2 to 0.5 mm wide (Figure 10a–c) and showing an orange to bright yellow luminescence (Figure 10b). Cc4 is characterized by subhedral to anhedral blocky calcite crystals ranging in size from 0.1 to 2 mm (Figure 10c) with a dull to bright orange luminescence. Twin mechanical planes and evidence of dissolution are present in most of the borders, where spotty accumulation of iron oxides occurs. Cc4 was formed during successive deformation events as it appears extremely reworked. Some relicts of host rock fragments are also observed between Cc4 crystals (Figure 10d).

4.1.5. Fracture Set 5 (F5): NW-SE and NE-SW Conjugate Strike-Slip Faults Filled with Calcite Cement Cc4

Both NW-SE right-lateral and NE-SW left-lateral conjugate strike-slip faults affect three of the studied units (Lluçà and Santa Fe Formations, and Garumnian facies), dipping from 50° to 90° both to the south and north. They intersect bedding at high angles and show moderate displacements, from centimeters up to a few meters. A right-lateral strike-slip fault (the Segre Fault) with 100 m of horizontal offset that juxtaposes the Lower Cretaceous Lluçà Formation against the Paleocene Garumnian facies was studied (Figure 9d). In this location, deformation is mainly accommodated along a 2–3 m wide fault core. In other areas, these faults truncate and displace Mesozoic and Paleocene units to their current configuration (Figure 3 and Figure 9e). In competent layers of the Garumnian facies, such as conglomerates and lacustrine limestones, deformation is localized on discrete planar polished slip surfaces with displacements ranging from a few centimeters to a few meters. Sub-horizontal slickenlines developed on fault planes indicate a pure strike-slip motion. In incompetent red mudstone beds deformation is diffuse through centimetric shear bands with associated drag folds. In major fault segments, deformation is accommodated along a fault core up to 1 m thick, represented by a brittle incohesive fault rock formed by host rock fragments, earlier cements and fractured veins. F5 strike-slip faults are filled by calcite cement Cc4 described above.

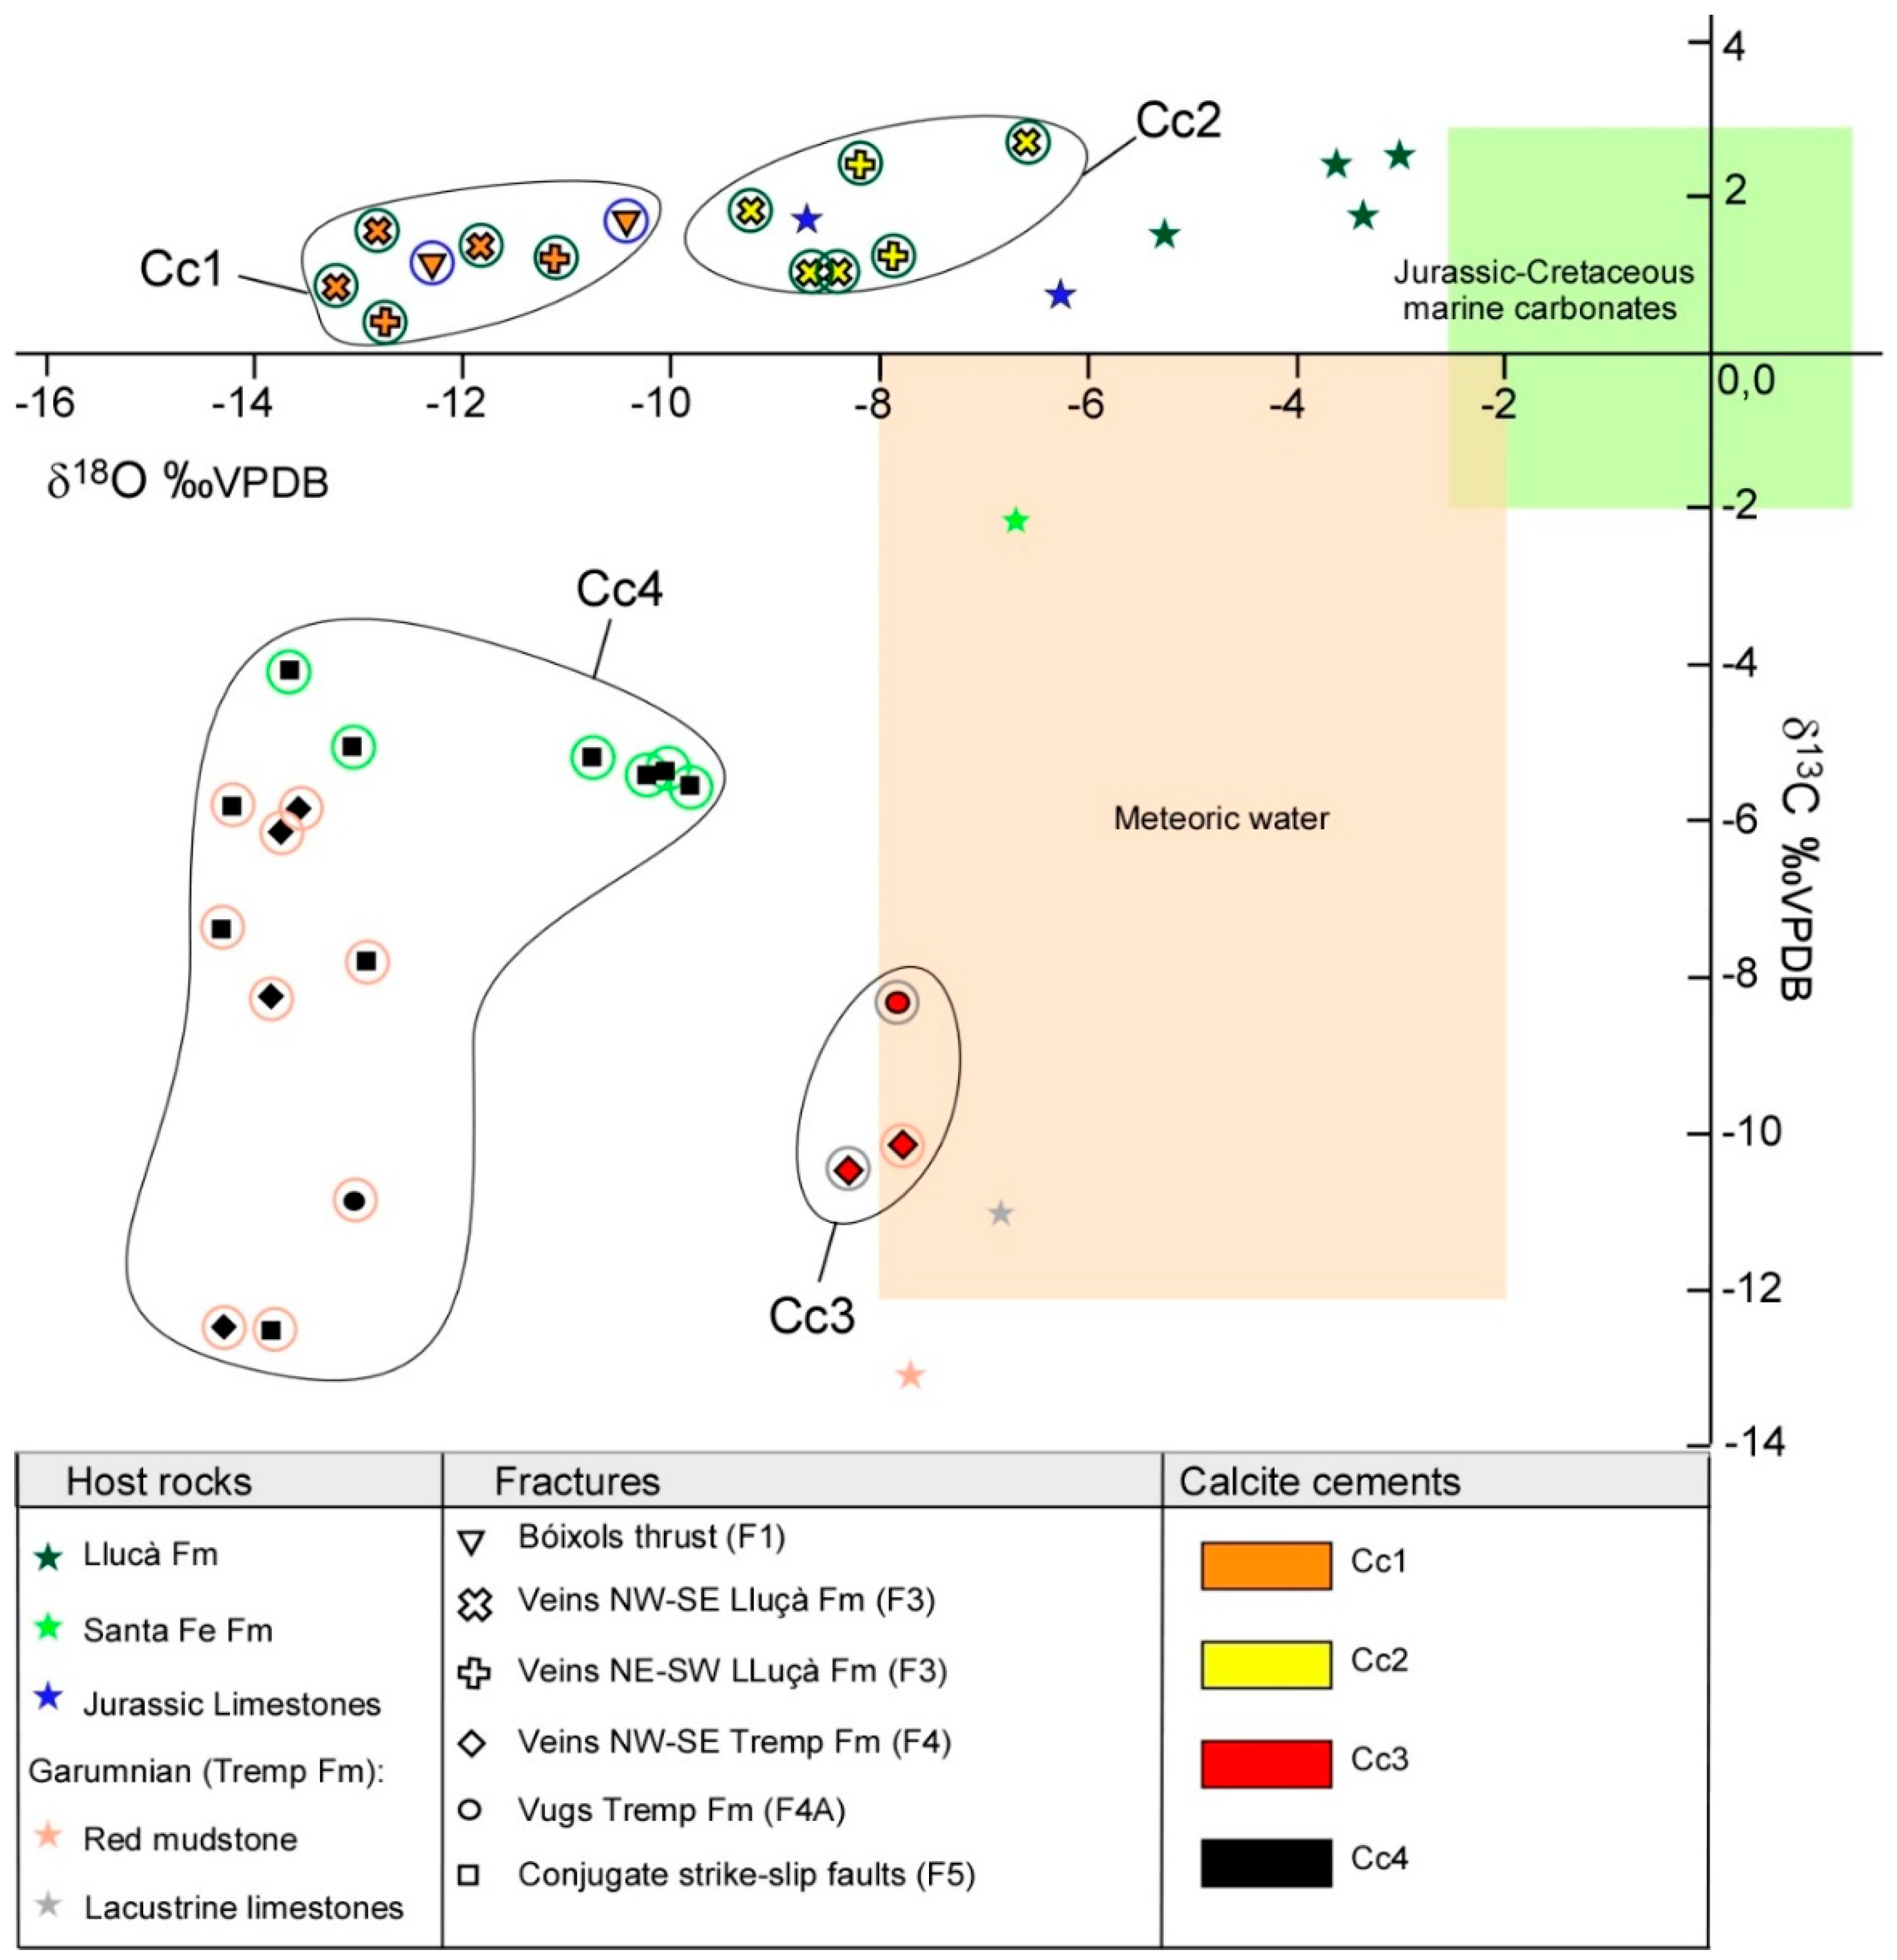
4.2. Oxygen and Carbon Isotopes

The oxygen and carbon isotopic composition of host rocks and calcite cements are represented in Figure 11 and summarized in Table 1. Host rocks from the Lluçà Formation have δ18O values ranging from −5.1 to −3‰ VPDB, and δ13C from +1.6 to +2.5‰ VPDB. The Santa Fe Formation host rock displays δ18O values of −6.6‰ VPDB and δ13C of −2.1‰ VPDB. The Jurassic marine limestones show δ18O values from −8.7 to −6.2‰ VPDB and δ13C from +0.7 and +1.7‰ VPDB. The continental Garumnian facies host rocks have δ18O compositions ranging from −7.7 to −6.6‰ VPDB and in δ13C from −13.1 to −11‰ VPDB.
Cc1 ranges in δ18O values from −13.2 to −10.4‰ VPDB and δ13C from +0.4 to +1.7‰ VPDB. Cc2 shows δ18O values from −9.2 to −6.6‰ VPDB and δ13C from +1 to +2.7‰ VPDB. Cc3 shows δ18O values from −8.3 to −7.8‰ VPDB and δ13C from −10.4 to −8.3‰ VPDB. Finally, Cc4 is characterized by δ18O values from −14.3 to −9.9‰ VPDB and δ13C from −12.5 to −4.1‰ VPDB.

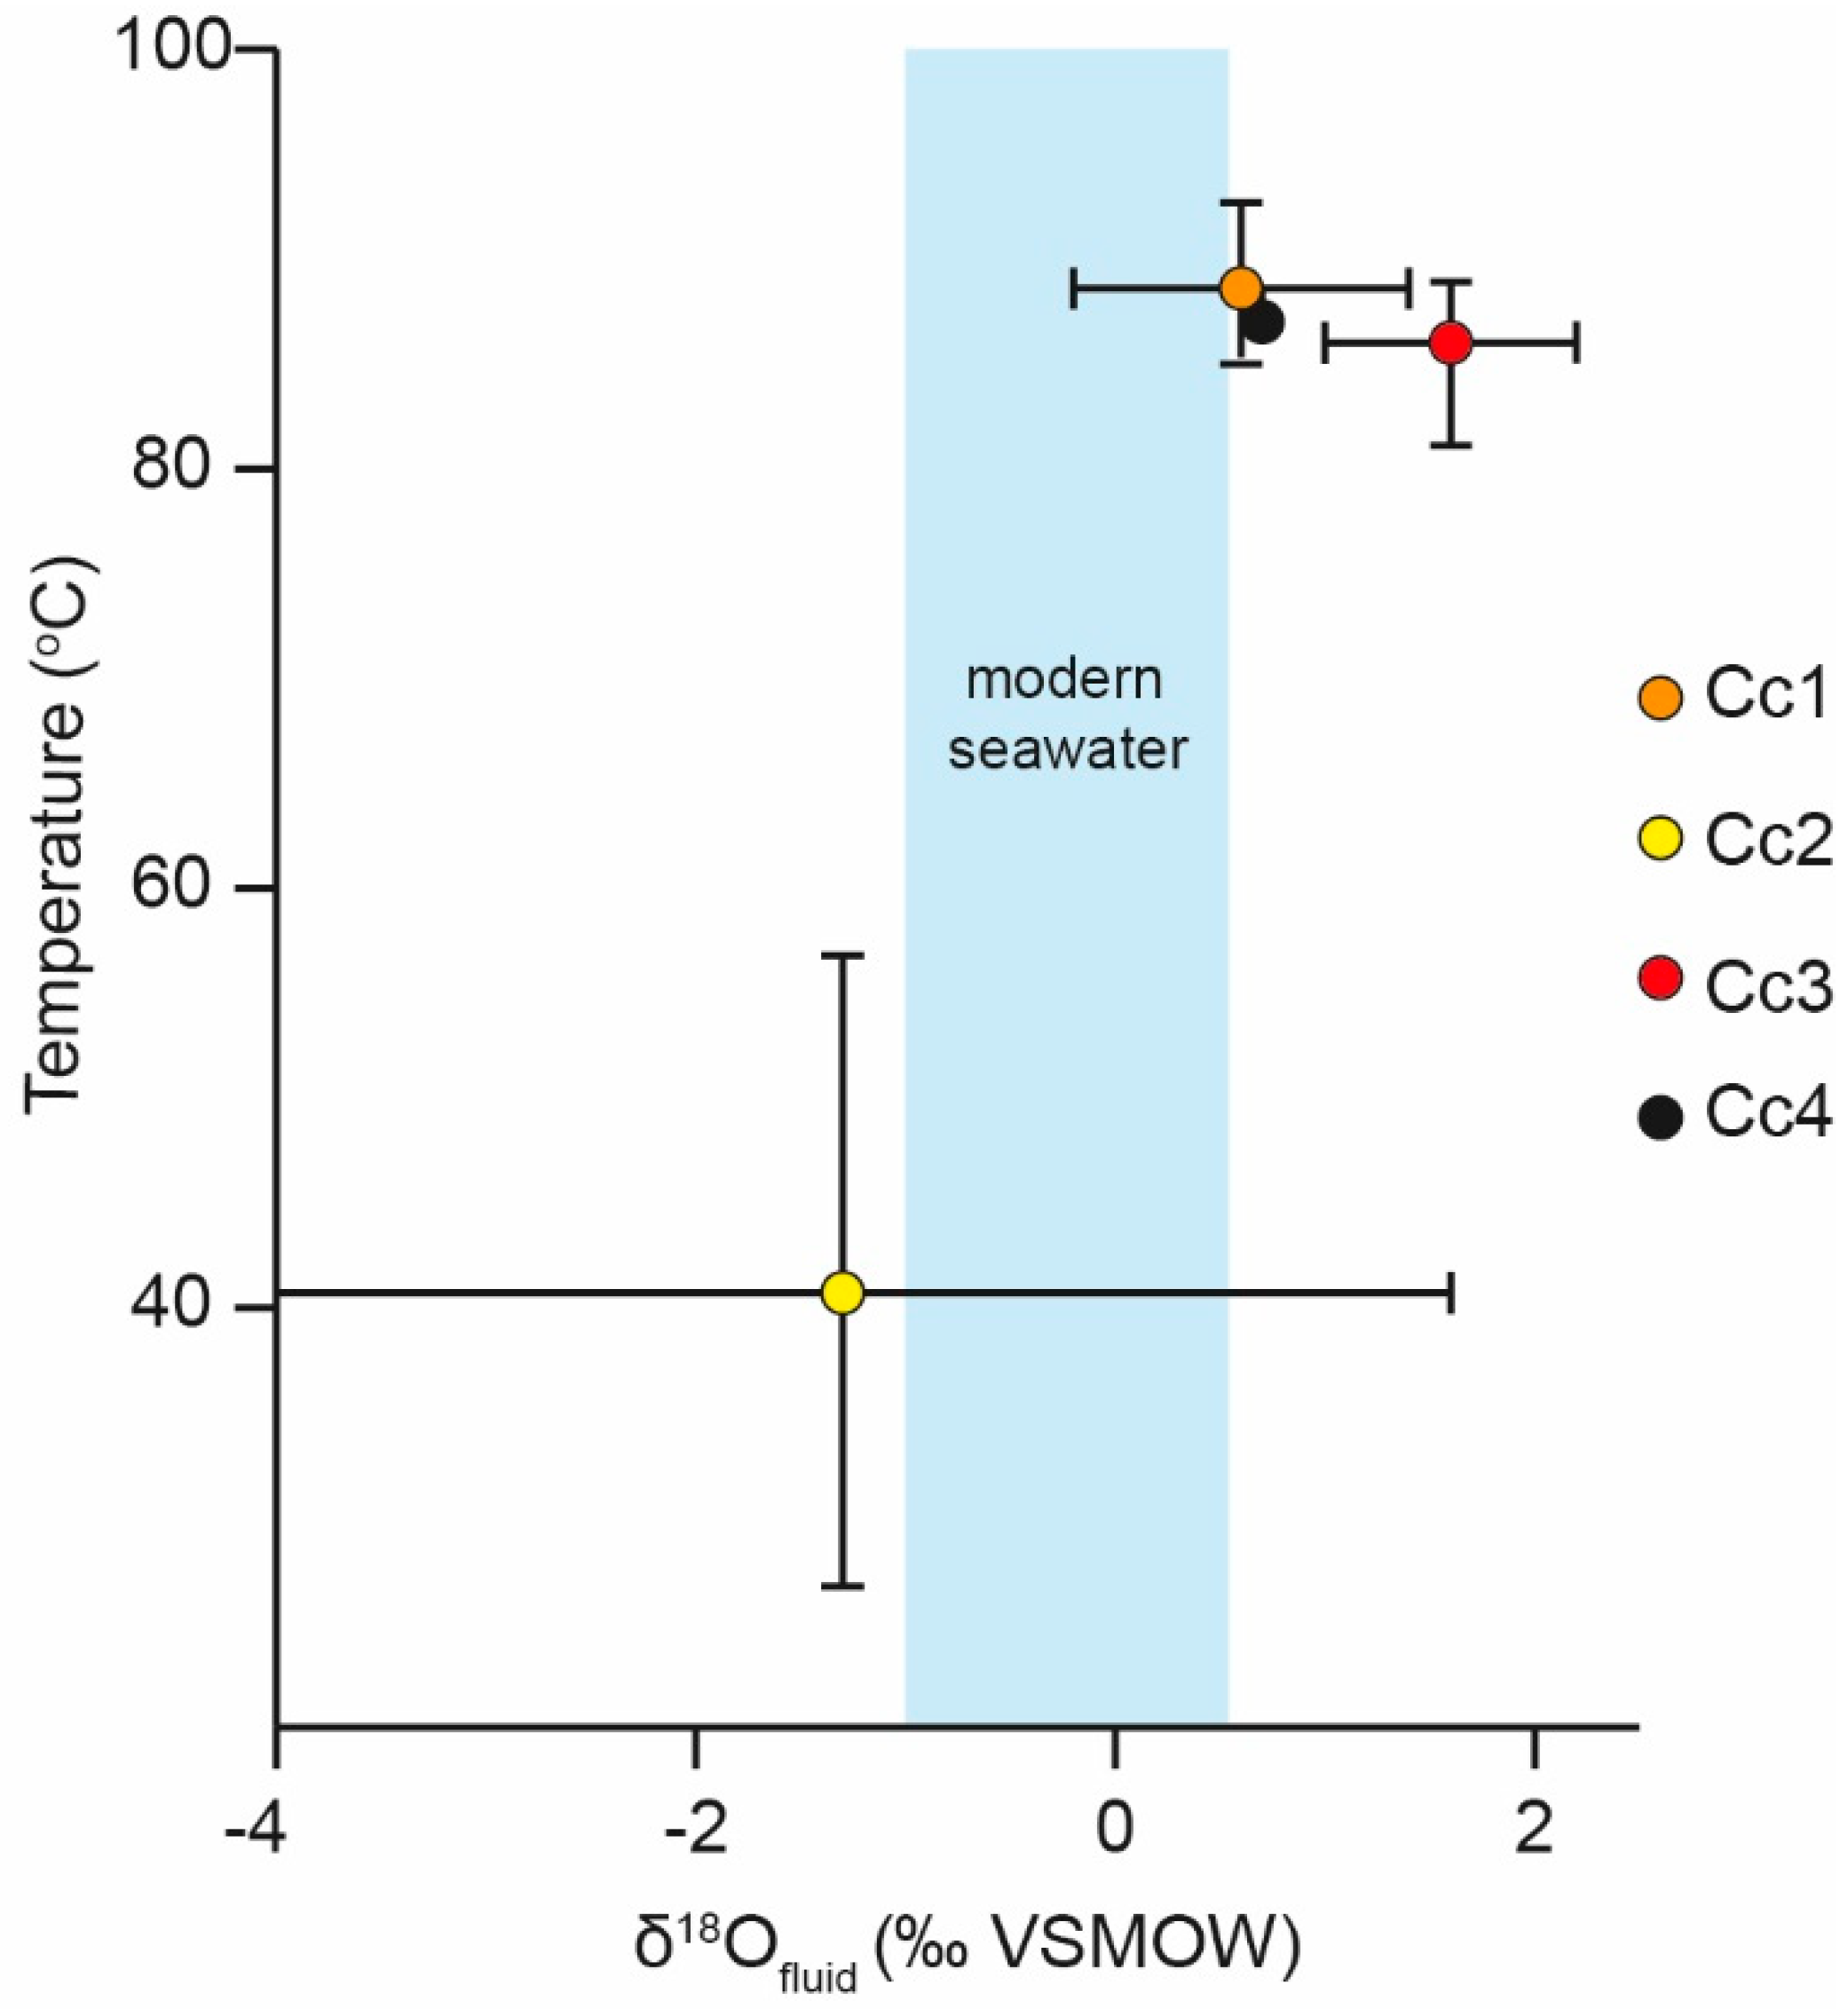
4.3. Clumped Isotopes

The measured Δ47 values from clumped isotope thermometry of the different calcite cement generations were converted into temperatures and δ18O values of the precipitating fluid using the equations of [87] and [92], respectively. These values are summarized in Table 2 and Figure 12.

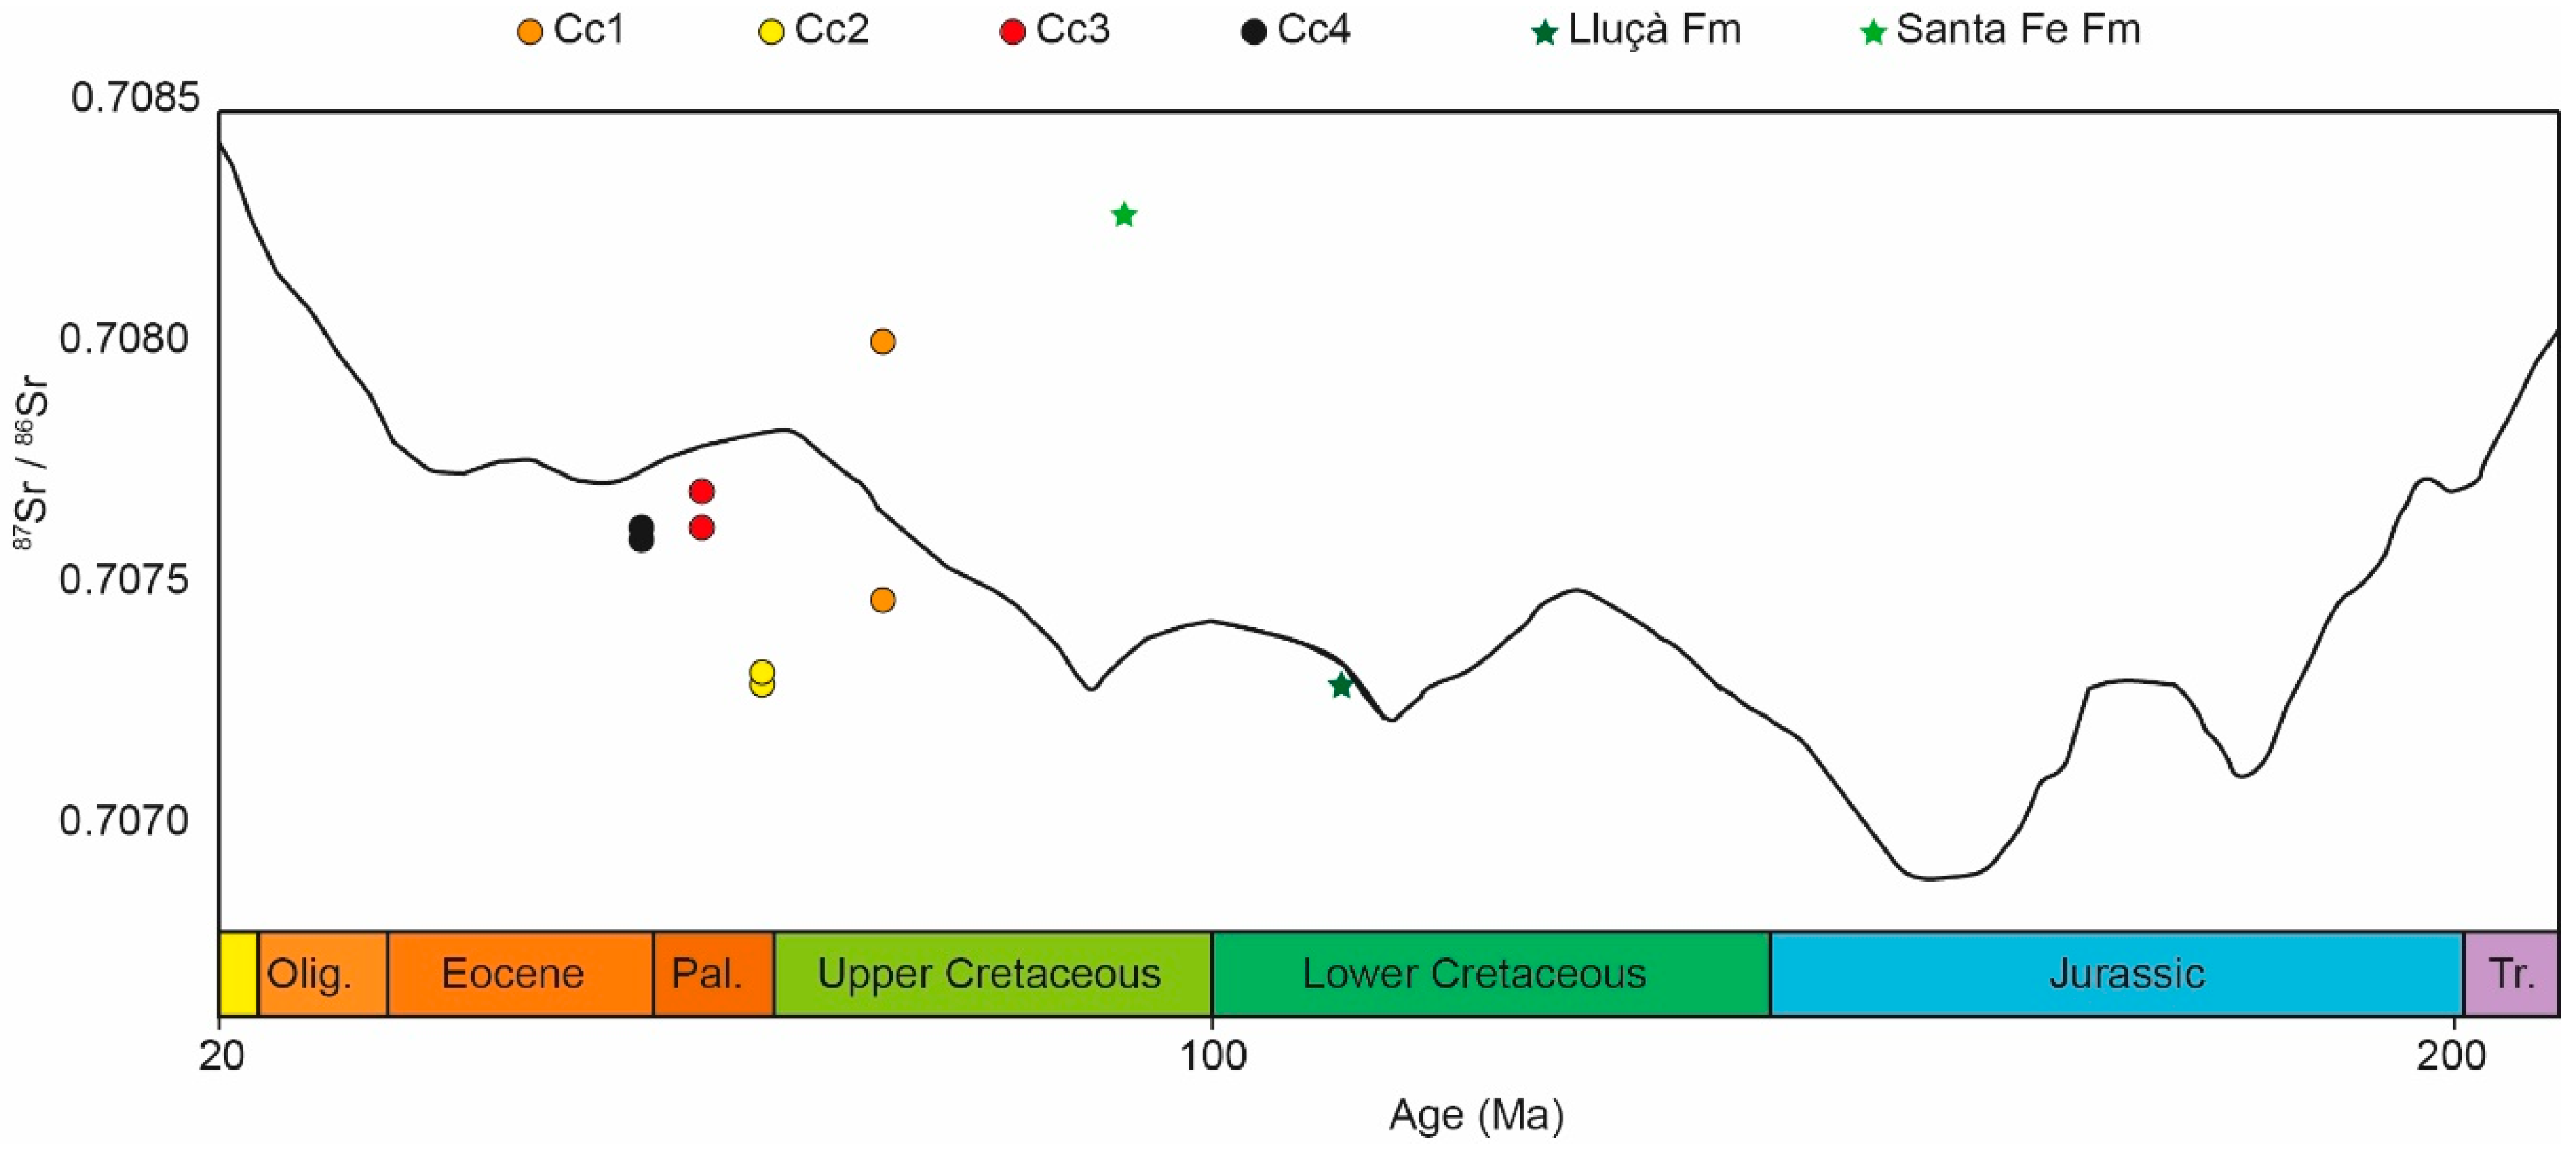
4.4. Strontium Isotopes

The 87Sr/86Sr ratios of host rocks and calcite cements are represented in Figure 13. Host rocks from the Lluçà Formation have a 87Sr/86Sr ratio of 0.707317 (CN12) whereas host rocks from the Santa Fe Formation have a 87Sr/86Sr ratio of 0.708329 (CN16). Cc1 ranges in 87Sr/86Sr values from 0.707468 to 0.708028 (CN33 and CN27), Cc2 between 0.707298 and 0.707326 (CN38 and CN12), Cc3 between 0.707614 and 0.707706 (CN20 and CN18) and Cc4 between 0.707586 and 0.707612 (CN6 and CN15).

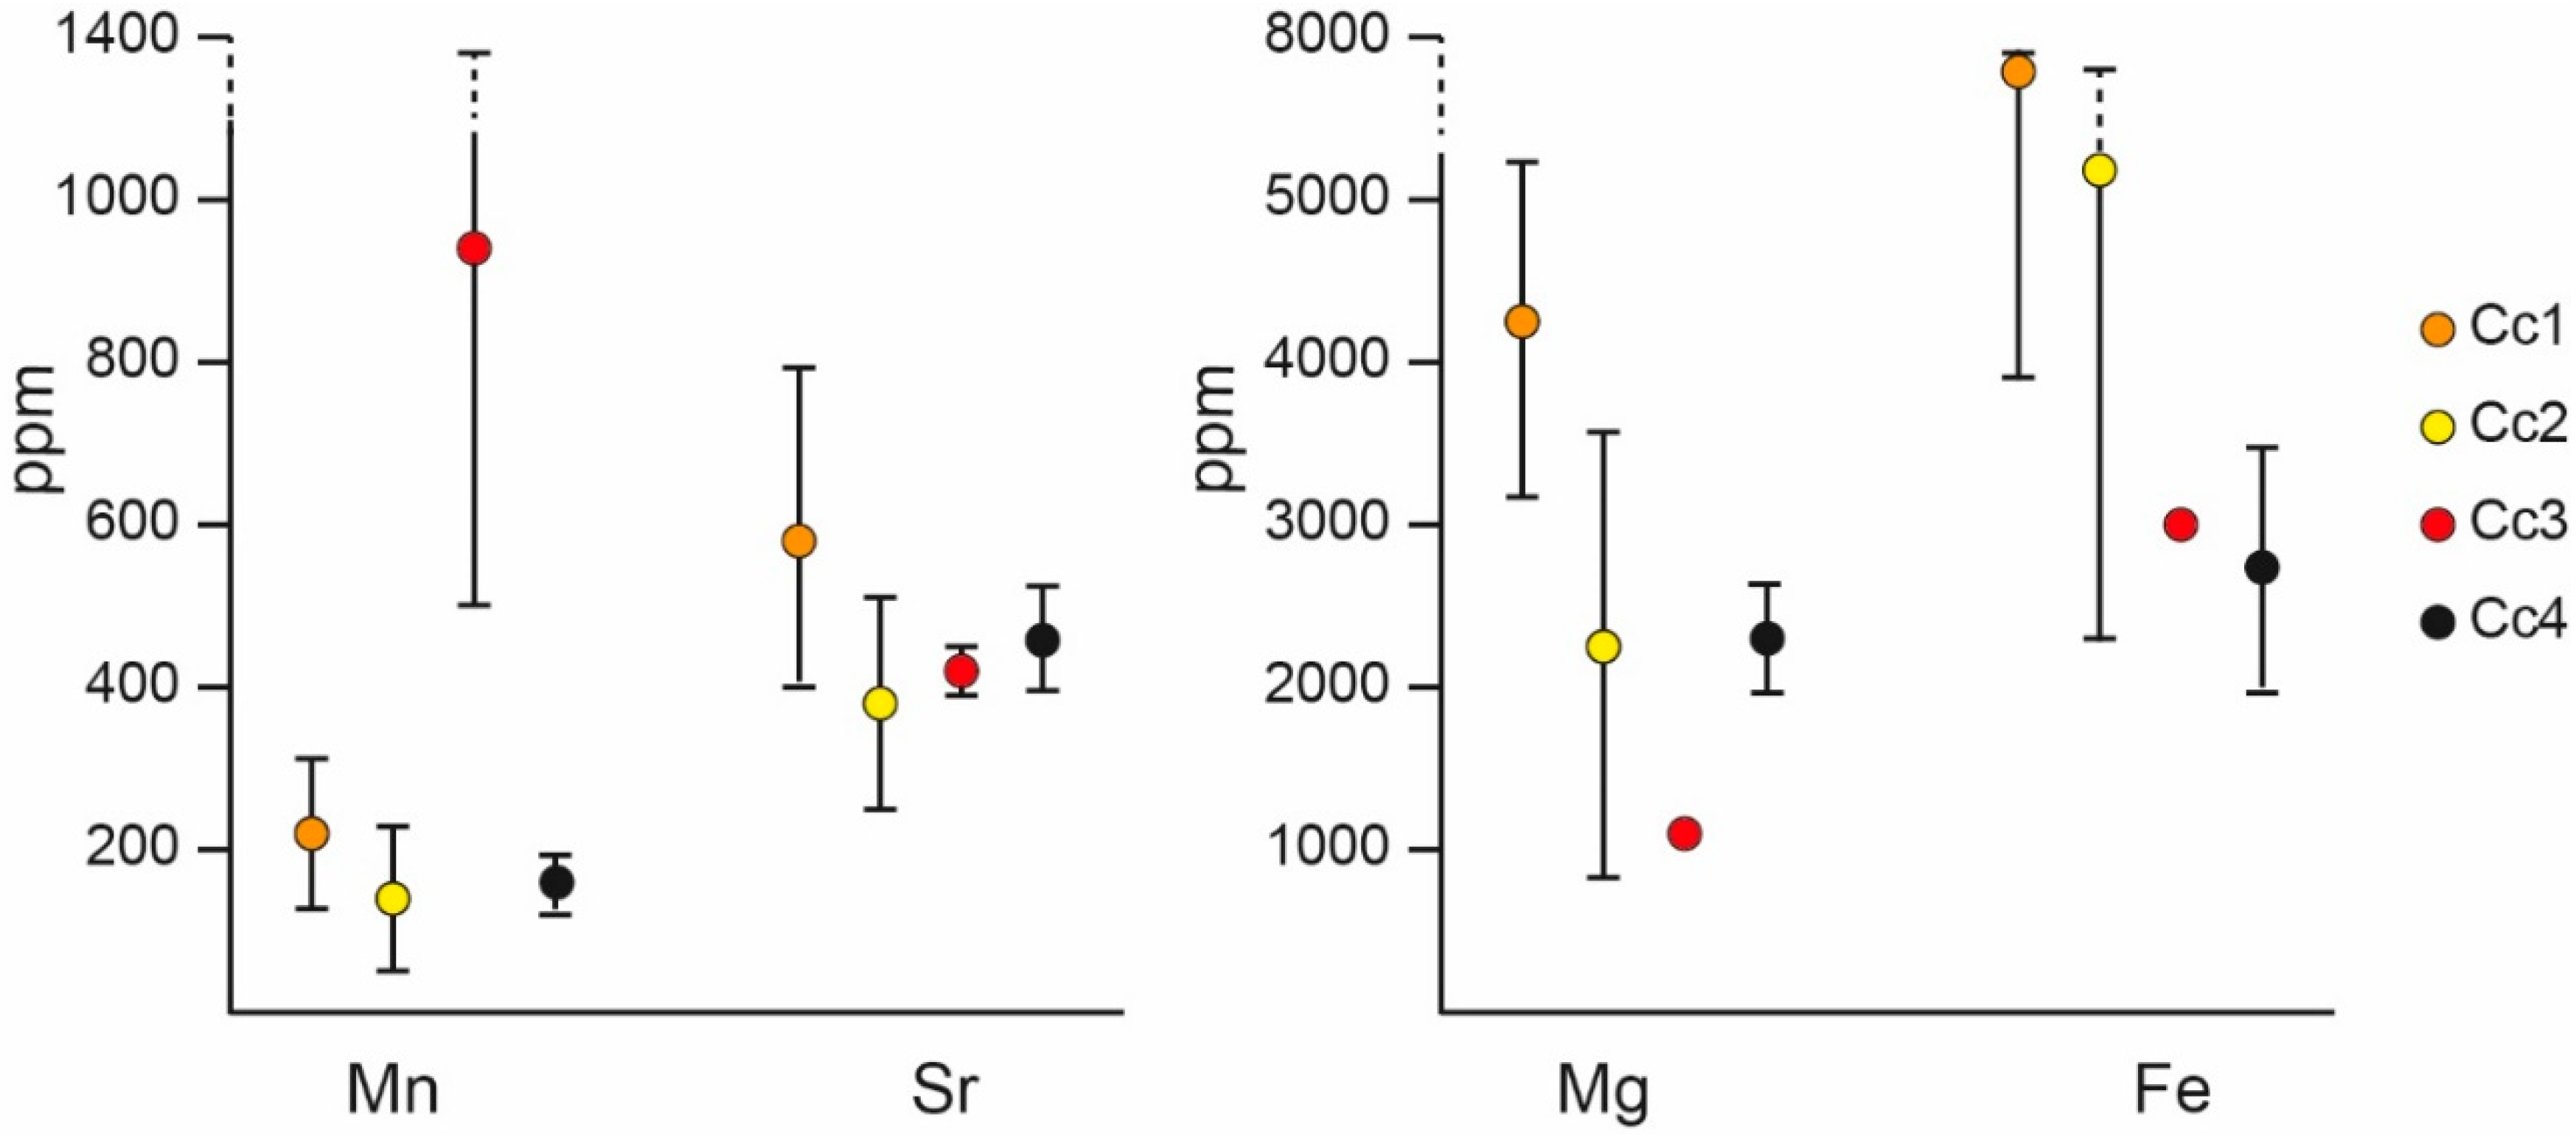
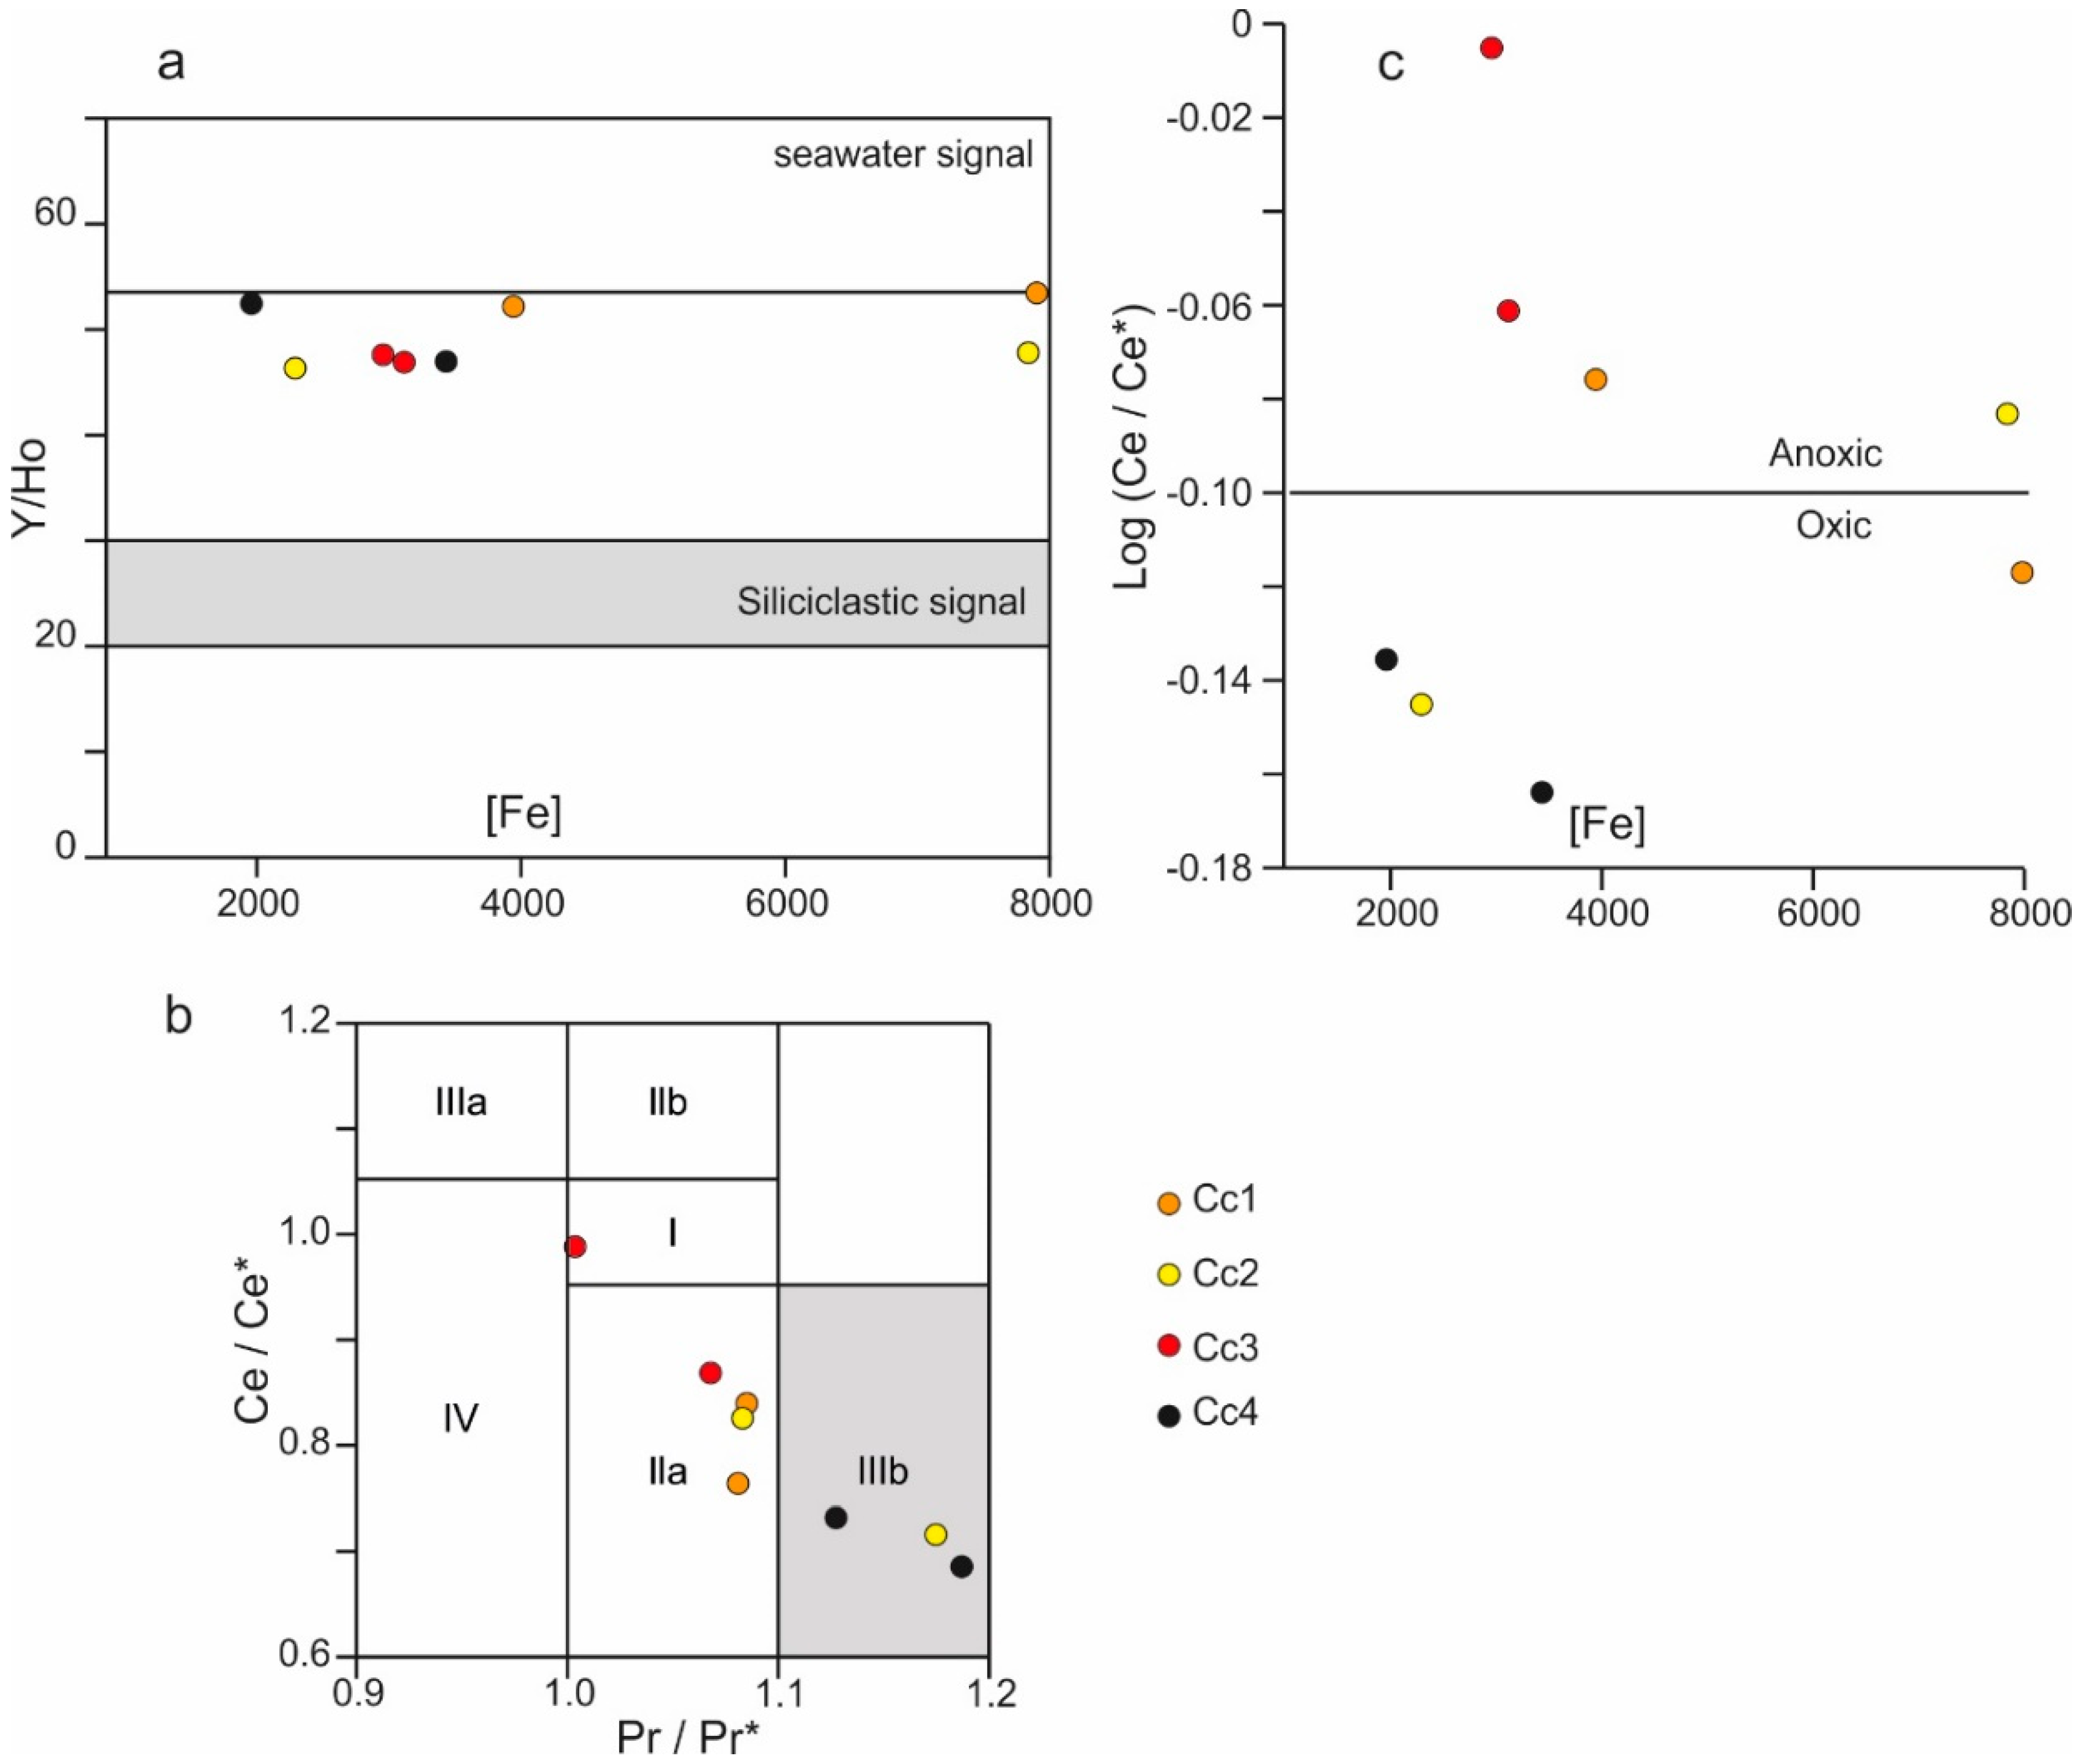
4.5. Elemental Composition

Elemental composition (major and REE + Y) was measured in the four generations of calcite cements. The main analyzed elements used for discussion are summarized in Table 3. The minimum and maximum Mn, Sr, Mg and Fe contents are also represented in Figure 14. For the complete elemental composition of the cements, see Supplementary Data.
In the case of REE and Yttrium, four variables were used in order to better understand and constrain their variation among the different generation of calcite cements [94,95] (Figure 15): Y/Ho, Ce anomalies (Ce/Ce *), Pr anomalies (Pr/Pr *) and Log(Ce/Ce *). REE + Y have been normalized with respect to post Archean Australian Shale (PAAS) [96]. Ce and Pr anomalies were calculated following the equation of [97] and [98]. The four calcite cement generations show Y/Ho ratios ranging between 46.3 and 53.4 (Figure 15a). Cc1, Cc3 and one sample of Cc2 have positive La anomalies (field IIa), whereas Cc4 and one sample of Cc2 show negative Ce anomalies (field IIIb) (Figure 15b). and Log(Ce/Ce *) values higher than −0.10, in the case of Cc3 and some samples from Cc1 and Cc2, and lower than −0.10 in the case of Cc4 and some samples from Cc1 and Cc2 (Figure 15c).

5. Discussion

5.1. Host Rock Diagenesis

This study analyzes fractures and calcite cements hosted in four different rock units. The Jurassic limestones, Lower Cretaceous marls and marly limestones (Lluçà Fm), and Upper Cretaceous limestones (Santa Fe Fm) belong to the hanging wall of the Bóixols thrust sheet, whereas the Paleocene continental series (Garumnian facies) belongs to the footwall. The host rocks from the hanging wall show δ13C values in good agreement with carbonates precipitated from Jurassic and Cretaceous seawater, but δ18O values are depleted with respect to marine standard values [91] (Table 1, Figure 11). This depletion in δ18O is interpreted to result from the increase of temperature and host rock alteration during progressive burial [103]. Finally, isotopic values from Paleocene continental facies are consistent with deposition in freshwater [104], including paleosoils and lacustrine water carbonates that contain organic matter [105].

5.2. Validity of Clumped Isotope Thermometry

The use of clumped isotopes in order to establish the temperature and δ18O of the fluid responsible for calcite precipitation is relatively new, and thus under validation, but it is providing promising results in the research field of diagenesis [106,107,108,109]. In this study, clumped isotopes analyses were performed in cements Cc1 to Cc4 obtaining temperatures of about 85–87 °C and δ18Ofluid around +1‰ VSMOW in Cc1, Cc3 and Cc4, and temperatures of about 40 °C and δ18Ofluid around −1‰ VSMOW in Cc2. Clumped isotopes can potentially be reset by recrystallization and by open-system to closed-system isotope-exchange reactions and diffusion within the mineral lattice [110,111]. In our samples, evidence of calcite recrystallization, such as grain coarsening due to grain boundary migration, is not observed. On the other hand, our vein samples have been buried at a maximum depth of 3 km during the Oligocene to the earliest Miocene, due to the deposition of syntectonic continental conglomerates [112] under a geothermal gradient about 30 °C/km, and probably lower, typical of orogenic systems. Using the parameters of [113] with the aforementioned conditions, burial temperature never exceeded 90 °C and therefore clumped isotopes could not have been modified by intra-crystal diffusion processes, as solid-state reordering requires temperatures above 100–120 °C for a time period of at least 10 million years [114]. Therefore, we can conclude that there is little chance for the clumped isotope to be reset and thus, they registered the circulation of a high-temperature fluid with a similar origin in three different stages (Cc1, Cc3 and Cc4) and a low-temperature fluid (Cc2).

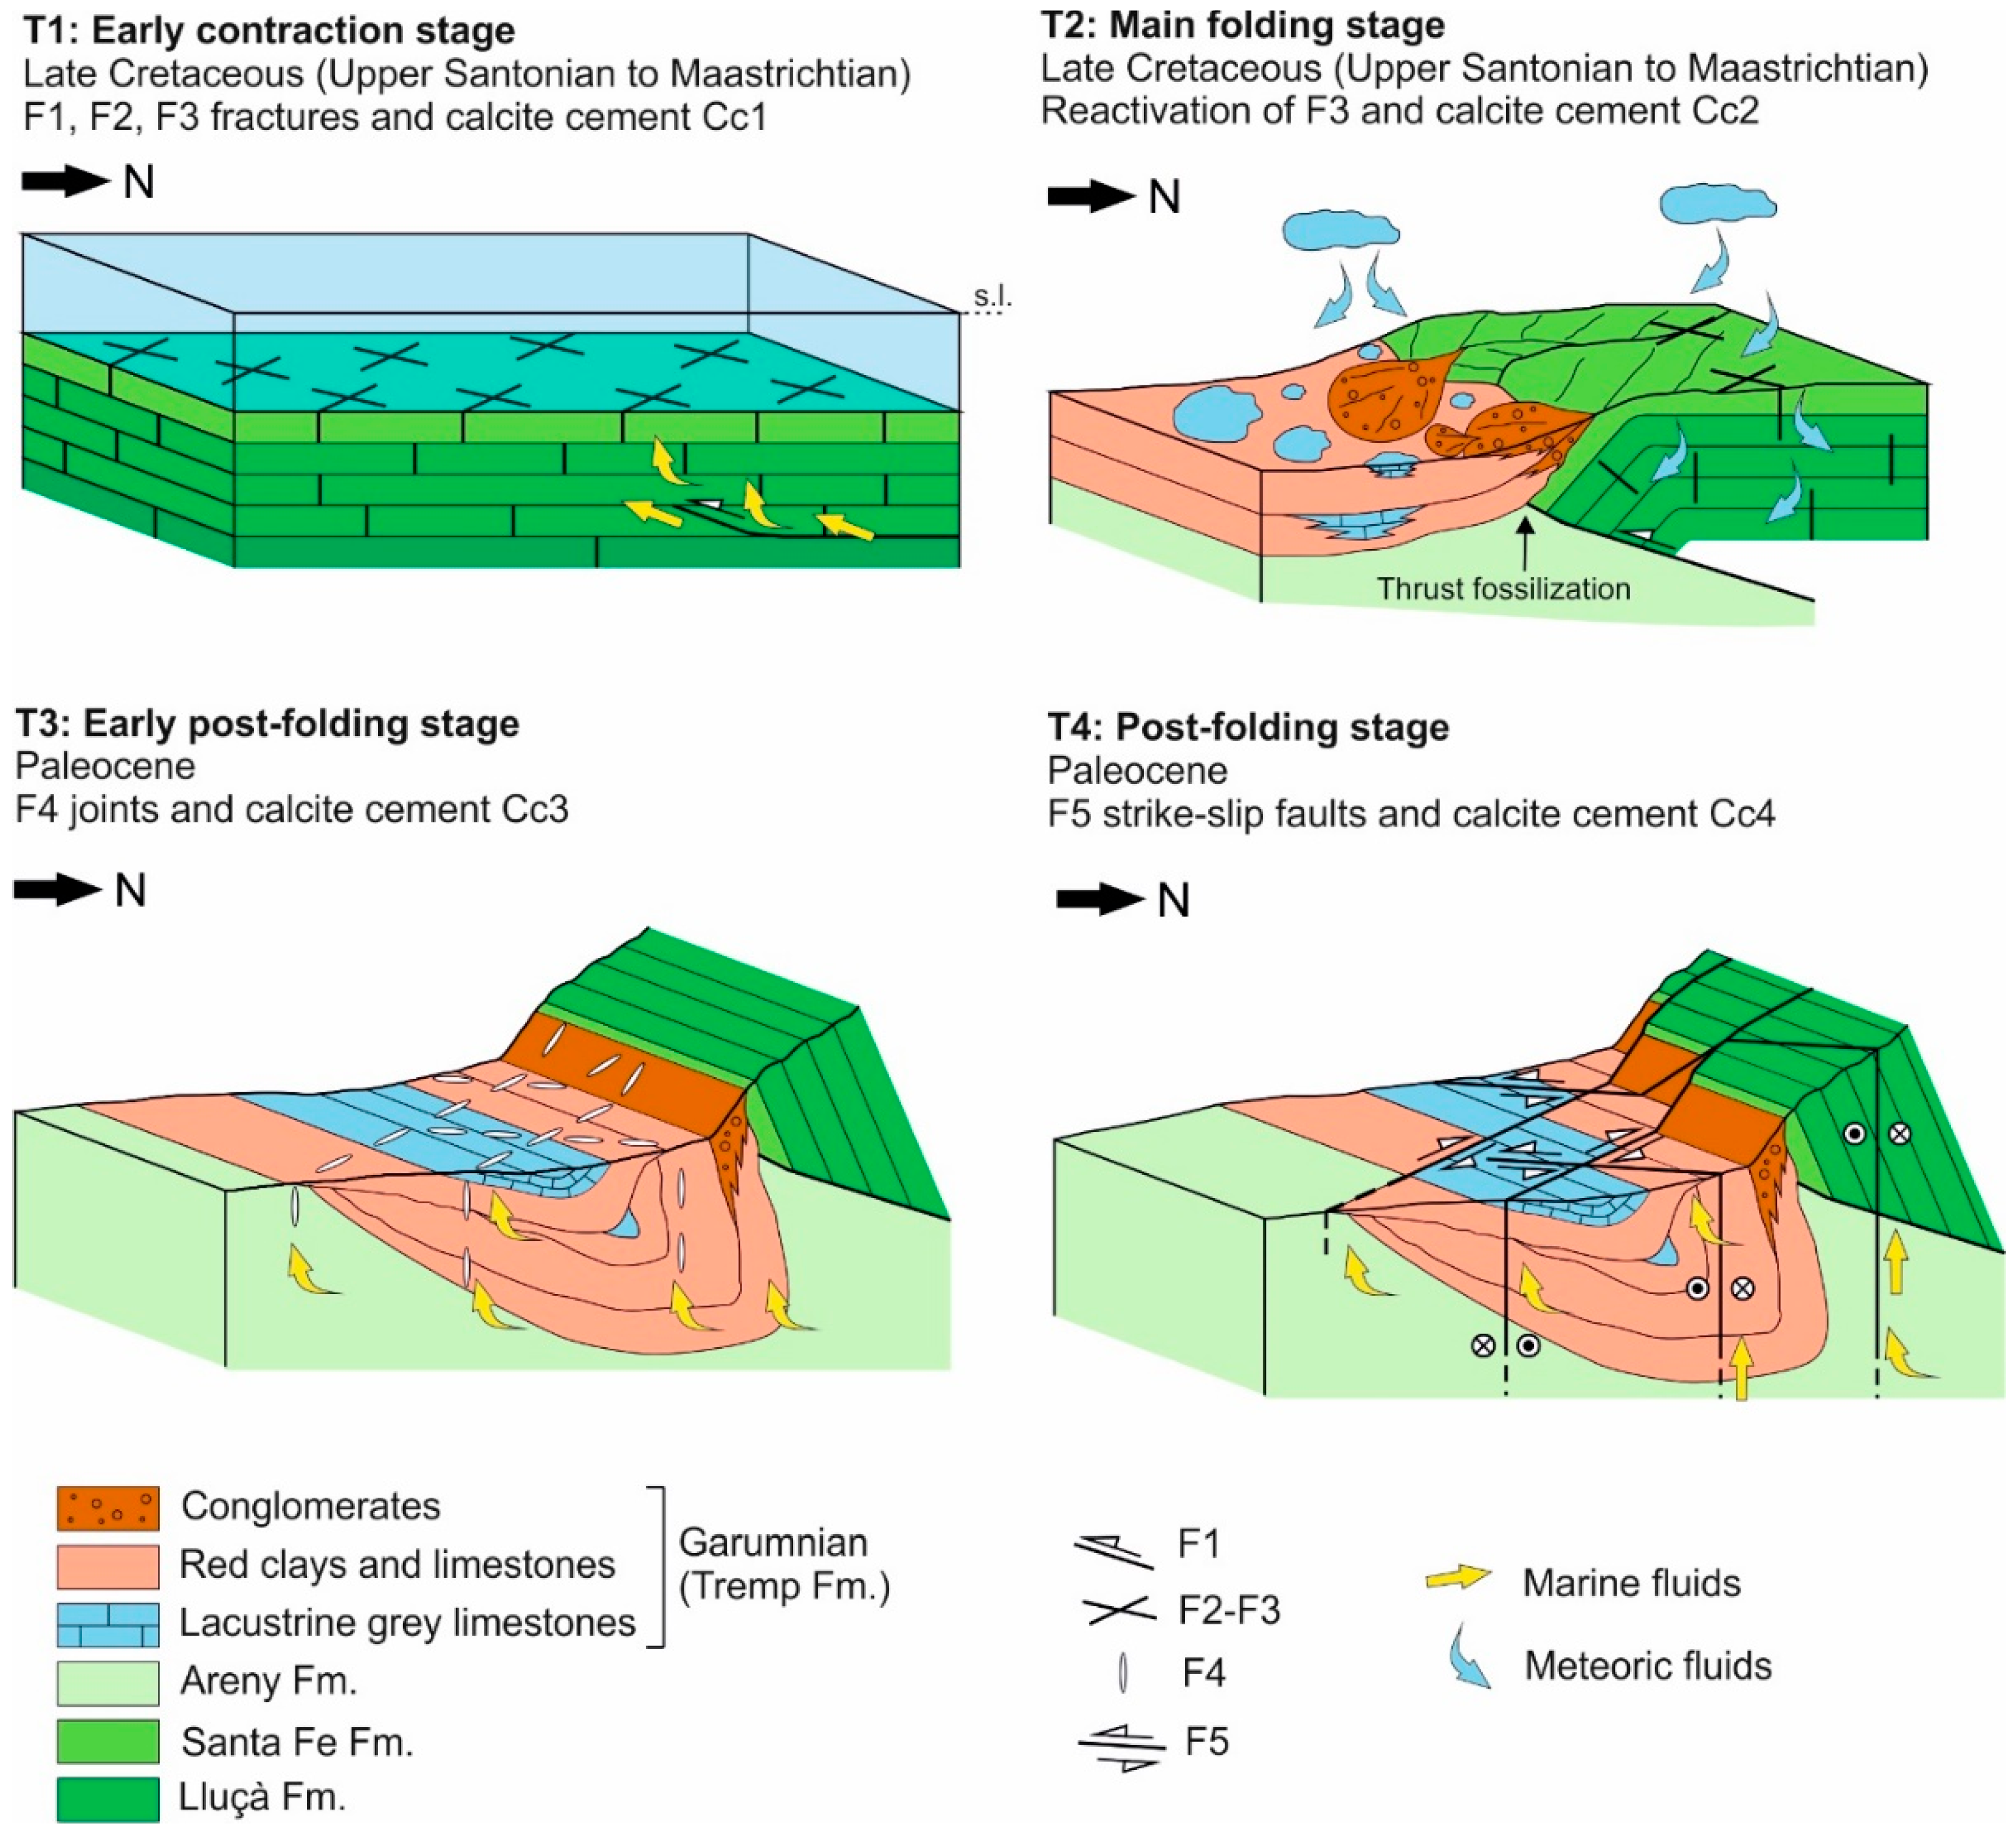
5.3. Fluid-Flow Model: Fracture Development and Related Migrating Fluids

The integration of structural, petrological and geochemical analyses of calcite cements and related host rocks allows us to propose the fluid-flow model for the frontal part of the Bóixols thrust sheet from early contraction to post-folding stage.

5.3.1. Early Contraction Stage (T1)

During the early contraction stage (T1), the emplacement of the Bóixols thrust (F1) occurred together with the development of the two bed-perpendicular fracture sets (F2 and F3), which affect the Santa Fe and Lluçà Formations, respectively (Figure 16). Such a synchronicity is deduced by the orientation of these fractures with respect to the shortening direction, as has also been proposed in other studies carried out in the western sector of the Bóixols anticline [89] and the presence of Cc1 in sets F1 and F3.
Calcite cement Cc1 precipitated within the Bóixols thrust (F1) and related conjugate fracture sets F3. The similarity between δ13C values of Cc1 (+0.4 to +1.7‰ VPDB) and host carbonates (+1.6 to +2.5‰ VPDB), indicates high fluid-rock interaction and the buffering of the carbon isotopic composition of the circulating fluid. The δ18Ofluid calculated from clumped isotope thermometry for Cc1 (0.6 ± 0.8‰ VSMOW) falls within the range of seawater values [91] and the 87Sr/86Sr ratio (0.707468) is consistent with the values of Lower Cretaceous marine carbonates (0.707167 to 0.707492) [91,93]. In addition, the high Mg and Sr contents (Figure 14) are consistent with the values of original seawater and the high Y/Ho ratio (>36) (Figure 15a) also supports a seawater origin but with a certain siliciclastic influence [95,115]. Moreover, the Log(Ce/Ce *) values above and below −0.10 (Figure 15c) and the large oscillation in the Fe content may indicate fluctuation between oxic and anoxic conditions in this seawater and also supports a siliciclastic influence [116]. Additionally, the depletion in δ18O values of Cc1 (between −13.2 and −11.1‰VPDB) with respect to the Lower Cretaceous carbonates (−5.1 to −3‰ VPDB) (Figure 11) is explained by the relatively high temperature calculated for this cement with clumped isotope thermometry, between 85 °C and 92 °C (Figure 12). Therefore, although percolation of penecontemporaneous seawater through the strata at the time of vein formation cannot be discarded, the elevated temperatures obtained from geochemical analyses, together with the low abundance and small dimensions of Cc1 veins, suggest that Cc1 precipitated from connate Cretaceous seawater trapped in the host rock porosity, which was heated during progressive burial and expelled during compaction associated with the emplacement of the Bóixols thrust sheet. Such a dewatering of marine host rocks during thrusting has also been reported in other thrust faults in the Pyrenees [24]. However, one sample from the Bóixols thrust-related deformation (F1) has a considerably higher 87Sr/86Sr ratio (0.708028). This more radiogenic value could be explained by the interaction of the mineralizing fluid with Triassic sediments which constitute the detachment level of the Bóixols thrust and/or the siliciclastic fraction of marls of the Lluçà Fm and underlying formations.

5.3.2. Main Folding Stage (T2)

During the main folding stage (T2) (Figure 16), the conjugate fracture sets F3 were reactivated allowing the migration of a fluid from which calcite cement Cc2 precipitated. This is evidenced by the presence of two striae sets showing dip-slip and strike-slip kinematics (Figure 8d) and the coexistence of two calcite cements (Cc1 and Cc2) with clear cross-cutting relationships (Figure 8e,f).
The δ18Ofluid calculated from clumped isotope thermometry for Cc2 (−1.3 ± 2.9‰ VSMOW) and its temperature (between 27 °C and 57 °C) are interpreted as the infiltration of meteoric fluids during progressive uplift, folding and fossilization of the Bóixols thrust by the continental Paleocene Garumnian facies, which mixed with previous local and connate marine waters (Figure 16). The 87Sr/86Sr values of Cc2 (between 0.707298 and 0.707326) and δ13C (from +1 to +2.7‰ VPDB) are consistent with the values of Lower Cretaceous marine host carbonates. These meteoric waters lowered the Mg, Sr, Fe, and Mn contents with respect to Cc1, due to its low saturation (Figure 14). Also, the Y/Ho, the Ce and La anomalies between IIa and IIIb fields and the log(Ce/Ce *) show a major siliciclastic signal and oxidizing-reducing transitional conditions typical of the meteoric environment.

5.3.3. Early Post-Folding Stage (T3)

The NE-SW and NW-SE conjugate Fracture Set F4 and its related calcite cement Cc3 developed during the latest folding stage (T3) (Figure 16). The orientation of F4 remains constant regardless of the different bedding dips, indicating that they developed once the strata had already been folded and turned vertically.
The calcite cement Cc3 shows positive δ18Ofluid values, around +1.6 ± 0.6‰ VSMOW, which can indicate the end of the meteoric water input and again the upflowing of trapped marine waters or fluid interaction with silicate minerals. Late Cretaceous evaporated seawater is the most probable source for this cement, if we take into account that (i) the 87Sr/86Sr ratios (0.707614–0.707706) are consistent with the values of Late Cretaceous seawater [90,93], and that (ii) during the Late Cretaceous there was a transition between marine to lagoonal-lacustrine environments in the study area [77] and, in consequence, to more restricted and evaporative conditions. The depletion in δ18O (from −8.3 to −7.8‰ VPDB) is attributed to the relatively high temperature of the precipitating fluid (between 81 °C and 89 °C). On the other hand, the depletion in δ13C values (from −10.4 to −8.3‰ VPDB) with respect to typical marine carbonates [91,104], as well as the relatively low Mg and high Mn contents (Figure 14) are explained by the combined effect of burial diagenesis and the interaction between the original seawater with Paleocene continental host rocks. Therefore, Cc3 precipitated from upflowing evolved evaporated marine fluids heated at depth and expelled from rock porosity by sediment compaction during progressive deformation and fold tightening. The Y/Ho ratio, the presence or absence of La anomaly and the Log(Ce/Ce *) values above −0.10 (Figure 15) indicate a clear influence of siliciclastic sediments, represented by the Garumnian facies, and suboxic to anoxic paleo redox conditions [97,117].

5.3.4. Post-Folding Stage (T4)

During the post-folding stage (T4), two conjugate sets of NW-SE and NE-SW right-lateral and left-lateral strike-slip faults F5 developed (Figure 16), as evidenced by the constant orientation of these faults independently of the dipping of the strata. Previous studies in the Bóixols anticline also attributed these faults to the post-folding stage [89]. Strike-slip faults, observed also in other anticlines worldwide, such as in the Lurestan Province (Zagros Mountains, Iran) are developed when folds reach their maximum amplification and cannot easily accommodate any further orthogonal shortening [118]. These strike-slip faults and conjugate fractures F4 have similar orientations indicating that they formed under the same stress field (Figure 6). As fractures F4 are crosscut by F5 or reactivated as strike-slip faults during T4, they are interpreted as a pre-slip stage of F5. This fracture pattern is similar with the “pump” model of faulting proposed by Reference [119].
The calcite cement Cc4 precipitated in F5 faults and F4 reopened fractures. This cement shows δ18Ofluid values (+0.7 ± 0.2‰ VSMOW), δ18O (from −14.3 to −9.9‰ VPDB), a temperature of precipitation (around 88°C) and 87Sr/86Sr ratios (between 0.707586 and 0.707612) similar to those obtained for Cc3, indicating that Cc4 also precipitated from heated upflowing evaporated marine fluids expelled during progressive dewatering of Cretaceous marine host carbonates during deformation in the post-folding stage (Figure 16). The negative Ce anomaly (field IIIb) and the lowest Log(Ce/Ce *) values also supports a marine source but more oxygenated compared to earlier cements (Figure 15) [94,95,120]. On the other hand, the Y/Ho ratios point to a variable degree of siliciclastic influence (Figure 15). As faults F5 crosscut all the outcropping sedimentary units, from Lower Cretaceous marine to Paleocene continental host rocks, this variation may have been produced by the interaction of such fluids with marine (higher Y/Ho ratio) or continental (lower Y/Ho ratio) host rocks. Likewise, the δ13C (from −12.5 to −4.1‰ VPDB) values of Cc4, depleted with respect to marine carbonates [90,93], as well as the relative enrichment in Mg and Sr contents respect to Cc3, are also explained by the interaction between the upflowing evolved marine fluids with the different adjacent host rocks (Figure 16).

6. Conclusions

The integration of structural, petrological and geochemical analyses performed in fracture-related calcite cements and host rocks constrains the spatiotemporal paleo-fluid system in the frontal part of the Bóixols thrust sheet, the oldest thrust sheet of the South-Central Pyrenean Unit. Five different fracture sets were recognized affecting marine Jurassic and Cretaceous rocks from the hanging wall and continental Paleocene rocks from the footwall. These fracture sets and related calcite cements reflect the evolution of the thrust/folding system and the relationship between the tectonic evolution and fluid migration: (1) During the early contraction, two bed-perpendicular NW-SE and NE-SW fracture sets developed and were mineralized with calcite cement Cc1, which precipitated from evolved marine-derived fluids expelled from Lower Cretaceous host rocks; (2) During progressive thrusting and the main folding stage, NW-SE and NE-SW conjugate fracture sets were reopened and the Bóixols thrust was fossilized by continental Paleocene facies, allowing the infiltration of meteoric fluids that mixed with marine connate waters and precipitated calcite cement Cc2; (3) During the early post-folding stage, a NW-SE fracture set developed and calcite cement Cc3 precipitated from evolved evaporated marine fluids expelled from rock porosity during progressive deformation and fold tightening; and, (4) During the post-folding stage, previous NW-SE fractures reopened, two conjugate sets of NW-SE and NE-SW strike-slip faults developed and calcite cement Cc4 precipitated again from marine evolved fluids. The comparison between the isotopic and elemental composition measured in the different fracture-related calcite cements and host rocks, reveals the progressive dewatering of Cretaceous marine host sediments during the progressive burial, deformation and fold tightening and the input of meteoric waters only during the main folding stage.

Supplementary Materials

The following are available online at https://www.mdpi.com/2075-163X/9/2/117/s1, Table S1: Complete elemental composition of the different generations of calcite cements.

Author Contributions

Conceptualization, A.T.; methodology, all authors; formal analysis, all authors; investigation, N.N., D.M.-L., D.C., I.C. and A.T.; data curation, D.M.-L. and N.N.; Writing—Original Draft preparation, N.N. and D.M.-L.; Writing—Review and Editing, A.T., I.C., J.D.M.-M., A.B. and E.G.-R.; visualization, D.M.-L., N.N. and D.C.; supervision, A.T.; funding acquisition, A.T.

Funding

This research was carried out within the framework of DGICYT Spanish Project CGL2015-66335-C2-1-R and the Grup Consolidat de Recerca “Geologia Sedimentària” (2017-SGR- 824).

Acknowledgments

We thank three anonymous referees for their constructive reviews, which helped to improve the quality of the manuscript, together with the editorial guidance of Hairuo Qing. Carbon and oxygen isotopic analyses were performed at “Centre Científics I Tecnològics” of the Universitat de Barcelona. Strontium analyses were carried out at the “CAI de Geocronología y Geoquímica Isotópica (UCM-CEI)” of the Universidad Complutense de Madrid. The clumpled isotope analyses were done in the Qatar Stable isotope Laboratory of Imperial College of London. Elemental and REE composition analyses were performed at the Geochemistry Facility of labGEOTOP of the Institute of Earth Sciences Jaume Almera (ICTJA-CSIC), a cofounded structure by FEDER-UE (Ref. CSIC08-4E-001). EGR acknowledges the support of the Beatriu de Pinós programme of the Government of Catalonia’s Secretariat for Universities and Research of the Department of Economy and Knowledge (2016 BP 00208).

Conflicts of Interest

The authors declare no conflict of interest.

References

  1. Fyfe, W.S.; Price, N.J.; Thompson, A.B. Fluids in the Earth’s Crust: Their Significance in Metamorphic, Tectonic, and Chemical Transport Processes; Elsevier Scientific Pub. Co.: Amsterdam, The Netherlands, 1978; ISBN 9780444601483. [Google Scholar]
  2. Ferry, J.M.; Dipple, G.M. Fluid flow, mineral reactions, and metasomatism. Geology 1991, 19, 211. [Google Scholar] [CrossRef]
  3. Deming, D. Fluid flow and heat transport in the upper continental crust. Geol. Soc. Lond. Spec. Publ. 1994, 78, 27–42. [Google Scholar] [CrossRef]
  4. Garven, G. A hydrogeologic model for the formation of the giant oil sands deposits of the Western Canada sedimentary basin. Am. J. Sci. 1989, 289, 105–166. [Google Scholar] [CrossRef]
  5. Duddy, I.R.; Green, P.F.; Bray, R.J.; Hegarty, K.A. Recognition of the thermal effects of fluid flow in sedimentary basins. Geol. Soc. Lond. Spec. Publ. 1994, 78, 325–345. [Google Scholar] [CrossRef] [Green Version]
  6. Putnis, A. Mineral replacement reactions: From macroscopic observations to microscopic mechanisms. Mineral. Mag. 2002, 66, 689–708. [Google Scholar] [CrossRef]
  7. Trincal, V.; Lanari, P.; Buatier, M.; Lacroix, B.; Charpentier, D.; Labaume, P.; Muñoz, M. Temperature micro-mapping in oscillatory-zoned chlorite: Application to study of a green-schist facies fault zone in the Pyrenean Axial Zone (Spain). Am. Mineral. 2015, 100, 2468–2483. [Google Scholar] [CrossRef]
  8. Gasparrini, M.; Ruggieri, G.; Brogi, A. Diagenesis versus hydrothermalism and fluid-rock interaction within the Tuscan Nappe of the Monte Amiata CO2-rich geothermal area (Italy). Geofluids 2013, 13, 159–179. [Google Scholar] [CrossRef]
  9. Sibson, R.H. Fault rocks and fault mechanisms. J. Geol. Soc. Lond. 1977, 133, 191–213. [Google Scholar] [CrossRef]
  10. Sibson, R.; Scott, J. Stress/fault controls on the containment and release of overpressured fluids: Examples from gold-quartz vein systems in Juneau, Alaska; Victoria, Australia and Otago, New Zealand. Ore Geol. Rev. 1998, 13, 293–306. [Google Scholar] [CrossRef]
  11. Aydin, A. Fractures, faults, and hydrocarbon entrapment, migration and flow. Mar. Pet. Geol. 2000, 17, 797–814. [Google Scholar] [CrossRef]
  12. Van Noten, K.; Muchez, P.; Sintubin, M. Stress-state evolution of the brittle upper crust during compressional tectonic inversion as defined by successive quartz vein types (High-Ardenne slate belt, Germany). J. Geol. Soc. Lond. 2011, 168, 407–422. [Google Scholar] [CrossRef] [Green Version]
  13. Knipe, R.J.; McCaig, A.M. Microstructural and microchemical consequences of fluid flow in deforming rocks. Geol. Soc. Lond. Spec. Publ. 1994. [Google Scholar] [CrossRef]
  14. Ogata, K.; Senger, K.; Braathen, A.; Tveranger, J. Fracture corridors as seal-bypass systems in siliciclastic reservoir-cap rock successions: Field-based insights from the Jurassic Entrada Formation (SE Utah, USA). J. Struct. Geol. 2014, 66, 162–187. [Google Scholar] [CrossRef]
  15. Travé, A.; Labaume, P.; Vergés, J. Fluid Systems in Foreland Fold-and-Thrust Belts: An Overview from the Southern Pyrenees. In Thrust Belts and Foreland Basins; Springer: Berlin/Heidelberg, Germany, 2007; pp. 93–115. [Google Scholar]
  16. Cruset, D.; Cantarero, I.; Vergés, J.; John, C.M.; Muñoz-López, D.; Travé, A. Changes in fluid regime in syn-orogenic sediments during the growth of the south Pyrenean fold and thrust belt. Glob. Planet. Chang. 2018, 171, 207–224. [Google Scholar] [CrossRef] [Green Version]
  17. Cruset, D.; Cantarero, I.; Travé, A.; Vergés, J.; John, C.M. Crestal graben fluid evolution during growth of the Puig-reig anticline (South Pyrenean fold and thrust belt). J. Geodyn. 2016, 101, 30–50. [Google Scholar] [CrossRef] [Green Version]
  18. Fischer, M.P.; Higuera-Díaz, I.C.; Evans, M.A.; Perry, E.C.; Lefticariu, L. Fracture-controlled paleohydrology in a map-scale detachment fold: Insights from the analysis of fluid inclusions in calcite and quartz veins. J. Struct. Geol. 2009, 31, 1490–1510. [Google Scholar] [CrossRef]
  19. Travé, A.; Labaume, P.; Vergés, J. Thrust Belts and Foreland Basins; Lacombe, O., Roure, F., Lavé, J., Vergés, J., Eds.; Frontiers in Earth Sciences; Springer: Berlin/Heidelberg, Germany, 2007; ISBN 978-3-540-69425-0. [Google Scholar]
  20. Vinet, L.; Zhedanov, A. A ‘missing’ family of classical orthogonal polynomials. J. Phys. A Math. Theor. 2011, 44, 085201. [Google Scholar] [CrossRef] [Green Version]
  21. Roure, F.; Swennen, R.; Schneider, F.; Faure, J.L.; Ferket, H.; Guilhaumou, N.; Osadetz, K.; Robion, P.; Vandeginste, V. Incidence and importance of tectonics and natural fluid migration on reservoir evolution in foreland fold-and-thrust belts. Oil Gas Sci. Technol. 2005, 60, 67–106. [Google Scholar] [CrossRef]
  22. Van Geet, M.; Swennen, R.; Durmishi, C.; Roure, F.; Muchez, P.H. Paragenesis of Cretaceous to Eocene carbonate reservoirs in the Ionian fold and thrust belt (Albania): Relation between tectonism and fluid flow. Sedimentology 2002, 49, 697–718. [Google Scholar] [CrossRef]
  23. Travé, A.; Calvet, F.; Sans, M.; Vergés, J.; Thirlwall, M. Fluid history related to the Alpine compression at the margin of the south-Pyrenean Foreland basin: The El Guix anticline. Tectonophysics 2000, 321, 73–102. [Google Scholar] [CrossRef]
  24. Travé, A.; Labaume, P.; Calvet, F.; Soler, A. Sediment dewatering and pore fluid migration along thrust faults in a foreland basin inferred from isotopic and elemental geochemical analyses (Eocene southern Pyrenees, Spain). Tectonophysics 1997, 282, 375–398. [Google Scholar] [CrossRef]
  25. Lefticariu, L.; Perry, E.C.; Fischer, M.P.; Banner, J.L. Evolution of fluid compartmentalization in a detachment fold complex. Geology 2005, 33, 69. [Google Scholar] [CrossRef]
  26. Evans, M.A.; Bebout, G.E.; Brown, C.H. Changing fluid conditions during folding: An example from the central Appalachians. Tectonophysics 2012, 576–577, 99–115. [Google Scholar] [CrossRef]
  27. Lynch, E.A.; van der Pluijm, B. Meteoric fluid infiltration in the Argentine Precordillera fold-and-thrust belt: Evidence from H isotopic studies of neoformed clay minerals. Lithosphere 2017, 9, 134–145. [Google Scholar] [CrossRef]
  28. Vandeginste, V.; Swennen, R.; Allaeys, M.; Ellam, R.M.; Osadetz, K.; Roure, F. Challenges of structural diagenesis in foreland fold-and-thrust belts: A case study on paleofluid flow in the Canadian Rocky Mountains West of Calgary. Mar. Pet. Geol. 2012. [Google Scholar] [CrossRef]
  29. Laubach, S.E.; Eichhubl, P.; Hilgers, C.; Lander, R.H. Structural diagenesis. J. Struct. Geol. 2010, 32, 1866–1872. [Google Scholar] [CrossRef]
  30. Evans, M.A.; Fischer, M.P. On the distribution of fluids in folds: A review of controlling factors and processes. J. Struct. Geol. 2012, 44, 2–24. [Google Scholar] [CrossRef]
  31. Sturrock, C.P.; Catlos, E.J.; Miller, N.R.; Akgun, A.; Fall, A.; Gabitov, R.I.; Yilmaz, I.O.; Larson, T.; Black, K.N. Fluids along the North Anatolian Fault, Niksar basin, north central Turkey: Insight from stable isotopic and geochemical analysis of calcite veins. J. Struct. Geol. 2017, 101, 58–79. [Google Scholar] [CrossRef]
  32. Bussolotto, M.; Benedicto, A.; Moen-Maurel, L.; Invernizzi, C. Fault deformation mechanisms and fault rocks in micritic limestones: Examples from Corinth rift normal faults. J. Struct. Geol. 2015, 77, 191–212. [Google Scholar] [CrossRef]
  33. Faÿ-Gomord, O.; Allanic, C.; Verbiest, M.; Honlet, R.; Champenois, F.; Bonifacie, M.; Chaduteau, C.; Wouters, S.; Muchez, P.; Lasseur, E.; et al. Understanding Fluid Flow during Tectonic Reactivation: An Example from the Flamborough Head Chalk Outcrop (UK). Geofluids 2018, 2018, 1–17. [Google Scholar] [CrossRef] [Green Version]
  34. Swennen, R.; Muskha, K.; Roure, F. Fluid circulation in the Ionian fold and thrust belt (Albania): Implications for hydrocarbon prospectivity. J. Geochem. Explor. 2000, 69–70, 629–634. [Google Scholar] [CrossRef]
  35. Vilasi, N. Study of Reservoir Analogues in Foreland Fold-and-Thrust Belts: Sedimentology, Diagenesis, Deformation and Fracturing of the Upper Cretaceous-Eocene Carbonate Systems of the Ionian Zone (Southern Albania). Ph.D. Thesis, Ecole des Mines de Paris, Paris, France, 2011. [Google Scholar]
  36. Cello, G.; Invernizzi, C.; Mazzoli, S.; Tondi, E. Fault properties and fluid flow patterns from Quaternary faults in the Apennines, Italy. Tectonophysics 2001, 336, 63–78. [Google Scholar] [CrossRef]
  37. Conti, S.; Fontana, D.; Mecozzi, S.; Panieri, G.; Pini, G.A. Late Miocene seep-carbonates and fluid migration on top of the Montepetra intrabasinal high (Northern Apennines, Italy): Relations with synsedimentary folding. Sediment. Geol. 2010, 231, 41–54. [Google Scholar] [CrossRef]
  38. Petracchini, L.; Antonellini, M.; Billi, A.; Scrocca, D. Fault development through fractured pelagic carbonates of the Cingoli anticline, Italy: Possibe analog for subsurface fluid-conductive fractures. J. Struct. Geol. 2012, 45, 21–37. [Google Scholar] [CrossRef]
  39. Pizzati, M.; Balsamo, F.; Storti, F.; Mozafari, M.; Iacumin, P.; Tinterri, R.; Swennen, R. From axial parallel to orthogonal groundwater flow during fold amplification: Insights from carbonate concretion development during the growth of the Quattro Castella Anticline, Northern Apennines, Italy. J. Geol. Soc. Lond. 2018, 175, 806–819. [Google Scholar] [CrossRef]
  40. Mozafari, M.; Swennen, R.; Balsamo, F.; El Desouky, H.; Storti, F.; Taberner, C. Fault-controlled dolomitization in the Montagna dei Fiori Anticline (Central Apennines, Italy): Record of a dominantly pre-orogenic fluid migration. Solid Earth Discuss. 2019, 1–57. [Google Scholar] [CrossRef]
  41. Incerpi, N.; Martire, L.; Manatschal, G.; Bernasconi, S.M. Evidence of hydrothermal fluid flow in a hyperextended rifted margin: The case study of the Err nappe (SE Switzerland). Swiss J. Geosci. 2017, 110, 439–456. [Google Scholar] [CrossRef]
  42. Hausegger, S.; Kurz, W.; Rabitsch, R.; Kiechl, E.; Brosch, F.J. Analysis of the internal structure of a carbonate damage zone: Implications for the mechanisms of fault breccia formation and fluid flow. J. Struct. Geol. 2010, 32, 1349–1362. [Google Scholar] [CrossRef]
  43. Morley, C.K.; Warren, J.; Tingay, M.; Boonyasaknanon, P.; Julapour, A. Reprint of: Comparison of modern fluid distribution, pressure and flow in sediments associated with anticlines growing in deepwater (Brunei) and continental environments (Iran). Mar. Pet. Geol. 2014, 55, 230–249. [Google Scholar] [CrossRef]
  44. Dewever, B.; Swennen, R.; Breesch, L. Fluid flow compartmentalization in the sicilian fold and thrust belt: Implications for the regional aqueous fluid flow and oil migration history. Tectonophysics 2013, 591, 194–209. [Google Scholar] [CrossRef]
  45. Gomez-Rivas, E.; Bons, P.D.; Koehn, D.; Urai, J.L.; Arndt, M.; Virgo, S.; Laurich, B.; Zeeb, C.; Stark, L.; Blum, P. The Jabal Akhdar dome in the Oman Mountains: Evolution of a dynamic fracture system. Am. J. Sci. 2014, 314, 1104–1139. [Google Scholar] [CrossRef] [Green Version]
  46. Breesch, L.; Swennen, R.; Vincent, B. Fluid flow reconstruction in hanging and footwall carbonates: Compartmentalization by Cenozoic reverse faulting in the Northern Oman Mountains (UAE). Mar. Pet. Geol. 2009, 26, 113–128. [Google Scholar] [CrossRef]
  47. Mozafari, M.; Swennen, R.; Muchez, P.; Vassilieva, E.; Balsamo, F.; Storti, F.; Pironon, J.; Taberner, C. Origin of the saline paleofluids in fault-damage zones of the Jabal Qusaybah Anticline (Adam Foothills, Oman): Constraints from fluid inclusions geochemistry. Mar. Pet. Geol. 2017, 86, 537–546. [Google Scholar] [CrossRef]
  48. Balsamo, F.; Clemenzi, L.; Storti, F.; Mozafari, M.; Solum, J.; Swennen, R.; Taberner, C.; Tueckmantel, C. Anatomy and paleofluid evolution of laterally restricted extensional fault zones in the Jabal Qusaybah anticline, Salakh arch, Oman. Geol. Soc. Am. Bull. 2016, 128, 957–972. [Google Scholar] [CrossRef]
  49. Travé, A.; Calvet, F.; Soler, A.; Labaume, P. Fracturing and fluid migration during palaeogene compression and neogene extension in the Catalan Coastal Ranges, Spain. Sedimentology 1998, 45, 1063–1082. [Google Scholar] [CrossRef]
  50. Cantarero, I.; Travé, A.; Alías, G.; Baqués, V. Polyphasic hydrothermal and meteoric fluid regimes during the growth of a segmented fault involving crystalline and carbonate rocks (Barcelona Plain, NE Spain). Geofluids 2014, 14, 20–44. [Google Scholar] [CrossRef]
  51. Baqués, V.; Travé, A.; Benedicto, A.; Labaume, P.; Cantarero, I. Relationships between carbonate fault rocks and fluid flow regime during propagation of the Neogene extensional faults of the Penedès basin (Catalan Coastal Ranges, NE Spain). J. Geochem. Explor. 2010, 106, 24–33. [Google Scholar] [CrossRef]
  52. Baques, V.; Trave, A.; Roca, E.; Marin, M.; Cantarero, I. Geofluid behaviour in successive extensional and compressional events: A case study from the southwestern end of the Valles-Penedes Fault (Catalan Coastal Ranges, NE Spain). Pet. Geosci. 2012, 18, 17–31. [Google Scholar] [CrossRef]
  53. Cantarero, I.; Alías, G.; Cruset, D.; Carola, E.; Lanari, P.; Travé, A. Fluid composition changes in crystalline basement rocks from ductile to brittle regimes. Glob. Planet. Chang. 2018, 171, 273–292. [Google Scholar] [CrossRef]
  54. Lacroix, B.; Travé, A.; Buatier, M.; Labaume, P.; Vennemann, T.; Dubois, M. Syntectonic fluid-flow along thrust faults: Example of the South-Pyrenean fold-and-thrust belt. Mar. Pet. Geol. 2014, 49, 84–98. [Google Scholar] [CrossRef]
  55. Beaudoin, N.; Huyghe, D.; Bellahsen, N.; Lacombe, O.; Emmanuel, L.; Mouthereau, F.; Ouanhnon, L. Fluid systems and fracture development during syn-depositional fold growth: An example from the Pico del Aguila anticline, Sierras Exteriores, southern Pyrenees, Spain. J. Struct. Geol. 2015, 70, 23–38. [Google Scholar] [CrossRef]
  56. Crognier, N.; Hoareau, G.; Aubourg, C.; Dubois, M.; Lacroix, B.; Branellec, M.; Callot, J.P.; Vennemann, T. Syn-orogenic fluid flow in the Jaca basin (south Pyrenean fold and thrust belt) from fracture and vein analyses. Basin Res. 2018, 30, 187–216. [Google Scholar] [CrossRef]
  57. Lacroix, B.; Baumgartner, L.P.; Bouvier, A.-S.; Kempton, P.D.; Vennemann, T. Multi fluid-flow record during episodic mode I opening: A microstructural and SIMS study (Cotiella Thrust Fault, Pyrenees). Earth Planet. Sci. Lett. 2018, 503, 37–46. [Google Scholar] [CrossRef]
  58. Vergés, J.; Marzo, M.; Muñoz, J. Growth strata in foreland settings. Sediment. Geol. 2002, 146, 1–9. [Google Scholar] [CrossRef]
  59. Vergés, J. Estudi Geològic del Vessant Sud del Pirineu Oriental i Central: Evolució Cinemàtica en 3D. Ph.D. Thesis, University of Barcelona, Barcelona, Spain, 1993. [Google Scholar]
  60. Choukroune, P. The Ecors Pyrenean deep seismic profile reflection data and the overall structure of an orogenic belt. Tectonics 1989. [Google Scholar] [CrossRef]
  61. Munoz, J.A. Evolution of a continental collision belt: ECORS-Pyrenees crustal balanced cross-section. Thrust Tectonics 1992, 235–246. [Google Scholar] [CrossRef]
  62. Vergés, J.; Fernàndez, M.; Martìnez, A. The Pyrenean orogen: Pre-, syn-, and post-collisional evolution. J. Virtual Explor. 2002, 8. [Google Scholar] [CrossRef]
  63. Vergés, J.; Fernàndez, M. Tethys-Atlantic interaction along the Iberia-Africa plate boundary: The Betic-Rif orogenic system. Tectonophysics 2012, 579, 144–172. [Google Scholar] [CrossRef]
  64. ECORS Pyrenees team The ECORS deep reflection seismic survey across the Pyrenees. Nature 1988, 331, 508. [CrossRef]
  65. Roure, F.; Choukroune, P.; Berastegui, X.; Munoz, J.A.; Villien, A.; Matheron, P.; Bareyt, M.; Seguret, M.; Camara, P.; Deramond, J. Ecors deep seismic data and balanced cross sections: Geometric constraints on the evolution of the Pyrenees. Tectonics 1989. [Google Scholar] [CrossRef]
  66. Verges, J.; Munoz, J.A. Thrust sequence in the southern central Pyrenees. Bulletin de la Société Géologique de France 1990, VI, 265–271. [Google Scholar] [CrossRef]
  67. Berastegui, X.; Garcia-Senz, J.M.; Losantos, M. Tecto-sedimentary evolution of the Organya extensional basin (central south Pyrenean unit, Spain) during the Lower Cretaceous. Bulletin de la Société Géologique de France 1990, VI, 251–264. [Google Scholar] [CrossRef]
  68. Tugend, J.; Manatschal, G.; Kusznir, N.J. Spatial and temporal evolution of hyperextended rift systems: Implication for the nature, kinematics, and timing of the Iberian-European plate boundary. Geology 2015, 43, 15–18. [Google Scholar] [CrossRef]
  69. Garcia-Senz, J.M. Cuencas Extensivas del Cretácico Inferior en los Pirineos Centrales, Formación y Subsecuente Inversión. Ph.D. Thesis, Universitat de Barcelona, Barcelona, Spain, 2002. [Google Scholar]
  70. Ardévol, L.; Klimowitz, J.; Malagón, J.; Nagtegaal, P.J.C. Depositional sequence response to foreland deformation in the upper Cretaceous of the Southern Pyrenees, Spain. Am. Assoc. Pet. Geol. Bull. 2000. [Google Scholar] [CrossRef]
  71. Guillaume, B.; Dhont, D.; Brusset, S. Three-dimensional geologic imaging and tectonic control on stratigraphic architecture: Upper Cretaceous of the Tremp Basin (south-central Pyrenees, Spain). Am. Assoc. Pet. Geol. Bull. 2008, 92, 249–269. [Google Scholar] [CrossRef]
  72. Mencos, J.; Carrera, N.; Muñoz, J.A. Influence of rift basin geometry on the subsequent postrift sedimentation and basin inversion: The Organyà Basin and the Bóixols thrust sheet (south central Pyrenees). Tectonics 2015, 34, 1452–1474. [Google Scholar] [CrossRef] [Green Version]
  73. Haines, S.H. Transformations in Cly-Rich Fault-Rocks: Constraining Fault Zone Processes and the Kinematic Evolution of Regions. Ph.D. Thesis, University of Michigan, Ann Arbor, MI, USA, 2008. [Google Scholar]
  74. Simó, A. Carbonate platform depositional sequences, Upper Cretaceous, south-central Pyrenees (Spain). Tectonophysics 1986. [Google Scholar] [CrossRef]
  75. Vergés, J.; Muñoz, J.A.; Martínez, A. South Pyrenean fold and thrust belt: The role of foreland evaporitic levels in thrust geometry. Thrust Tectonics 1992, 255–264. [Google Scholar] [CrossRef]
  76. Mey, P.H.W.; Nagtegaal, P.J.C.; Roberti, K.J.; Hartevelt, J.J.A. Lithostratigraphic subdivision of Post-Hercynian deposits in the South-Central Pyrenees, Spain. Leidse Geol. Meded. 1968, 41, 221–228. [Google Scholar]
  77. Oms, O.; Fondevilla, V.; Riera, V.; Marmi, J.; Vicens, E.; Estrada, R.; Anadón, P.; Vila, B.; Galobart, À. Transitional environments of the lower Maastrichtian South-Pyrenean Basin (Catalonia, Spain): The Fumanya Member tidal flat. Cretac. Res. 2016, 57, 428–442. [Google Scholar] [CrossRef] [Green Version]
  78. Delvaux, D.; Sperner, B. New aspects of tectonic stress inversion with reference to the TENSOR program. Geol. Soc. Lond. Spec. Publ. 2003, 212, 75–100. [Google Scholar] [CrossRef] [Green Version]
  79. Bons, P.D.; Elburg, M.A.; Gomez-Rivas, E. A review of the formation of tectonic veins and their microstructures. J. Struct. Geol. 2012, 43, 33–62. [Google Scholar] [CrossRef]
  80. McCrea, J.M. On the isotopic chemistry of carbonates and a paleotemperature scale. J. Chem. Phys. 1950. [Google Scholar] [CrossRef]
  81. Mangenot, X.; Gasparrini, M.; Gerdes, A.; Bonifacie, M.; Rouchon, V. An emerging thermochronometer for carbonate-bearing rocks: ∆47/(U-Pb). Geology 2018, 46, 1067–1070. [Google Scholar] [CrossRef]
  82. John, C.M.; Bowen, D. Community software for challenging isotope analysis: First applications of ‘Easotope’ to clumped isotopes. Rapid Commun. Mass Spectrom. 2016, 30, 2285–2300. [Google Scholar] [CrossRef] [PubMed]
  83. Guo, W.; Mosenfelder, J.L.; Goddard, W.A.; Eiler, J.M. Isotopic fractionations associated with phosphoric acid digestion of carbonate minerals: Insights from first-principles theoretical modeling and clumped isotope measurements. Geochim. Cosmochim. Acta 2009, 73, 7203–7225. [Google Scholar] [CrossRef]
  84. Huntington, K.W.; Eiler, J.M.; Affek, H.P.; Guo, W.; Bonifacie, M.; Yeung, L.Y.; Thiagarajan, N.; Passey, B.; Tripati, A.; Daëron, M.; et al. Methods and limitations of “clumped” CO2 isotope (Δ47) analysis by gas-source isotope ratiomass spectrometry. J. Mass Spectrom. 2009, 44, 1318–1329. [Google Scholar] [CrossRef]
  85. Dennis, K.J.; Affek, H.P.; Passey, B.H.; Schrag, D.P.; Eiler, J.M. Defining an absolute reference frame for ‘clumped’ isotope studies of CO2. Geochim. Cosmochim. Acta 2011, 75, 7117–7131. [Google Scholar] [CrossRef]
  86. Kim, S.-T.; O’Neil, J.R. Equilibrium and nonequilibrium oxygen isotope effects in synthetic carbonates. Geochim. Cosmochim. Acta 1997, 61, 3461–3475. [Google Scholar] [CrossRef]
  87. Kluge, T.; John, C.M.; Jourdan, A.-L.; Davis, S.; Crawshaw, J. Laboratory calibration of the calcium carbonate clumped isotope thermometer in the 25–250 °C temperature range. Geochim. Cosmochim. Acta 2015, 157, 213–227. [Google Scholar] [CrossRef] [Green Version]
  88. Shackleton, J.R.; Cooke, M.L.; Vergés, J.; Simó, T. Temporal constraints on fracturing associated with fault-related folding at Sant Corneli anticline, Spanish Pyrenees. J. Struct. Geol. 2011, 33, 5–19. [Google Scholar] [CrossRef] [Green Version]
  89. Tavani, S.; Mencos, J.; Bausà, J.; Muñoz, J.A. The fracture pattern of the Sant Corneli Bóixols oblique inversion anticline (Spanish Pyrenees). J. Struct. Geol. 2011, 33, 1662–1680. [Google Scholar] [CrossRef]
  90. Veizer, J.; Hoefs, J. The nature of O18/O16and C13/C12secular trends in sedimentary carbonate rocks. Geochim. Cosmochim. Acta 1976. [Google Scholar] [CrossRef]
  91. Veizer, J.; Ala, D.; Azmy, K.; Bruckschen, P.; Buhl, D.; Bruhn, F.; Carden, G.A.F.; Diener, A.; Ebneth, S.; Godderis, Y.; et al. 87Sr/86Sr, δ13C and δ18O evolution of Phanerozoic seawater. Chem. Geol. 1999, 161, 59–88. [Google Scholar] [CrossRef]
  92. Friedman, I.; O’Neil, J.R. Compilation of Stable Isotope Fractionation Factors of Geochemical Interest; Professional Papers; USGS: Reston, VA, USA, 1977; ISBN 9788578110796.
  93. McArthur, J.M.; Howarth, R.J.; Bailey, T.R. Strontium Isotope Stratigraphy: LOWESS Version 3: Best Fit to the Marine Sr-Isotope Curve for 0–509 Ma and Accompanying Look-up Table for Deriving Numerical Age. J. Geol. 2001, 109, 155–170. [Google Scholar] [CrossRef]
  94. Kocsis, L.; Gheerbrant, E.; Mouflih, M.; Cappetta, H.; Ulianov, A.; Chiaradia, M.; Bardet, N. Gradual changes in upwelled seawater conditions (redox, pH) from the late Cretaceous through early Paleogene at the northwest coast of Africa: Negative Ce anomaly trend recorded in fossil bio-apatite. Chem. Geol. 2016, 421, 44–54. [Google Scholar] [CrossRef]
  95. Tostevin, R.; Shields, G.A.; Tarbuck, G.M.; He, T.; Clarkson, M.O.; Wood, R.A. Effective use of cerium anomalies as a redox proxy in carbonate-dominated marine settings. Chem. Geol. 2016, 438, 146–162. [Google Scholar] [CrossRef] [Green Version]
  96. McLennan, S.M. Rare earth elements in sedimentary rocks; influence of provenance and sedimentary processes. Rev. Mineral. Geochem. 1989, 21, 169–200. [Google Scholar]
  97. Bau, M.; Dulski, P. Distribution of yttrium and rare-earth elements in the Penge and Kuruman iron-formations, Transvaal Supergroup, South Africa. Precambrian Res. 1996, 79, 37–55. [Google Scholar] [CrossRef]
  98. Lawrence, M.G.; Greig, A.; Collerson, K.D.; Kamber, B.S. Rare Earth Element and Yttrium Variability in South East Queensland Waterways. Aquat. Geochem. 2006, 12, 39–72. [Google Scholar] [CrossRef]
  99. Bau, M.; Dulski, P. Evolution of the Yttrium-Holmium Systematics of Seawater Through Time. Mineral. Mag. 1994, 58A, 61–62. [Google Scholar] [CrossRef]
  100. Zhao, L.; Chen, Z.-Q.; Algeo, T.J.; Chen, J.; Chen, Y.; Tong, J.; Gao, S.; Zhou, L.; Hu, Z.; Liu, Y. Rare-earth element patterns in conodont albid crowns: Evidence for massive inputs of volcanic ash during the latest Permian biocrisis? Glob. Planet. Chang. 2013, 105, 135–151. [Google Scholar] [CrossRef]
  101. Webb, G.E.; Kamber, B.S. Rare earth elements in Holocene reefal microbialites: A new shallow seawater proxy. Geochim. Cosmochim. Acta 2000, 64, 1557–1565. [Google Scholar] [CrossRef]
  102. Wright, J.; Schrader, H.; Holser, W.T. Paleoredox variations in ancient oceans recorded by rare earth elements in fossil apatite. Geochim. Cosmochim. Acta 1987, 51, 631–644. [Google Scholar] [CrossRef]
  103. Emery, D. Trace-element source and mobility during limestone burial diagenesis—An example from the Middle Jurassic of eastern England. Geol. Soc. Lond. Spec. Publ. 1987. [Google Scholar] [CrossRef]
  104. Veizer, J.; Prokoph, A. Temperatures and oxygen isotopic composition of Phanerozoic oceans. Earth-Sci. Rev. 2015, 146, 92–104. [Google Scholar] [CrossRef]
  105. Pujalte, V.; Schmitz, B.; Baceta, J.I.; Orue-Etxebarria, X.; Bernaola, G.; Dinarès-Turell, J.; Payros, A.; Apellaniz, E.; Caballero, F. Correlation of the Thanetian-Ilerdian turnover of larger foraminifera and the Paleocene-Eocene thermal maximum: Confirming evidence from the Campo area (Pyrenees, Spain). Geol. Acta 2009. [Google Scholar] [CrossRef]
  106. Loyd, S.J.; Corsetti, F.A.; Eiler, J.M.; Tripati, A.K. Determining the Diagenetic Conditions of Concretion Formation: Assessing Temperatures and Pore Waters Using Clumped Isotopes. J. Sediment. Res. 2012, 82, 1006–1016. [Google Scholar] [CrossRef] [Green Version]
  107. Bergman, S.C.; Huntington, K.W.; Crider, J.G. Tracing paleofluid sources using clumped isotope thermometry of diagenetic cements along the Moab Fault, Utah. Am. J. Sci. 2013, 313, 490–515. [Google Scholar] [CrossRef]
  108. Mangenot, X.; Gasparrini, M.; Rouchon, V.; Bonifacie, M. Basin-scale thermal and fluid flow histories revealed by carbonate clumped isotopes (Δ47)—Middle Jurassic carbonates of the Paris Basin depocentre. Sedimentology 2018, 65, 123–150. [Google Scholar] [CrossRef]
  109. Honlet, R.; Gasparrini, M.; Muchez, P.; Swennen, R.; John, C.M. A new approach to geobarometry by combining fluid inclusion and clumped isotope thermometry in hydrothermal carbonates. Terra Nov. 2018, 30, 199–206. [Google Scholar] [CrossRef]
  110. Stolper, D.A.; Eiler, J.M. The kinetics of solid-state isotope-exchange reactions for clumped isotopes: A study of inorganic calcites and apatites from natural and experimental samples. Am. J. Sci. 2015, 315, 363–411. [Google Scholar] [CrossRef]
  111. Shenton, B.J.; Grossman, E.L.; Passey, B.H.; Henkes, G.A.; Becker, T.P.; Laya, J.C.; Perez-Huerta, A.; Becker, S.P.; Lawson, M. Clumped isotope thermometry in deeply buried sedimentary carbonates: The effects of bond reordering and recrystallization. Geol. Soc. Am. Bull. 2015, 127, B31169.1. [Google Scholar] [CrossRef]
  112. Coney, P.J.; Muñoz, J.A.; MCclay, K.R.; Evenchick, C.A. Syntectonic burial and post-tectonic exhumation of the southern Pyrenees foreland fold–thrust belt. J. Geol. Soc. Lond. 1996, 153, 9–16. [Google Scholar] [CrossRef]
  113. Passey, B.H.; Henkes, G.A. Carbonate clumped isotope bond reordering and geospeedometry. Earth Planet. Sci. Lett. 2012, 351–352, 223–236. [Google Scholar] [CrossRef]
  114. Henkes, G.A.; Passey, B.H.; Grossman, E.L.; Shenton, B.J.; Pérez-Huerta, A.; Yancey, T.E. Temperature limits for preservation of primary calcite clumped isotope paleotemperatures. Geochim. Cosmochim. Acta 2014, 139, 362–382. [Google Scholar] [CrossRef]
  115. Wood, R.A.; Poulton, S.W.; Prave, A.R.; Hoffmann, K.-H.; Clarkson, M.O.; Guilbaud, R.; Lyne, J.W.; Tostevin, R.; Bowyer, F.; Penny, A.M.; et al. Dynamic redox conditions control late Ediacaran metazoan ecosystems in the Nama Group, Namibia. Precambrian Res. 2015, 261, 252–271. [Google Scholar] [CrossRef] [Green Version]
  116. Haley, B.A.; Klinkhammer, G.P.; McManus, J. Rare earth elements in pore waters of marine sediments. Geochim. Cosmochim. Acta 2004. [Google Scholar] [CrossRef]
  117. German, C.R.; Elderfield, H. Application of the Ce anomaly as a paleoredox indicator: The ground rules. Paleoceanography 1990. [Google Scholar] [CrossRef]
  118. Casini, G.; Gillespie, P.A.; Vergés, J.; Romaire, I.; Fernández, N.; Casciello, E.; Saura, E.; Mehl, C.; Homke, S.; Embry, J.-C.; et al. Sub-seismic fractures in foreland fold and thrust belts: Insight from the Lurestan Province, Zagros Mountains, Iran. Pet. Geosci. 2011, 17, 263–282. [Google Scholar] [CrossRef]
  119. Sibson, R.H. Fluid Flow Accompanying Faulting: Field Evidence and Models. Earthq. Predict. 1981, 4, 593–603. [Google Scholar]
  120. Piper, D.Z.; Bau, M. Normalized Rare Earth Elements in Water, Sediments, and Wine: Identifying Sources and Environmental Redox Conditions. Am. J. Anal. Chem. 2013, 4, 69–83. [Google Scholar] [CrossRef]
Figure 1. Geological map (a) and cross-section (b) of the South-Central Pyrenean Unit, showing the main structural units. The study area is located in the frontal part of the Bóixols thrust sheet. Modified from [59].
Minerals 09 00117 g001
Figure 2. Chronostratigraphic diagram showing the principal stratigraphic units and their related tectonic events [72]. The outcropping units, where all the samples were taken from, are colored in orange (Garumnian facies), light green (Santa Fe Fm.) and dark green (Lluçà Fm.).
Minerals 09 00117 g002
Figure 3. (a) Aerial view with sample location (yellow numbers) and situation of Figures 5, 8 and 9. Figure 7a, representing the Bóixols thrust outcrop, is about 11 km to the west of the Coll de Nargó village. (b) Geological map of the main outcrop. The Paleocene syn-orogenic sequence (Garumnian facies) fossilizes the Bóixols thrust in this area. Location in Figure 1. A-A’ and B-B’ cross sections in Figure 4.
Minerals 09 00117 g003
Figure 4. (a) Cross-section of the Coll de Nargó syncline and the Bóixols anticline. The northern limb of the Coll de Nargó synclinebelongs to the southern limb of theBóixols anticline. (b,c) schematic cross sections in the frontal part of the Bóixols thrust sheet in the study area. Location in Figure 3.
Minerals 09 00117 g004
Figure 5. Field and photomicrographs of Paleocene Garumnian facies. (a) Red mudstones alternating with lacustrine limestones. (b,c) nodular lacustrine limestones. (d) Red mudstones. (e) Coarse sandstones with pebbles at the base. (f) Conglomerates. (g) Versicolored clays. (h) Oncolitic packstone. (i) Plane polarized photomicrograph of Microcodium packstones. The yellow arrows point to massive Microcodium and reworked fragments.
Minerals 09 00117 g005
Figure 6. Lower hemisphere, equal area stereoplots of the fracture sets recognized in the frontal part of the Bóixols thrust sheet. Dots represent poles and lines represent the mean principal planes. F2 and F3 have been restored with respect to bedding.
Minerals 09 00117 g006
Figure 7. (a) Outcrop of the Bóixols thrust (F1) (b) Cc1 showing both calcite elongate blocky crystals grown in the same fracture (sample CN 33). (c,d) Calcite cement Cc1 seen in polarized optical microscope and cathodoluminescence (CL), respectively (sample CN27).
Minerals 09 00117 g007
Figure 8. (a) F2: NW-SEnon-mineralized fractures in the Santa Fe Formation. (b,c) F3: NW-SE and NE-SW conjugate fracture set. (d) F3 fracture showing a later reactivation with strike-slip movement (white arrow) and dip-slip movement (grey arrow). (e,f) Crosscutting relationship between calcite cements Cc1 and Cc2 (sample CN12). Cc2 clearly crosscuts and postdates Cc1 in F3 conjugate joints.
Minerals 09 00117 g008
Figure 9. (a) Panoramic view and interpreted sketch of the studied formations. Note that the fracture density of F4 increases towards F5 and also the reactivation of some F4 fractures as F5 strike-slip faults. (b) Interpreted field view of F5 right-lateral and left-lateral strike-slip conjugate faults. (c) F4 fractures and associated vugs. (d) The Segre strike-slip fault juxtaposes the Lluçà Formation against Garumnian facies. (e) Crosscutting relationship between F4 fractures and F5 strike slip faults.
Minerals 09 00117 g009
Figure 10. (a,b) Calcite cement Cc3 under polarized optical microscope and CL, respectively (sample CN20). (c) Crosscutting relationship between calcite cements Cc3 and Cc4 (sample CN26). (d) Calcite cement Cc4 with tabular thick twin planes (sample CN3). The yellow arrow points a carbonate clast from the Garumnian conglomerates.
Minerals 09 00117 g010
Figure 11. δ18O vs δ13C cross-plot of carbonate host rocks and calcite cements. Stars represent host rocks, other symbols represent different fracture sets, colors of symbols represent cement generations and the color of the circles englobing fracture symbols represent the associated host rocks. Meteoric water range of values is from Reference [90] and Jurassic-Cretaceous marine carbonate values from Reference [91].
Minerals 09 00117 g011
Figure 12. Temperatures (°C) vs δ18O (‰ VSMOW) calculated for fluids from which the different generations of calcite cements precipitated using clumped isotope geochemistry. The blue box represents δ18O average values for modern seawater [91].
Minerals 09 00117 g012
Figure 13. 87Sr/86Sr composition of calcite cements and carbonate host rocks. The 87Sr/86Sr variation of seawater through time is represented with the black line [93].
Minerals 09 00117 g013
Figure 14. Elemental composition in parts per million (ppm) measured on the four generations of calcite cements. Bars indicate maximum, minimum and average composition of each cement.
Minerals 09 00117 g014
Figure 15. (a) Y/Ho ratios vs Fe content cross-plot for calcite cements Cc1 to Cc4. Y/Ho values for modern seawater and terrigenous sediments are based on [99,100]. (b) PAAS-normalized Ce/Ce * vs Pr/Pr * cross-plot showing the Ce and Pr anomalies of calcite cements Cc1 to Cc4. The method of [97] as modified by [101] is used. Field I: no anomaly; Field IIa: positive La anomaly and no Ce anomaly; Field IIb: negative La anomaly and no Ce anomaly; Field IIIa: positive Ce anomaly; Field IIIb: negative Ce anomaly; Field IV: positive Ce and La anomalies. (c) Log(Ce/Ce *) vs Fe content cross-plot of calcite cements Cc1 to Cc4. The limit for oxic/anoxic areas is based on Reference [102].
Minerals 09 00117 g015
Figure 16. Fluid-flow model for the frontal part of the Bóixols thrust sheet showing the relationship between the structural evolution from early contraction to post-folding stage and the migration of fluids (not to scale).
Minerals 09 00117 g016
Table 1. δ18O and δ13C values of the host rocks and related calcite cements. Sx and dx in Fracture Set F5 indicates the main slip movement (left-lateral and right-lateral, respectively).
SampleFracture SetCementδ18O (‰ VPDB)δ13C (‰ VPDB)
CN2AF4Cc4−13.73−6.13
CN3AF5 sxCc4−14.21−5.81
CN4AF5 dxCc4−14.3−7.38
CN4BF5 dxCc4−12.93−7.78
CN5AF4Cc4−14.31−12.48
CN5B Garumnian mudstone−7.67−13.06
CN6AF4ACc4−13.02−10.85
CN9AF4Cc4−13.58−5.83
CN10AF5 dxCc4−13.85−12.51
CN11AF3 NW-SECc1−12.77+1.58
CN12AF3 NE-SWCc2−7.87+1.25
CN12BF3 NW-SECc1−11.83+1.34
CN12C Lluçà Fm−3.31+1.76
CN15A-AF5 sxCc4−10.06−5.38
CN15A-BF5 sxCc4−13.66−4.07
CN15B-AF5 sxCc4−10.88−5.76
CN16AF5 sxCc4−13.06−5.05
CN16B Santa Fe Fm−6.65−2.14
CN16CF5 sxCc4−9.86−5.51
CN17AF5 dxCc4−10.22−5.4
CN18AF4ACc3−7.82−8.3
CN20AF4Cc3−8.28−10.43
CN20B Garumnian limestone−6.84−11.01
CN26AF4Cc3−7.79−10.14
CN26BF4Cc4−13.84−8.22
CN27AF1Cc1−12.28+1.13
CN27B Jurassic limestone−6.22+0.72
CN28AF1Cc1−10.43+1.67
CN28B Jurassic limestone−8.66+1.69
CN31A Lluçà Fm−3.62+2.4
CN31BF3 NW-SECc2−9.23+1.8
CN32AF3 NW-SECc2−8.42+1.03
CN32BF3 NW-SECc1−13.22+0.82
CN32C Lluçà Fm−5.06+1.59
CN32DF3 NW-SECc2−8.64+1.04
CN33AF3 NE-SWCc1−11.09+1.19
CN33BF3 NE-SWCc1−12.71+0.37
CN38AF3 NW-SECc2−6.59+2.7
CN38BF3 NE-SWCc2−8.19+2.41
CN38C Lluçà Fm−3+2.51
Table 2. δ18O, δ13C, Δ47, temperature and δ18Ofluid values calculated from clumped isotope thermometry.
SampleFracture SetCementsnδ18O
(‰ VPDB)
δ13C
(‰ VPDB)
Δ47T (°C)δ18Ofluid
(‰ VSMOW)
CN33F3 NE-SWCc12−12.39+0.770.542 ± 0.00688.4 ± 3.8+0.6 ± 0.8
CN38F3 NE-SWCc21−6.91+2.560.64640.7 ± 16.1−1.3 ± 2.9
CN20F4Cc32−11.04−10.30.548 ± 0.00785.3 ± 4+1.6 ± 0.6
CN15F5Cc42−12.18−4.380.544 ± 0.00187.6 ± 0.6+0.7 ± 0.2
Table 3. Elemental composition of the different generations of calcite cements. Values are given in ppm.
SampleFracture SetCementsMnSrMgFeYCePrHo
CN27F1Cc1135409528039432.43.60.50.05
CN33F3 NE-SWCc13207953218798173.90.70.1
CN38F3 NE-SWCc24724187322910.70.40.050.02
CN12F3 NE-SWCc2225501361378406.14.20.60.1
CN20F4Cc3501389108029560.70.70.10.01
CN18F4Cc31380450108431161.11.60.20.02
CN6F4Cc4186391262134335.86.81.10.1
CN15F5 sxCc4119520195619862.82.40.40.05

