Review

Impact of Electrical Vehicle Charging Stations on the Electric Grid: Lessons Learnt and Challenges


1
Department of Electrical, Electronic and Telecommunications Engineering, and Naval Architecture (DITEN), University of Genova, 16145 Genova, Italy
2
Department of Electronic Technology, University of the Basque Country (EHU), ES-20018 Donostia-San Sebastián, Spain
3
Institute for Energy and Environment, Department of Electronic and Electrical Engineering, University of Strathclyde, Glasgow G1 1XQ, UK
4
Department of Communications Engineering, University of the Basque Country (EHU), ES-48013 Bilbao, Spain
*
Author to whom correspondence should be addressed.
Smart Cities 2026, 9(8), 127; https://doi.org/10.3390/smartcities9080127
Submission received: 5 May 2026 / Revised: 29 July 2026 / Accepted: 30 July 2026 / Published: 4 August 2026

Highlights

What are the main findings?
  • EVCS deployment affects distribution grids not only through additional power demand, but also through voltage unbalance, harmonic and supraharmonic emissions, impedance variation, resonance phenomena, PLC interference and metering issues.
  • The reviewed literature shows that EVCS grid impact is strongly dependent on charger type, charging power, operating point, simultaneity, grid impedance and local network topology; therefore, single average indicators are insufficient for grid-impact assessment.
What are the implications of the main findings?
  • Large-scale EVCS integration requires grid planning and monitoring methods that combine hosting-capacity assessment with power-quality, impedance, stability and communication-reliability considerations.
  • Future standards and mitigation strategies should better address high-frequency emissions, realistic grid impedance, clustered chargers, distorted/DC metering conditions and coordinated control of high-power charging infrastructures.

Abstract

The ambitious roadmap for a sustainable transport system adopted by the European Commission (EC) by 2050 includes the deployment of an extensive Electric Vehicle Charging Stations (EVCSs) infrastructure, which introduces significant challenges for distribution power grids. High power demand, particularly from fast-charging systems, may lead to network overloading and voltage unbalance. In addition, recent measurement campaigns highlight substantial changes in grid impedance and the emergence of resonance phenomena, together with the injection and propagation of high-frequency conducted disturbances. These effects extend over a wide frequency range, up to several hundreds of kHz, causing degradation, aging and malfunction of network assets, in particular Power Line Communications. This paper provides a comprehensive and updated review of the impact of EVCSs on electrical grids, covering power flow, power quality, stability, and impedance-related interactions. Particular attention is given to the role of power-electronic converters, high-frequency emissions, and the associated challenges in measurement and standardization. The analysis highlights that EVCS integration fundamentally alters the nature of electrical loads, requiring new approaches for grid planning, monitoring, and regulation. The study identifies key research gaps and outlines future directions to ensure the reliable and sustainable integration of electromobility into modern power systems.

1. Introduction

The Electrical Vehicle (EV) is the core of the European Commission’s transition plan for the transport sector towards electromobility. The successful integration of EVs requires the deployment of an extensive EV Charging Station (EVCS) infrastructure covering the overall charging needs of the consumers.
The European Commission (EC) has adopted an ambitious road-map, for a competitive and sustainable transport system by 2050 [1]. With the expected integration of EVs, the transportation sector will undergo major changes. EVCS are a key element of electromobility development and the Alternative Fuels Infrastructure Directive 2014/94/EU [2] has taken measures to increase the number of EVCSs with a standardized design and use.
Extensive EVCS deployment brings along a concern on sustainability that in an electrical perspective of connection to the grid may be synthesized as follows [3]. Focusing, in particular, on modern urban contexts, with an existing power distribution infrastructure (the “grid”), what is a tolerable amount of EVCSs and EV penetration? Answers can be provided taking into account the following aspects.
  • Sustainable power flow at the Low Voltage (LV) and Medium Voltage (MV) levels for the existing grid elements, and in particular MV/LV transformers and main distribution lines.
  • Considering smaller single-phase EVCSs at the LV level, issues of voltage imbalance.
  • Changes to the grid impedance and issues of resonance and stability.
  • Increased distortion up to a considerable high frequency, promoted also by the changes to the grid impedance.
  • Various interference scenarios, including mutual effects between EVCSs and EVs.
Of course other “non-electric” elements concur to determine the overall sustainability of an electromobility solution based on EVs. They have been extensively analyzed in relevant publications and may be summarized as follows:
  • Life-cycle environmental footprint: battery production and vehicle manufacturing can dominate early-life emissions, shifting sustainability benefits to the use phase and making lifetime assessment essential [4,5].
  • User behavior and mobility patterns: driving habits, charging behavior, vehicle size choice and total traveled kilometers can significantly alter environmental outcomes [6].
  • Infrastructure and urban integration: availability and spatial distribution of charging infrastructure influence adoption by users and at a larger extent land use, grid expansion needs, and modal shifts [7,8].
  • Reliability and availability through time of the provided charging solutions, including the characteristics of the hosting grid and interaction with other loads, including renewables [9].
  • Social acceptance and equity considerations: public perception, affordability, and access affect both uptake and whether benefits are distributed fairly [10,11].
  • Economic and policy framework: incentives, subsidies, conventional fossil fuel pricing and regulations strongly shape adoption rates and can be determinant on EV adoption and deployment [12,13].
  • Energy mix and overall emissions: the generation mix in the whole chain of energy production, charging and use of EVs, which largely determines whether EV adoption translates into real CO2 reduction overall [14,15].
In addition to power flow and infrastructure-related aspects, the increasing penetration of EVCSs introduces non-negligible power quality (PQ) challenges, particularly in terms of harmonic distortion and high-frequency conducted emissions. These phenomena affect not only the efficiency of power conversion processes, but also network losses, equipment lifetime, and the accuracy of energy metering. While distortion-related effects have traditionally been treated as a secondary aspect, recent studies show that their impact becomes significant in grids with a high concentration of power-electronic interfaces. As pointed out in [16], many optimization methods for efficiency improvement, cost minimization and environmental sustainability, including AI-based techniques, still lack inclusion of PQ elements. Recent reviews on AI-based PQ improvement further confirm that AI can support adaptive monitoring, disturbance classification and mitigation, but that robustness, data availability, interpretability and real-time deployment remain open challenges under highly dynamic operating conditions [17].
In this context, the interaction between EVCSs and the distribution network must be analyzed beyond steady-state power considerations, accounting for frequency-dependent effects, such as harmonic injection, grid impedance variation, and resonance phenomena.
This paper reviews the impact of EV charging stations on distribution grids, from a mechanism-oriented electrical perspective. The analysis covers four main aspects: (i) power absorption and loading effects, (ii) voltage profile and unbalance, (iii) conducted emissions and distortion from the harmonic range to the supraharmonic/PLC bands, and (iv) stability, grid impedance and resonance-related interactions. The objective is to identify the main technical challenges of large-scale EVCS deployment and to highlight open research issues and standardization needs.
The review was structured around the electrical phenomena by which EVCSs affect distribution grids, rather than around EV adoption alone. The literature was classified into thematic groups covering grid loading and voltage profile, voltage unbalance, harmonic emissions below 2 kHz, supraharmonic conducted emissions and PLC interaction from 2 kHz to 500 kHz, impedance and stability effects, metering implications, and standardization. Studies were considered when they provided quantitative measurements, simulation results, standards-related analysis, or experimentally supported interpretation of EVCS-grid interaction. Market and infrastructure data were included where they could be converted into indexes relevant to grid impact, such as EVCS density, EV/EVCS ratio, fast/slow charger balance, and EV energy share.
Compared with existing reviews, which often discuss EVCS integration mainly in terms of stakeholder objectives, charging demand, planning, optimization, or high-level power-quality indicators [3], this paper focuses on the underlying electrical mechanisms that determine the actual grid impact. In particular, it links EVCS deployment statistics to technical stress indexes and follows the chain from power absorption and unbalance to converter-driven emissions, frequency-dependent grid impedance, resonances, PLC interference, metering implications and standardization gaps. The contribution is therefore not another overview of EV charging infrastructure, but a mechanism-oriented review of how EVCSs modify the electrical behaviour of LV/MV distribution grids over a wide frequency range. Since detailed classifications of EVCS architectures, charging modes, converter topologies and power levels have already been extensively covered in technology-oriented reviews [18,19,20,21,22], this paper does not repeat such taxonomies. Instead, EVCS categories are discussed only when they are directly relevant to grid loading, voltage unbalance, conducted emissions, impedance variation, stability or standardization.

2. Overview of the Worldwide EV and EVCS Distribution

The objective of this section is not to provide a general market survey of electromobility, but to derive deployment indexes that are relevant to the electrical impact of EVCSs. For this reason, EV and EVCS data are interpreted in terms of energy demand, installed charging power, charger availability, spatial density, and fast/slow charging balance. These indexes provide the quantitative background for the technical analysis of feeder loading, voltage profile, unbalance, harmonic distortion, and impedance-related effects developed in the following sections.
The evolution and impact of charging facilities are considered in terms of adequacy and sustainability. For this purpose the number of EVs of various types (cars, buses, and vans) is considered and their energy demand on the one hand, compared to the existing charging points (slow and fast) and to the overall energy consumption of a country on the other hand. Detailed characteristics of deployment and availability to people cannot be assessed in detail, but to this aim the population and area of countries are considered, as well as the ratio between EVs and EVCSs.
This analysis covers the 2013–2023 period, which includes the first years of large-scale BEV deployment. Only BEVs are considered as those requiring significant charging power, whereas PHEVs have a marginal energy content in the internal battery, that is usually not charged separately (despite the “plug-in” term), but as the vehicle moves with its thermal engine. Also, FCEVs (Fuel Cell EVs) have been discarded, as they do not require any type of external electric charging.
Since country-level EV and EVCS trends can be strongly affected by national incentives and vehicle-type preferences, EU27 and continental Europe aggregate data are also used to obtain more stable deployment indicators.

2.1. Definition and Interpretation of Selected Performance Indexes

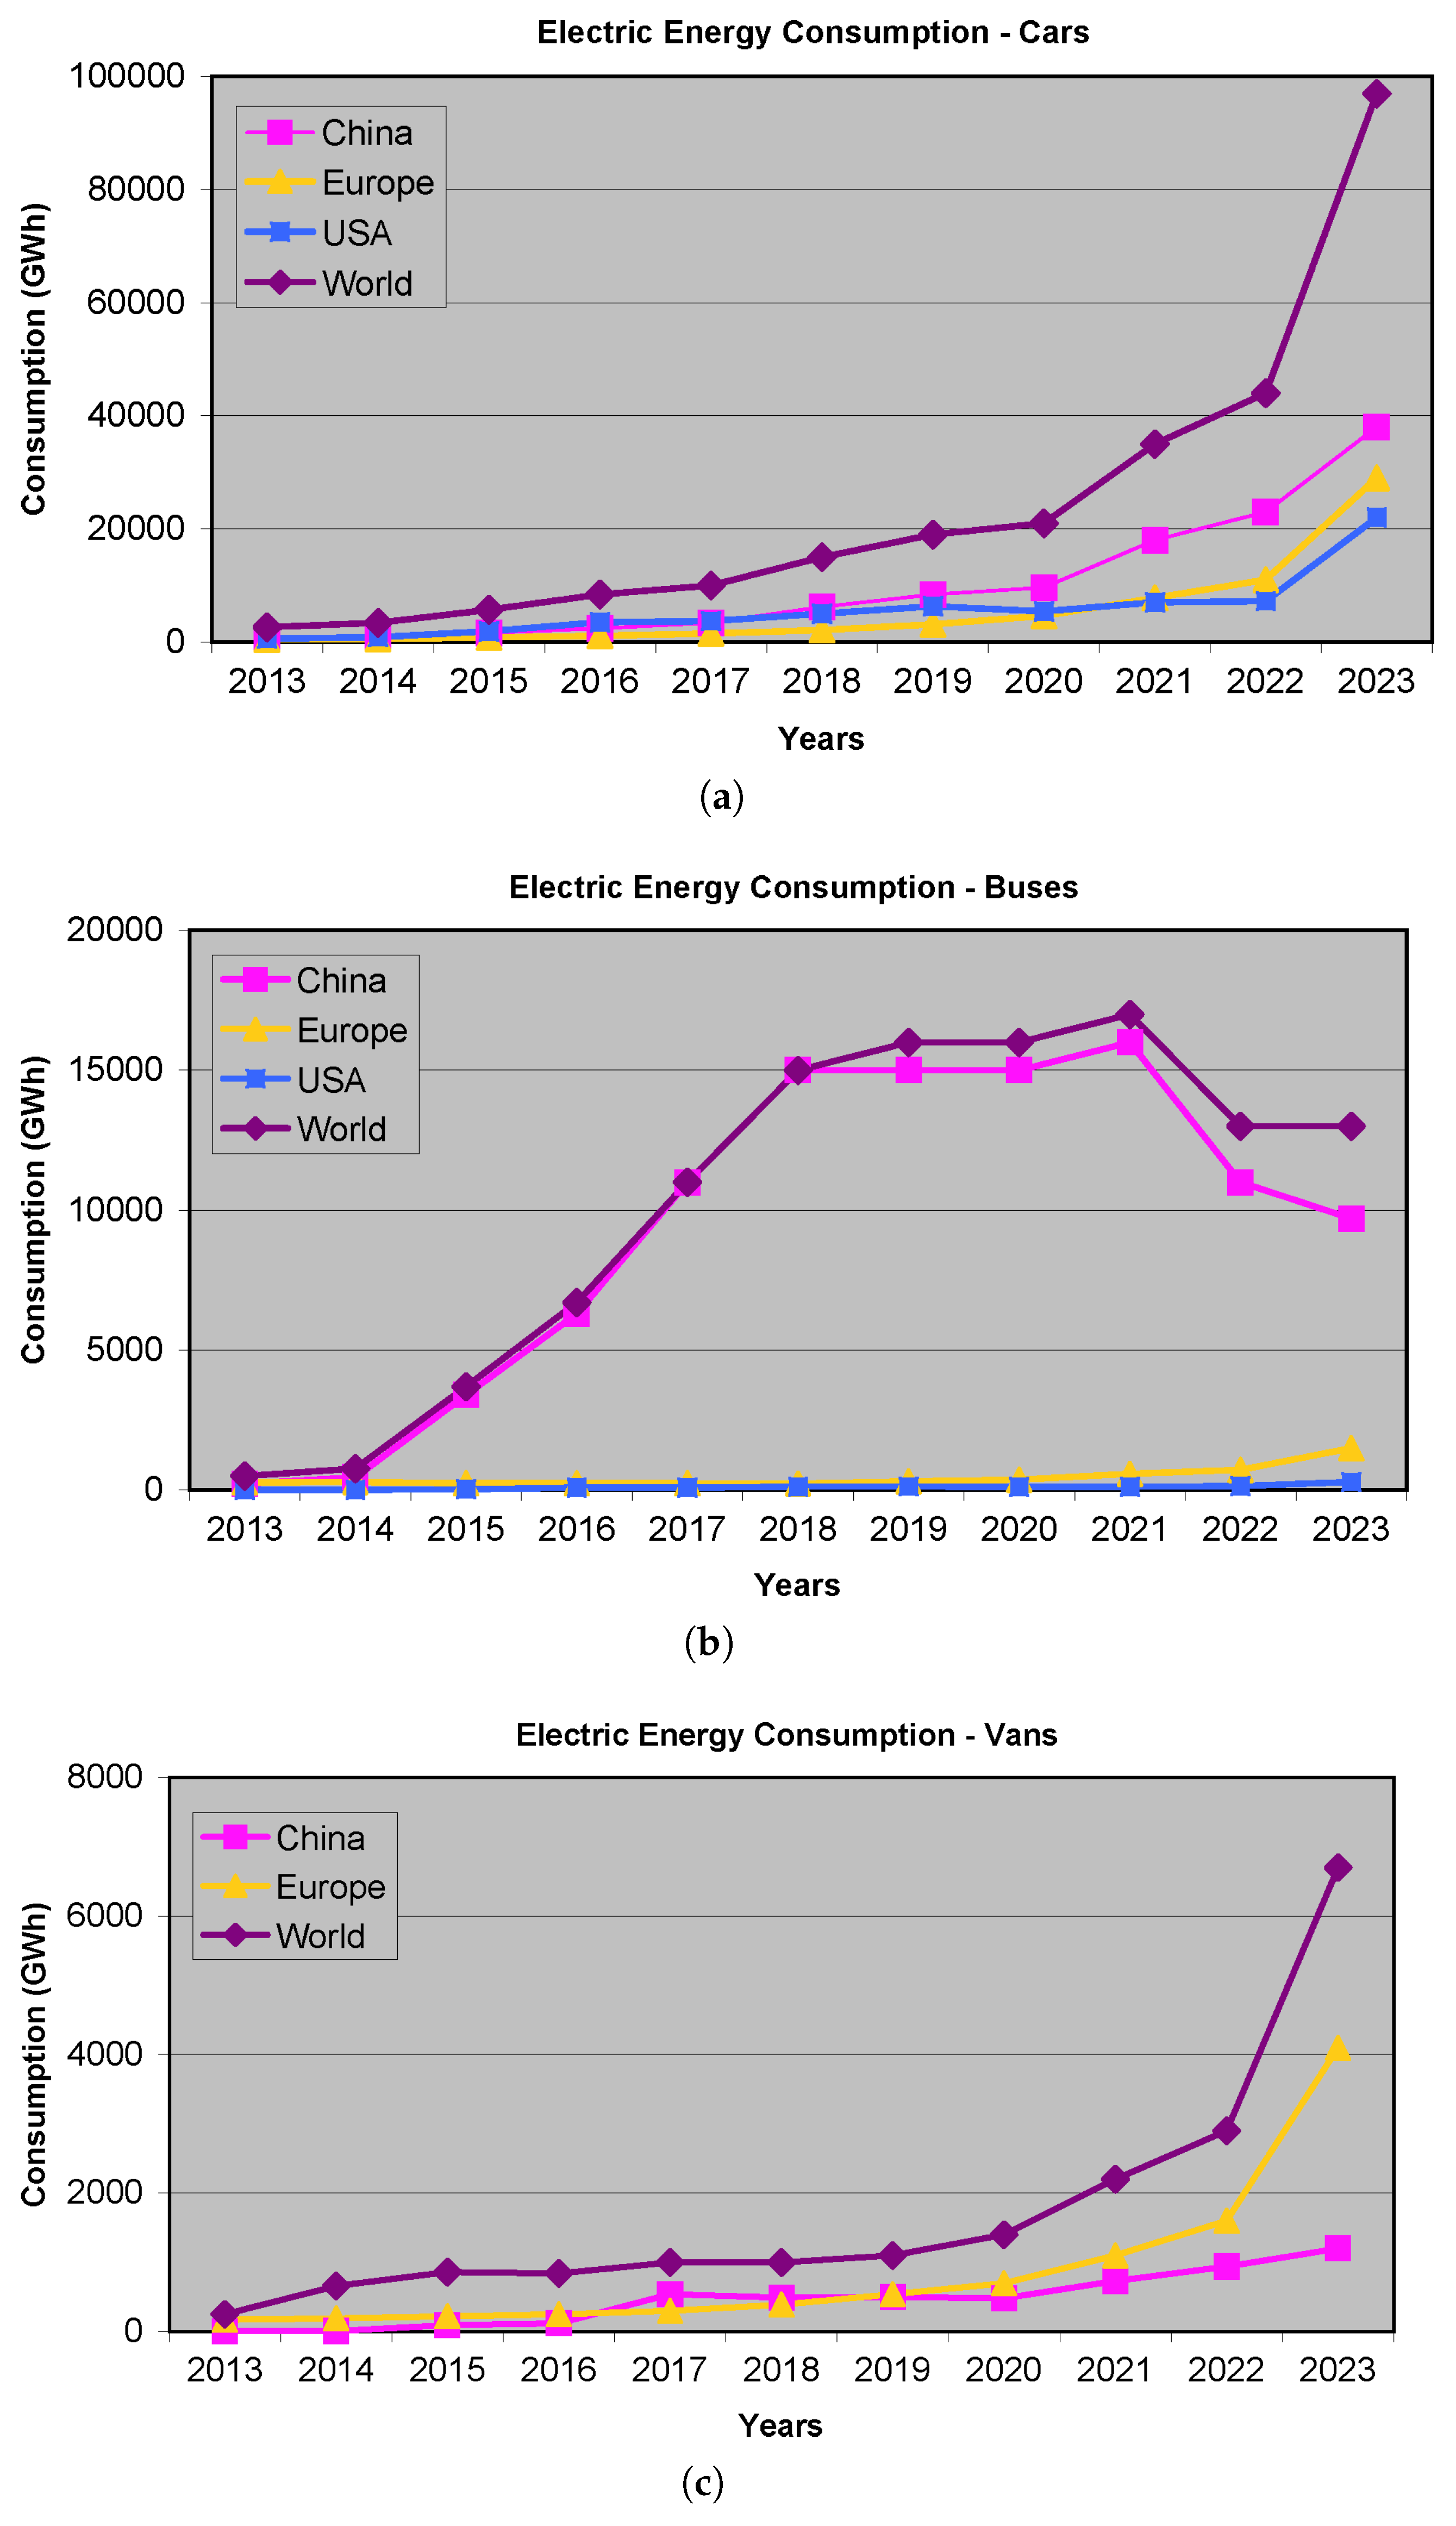
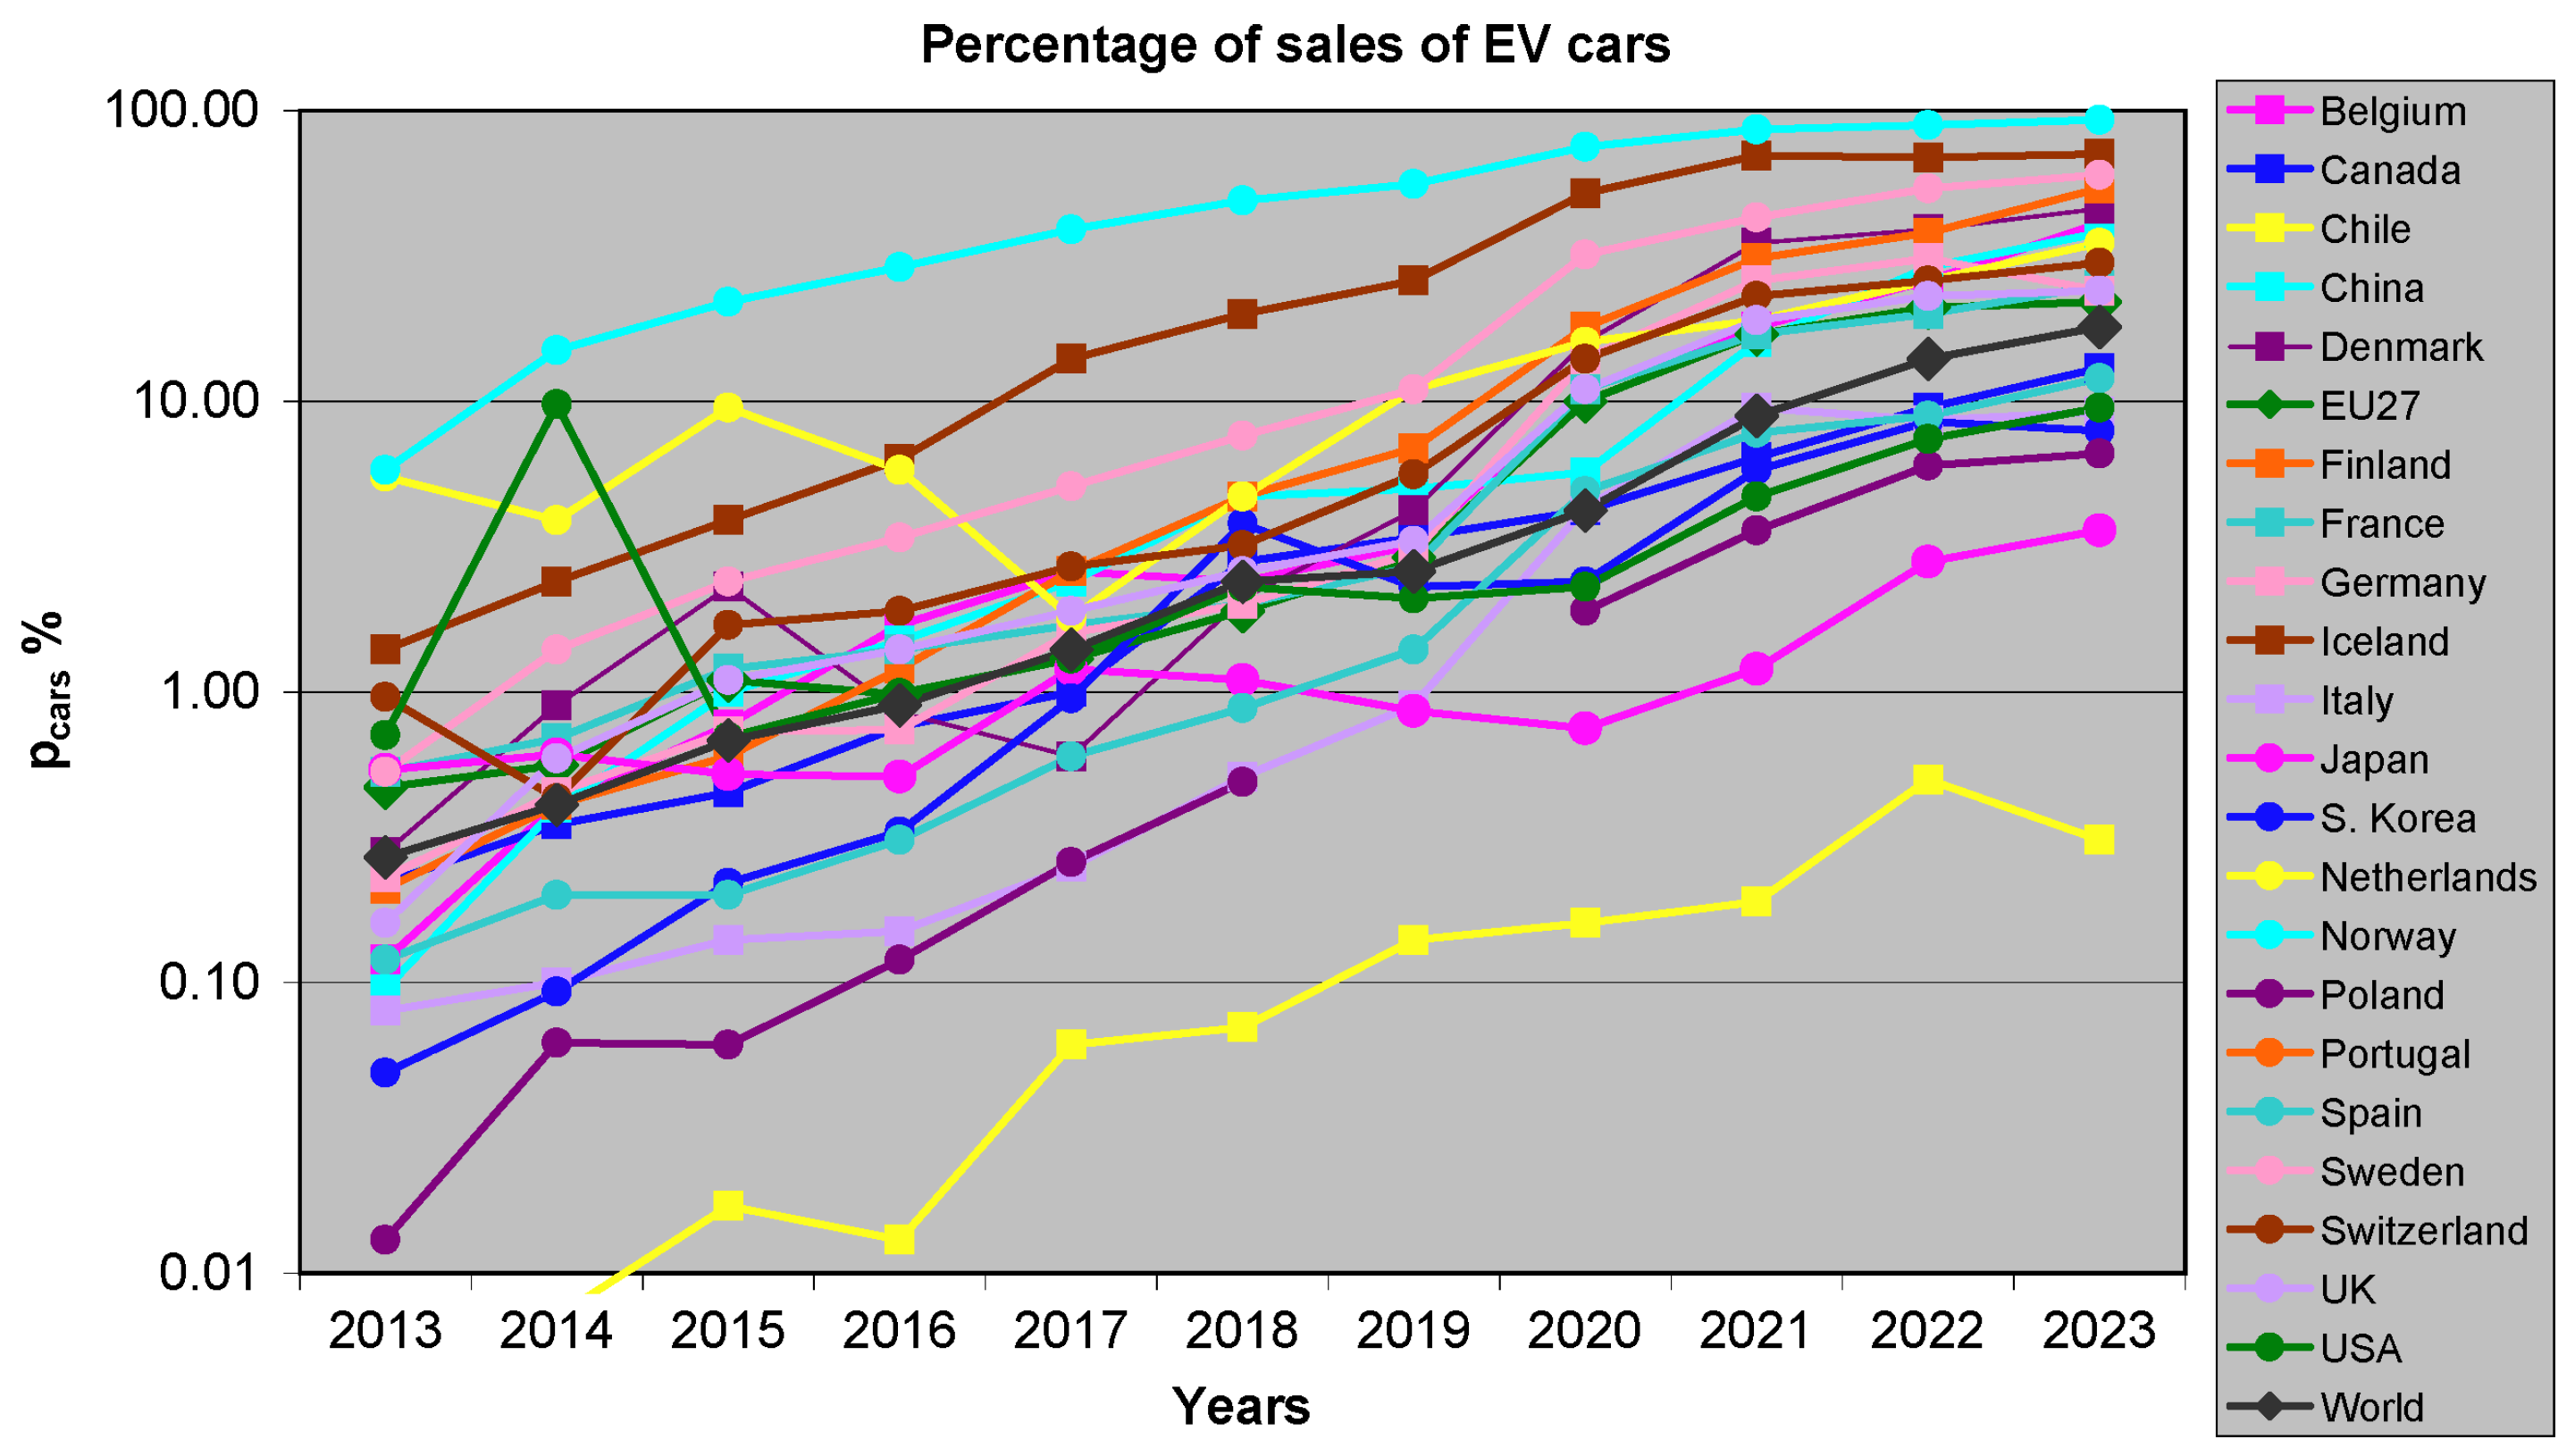
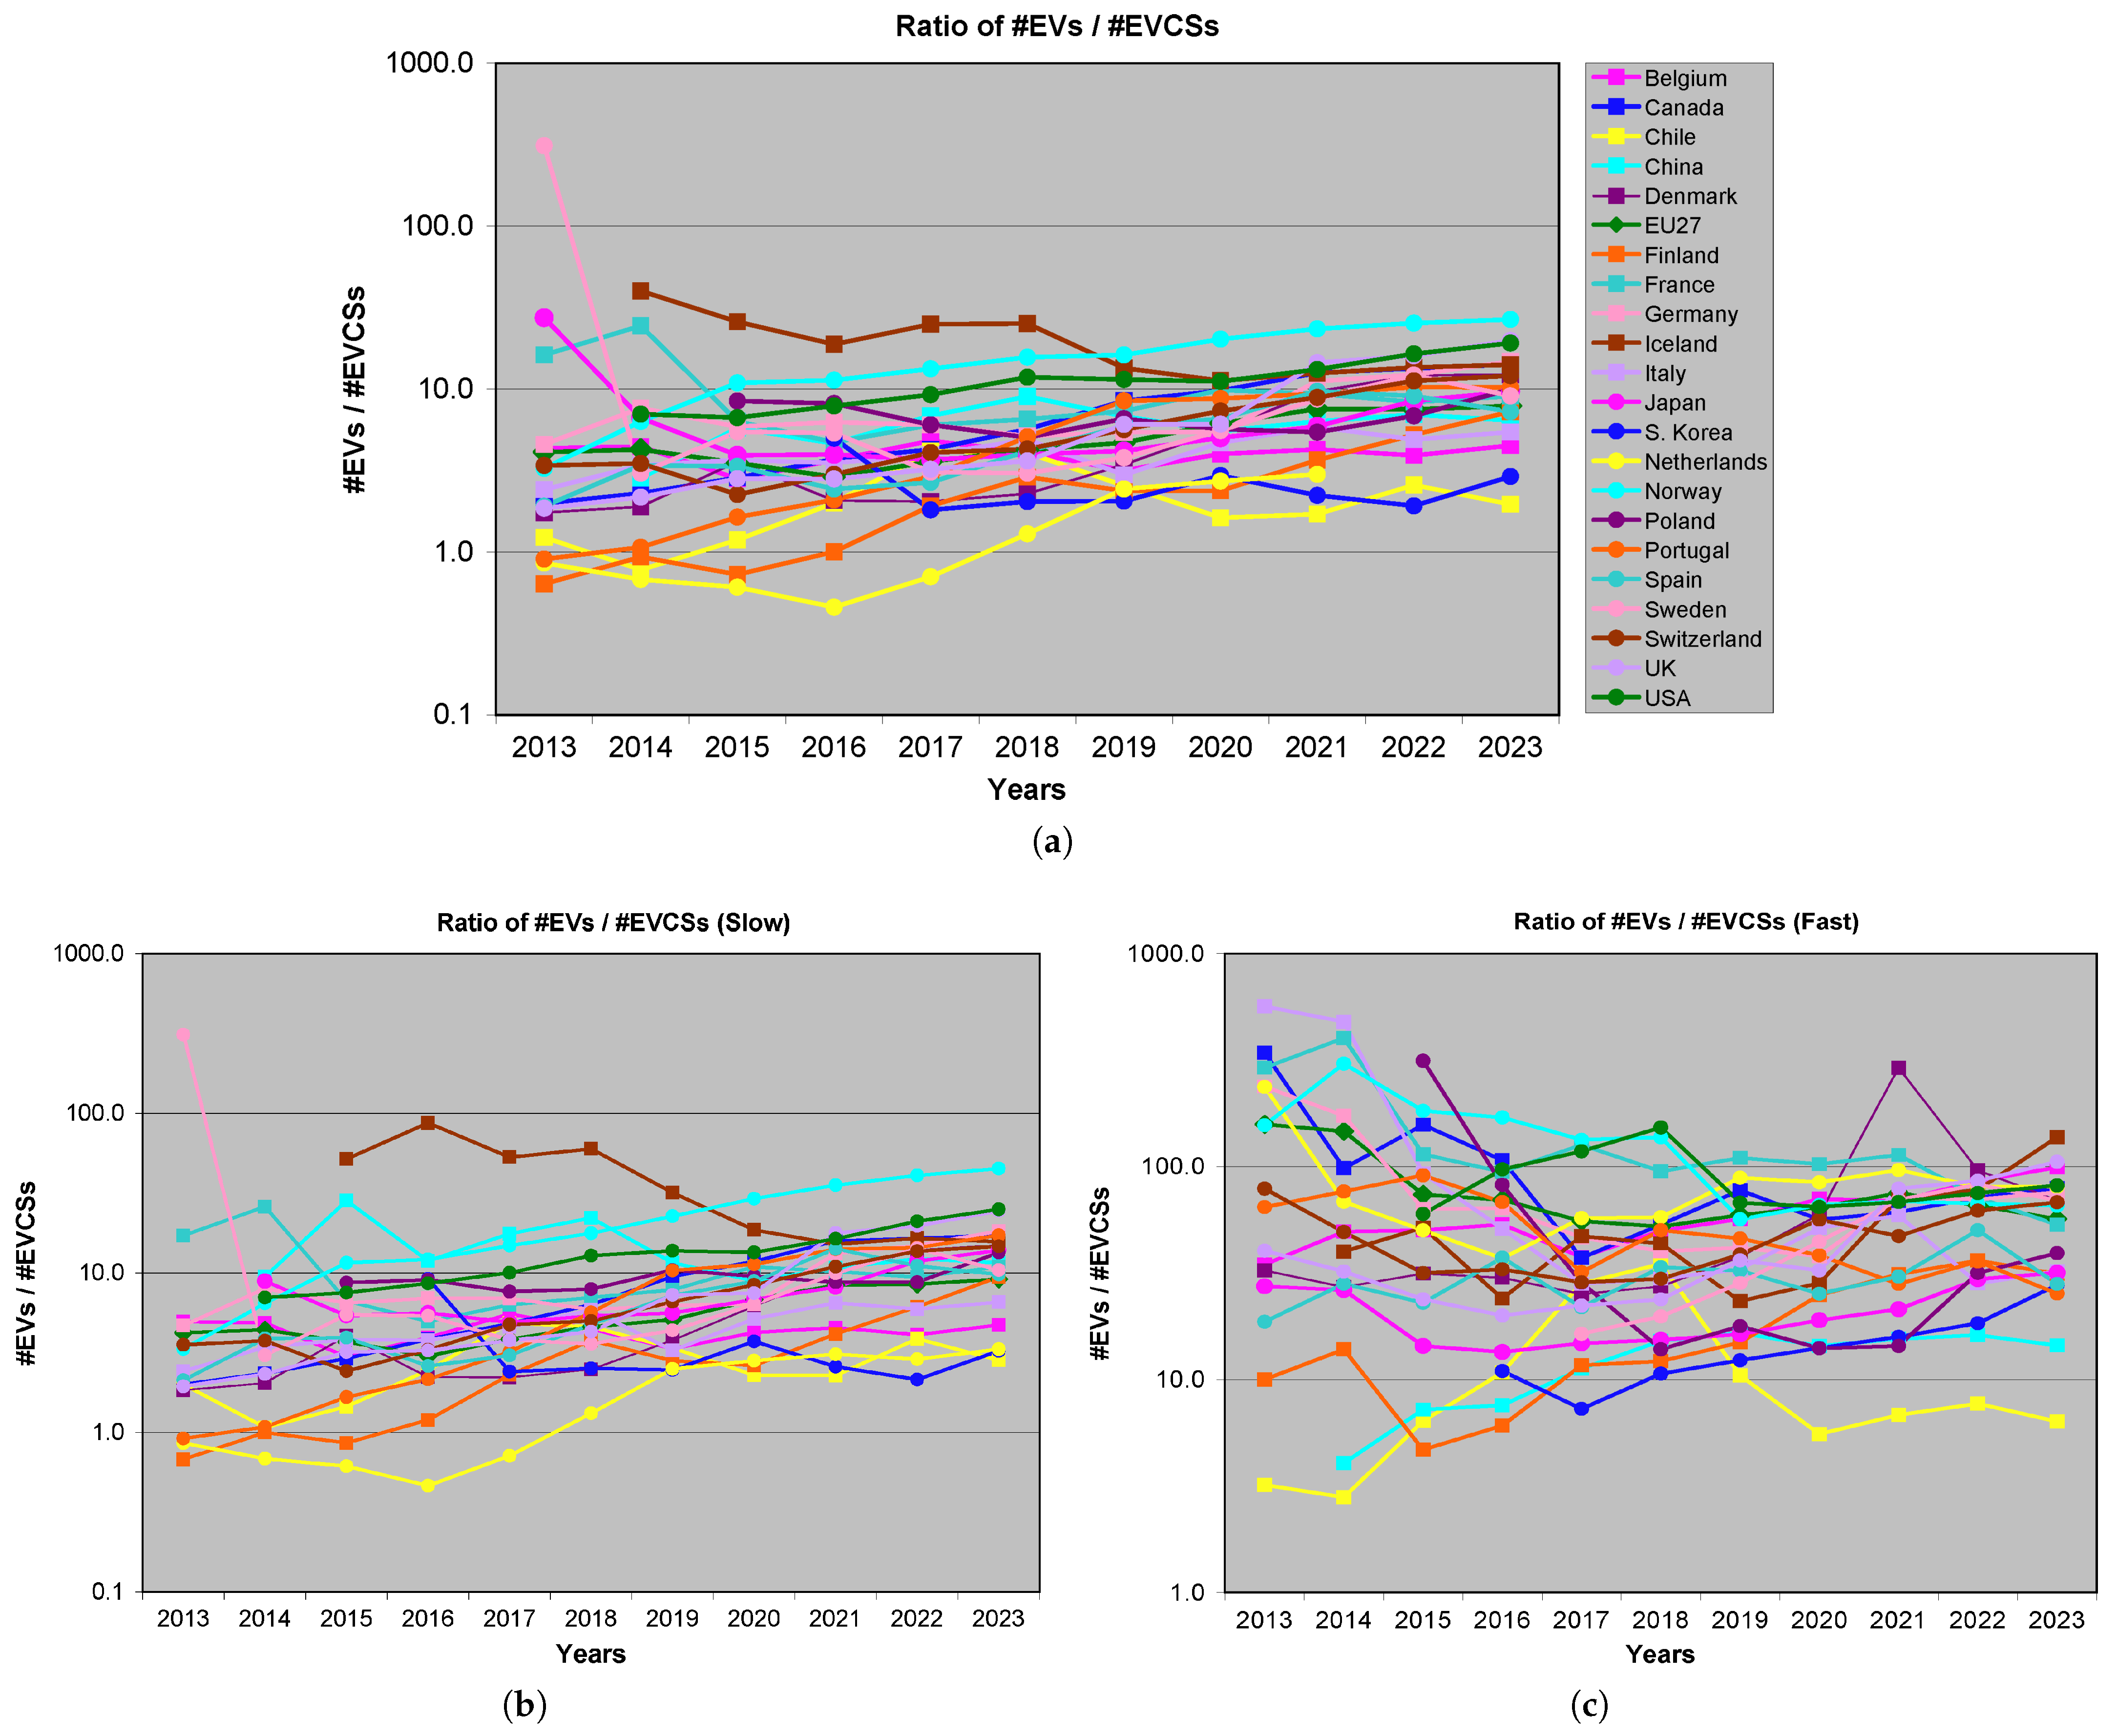
The discussion is carried out based on a set of indexes that are described below, subdivided by countries (or in some cases macro-areas like EU27 and Europe) and plotted against the 11-year interval 2013-2023 to show trends and maturity of EV deployment and infrastructure after about 10 years of electromobility policies. The graphs in Figure 1, Figure 2, Figure 3, Figure 4, Figure 5, Figure 6 and Figure 7 were generated by the authors from a compact dataset compiled from publicly available sources. EV and EVCS data were mainly obtained from the IEA datasets [23,24,25,26,27], while population, surface-area and energy-consumption data were taken from the public sources cited below and harmonized in the accompanying dataset [28].
  • The actual EV electric load is evaluated by the yearly energy consumption E E V measured in GWh, distinguishing also the one for private cars only ( E c a r s ). The relevance of such consumption is weighted against the overall electric energy consumption for the transportation sector ( h E V , t r = E E V / E t r ) and the global electric energy consumption ( h E V , g l = E E V / E g l ), both expressed in %; considering EV cars alone, we get h c a r s , t r = E E V / E t r and h c a r s , g l = E E V / E g l .
  • Instead of using the actual electric load of electromobility above, one may focus on the potential load, represented by the nominal charging power of EVCSs; since the EVCSs are generically classified as “fast” and “slow”, the nominal powers P f a s t and P s l o w are assigned using the average nominal power values of the latest charging solutions, assuming that the very old ones are progressively replaced, ending up with P f a s t = 177 kW (having assumed a mix of 30%, 30% and 30% of the CCS type 72 kW, 150 kW and 250 kW EVCSs plus 10% of the newest 350 kW ones), and P s l o w = 26 kW (having assumed a mix of 30%, 35% and 35% of 11 kW, 22 kW and 43 kW EVCSs). The associated power consumption is calculated by multiplying the “P” terms by the corresponding number of EVCSs of that type; assuming an average utilization time T u over 1 day (e.g., 8 h), it is possible to estimate the hypothetical energy consumption E E V C S = [ N f a s t P f a s t + N s l o w P s l o w ] × T u that can be compared as above to that of transportation sector and global, obtaining k E V C S , t r = E E V C S / E t r and k E V C S , g l = E E V C S / E g l . When compared with the overall consumption of electric energy per country, it provides an indication of the feasibility of the increased load.
  • The ratio of the number of EVs (of BEV type) to the number of EVCSs ( k = N E V / N E V C S ) indicates the average percentage of utilization, so separating the information of the number of EVCSs alone from the expected utilization capability;
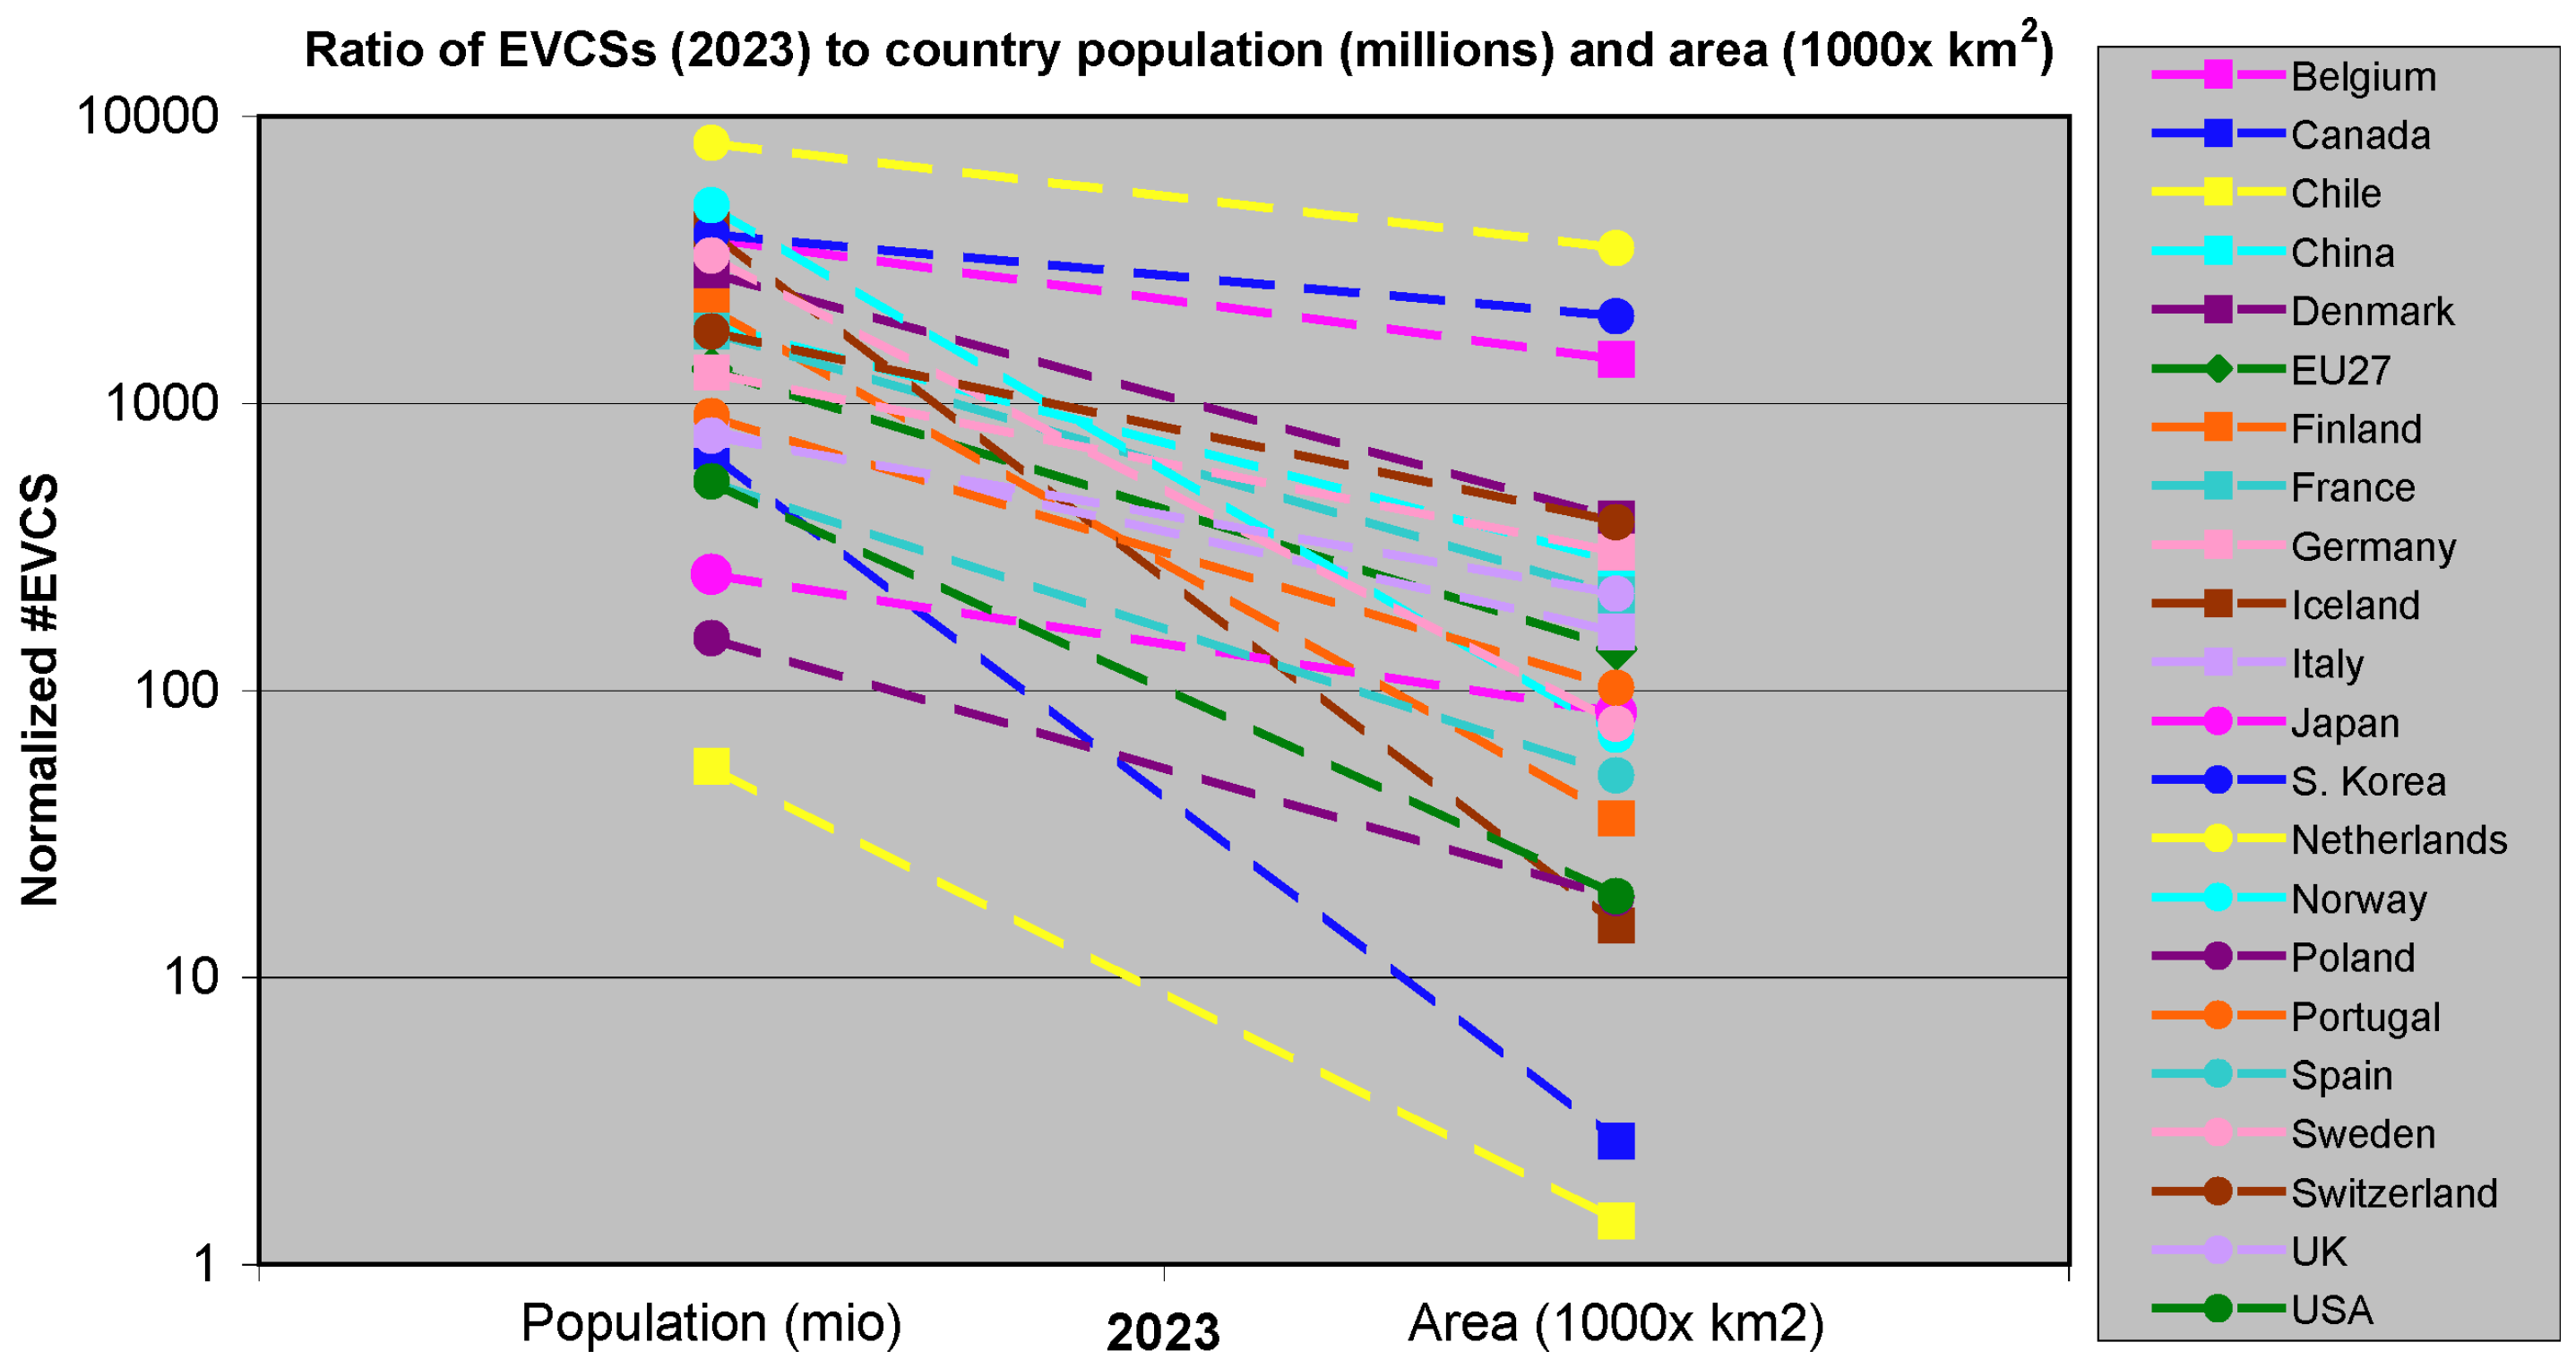
  • The ratio of the number of EVCSs to the country area in thousand km2 ( q a = N E V C S / A ) and population P in millions people ( q p = N E V C S / P ) gives an indication of the density on the territory and the effectiveness of reaching the final users, respectively, indirectly assessing the availability and effectiveness of charging solutions.
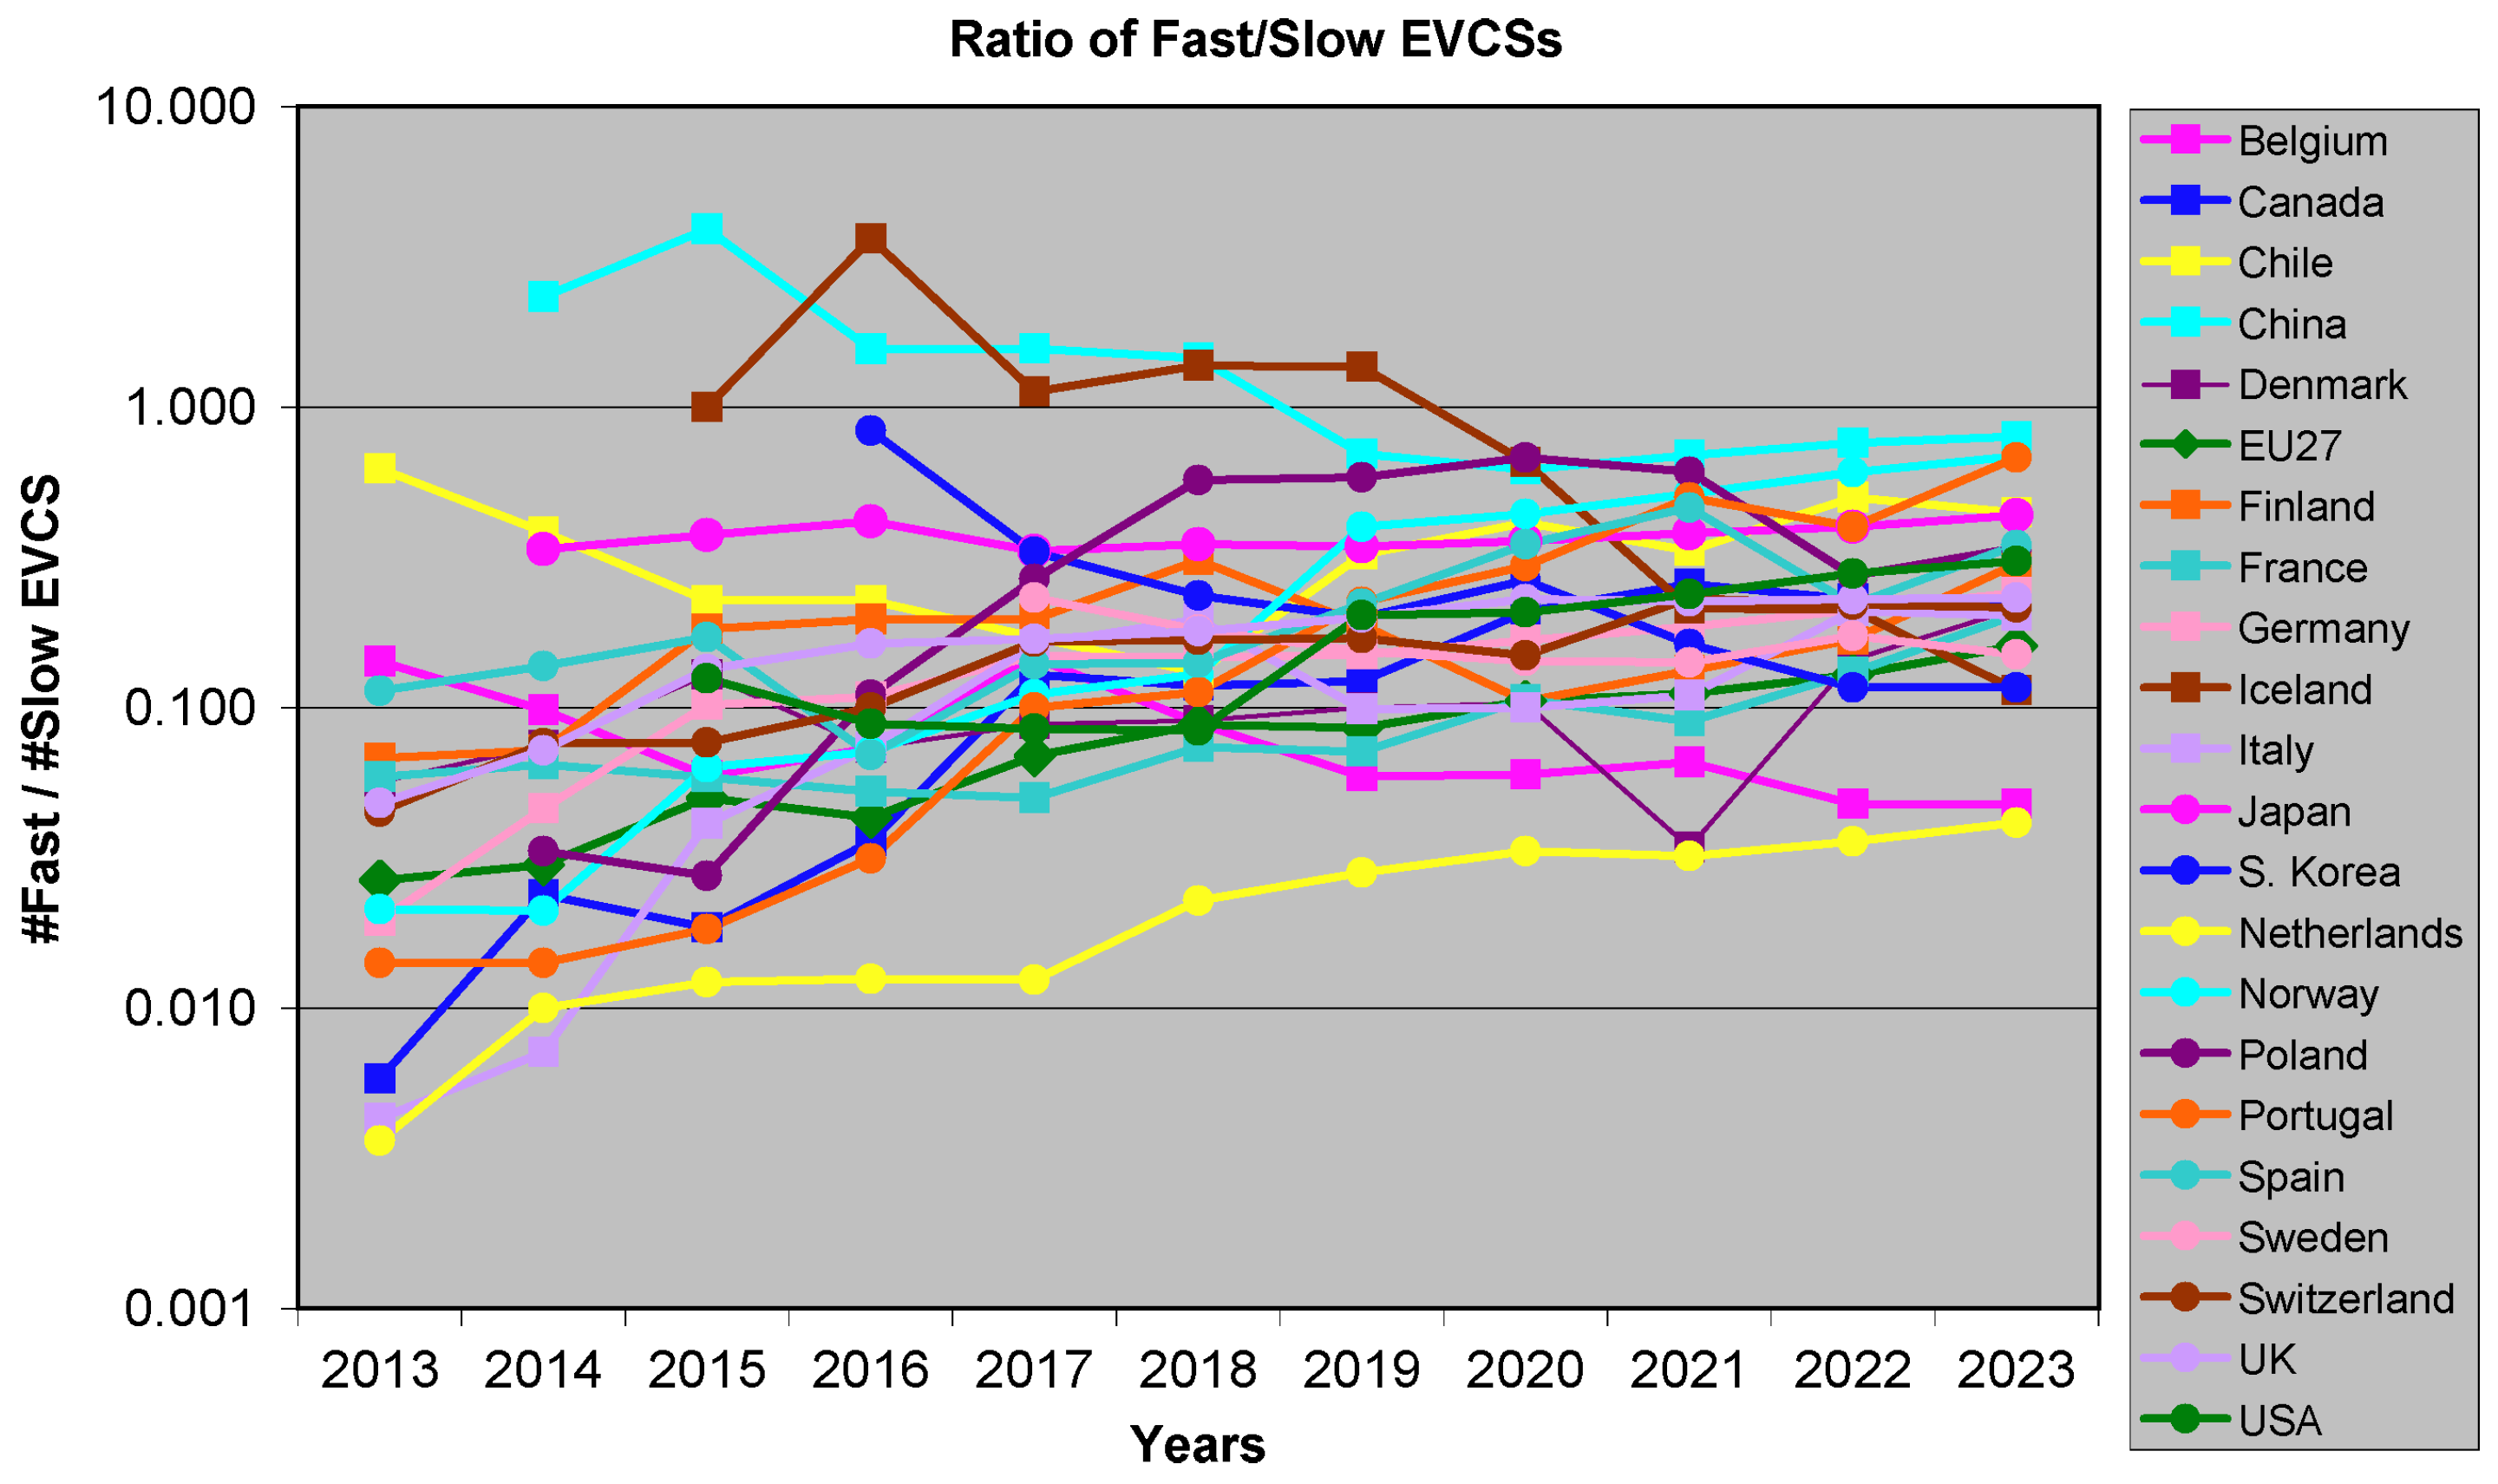
  • Since faster charging is on the one hand attractive for users’ experience and removing facilities’ bottlenecks, but represents an increased burden on the electricity grid, the ratio of the number of fast to slow EVCSs is also considered as index z = N E V C S , f a s t / N E V C S , s l o w (having taken slow and fast types, ignoring the specific power level).

2.2. Overall Electric Energy Consumption

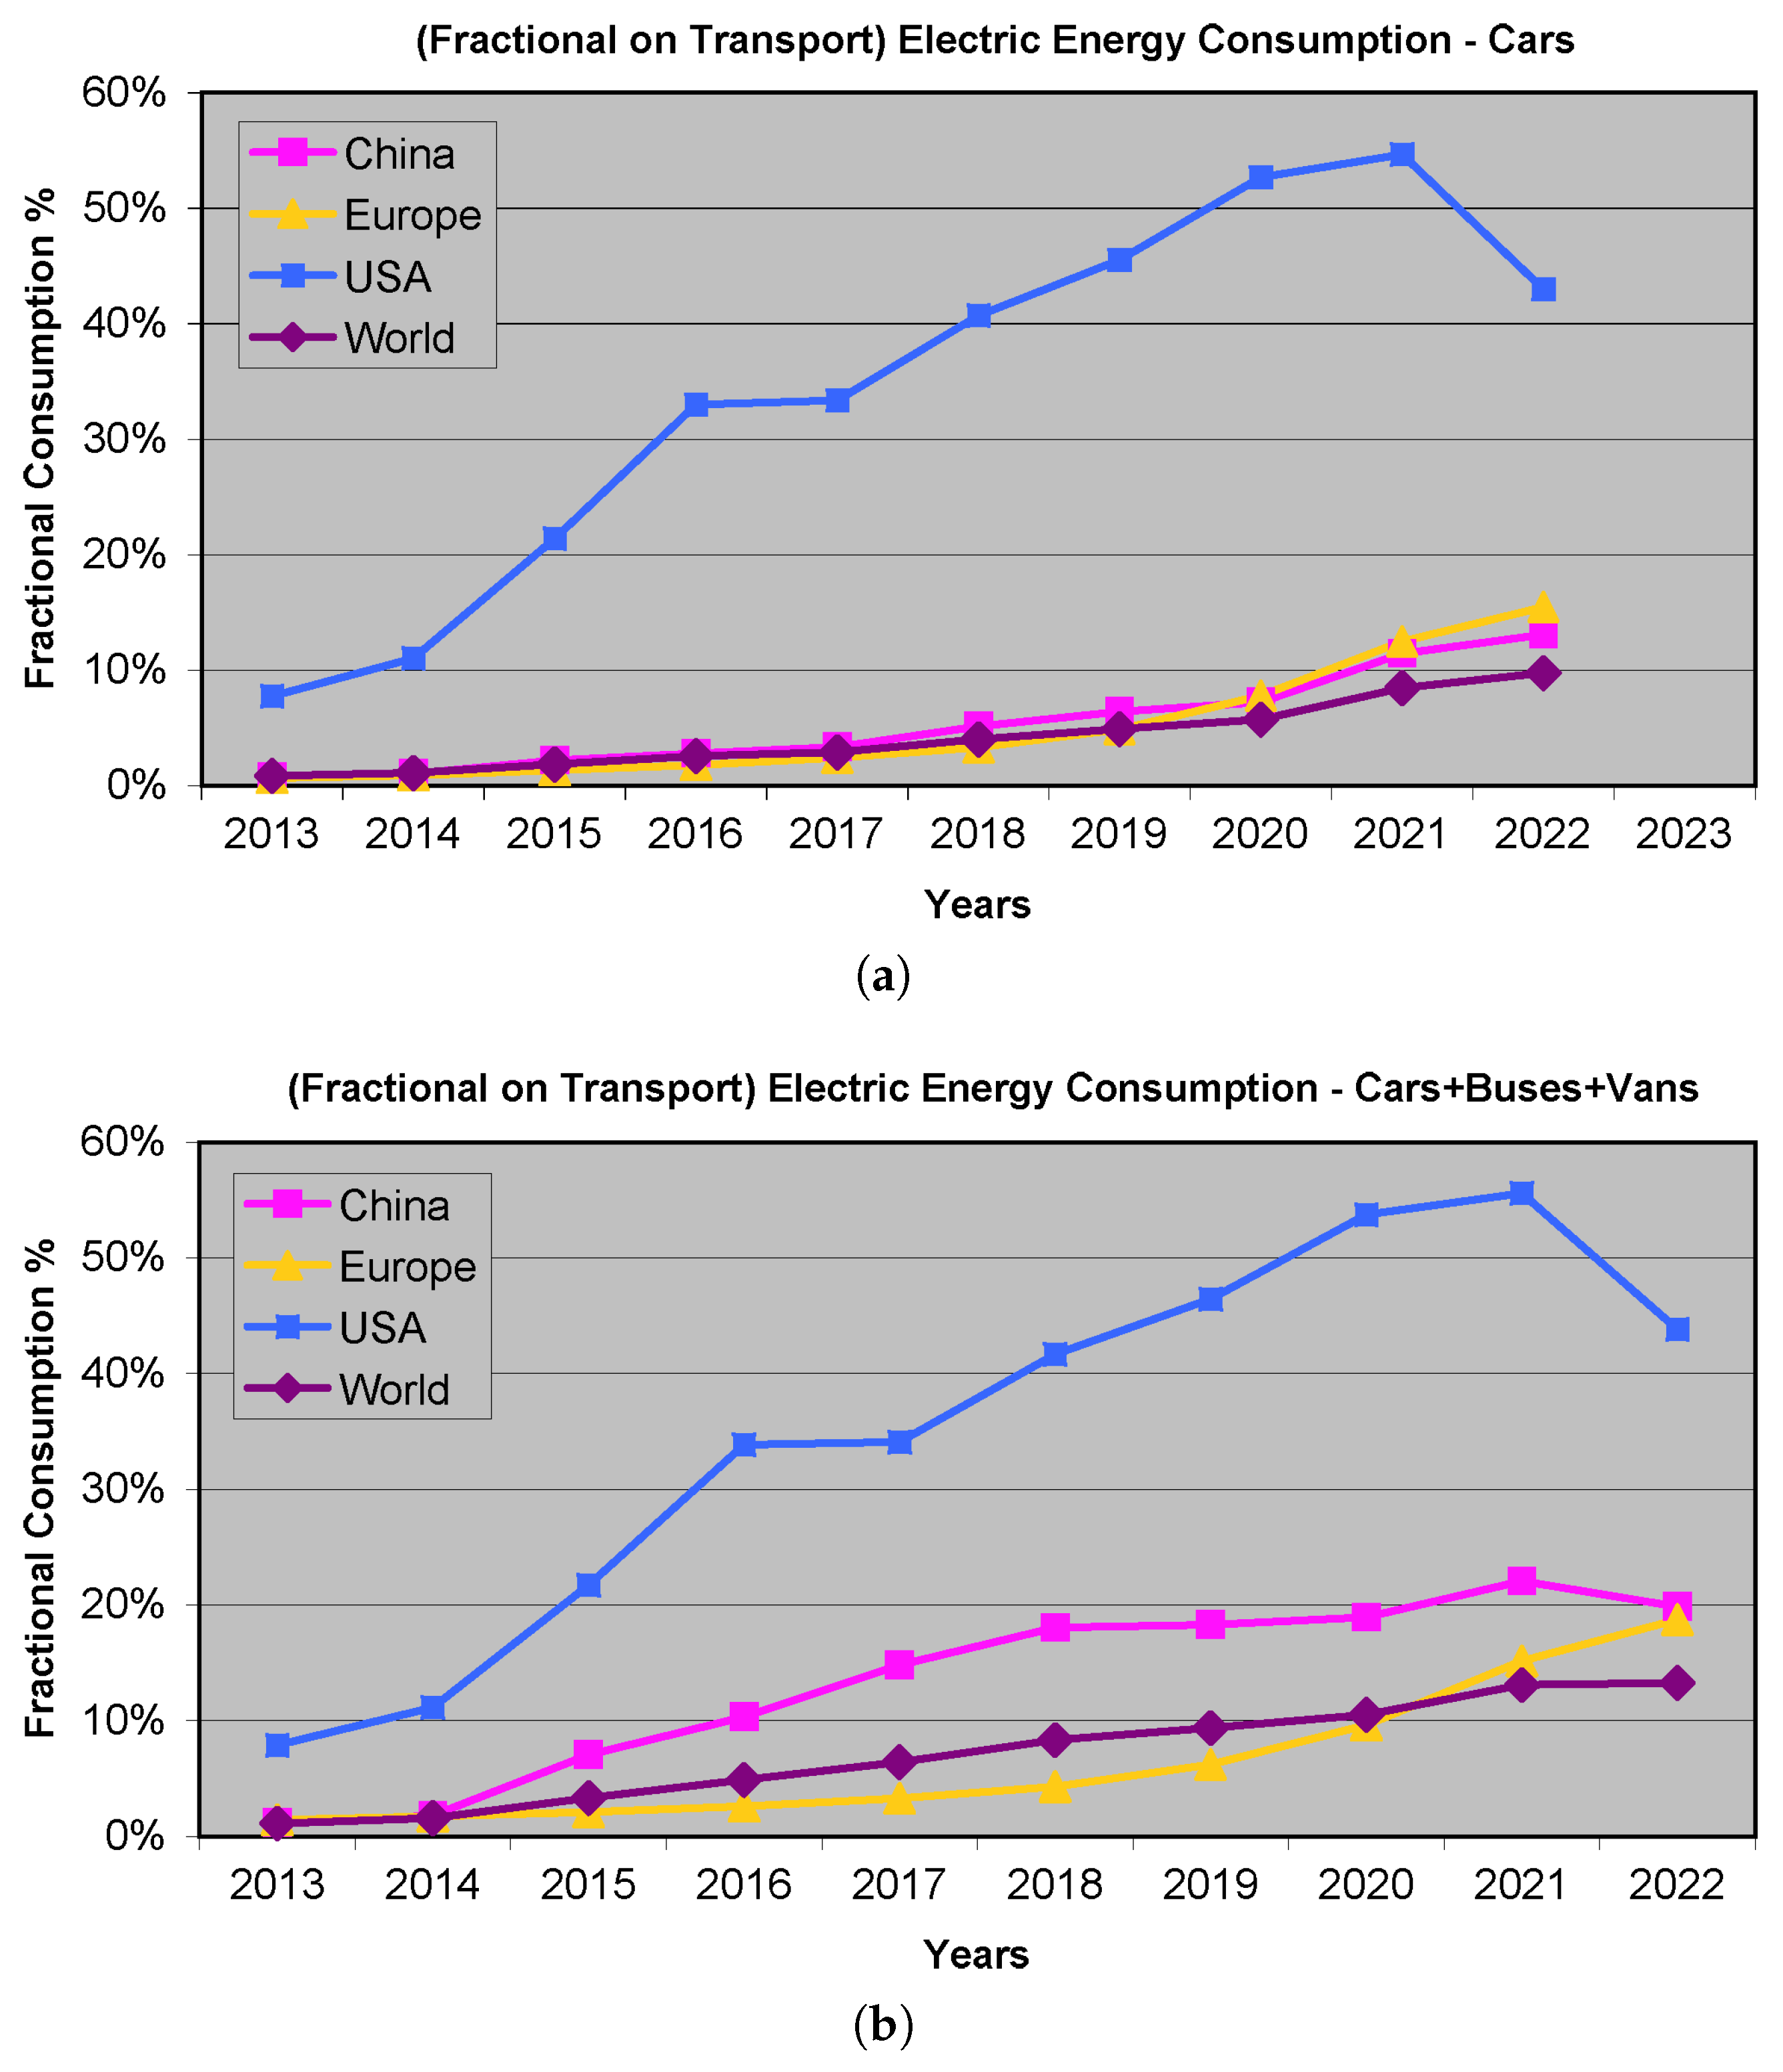
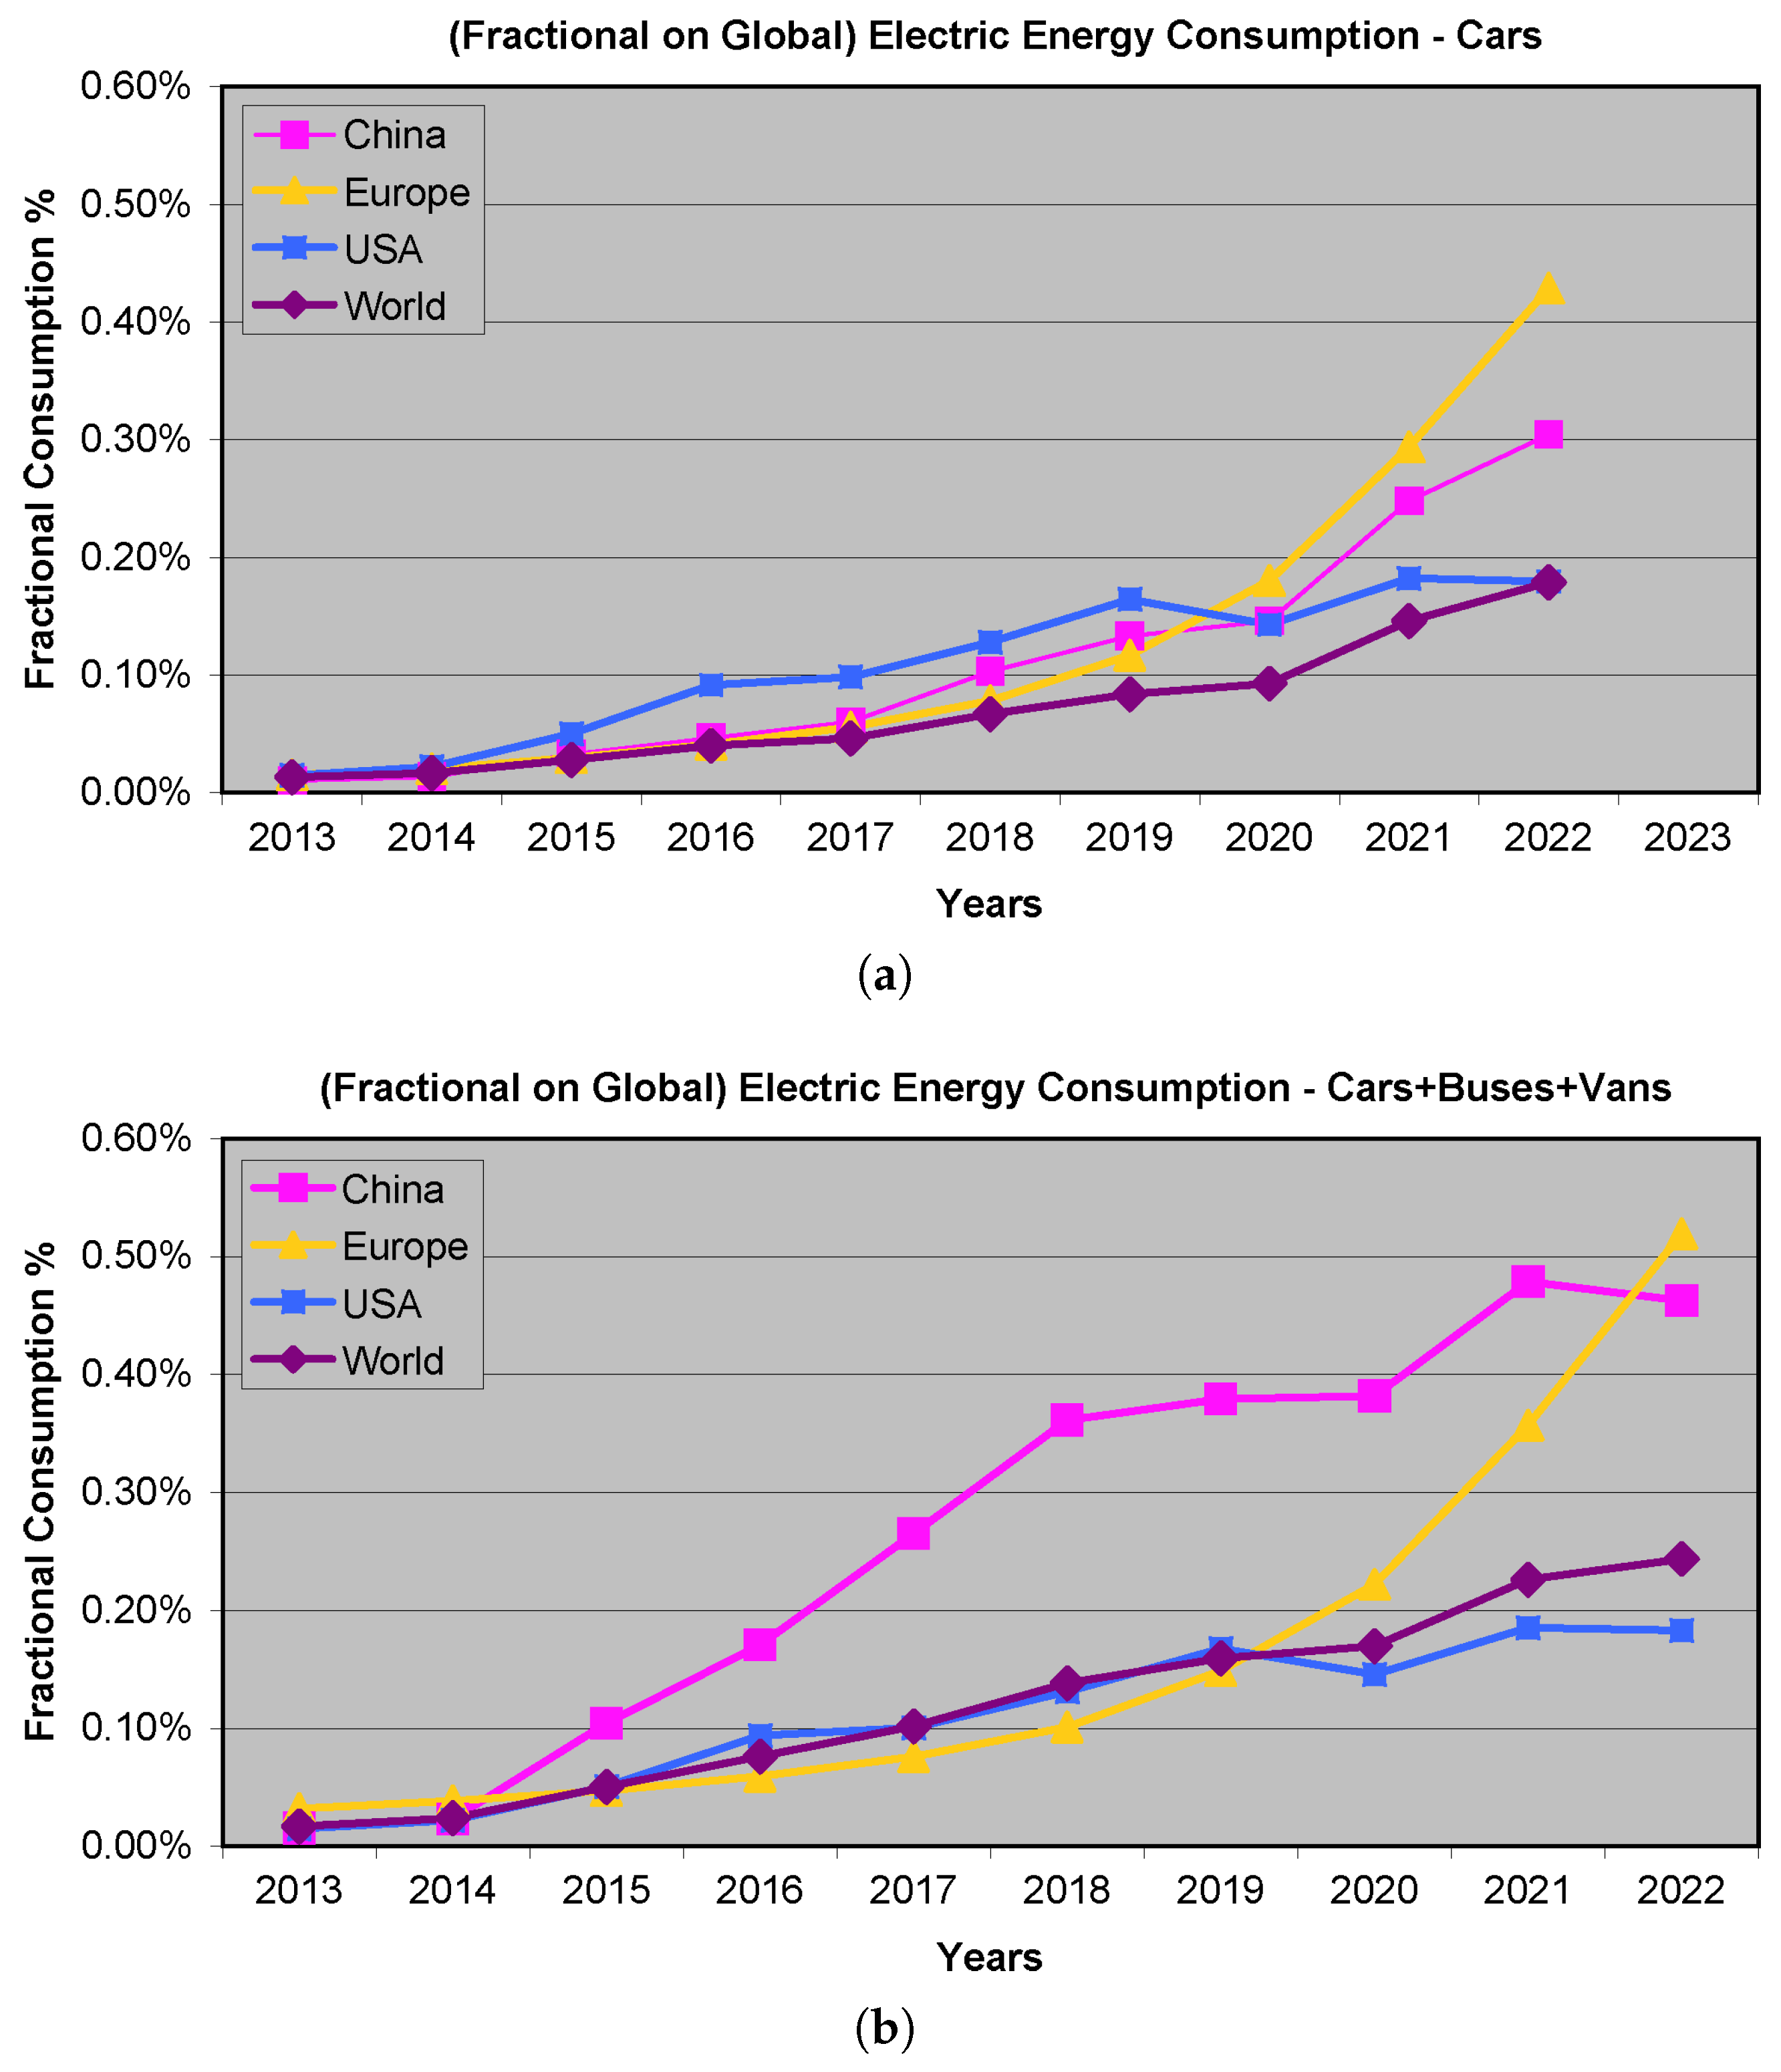
Considering Figure 1, we can observe an increased tendency for EV cars for all the 3 macro-areas (China, USA and Europe) and globally for the world-wide index. A similar tendency can be observed for EV vans, with two remarks: the US have no relevant figures for vans (almost non existing) and Europe leads over China. Conversely, public transport (EV buses) are significantly higher for China than for Europe, and most of all for the US. In the US the EV electric load represents the vast majority of all forms of electric transportation (see Figure 2, where h c a r s , t r and h E V , t r are reported). Railways there, in fact, rely on diesel locomotives, and only some commuter lines, as well as all city metros and tramways, are electric.
Figure 2 shows the larger US annual fractional consumption (almost 50%) compared to the energy consumption of the entire transportation sector, confirming the impact of cars and the absence of electrified collective transportation means.
The indexes based on fractional energy consumption, namely h c a r s , t r , h E V , t r , h c a r s , g l and h E V , g l , must be interpreted jointly, since their variations may originate from changes in either the EV electricity demand or the normalization denominator. For example, the drop observed for the USA between 2022 and 2023 in h c a r s , t r does not necessarily imply a reduction in EV charging demand. Since EV car sales continued to increase and h c a r s , g l remained almost constant, the most plausible interpretation is an increase in the total electric energy consumption of the transportation sector, E t r . This example shows why EVCS impact cannot be assessed from a single normalized index, but requires comparison of EV energy use, transport-sector consumption, global electricity consumption, EVCS deployment, and installed charging power.
These results confirm the rapid growth of EV electricity demand, while also showing that normalized indicators must be interpreted together with the underlying energy-consumption denominators.
Figure 3 complements this comparison by normalizing EV electricity consumption with respect to the overall electricity consumption, through the indexes h c a r s , g l and h E V , g l .

2.3. Evolution of Number of EVs and EVCSs

Two questions immediately arise from the data of the previous Section 2.2: “are the actual levels of electromobility consumption high for the existing electric infrastructure?” and “are they going to increase?”
Figure 3 shows that the present EV electricity demand, represented by E E V and by the normalized indexes h E V , t r and h E V , g l , remains small when compared with total national electricity consumption, with h E V , g l < 1 % in the cases considered. However, this aggregate figure is not sufficient to assess grid impact. EV charging is not uniformly distributed over the whole power system, but is mainly connected at LV and, for larger installations, MV levels. Therefore, even a modest value of h E V , g l may correspond to significant local stress on MV/LV transformers, LV feeders, voltage profiles, and power-quality levels.
The growth potential is better captured by the evolution of EV sales and by the installed EVCS infrastructure. The relevant issue is not only whether E E V is already large at national level, but whether the local distribution grid can accommodate the expected increase in charging simultaneity and installed charging power. For this reason, the energy-based indicators are complemented by infrastructure indexes describing charger availability, spatial distribution and charging speed, namely k = N E V / N E V C S , q a = N E V C S / A , q p = N E V C S / P and z = N E V C S , f a s t / N E V C S , s l o w .
Figure 4 reports the yearly BEV share of vehicle sales, which provides an indication of the progressive replacement of conventional vehicles by externally charged EVs.
Figure 5 shows that q p and q a provide complementary information. The population-normalized index q p is more directly related to the potential availability of charging points for users, whereas the area-normalized index q a reflects territorial coverage but is strongly affected by population distribution. For this reason, countries with large scarcely populated areas may show relatively good q p values, but low q a values. The two indexes should therefore be interpreted together, rather than as independent rankings.
Figure 6 reports the ratio k, which can be interpreted as an indicator of potential pressure on public charging infrastructure. Low values suggest a larger number of public chargers relative to the circulating EV fleet, while high values indicate that each public EVCS must serve, on average, more vehicles. The separate slow- and fast-charger panels clarify whether this pressure is mainly associated with long-dwell charging infrastructure or with high-power charging points.
Figure 7 reports the fast/slow EVCS ratio z. This index is relevant electrically because fast EVCSs are essential for highways, transport corridors, and fleet operations, where short dwell times are required, but they also concentrate demand in space and time. Slow EVCSs remain suitable for residential, workplace, and long-dwell urban charging, imposing lower instantaneous stress on the grid, but requiring wider spatial availability. From the grid perspective (discussed in Section 3), this distinction is important because charging speed and spatial concentration directly affect local feeder loading, transformer stress, voltage profile and PQ conditions.
The indexes introduced in this section are not intended to rank national electromobility policies, but to provide a compact link between EVCS deployment and the electrical phenomena discussed in the following sections. The energy-based indexes indicate whether EV charging is becoming relevant at system level, whereas k, q a , q p and z provide proxies for charger availability, spatial concentration, and fast-charging intensity. These quantities are then reflected in the technical issues reviewed below: feeder and transformer loading depend on installed charging power and simultaneity; voltage drop and unbalance depend on spatial and phase allocation; harmonic and supraharmonic emissions depend on the number, type, and operating point of connected chargers; and impedance/resonance effects become more critical when several converter-interfaced chargers operate in electrically close locations.

3. EVCS Impact on the Grid: Power Absorption and Distortion

As anticipated in the Introduction, the relevant factors affecting the impact of EVCSs on the distribution grid are mainly four:
  • significant power absorption levels (especially for the EVCSs capable of fast charging) and compatibility with the grid capabilities, also considering future grid expansion and viable energy solutions;
  • asymmetrical loading [29] causing network unbalance;
  • modification of the grid impedance as seen by other loads, including resonance phenomena;
  • conducted emissions and distortion with the risk of a significant increase compared to existing levels, increasing network losses and compromising electromagnetic compatibility (EMC) and operation of other loads in both residential, light industrial and industrial applications.
Many of these factors are equally shared for grids of the AC or DC type. In general DC distribution grids in the form of microgrids [30] are becoming preferable to sustain the large transient power flow required by fast charging thanks to the intrinsic “tank effect” of both energy storage devices (e.g., batteries and supercapacitors) and filter devices, i.e., capacitors. The larger amount of deployed capacitance, of course, can worsen stability aspects and increase high-frequency current components.
There is also a subtle relation between power and distortion, in relation to the definition of useful power and contribution of distortion components [31]. Useful power in an ideal AC system corresponds to the active power at the fundamental P 1 . It is acknowledged that with traditional conversion schemes distortion components (e.g., harmonics) do not provide additional useful power and efficiency η may be then straightforwardly defined as η = P 1 , out / P 1 , in . However, when smart conversion and rectification processes are involved, harmonic active power may be able, for example, to contribute to the charging of a capacitor or battery, thus increasing the term P 1 , out with a term Σ P h , in for selected harmonic active power terms.
Always from an energy standpoint, distortion components bring along increasing power losses by a range of phenomena (skin effect, proximity effect, dielectric losses), often more relevant with increasing frequency [32].
The following subsections review simulation- and measurement-based studies on EVCS impacts on network assets and PQ.

3.1. Impact on the Distribution Network Assets

Simultaneous utilization of EV chargers impacts the stability and operation of the electrical power system. Studies show that network assets such as power system transformers and cables can get overloaded at certain hours of the day. This connects directly with the deployment indicators of Section 2: high values of installed charging power, fast/slow charger ratio z, and local EVCS density increase the probability of simultaneous high loading of feeders and MV/LV transformers.
Under these operating conditions, additional increase in system load due to additional EV charging (especially during peak) could cause the network assets to reach and exceed their thermal limits [33]. An overview of the impact of EVs on the electric grid has been discussed in [34,35,36,37], showing that network losses and transformer and feeder overloading can increase when EV penetration increases and when uncontrolled charging is employed. Up to 6% increase in transformer losses, and 10% reduction in transformer lifespan has been shown when transformers operate under distorted supply voltages [38]. A 10% uncontrolled EV charging can increase the peak demand by 18% [39]. Additional current from EV charging can cause extra heat in the distribution transformers, which causes hot-spots, reducing the transformer lifespan.
A quadratic relationship has been identified between harmonic emission currents and the useful life of a transformer. The harmonic current can increase the ohmic losses and reduce the conductor’s lifetime [40].
Cold weather also affects the influence of EV charging on network assets. Extra power is needed to heat the battery and the cabin’s car in winter, reducing the traveling range [41,42]. In Canada [43], experimental measurements have demonstrated that between +28 °C and −26 °C, the traveling distance for the Nissan Leaf and Mitsubishi i-MIEV reduced from 165 km to 55 km and 130 km to 45 km, respectively. The reduction in travel distance impacts the demand, as EVs need to be charged more frequently within a day. This was demonstrated for UK EV demand in [44] using a probabilistic approach, which showed that cold weather could increase EV-related demand by up to 630 MW. Lithium-ion battery performance is temperature-sensitive. When temperature decreases, EV battery power reduces due to an increase in the battery’s internal resistance [43,45,46]. The change in internal resistance slows the charging and discharging rate to preserve battery safety [42,47], elongating the charging duration of EVs, and therefore, affecting the energy demand and the availability of free EVCSs.
To mitigate the effect of EV charging on network assets, network reinforcement and controlled charging are proposed as feasible solutions. Several techniques are being used, involving droop control, Time of Use (TOU), demand response (DR), and smart charging (SC) enabled by energy metering infrastructure [48]. In renewable-assisted charging infrastructures, coordinated operation of local renewable generation, storage and EV charging can reduce net grid demand, but the benefit depends on local control, power-flow constraints and the converter-dominated behaviour of the microgrid [9,16,49].

3.2. Impact on the Voltage Profile

This section describes the impact of EV penetration level, charging location, charging power, charging rate, charging time, and different charging strategies on the voltage profile of a distribution system.
The voltage profile of a radial LV distribution network has been simulated and studied under the effect of different EV penetration levels [50]. Results show that voltage profile depends on EV penetration levels (25%, 50%, 75% and 100% considered) and charger location in the network. Remote ends of the feeders experience the most significant voltage drop during peak and off-peak demand. Similar results were reported in [51], where increasing EV penetration caused the voltage profile to drop below 0.95 pu.
In [52], an IEEE 33-bus network was used to assess the impact of charger location and charging level on voltage profile. Results show that higher charging levels have the greatest effect on voltage drop, while chargers located further from the feeder source cause larger voltage reductions.
The impact of different charging rates and charging times on the voltage profile and transformer loading has been considered in [53]. An IEEE 30-bus system was considered, combining an MV and an LV distribution network of 145 nodes. A 16 kWh battery with a useful capacity of 80% and 90% efficiency was considered for all the PHEVs. Two EV penetration levels (20% and 80%), several charging time periods (including peak and off-peak), and three charging rates are considered (slow, medium, and quick charging) employing 2.4 kW, 3.6 kW, and 11.4 kW chargers, respectively. Under a slow charging rate and low EV penetration, power losses remain minimal, whereas voltage drop increases regardless of the charging period. Voltage reduces to 0.88 pu (quick charging rate combined with low EV penetration), and to 0.8 pu (medium charging rate combined with high EV penetration), whereas network losses, load curve, and transformer overloading increase at peak times, demonstrating the significant impact that charging rate, charging time, and EV penetration level have on the network assets and voltage profile of a distribution network.
The impact of EV fleets on the voltage profile of a simulated distribution network included simultaneous charging of 896 and 500 EVs with slow single-phase chargers in [54] and [55], respectively. Voltage dips were observed when 20% of the EVs started charging simultaneously.
Uncontrolled and controlled charging strategies on the voltage profile were studied in [56] using a radial LV network feeding 20 to 30 EVs. While uncontrolled charging can significantly decrease the voltage profile and heavily overload the transformer, control charging based on either droop control (charging power reduced as a function of voltage magnitude), or peak shaving strategy (charging power as a function of next departure time and SOC) have demonstrated to be useful to maintain the voltage profile within statutory limits.

3.3. Impact on the Voltage Unbalance

Single-phase EV chargers can cause voltage unbalance in distribution networks [57]. The relevance of voltage unbalance is linked to the Section 2 indicators because the slow-EVCS component N EVCS , slow , which contributes to k, q a , q p and z = N E V C S , f a s t / N E V C S , s l o w , is typically dominated by AC chargers, many of which are single-phase at LV level. Therefore, growth in slow-EVCS density or in the number of EVs per EVCS may translate into local phase-asymmetric loading, depending on phase allocation and feeder topology. This section reviews these studies.
In [58], the impact of residential EV charging on voltage unbalance was analysed using a simulated Malaysian LV network with 3.3 kW Nissan Leaf single-phase onboard chargers. Results showed that the 2% unbalance limit was exceeded at 20% EV penetration when chargers were connected to the same phase. Similar findings were reported in [54] with 10% penetration. Distributing EVs across phases mitigated unbalance, although feeder and transformer thermal limits were reached at around 30% penetration.
A voltage unbalance sensitivity analysis was performed in [59]. Single-phase onboard chargers (10 A, 15 A and 20 A constant current charging), and three EV penetration levels (10%, 20% and 30%) were considered. Results demonstrate that voltage unbalance increases and decreases when EVs are connected to the most, and least loaded phase of the simulated distribution network. Similar results have been achieved in [60] involving Monte Carlo simulations, to show that a 50% increase in penetration causes a 36.5% increase in the probability of violating the unbalance limit. The negative sequence current rises with the increasing current-carrying capacity of the charger, as demonstrated in [61].

3.4. Conducted Emissions up to 2 kHz

This section discusses the EVCS emissions, the typical distortion levels found when AC and DC charging stations are employed, and the expected variability under different EVCS operating conditions. Dependency is expected and was observed due to the EV battery state of charge (SOC), charging power levels, charging rates (slow and fast), type of chargers (AC, DC, single phase, three phase), charger operating mode (constant current (CC), constant voltage (CV), multi-stage constant current (MSCC)), type of EVs, type of grid (rural, urban, industrial) and its characteristics, and environmental conditions.
Harmonic emissions studies show that the limits of distortion specified by the normative documents can easily be exceeded already under low EV penetration scenarios [62], and it was concluded that it is not the capacity of the distribution system that could limit the massive penetration of EVs, but the high levels of harmonic injection, which may exceed the limits. Harmonic distortion depends heavily on the charging mode/algorithm used, and it was shown [62,63] that current THD is usually larger in CV mode than in the CC charging phase, demonstrating the strong influence of battery SOC on harmonic emissions.
In AC charging mode with a more direct connection to the grid, many EV models adopting similar power conversion architectures seem to produce similar current characteristic harmonics, with the most prominent being the low-order characteristic harmonics (the 3rd, 5th, 7th, 9th, and 11th), and in some cases can go up to 1.5 kHz to 2 kHz with certain harmonics magnitude exceeding the standardised emission limits. Of course, technological choices have changed through the years, and charging technologies have evolved leading to different harmonic patterns of the EV charging process.
Regarding the harmonic band (up to 2 kHz), it has been demonstrated that individual current harmonic emissions (prevalently odd harmonics) can vary from a few tens of mA to several Amps. Cases exist where these harmonic emissions exceed the current limits specified in the IEC 61000-3-2 [64] (for low charging levels up to 16 A) and IEC 61000-3-12 [65] (up to 75 A). Recent work has also considered active filtering as a mitigation approach for EVCS-related harmonic distortion, confirming that mitigation must be treated together with charger operation and local grid conditions [66].
In several laboratory studies summarized in Table 1, the measured voltage THD remained relatively low and weakly varying during charging, typically around 1–3% in the reported test conditions [62,67,68,69]. This result should not be interpreted as an intrinsic property of the charger, because voltage distortion is produced by the interaction between charger emission currents and the frequency-dependent grid impedance at the point of connection. For this reason, harmonic current spectra and the associated test impedance are more transferable indicators than voltage THD alone.
Phase relationships among the same harmonic orders can ease harmonic cancellation, and experiences exist where higher EV penetration levels reduce harmonic distortion [38,62]. Harmonic cancellation is, however, dependent on the variety and similarity of the EV models connected at the same time in the grid.
Environmental temperature also impacts harmonic emissions, and studies have shown that current THD increases at lower temperatures due to charging current reduction. This is because Lithium-ion batteries are temperature-sensitive, and the electrochemical processes introduce practical limits on the useful battery capacity and on the charging rate to preserve battery safety.
Table 1 summarizes the main findings from the studies documenting the dependency of EVCS harmonic emissions due to EV models, type of chargers, charging rates, battery SOC, charger operating modes, and testing environment.
Overall, Table 1 shows a consistent qualitative picture but not a single transferable numerical value for EVCS harmonic emissions. The most robust findings across studies are that current distortion depends strongly on charger topology, charging mode, SOC, charging current, and EV model; that low-order odd harmonics are usually dominant in AC charging; and that harmonic magnitudes may increase at low charging current or during transitions between CC and CV operation. However, the reported THD values and individual harmonic magnitudes are difficult to compare quantitatively because the studies differ in test environment, grid impedance, supply-voltage distortion, charger power level, EV model, temperature, and aggregation assumptions. Laboratory studies provide controlled repeatability, but may underestimate or misrepresent voltage distortion when realistic grid impedance is not included; field studies capture real interactions, but are less reproducible and often include uncontrolled background distortion.
Therefore, the main research gap is not only the need for more measurements, but the need for harmonized test conditions, explicit reporting of grid impedance, separation between current-emission behavior and voltage-distortion response, and aggregation models for clusters of heterogeneous chargers.

3.5. Stability

Modern EV chargers behave as constant power loads (CPLs) within their control bandwidth (typically up to a few hundred Hz), meaning they increase current when voltage drops to maintain power. In small-signal terms, this behaviour can be represented by a negative incremental input resistance within the control bandwidth: a reduction in voltage is followed by an increase in current demand. If the source/grid impedance is sufficiently high, this load characteristic can reduce damping and contribute to voltage oscillations after disturbances [80]. The result is low-frequency oscillations (LFOs) in the range of 10 Hz to 500 Hz, especially under weak grid or high-load conditions.
The NERC (North American Electric Reliability Corporation) report [81] demonstrated that CPL dynamics can cause undamped oscillations after faults, if chargers maintain constant power mode. Introducing a modest droop control (e.g., 5%) improves damping significantly reducing amplitude and duration of oscillations. Electric power industry organizations have also taken note. In the same report, NERC warned that high concentrations of fast chargers could act as a constant power load block that challenges grid stability [81]. They observed in simulations that under certain fault recovery conditions, if EV chargers attempted to hold constant power draw, the bulk system voltage exhibited undamped oscillations. The recommendation for chargers is to operate temporarily in a safer mode (constant-current or with droop) during grid disturbances [81]. This finding mirrors the Middlebrook criterion: during a disturbance, the grid’s Thevenin impedance spikes (the grid is actually weaker), so a constant-power attempt is likely to compromise stability; by switching to a different control mode, the chargers effectively increase their input impedance or reduce their “demand rigidity” restoring stability. Another study by Wang et al. (2021) on the impact of fast chargers noted that power quality issues (voltage flicker, harmonics) and stability problems tend to arise together when fast chargers are installed on weak feeders [82]. They emphasized impedance modeling of the charger’s front-end as a key to predicting such issues, and indeed many researchers are developing detailed impedance models and impedance measurement techniques for EV chargers [82]. Similarly, Liao et al. [83] analyzed LFOs using forbidden-region techniques and showed that uncontrolled EVCSs may destabilize even strong networks without power draw adaptation.
Middlebrook’s impedance-based criterion is a fundamental tool to assess these various forms of instability. It states that if the magnitude of minor-loop gain is kept below unity at all frequencies, the cascaded system will be stable [80]. In other words, the impedance ratio must satisfy
Z s ( j ω ) Z l ( j ω ) < 1 for all ω
where Z s is the source impedance, and Z l is the load impedance.
It ensures that CPL-induced destabilization is avoided if the source impedance remains low relative to the load. However, this condition is conservative and does not capture phase interactions. Mayo et al. [84] and Kathleen et al. [80] recommend using gain and phase margins or extended minor-loop analysis for practical systems. Furthermore, in multi-converter systems, mutual interactions between tightly controlled chargers can break stability even if each pairwise impedance is compliant. Recent impedance-based adaptive control approaches for grid-connected inverters further confirm the relevance of impedance monitoring and adaptive stabilization when converter-interfaced devices operate under variable grid conditions [85].
As EVCS networks grow, multiple chargers on a common DC bus introduce additional complexity. Qiang Fu et al. [86] showed that increasing charger count reduces system damping due to cumulative filter interactions. Above a threshold, oscillatory modes emerge, even if each charger is locally stable. Their study demonstrated that a series-connected charger topology supports more chargers than parallel configurations for a given stability margin. The practical implication is that charger layout and interconnection topology directly affect the system’s LFO threshold.
Above the CPL bandwidth (>500 Hz), charger dynamics are dominated by physical filters and switching behavior. High-frequency oscillations (HFOs) in the 2 kHz to 150 kHz range are caused by interactions between switching noise and network impedance [87]. Unlike LFOs, HFOs are not originated from control instability, but from amplification at resonance, switching frequency beating, and mutual coupling [82]. When chargers switch at slightly different frequencies (for example 20 kHz and 20.1 kHz), they generate beat frequencies at their difference, producing modulated supraharmonic envelopes [88]. Network impedance varies spatially; for example, long feeders introduce high impedance at 10 kHz to 50 kHz, aligning with charger emissions and amplifying them. Adding chargers can reduce or amplify emissions due to nonlinear impedance aggregation.
In the 2 kHz to 150 kHz range, emission standards remain underdeveloped. IEEE 519 [89] provides guidance only up to the 35th harmonic (2 kHz in a 60 Hz system), and European standards above 2 kHz are still evolving. In this regulatory gap, designers apply conservative filter sizing based on existing harmonic rules. EV chargers typically use LCL filters to attenuate switching ripple (around 10 kHz to 20 kHz). These filters are effective for ripple attenuation, but are not designed to provide complete supraharmonic control.
As the LCL inductance cannot be increased indefinitely, residual switching noise escapes, especially when the grid impedance values are extreme (e.g., near resonances). Without standardized grid impedance models in this band, worst-case testing is difficult [90]. LCL filters must be damped to avoid introducing resonances themselves [88,91]. Passive damping adds losses; active damping adds complexity. Nonetheless, both are essential to prevent HFO amplification within clustered charger environments.

3.6. Grid Impedance and Resonances

Besides the voltage drop at mains frequency caused by the impedance of the distribution network down to the various loads, grid impedance at high frequency is relevant to the EVCS behavior in terms of intensity of distortion components and their propagation.
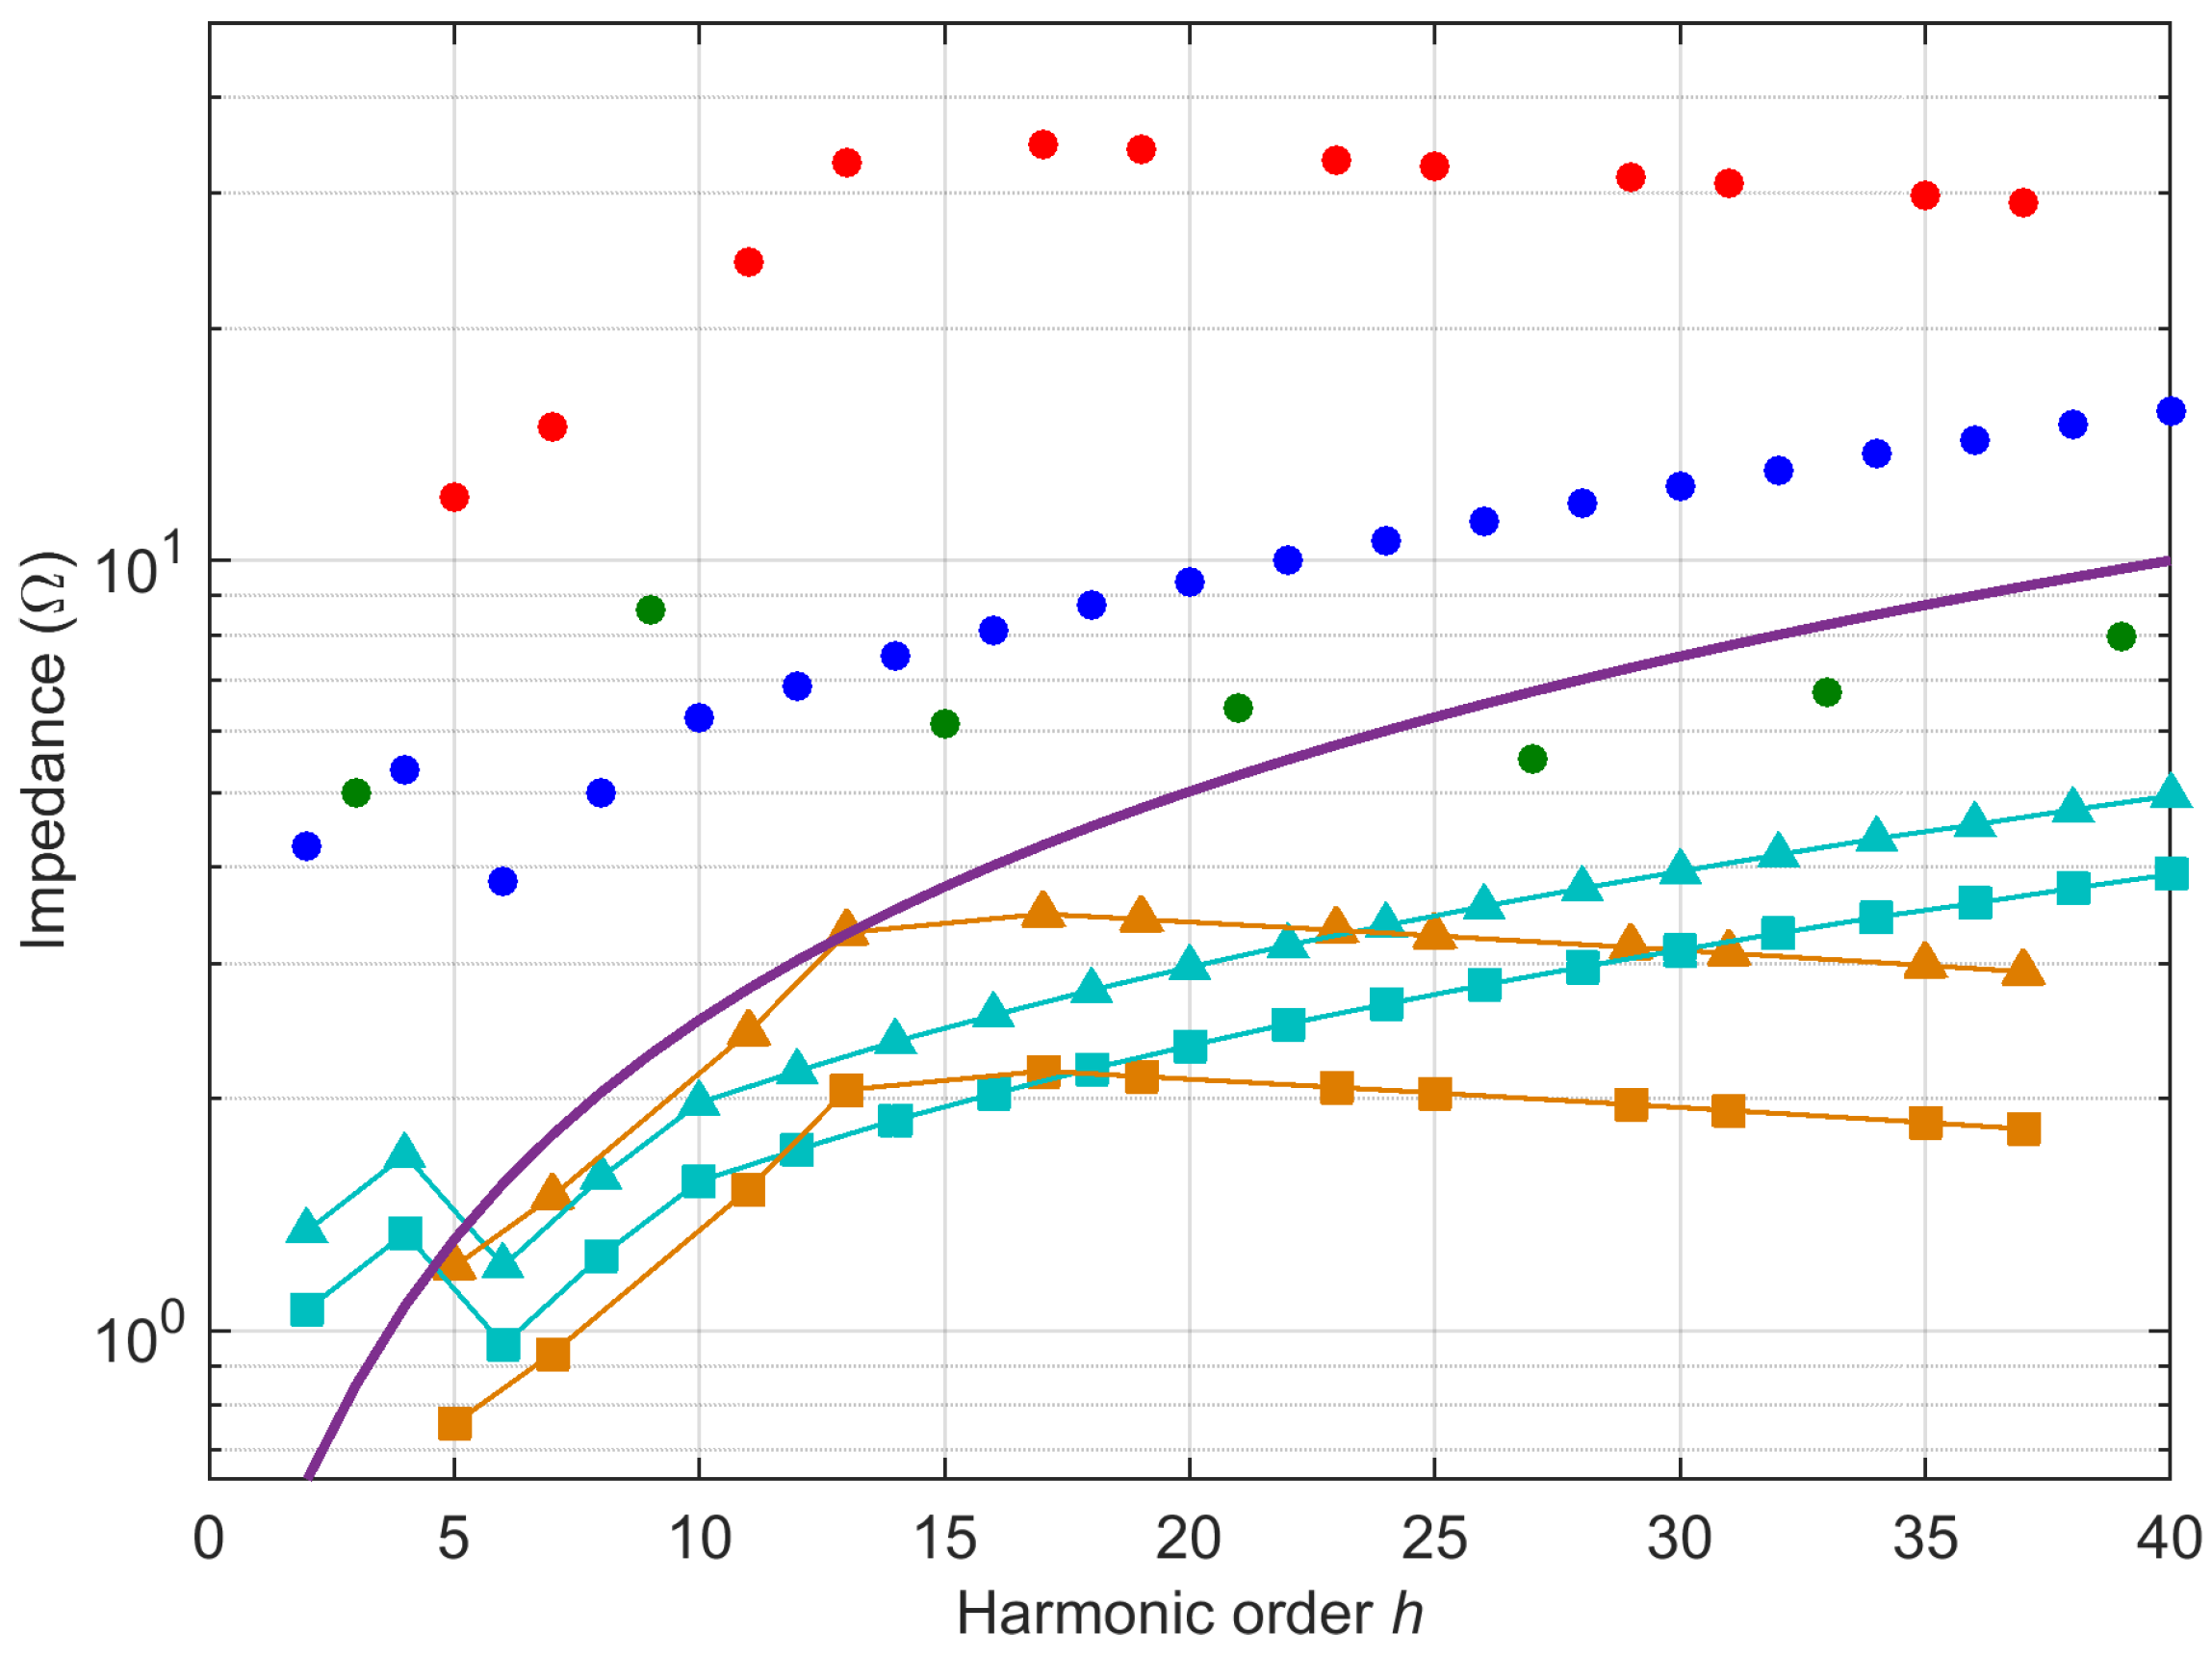
An estimate of the assumed grid impedance when stipulating harmonic distortion limits was discussed in [92], making a comparison of low- and medium-current distortion limits, considering characteristic and non-characteristic harmonics, as shown in Figure 8.
The estimate was carried out by isolating the compatibility level (CL) and emission limit (EL) of a grid (such as residential, light industrial or industrial) to which the loads are connected: the CL characterizes the grid, expressed as a voltage in V, and is shared by all loads; the loads then are imposed the EL values (expressed as a current in A) on the assumption that their current emissions transforms into a voltage distortion on the basis of an agreed reference impedance Z ^ .
Z ^ = C L E L
Of course, a real and credible scenario includes more than one distorting load, like a group of charging points, plus some other loads in the same part of the grid. Let’s consider their number as n.
Their harmonic contributing terms will sum together and concur to the overall voltage distortion of the grid. An aspect to point out is that depending on the nature of the harmonic component, the phase may be more or less synchronized between the various loads or even completely random; usually this occurs for characteristic and non-characteristic harmonics, respectively.
From this the two relationships for the summation of harmonic components at the same frequency (same order) that were proposed in [92] and are included in Figure 8.
The total current value at each harmonic frequency increases with n and n for the two categories of harmonics, where synchronization occurs and does not occur, respectively. This behavior is usually exemplified by odd and even harmonics that are chosen for the two formulations, respectively indicated by “o” and “e”.
Z ^ o = Z ^ o n Z ^ e = Z ^ e n
Using a simple equivalent circuit where the single load is a current generator of disturbance with frequency dependency, I i ( f ) , the voltage distortion at its point of connection is directly V i ( f ) = Z i ( f ) I i ( f ) .
This is a known result under the so called “current-source model”, where weaker grids (with large grid impedance Z i ( f ) as seen by the single loads) undergo higher voltage distortion. At higher frequency the impedance curve may show resonances and anti-resonances to which extremes of the voltage distortion spectrum will roughly correspond, namely maxima and minima, respectively.
A Norton equivalent circuit with the parallel of the current source I s , i ( f ) and the related internal impedance Z s , i ( f ) can represent well each charger. As explained in [87], the charger impedance here is derived from experimental data fitted to a double RLC circuit with good approximation.
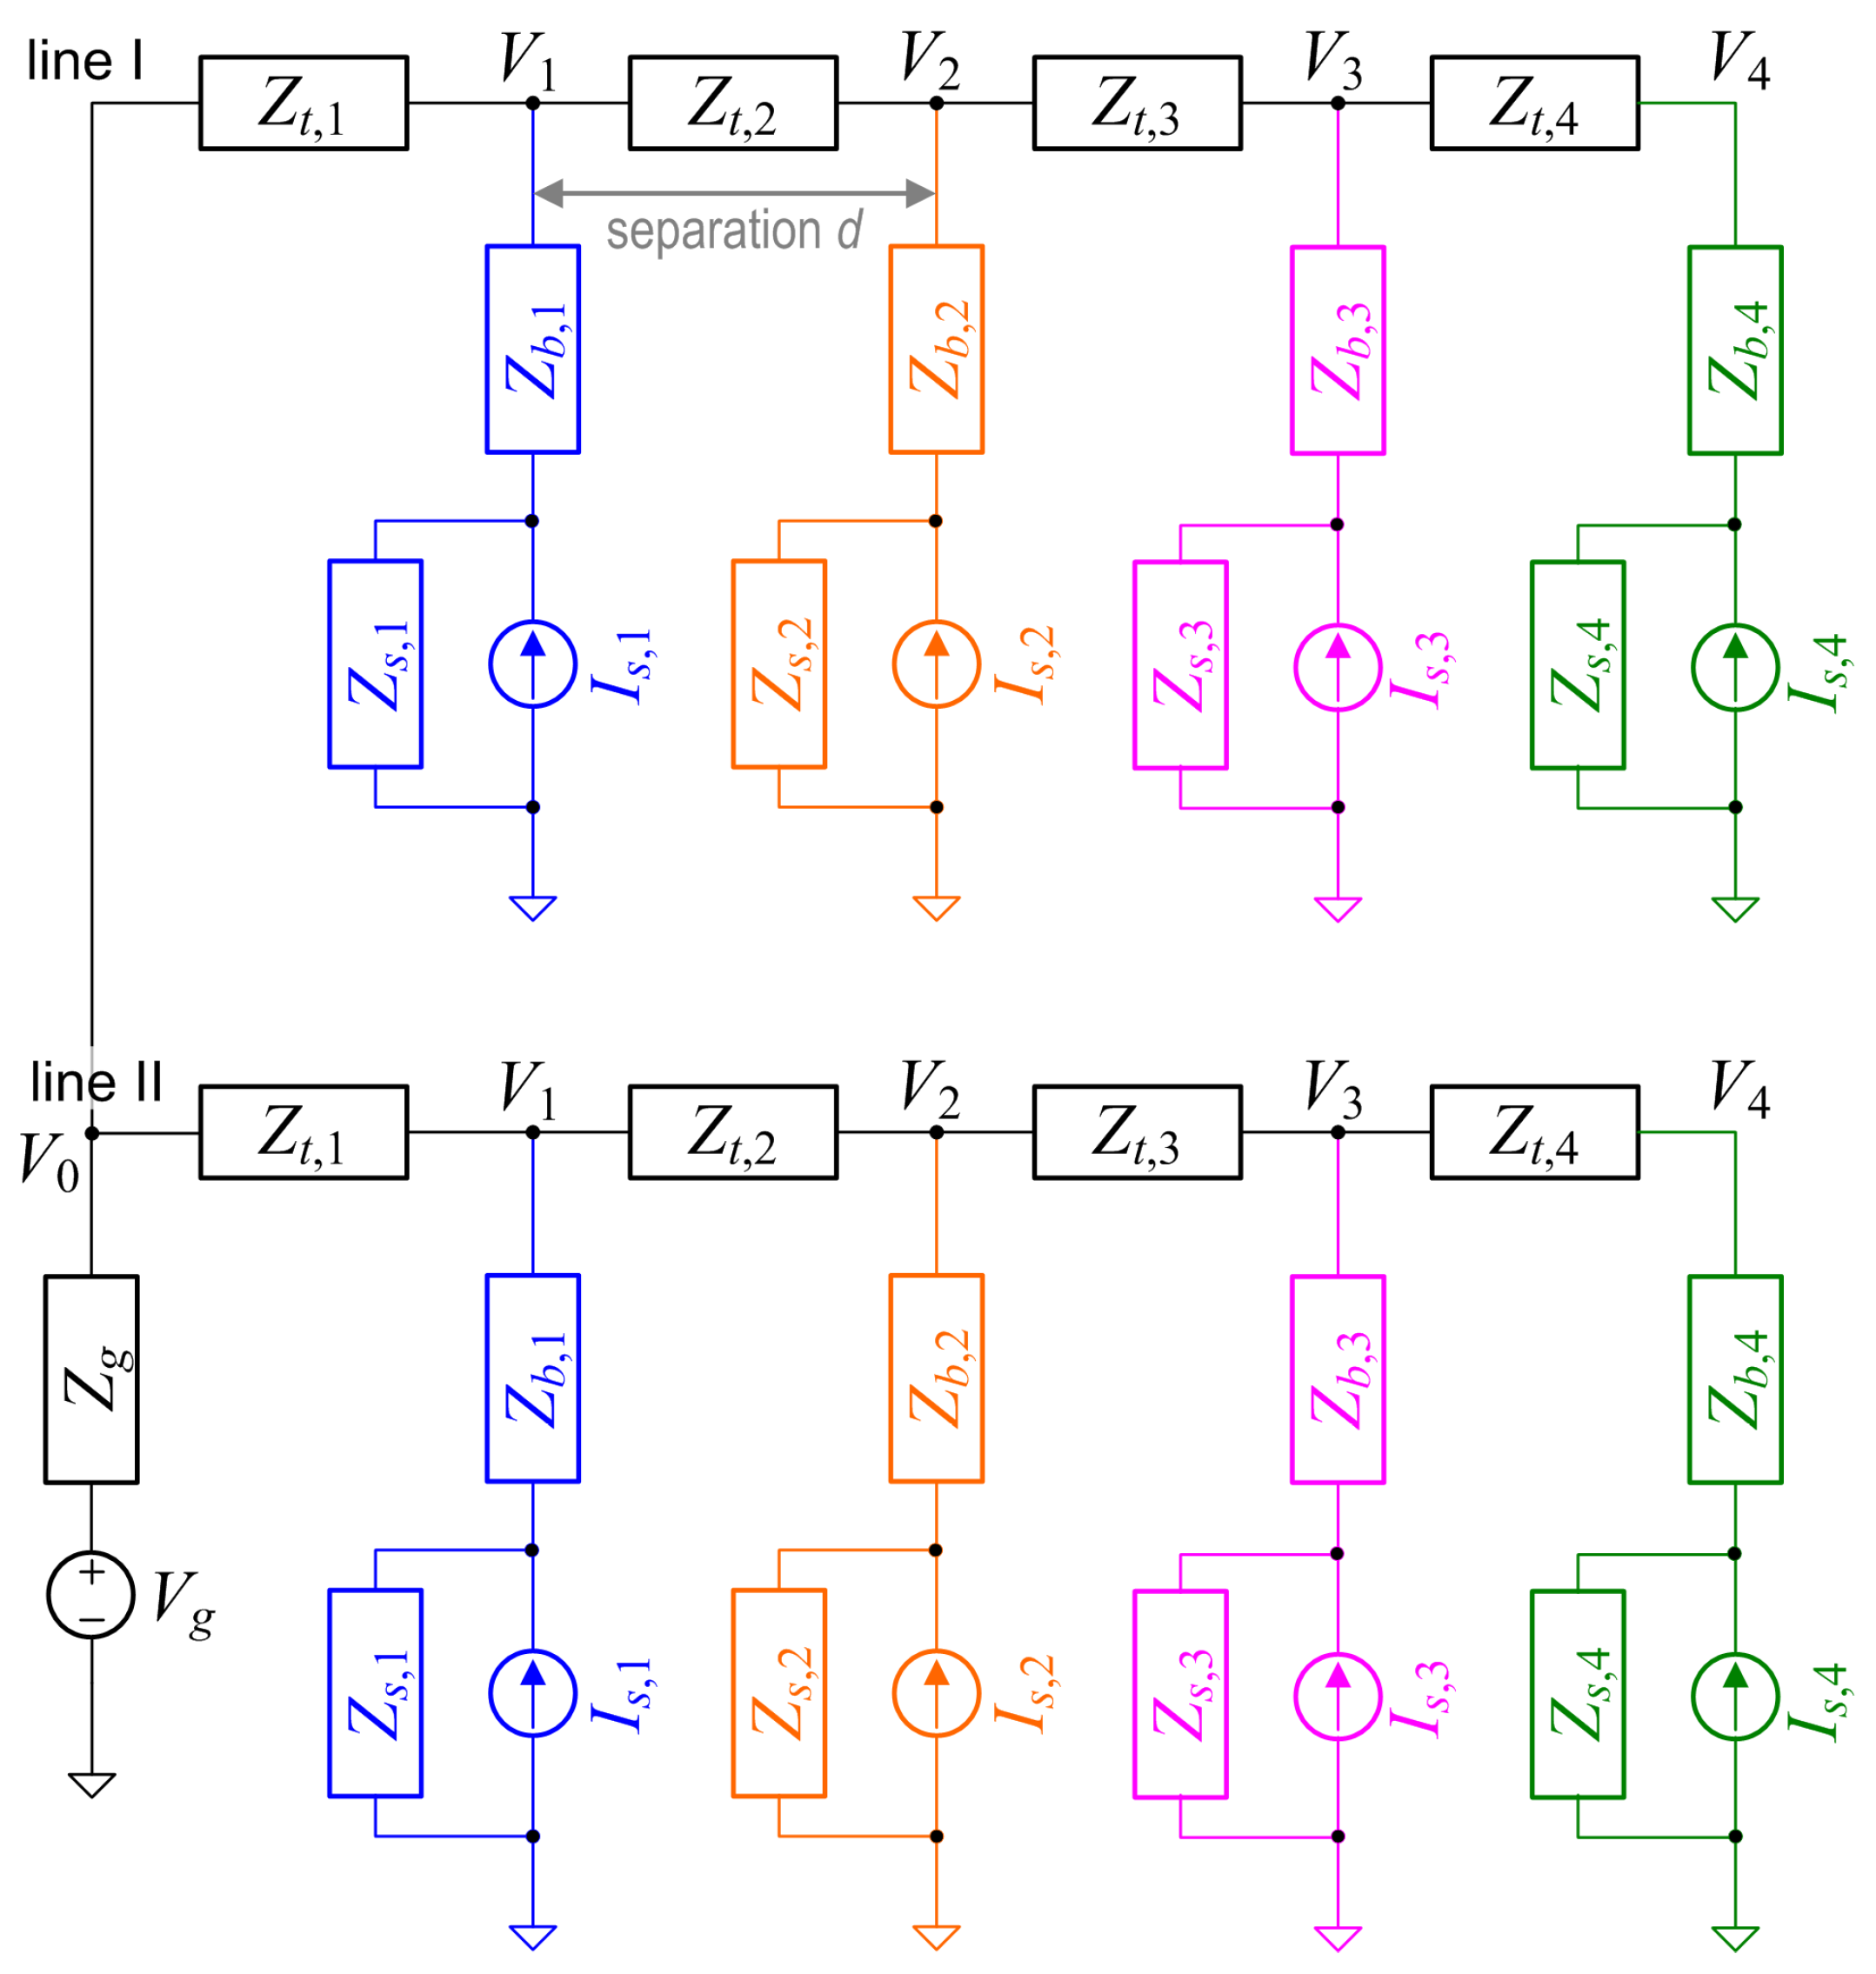
With the commonly accepted equivalent circuit representation (sketched in Figure 9 for two branched lines from a common feeding point), the grid impedance Z g can be different in the same network at different tapping points of the network itself, indicated by the index i = 1 4 with the notation Z i . The reason is twofold: the loading effect with variable impedance characterized also by reactive terms and the contribution of the impedance of the connecting cables of variable length d.
The elements of the scheme refer to the transversal impedance of the cable connections Z t , i , the branch impedance Z b , i of the line connecting each load (indicated as a source of emissions I s , i with internal impedance Z s , i ).
A change in a load at position i = p (e.g., change of operating point or connection/disconnection) causes a change of the various Z i (the own Z p , but also Z p 1 and Z p + 1 , and so on). The change consists of a shift of resonance or anti-resonance peaks or simply as a variation of impedance values. The following examples combine published results with additional simulations performed using the same model as in [87], from which the scheme above was taken and adapted. The distribution grid has longitudinal branched of d = 200   m and transversal branches to each charger of 25 m; the assumed cable is 95 mm2.
The example is intended as an illustrative impedance-sensitivity case rather than as a full feeder planning model. In the no-charger case, the resonance is caused by the interaction between the longitudinal inductive impedance of the feeder and the distributed shunt capacitance of the LV cables represented in the line model. When chargers are connected, their input impedance is represented by the fitted Norton-equivalent model reported in [87], including the capacitive and resonant behaviour of the charger front-end. Other background loads are not explicitly included; this is a simplifying assumption that reduces damping and therefore emphasizes the possible displacement and amplification of resonance peaks.
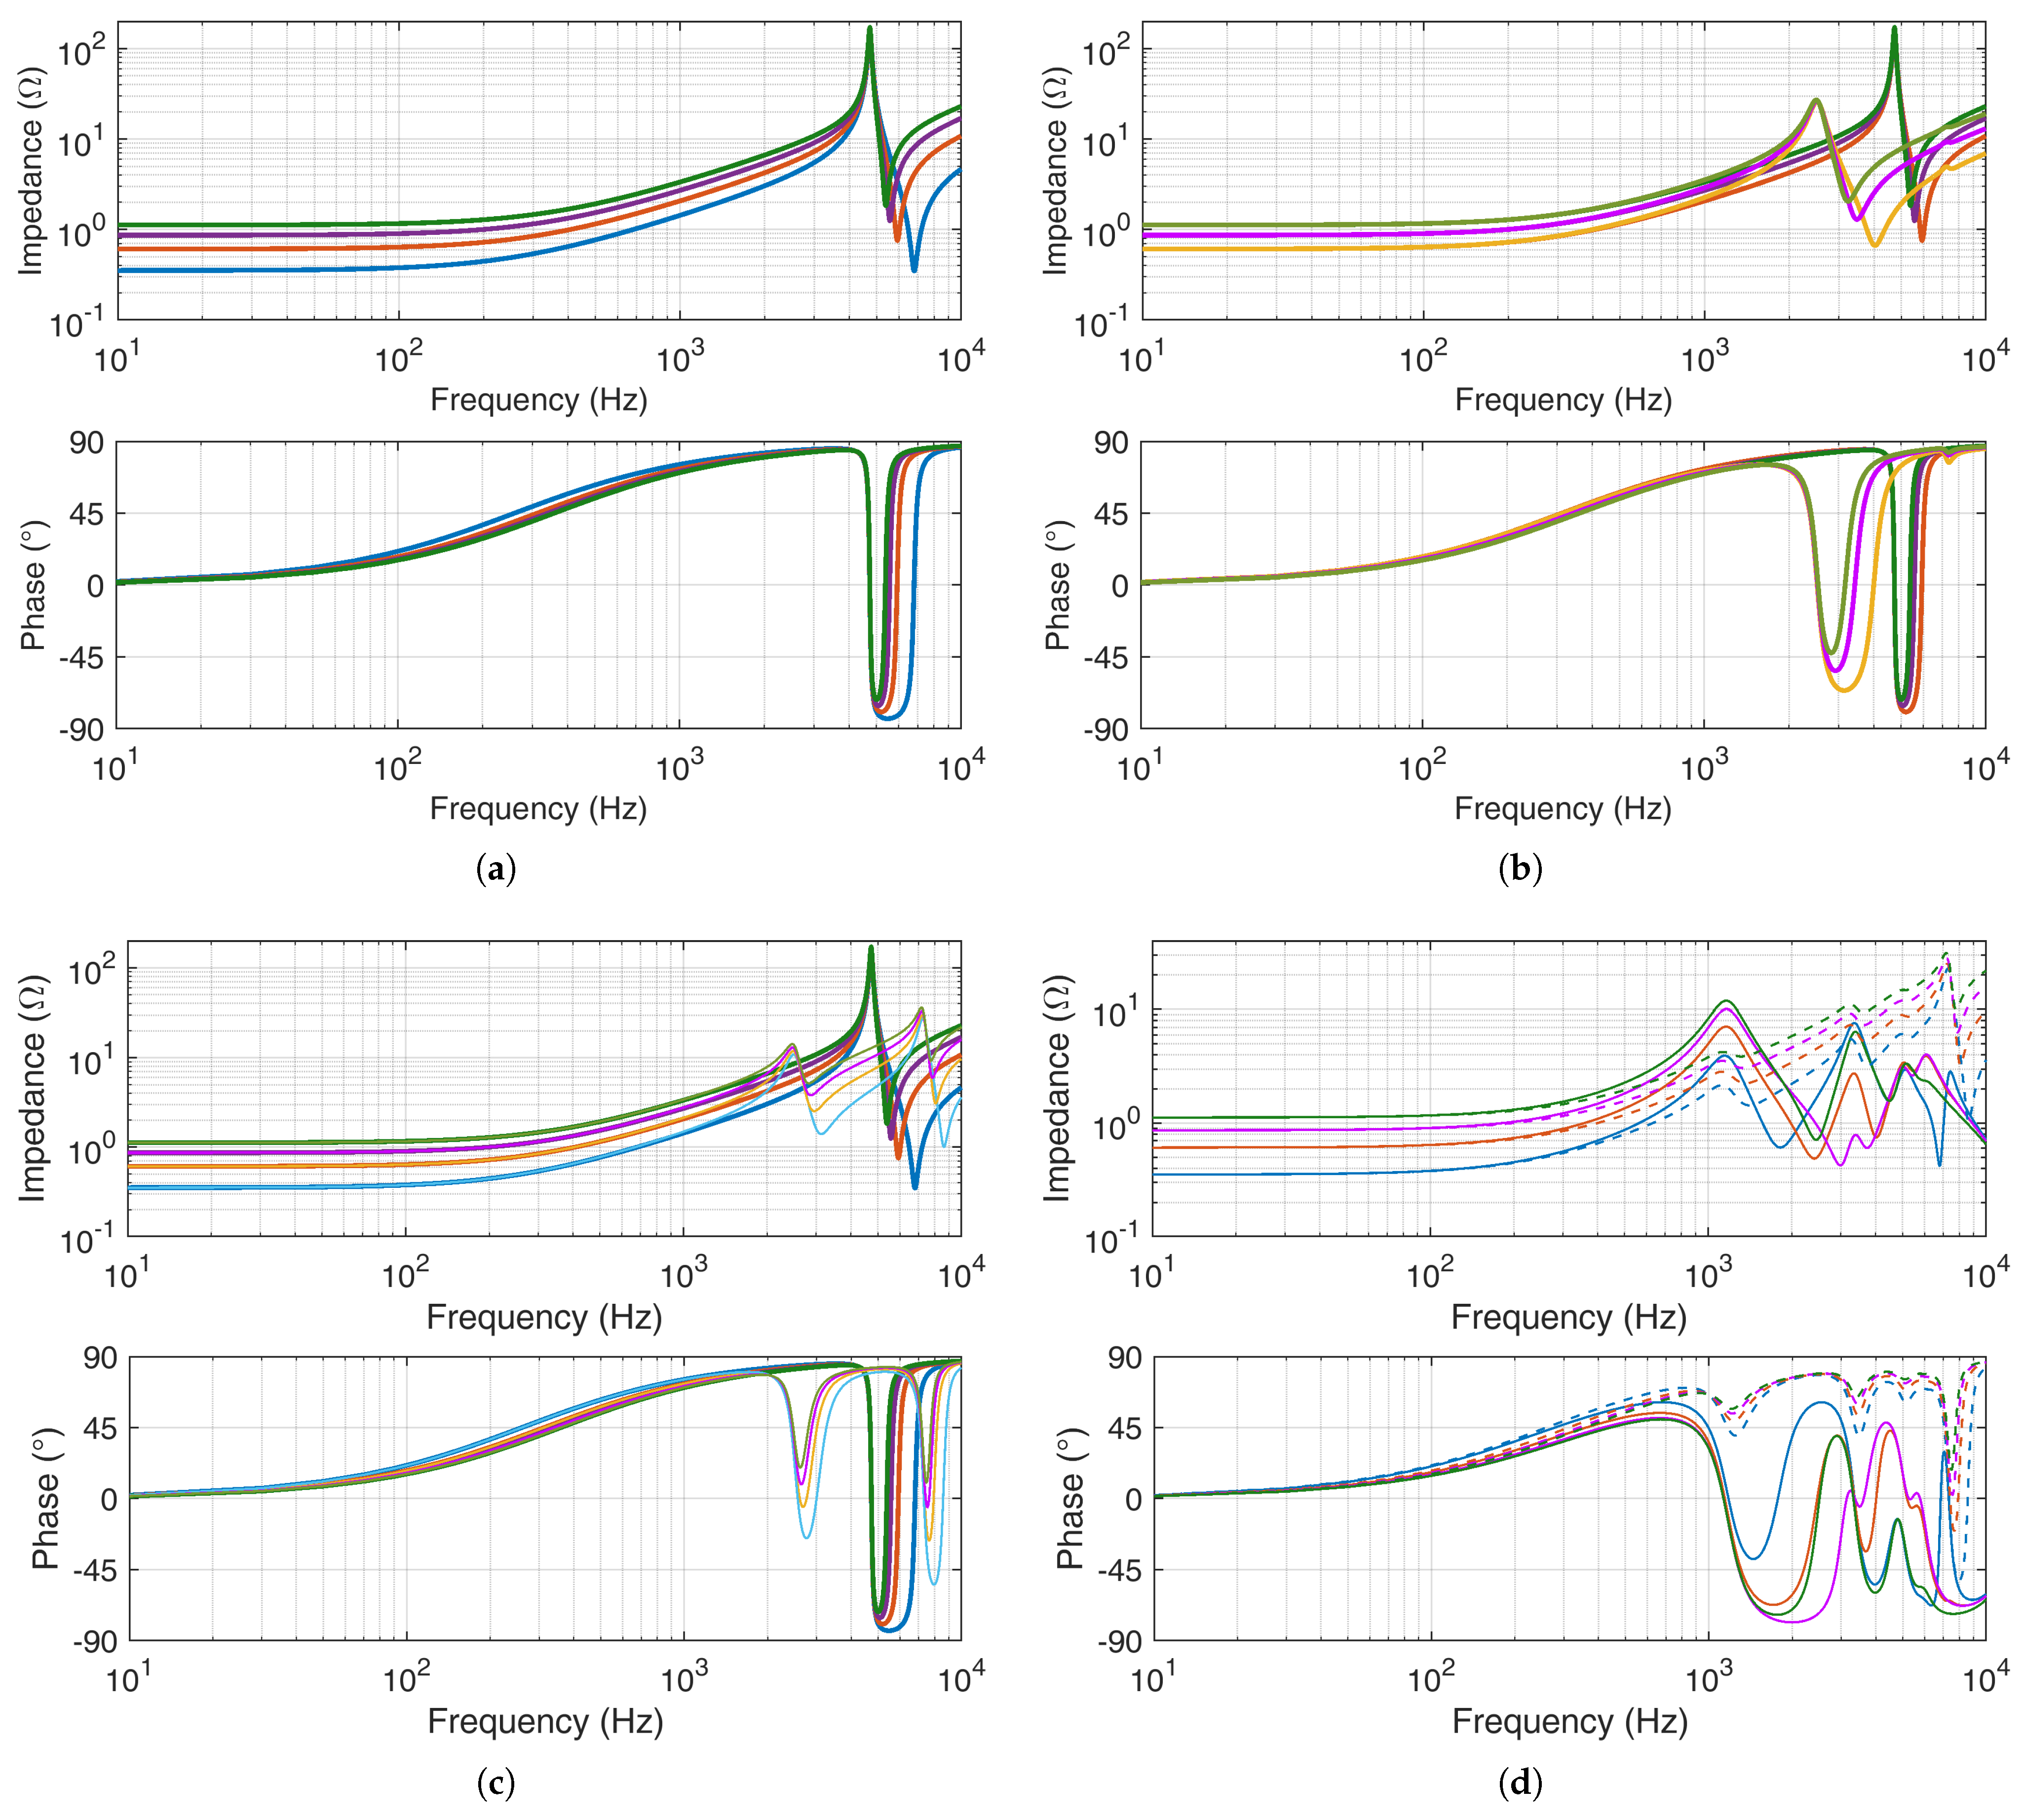
Figure 10 shows the following results:
  • The normal grid impedance at the four chargers connecting ports of “line I” (identical to that of the lower ones) is shown in Figure 10a: the impedance increases getting farther from the feeding point and there is a well identified resonance at about 4.7 kHz reaching about 200 Ω .
  • Turning on charger no. 1, there is a dramatic change of all the impedances both in “line I” (Figure 10b) and in “line II” (Figure 10c): a resonance becomes visible at 2.5 kHz with a much lower amplitude (30 Ω for line I and 15 Ω for line II, that is electrically farther away; a second resonance is also present, but only in line II).
  • When turning on all the chargers of line I, the resulting impedance curves anticipate the resonance to 1150 Hz with different peaks varying between 4 and 12 Ω ; other resonances follow keeping all the curves of line I below 10 Ω ; for line II the behavior is different with a very damped resonance at the previously identified 1150 Hz and similarly at 3300 Hz, only peaking to 30 Ω at 7 kHz.
Overall the behavior of the dashed curves of line II (influenced by remote EVCS loads) is quite similar to the curves measured in [93] and to those reported before in Figure 8.
Regarding the adequacy of the present distortion limits and possible extension up to e.g., 9 kHz with suitable weighing, they depend on the impedance levels characterizing the EVCS feeding points. It can be observed that impedance values are quite variable (passing from no load, to one charger and then many chargers switched on) and non monotonic, undergoing resonances and anti-resonances that are an order of magnitude apart, with consequential spread of voltage and current distortion.
It may be said that the relationships in terms of load feeding impedance and transfer impedance between various points of the grid are complex. There is no intuitive uniform solution to apply to all cases, although the circuit problem is always solvable and in principle an exact solution can be achieved. The reasons behind the complexity are:
  • loads are non-linear and change their behavior during the charging operation with the EV state of charge;
  • loads may dynamically connect and disconnect, causing a change of topology of the feeding network as a matter of fact;
  • the effect of the different EVs plugged in is also non negligible.
The limitation of conducted emissions or distortion must be ensured over a scenario of significantly variable impedance relationships. It should be based on reliable and accurate methods for the measurement of impedance in operating conditions, with the objective of classifying the behavior of a particular grid on the basis of its variability in terms of spread and shift of resonance and anti-resonance phenomena.

4. Impact of EV Charging Stations in the 2 to 150 kHz Band

Smart Grids rely on bidirectional communication among devices connected to the distribution network, including metering, monitoring, overload prevention and control functions. PLC technology is widely used for this purpose because it exploits the existing electrical infrastructure, but it operates in a frequency range mostly up to 500 kHz, where conducted emissions from power-electronic equipment and frequency-dependent grid impedance may affect signal propagation. In particular, emissions may reduce the signal-to-noise ratio at PLC receivers, while impedance resonances and mismatches may amplify non-intentional emissions or attenuate PLC signals [94,95,96,97].
Consequently, a major research challenge in integrating EV charging infrastructure into Smart Grids is the detailed empirical characterization of conducted emissions generated by power electronic devices and their propagation through the distribution network. The Section 2 deployment indicators are also relevant here, because EVCS density, charging speed and simultaneous operation influence whether high-frequency emissions remain localized or aggregate at feeder level.

4.1. Conducted Emissions

This section reviews EVCS-related conducted emissions and impedance effects above the traditional harmonic range. Although many PQ and EMC studies focus on emissions up to 150 kHz, PLC-related interactions motivate extending the discussion up to 500 kHz. The term “supraharmonics” is used here as a practical label for conducted emissions above 2 kHz, independently of whether the components are integer multiples of the fundamental frequency.
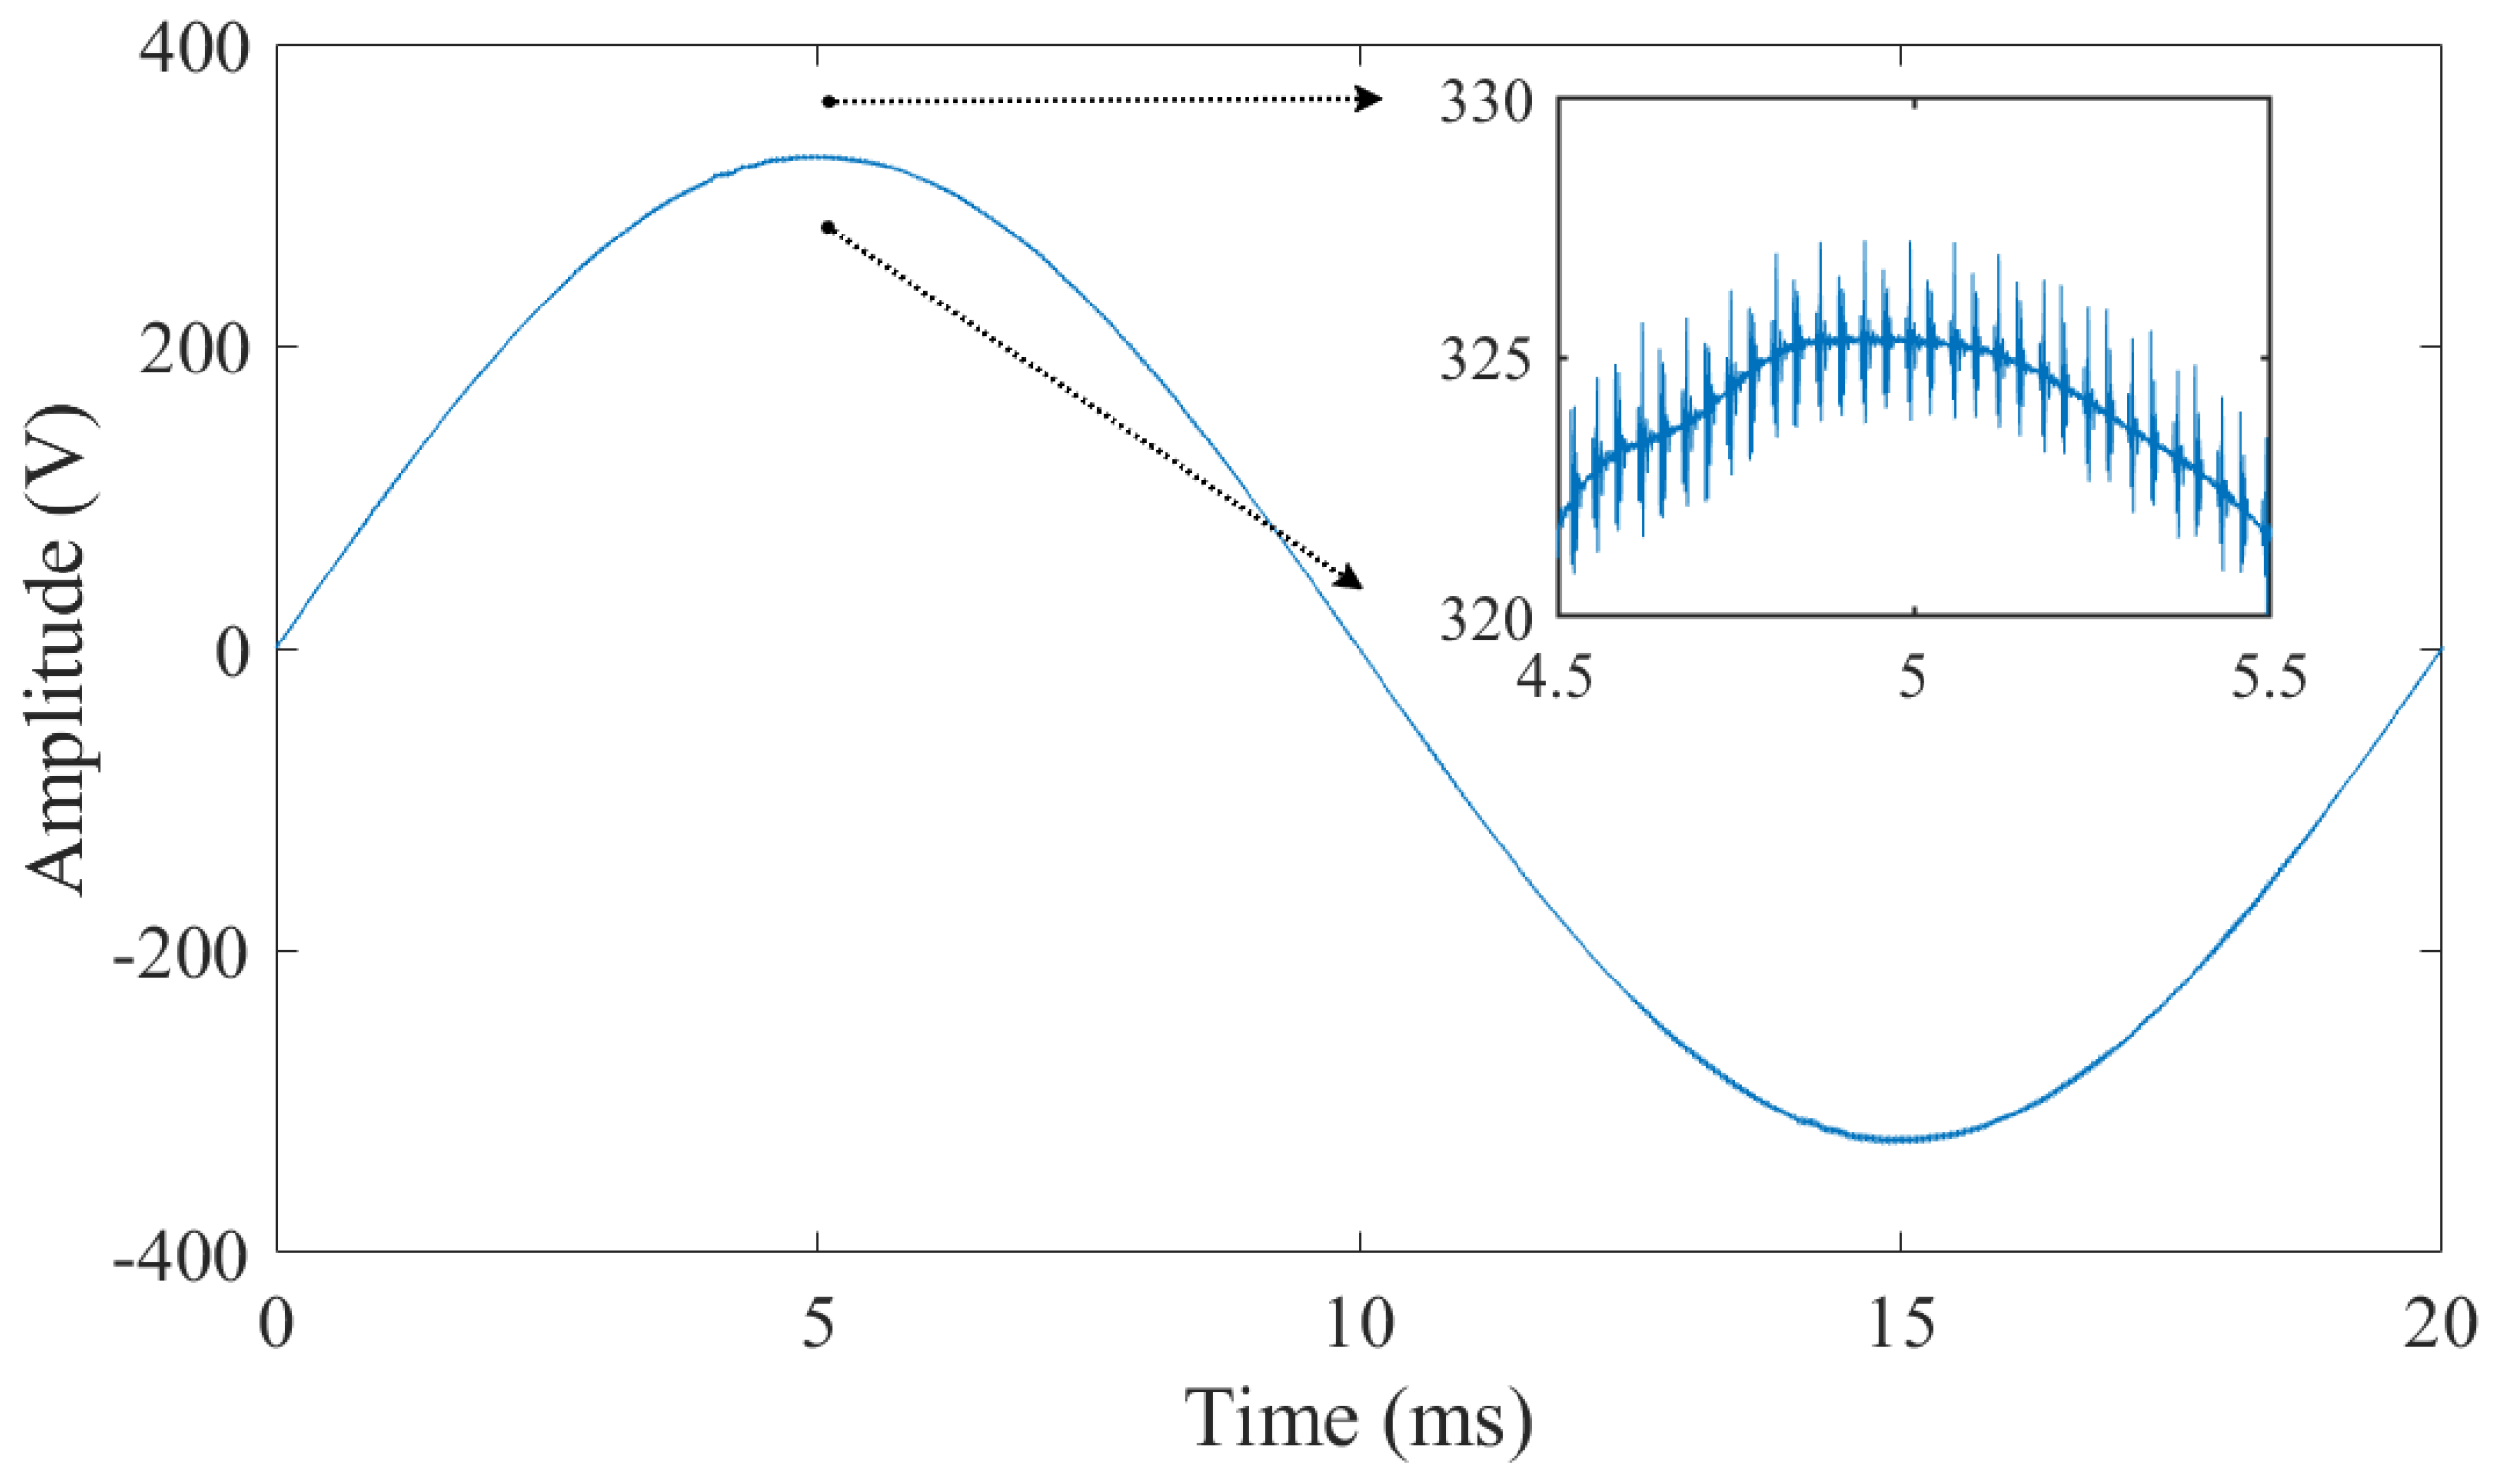
Different types of emissions can be found above 2 kHz [98]: switching frequencies of modulated converters and their harmonics, resulting in narrow band emissions; other narrowband components at higher frequency, caused e.g., by ringing and resonances within converters; and a wide range of broadband emissions, including colored noise. These emissions, along with a period of the mains, are represented in the time domain in Figure 11.
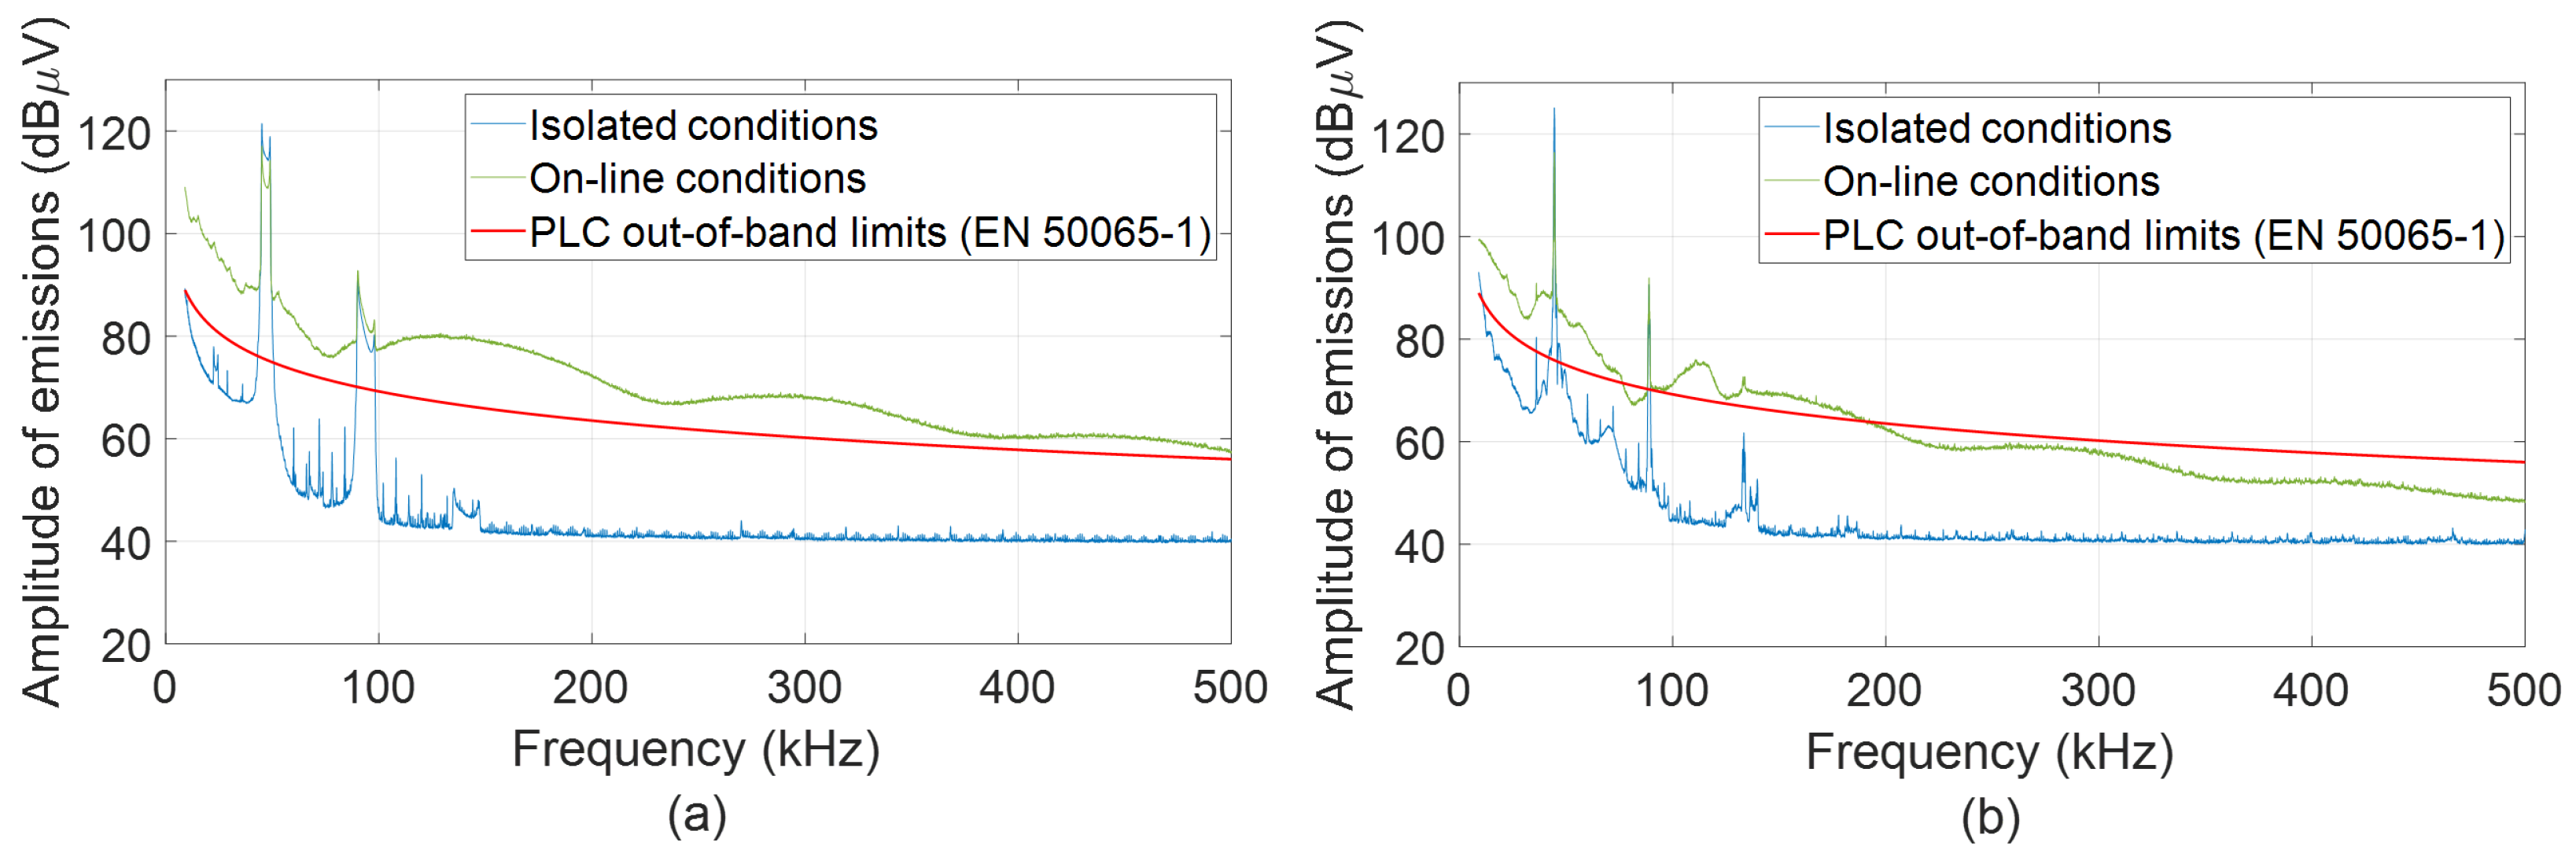
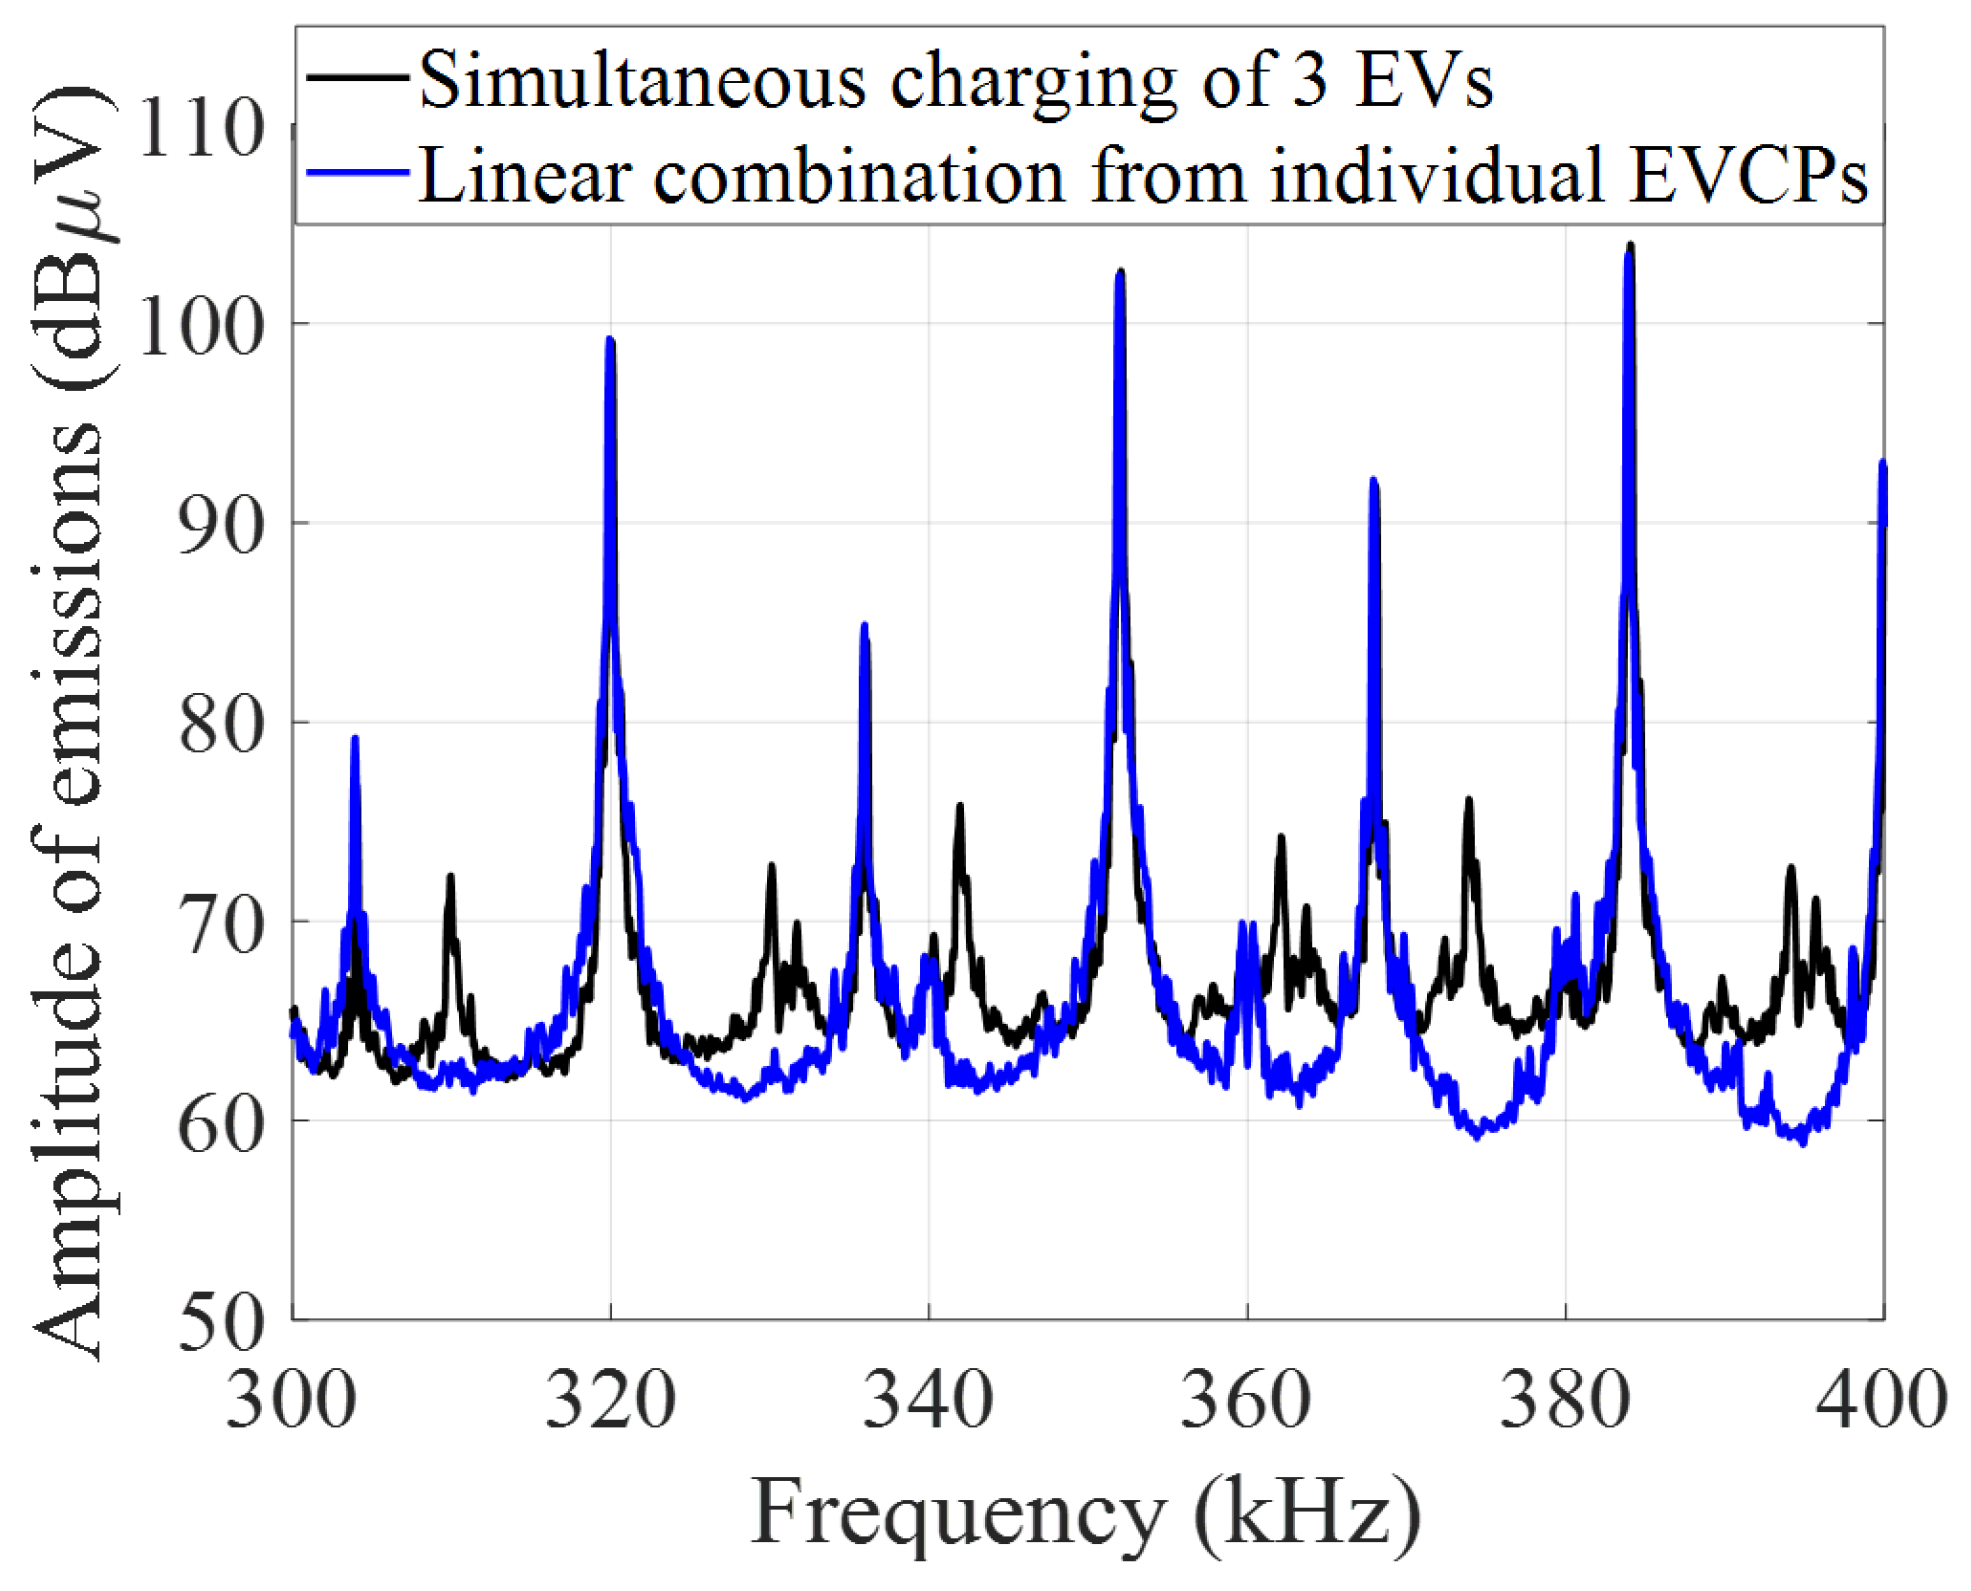
Several studies have been published characterizing the conducted emissions generated by EV charging stations in the 9–500 kHz range [99,100,101,102,103]. In [99] the conducted emissions generated by EV charging stations are characterized over 10-min observation, showing that the amplitude of the disturbances generated by these devices is close to the compatibility levels. The study published in [100] shows the differences in the emissions generated by an EV charging station when is connected directly to the grid and when it is isolated using a Line Impedance Stabilization Network (LISN), as shown in Figure 12 for two EV models. This analysis also demonstrates that the amplitude of disturbance is time-dependent, exhibiting periodic fluctuations at every mains cycle. The disturbances generated by multiple EV charging stations can interact, generating intermodulation products, and creating more complex emission patterns in the time and frequency domains, as shown in [102] for three EV charging stations charging simultaneously compared to the linear combination of each one (see Figure 13) and in [101].
In addition, the vehicle-to-grid (V2G) technology, which enables electric vehicles to inject the stored energy into the LV grid, allowing a bidirectional energy interchange, is not neutral from the point of view of conducted emissions. The study in [103] shows that the disturbances generated by V2G technology have characteristics similar to those generated by conventional EV charging stations.
Emissions magnitudes generated by EV charging show higher amplitudes up to 15 kHz and 28 kHz bands as demonstrated in [99,104] and [105], respectively. Switching frequency emissions during a charging cycle do not always remain constant. Amplitude and appearance of emissions (showing as broadband or narrowband) can change during the CC and CV charging mode stages [105]. In [104] the grid impedance influence on emissions was demonstrated, showing variability up to 30%. Table 2 summarizes the main results of the described studies related to the conducted emissions generated in the EV charging processes.
Similar evidence from switched-mode power supplies confirms the strong influence of setup and operating conditions on conducted EMI measurements [106]. Overall, the reviewed studies show that EVCS emissions above 2 kHz are highly device-, operating-point- and impedance-dependent. This limits the transferability of single-device measurements and motivates cluster-level studies with explicit reporting of grid impedance and operating conditions.

4.2. Changes in Grid Impedance

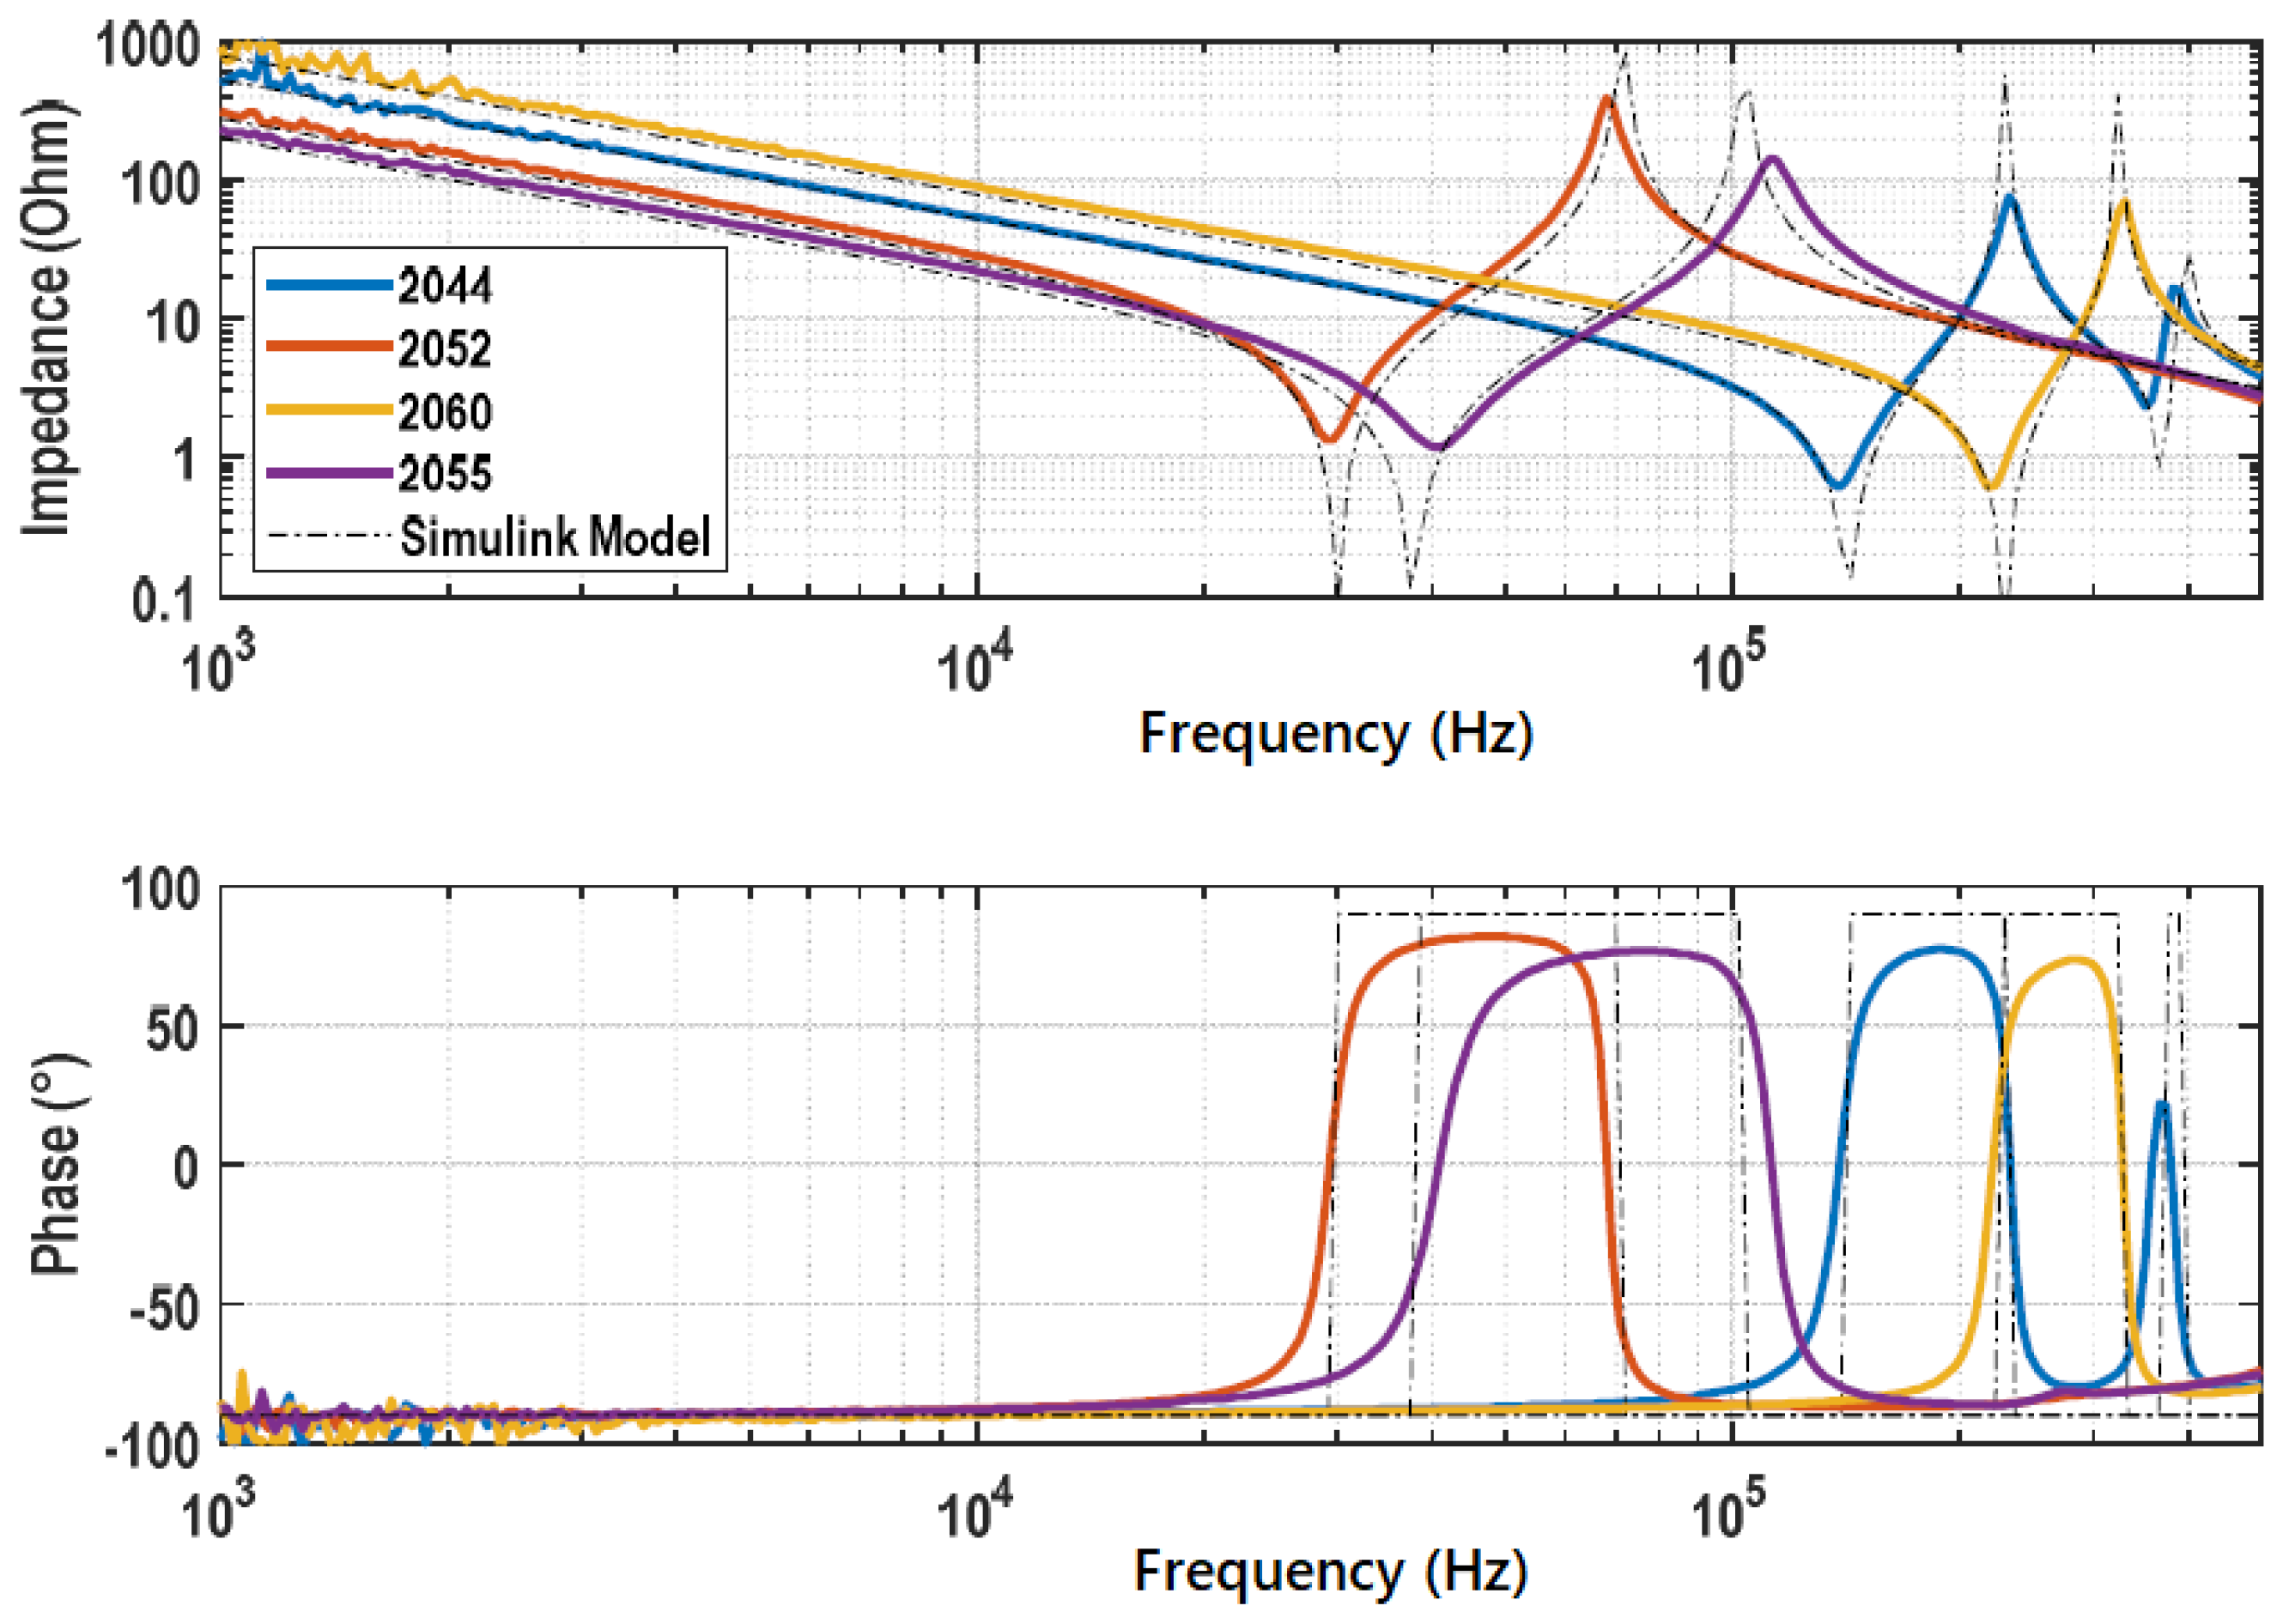
Grid impedance is frequency-dependent because of cable inductance, shunt capacitance, topology and connected loads, and it may exhibit series resonances and parallel anti-resonances. Often neglected, EMI filters contribute to the grid resonance patterns [107], as shown in Figure 14. It also varies with time as loads are connected or disconnected, and power-electronic devices may introduce sub-cycle impedance variations while switching within the fundamental period. For this reason, measured impedance is often distinguished as long-term dynamic or short-term dynamic, depending on the time scale over which variations are averaged or observed [108,109]. In addition, with the objective of estimating a reference grid impedance, the long-term and short-term variations are averaged to obtain mean values of the frequency-dependent impedance of the grid. This mean impedance is termed as “static grid impedance”, to express that variations over time have been excluded in the assessment.
There is an increasing interest among the scientific community in characterizing both the static and dynamic grid impedances by means of empirical measurements for frequencies above 2 kHz, mainly due to the interest in extending the Power Quality (PQ) analysis up to 150 kHz, and the need of characterizing the EMC of PLC for frequencies up to 500 kHz. For example, in [110], impedance values below 10 Ω were obtained for frequencies up to 100 kHz in the distribution grid of Turkey, including different areas (rural, urban and industrial). In measurements carried out in [111] for an LV distribution grid, the impedance was found to be heavily frequency dependent up to 500 kHz. Similar conclusions can be derived from other measurements carried out in [112,113,114] and [115] under laboratory conditions, an urban area with underground power cables and indoor scenarios, respectively.
Regarding EVs, as their number is expected to increase significantly worldwide (as shown in Section 2), and specifically in urban areas, the grid impedance is expected to change during the charging process. The studies of this issue are still very limited. In [103], some resonance effects were observed in the grid impedance caused by EV charging processes. In a research carried out in [116], some low impedance values were recorded due to the large input capacitors included in the circuitry of the EVs. Last, in some measurements carried out in a user-controlled LV grid, separated from the public distribution grid, for the 20–500 kHz band [117], important differences in the grid impedance were found during the charging process for different EV charging stations. Therefore, this aspect is still a relevant aspect to assess, and it requires extensive measurement campaigns for different charging technologies and EV models.
The long-term dynamic grid impedance was measured in socket outlets in commercial and residential buildings of different countries in [118], where the results revealed that the connection/disconnection of PC power supplies during day/night caused noticeable changes in the grid impedance. In [103,117], a comparison of the grid impedance values during EV charging processes was also made, concluding that they generate significant variations.
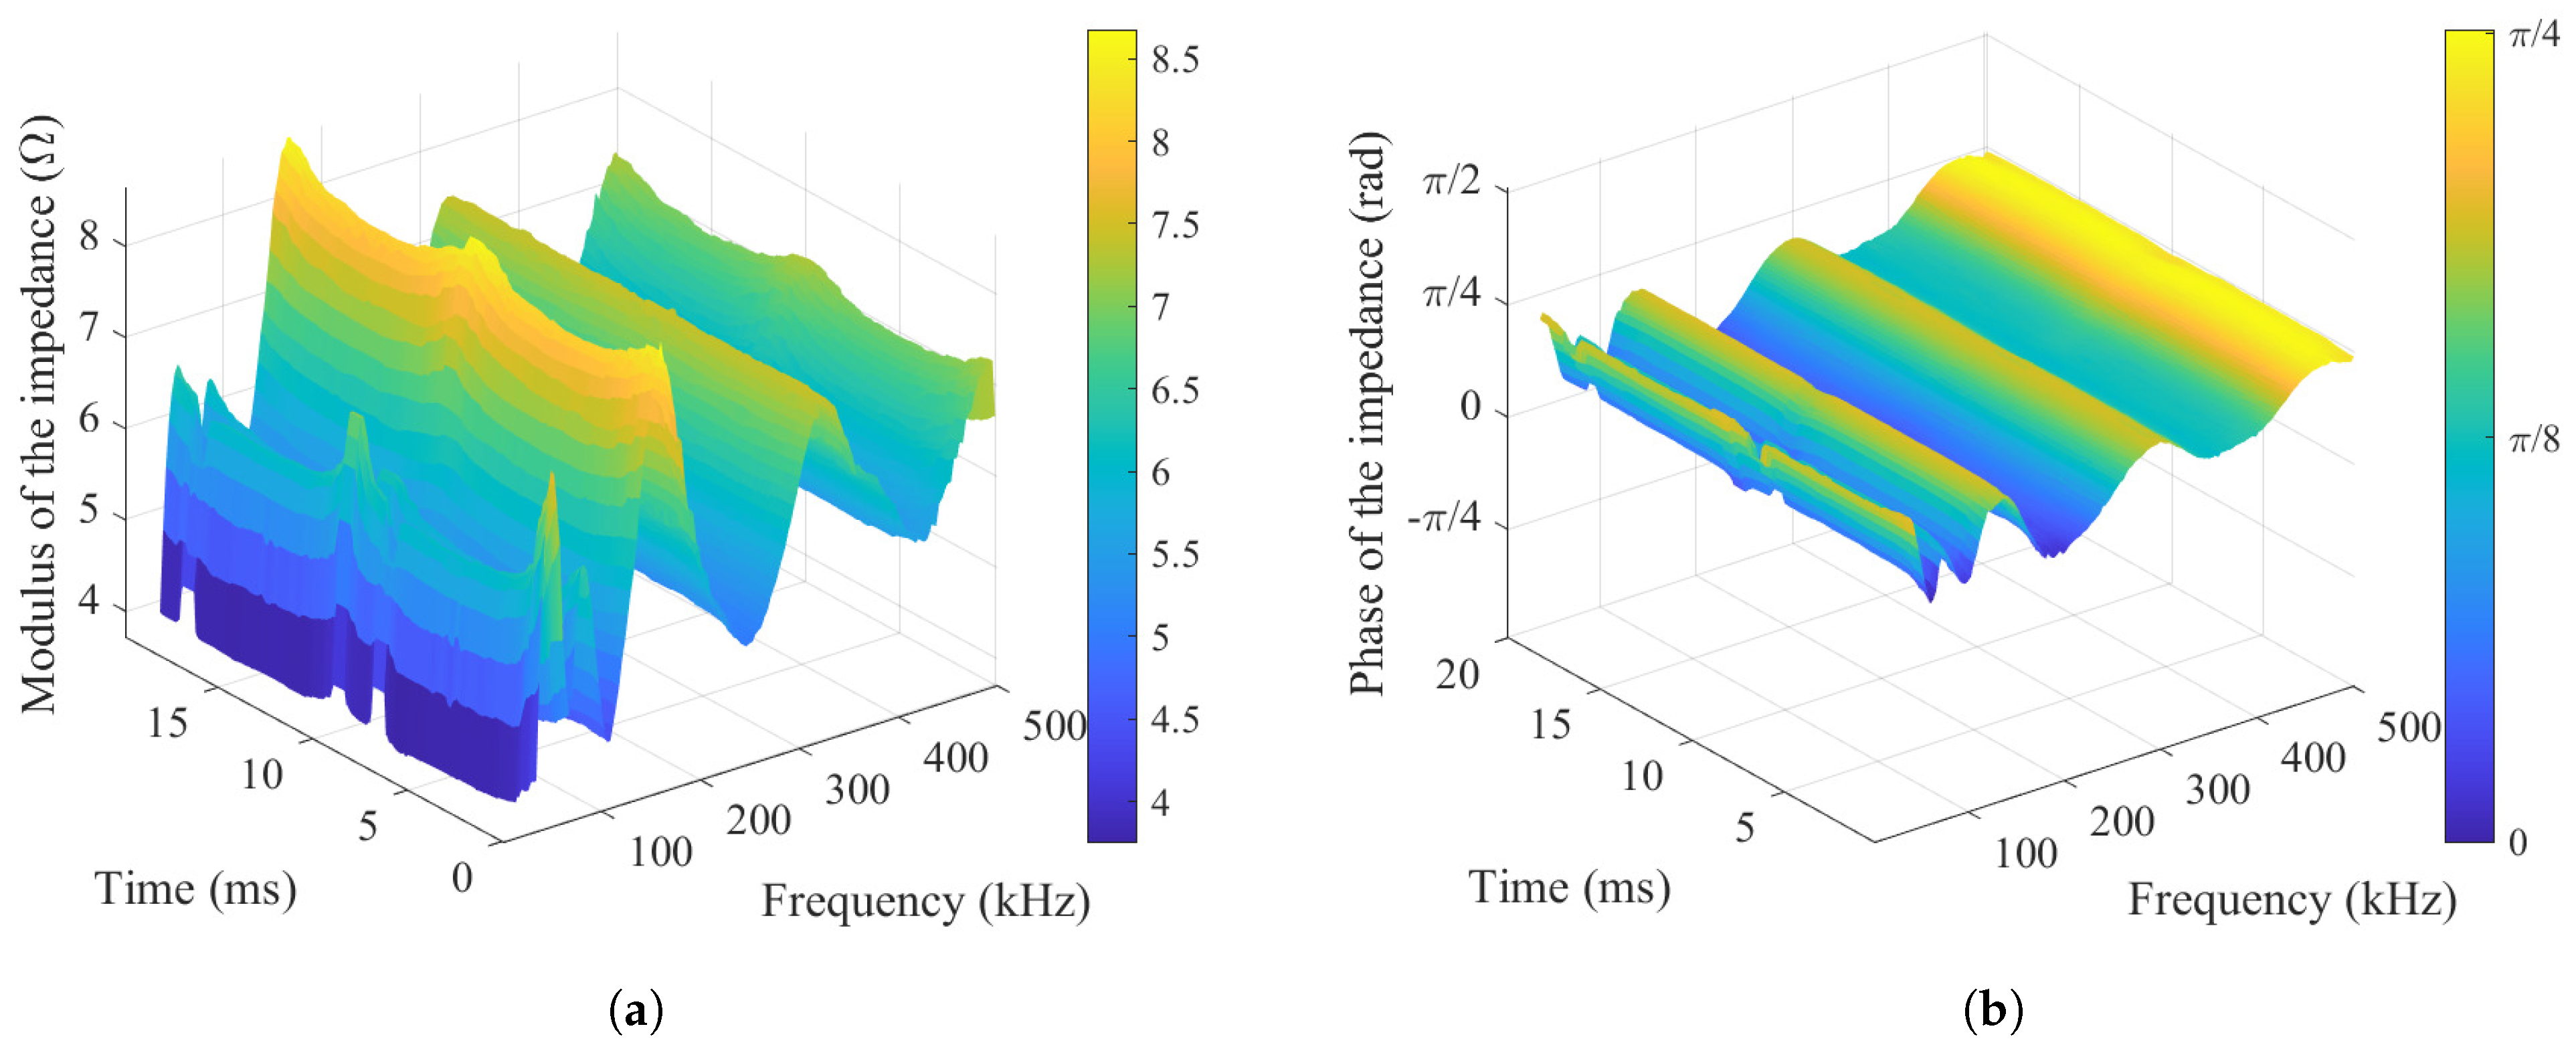
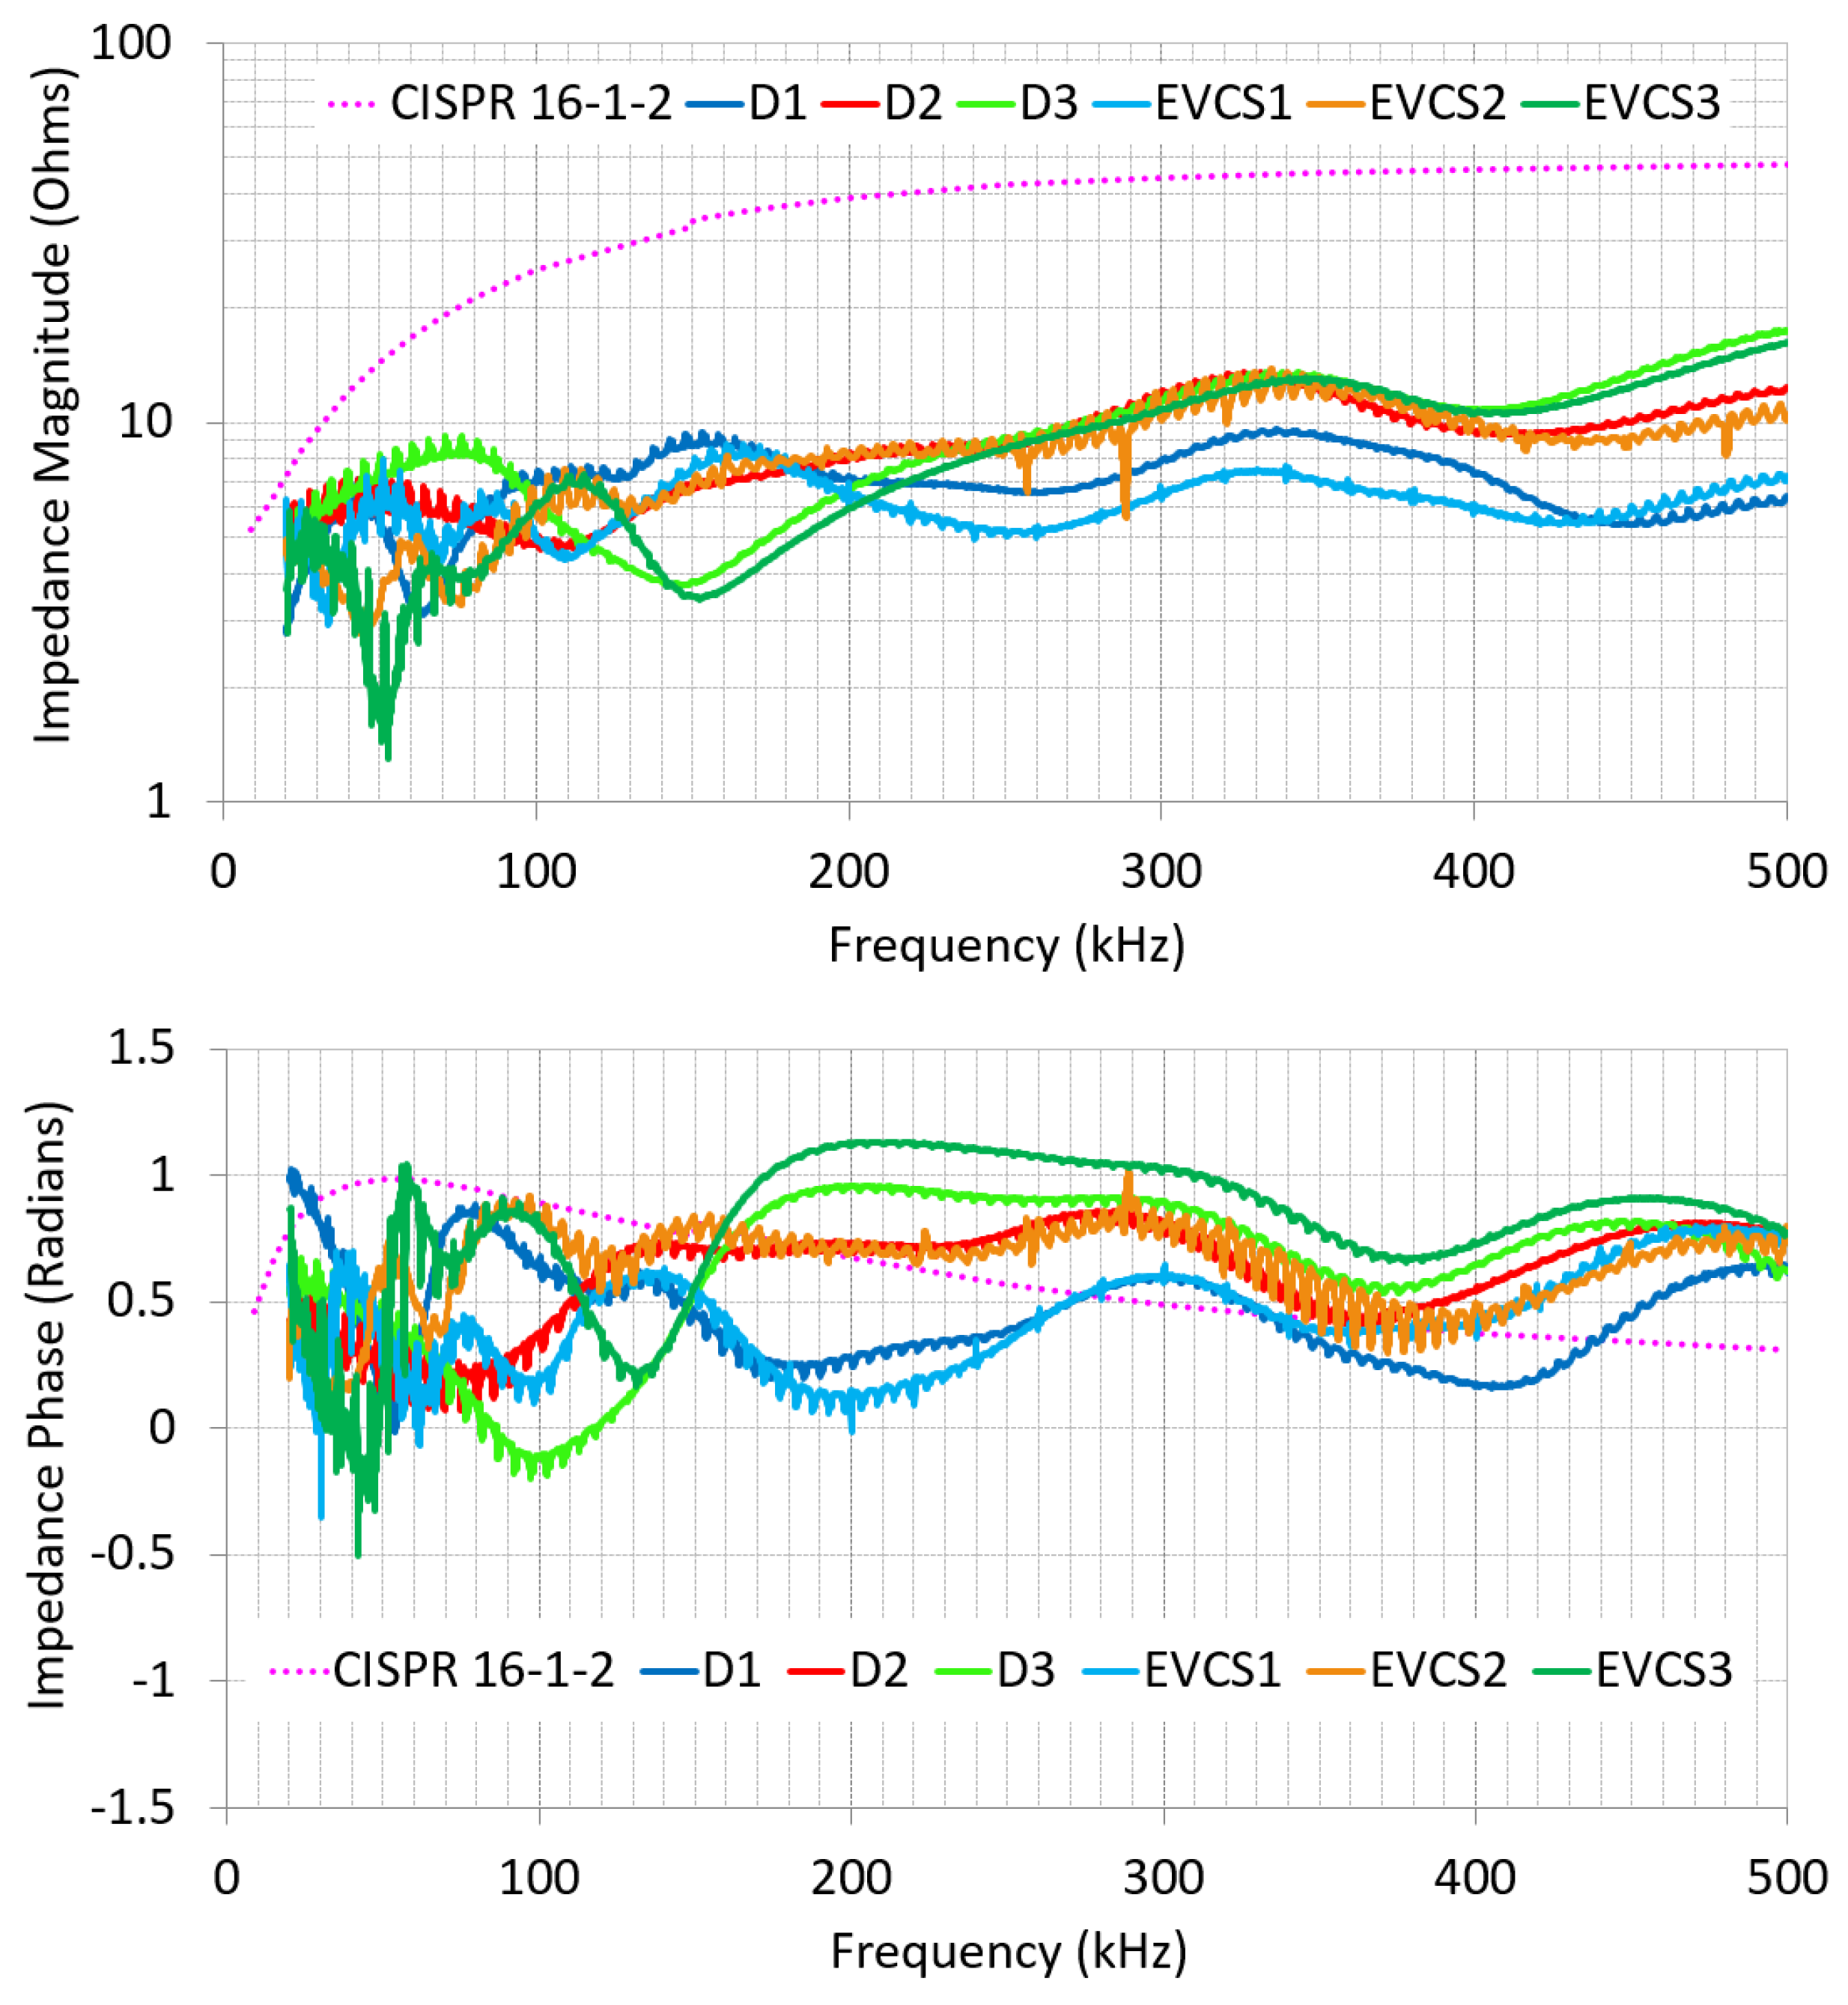
Short-term dynamic grid impedances have also been detected in indoor environments [108,109], mainly due to the operation of household appliances (PCs, mobile phones, lamps, etc.). Regarding EV charging stations with EVs, variations of the short-term dynamic grid impedance observed during the charging process were reported in [117]. Figure 15 shows the magnitude and phase of the short-term dynamic grid impedance for the 9–500 kHz range for the 20 ms mains cycle [117]. In the figure, the short-term variations occur every 10 ms, corresponding to the half of the mains period, and are more pronounced in the magnitude at lower frequencies.
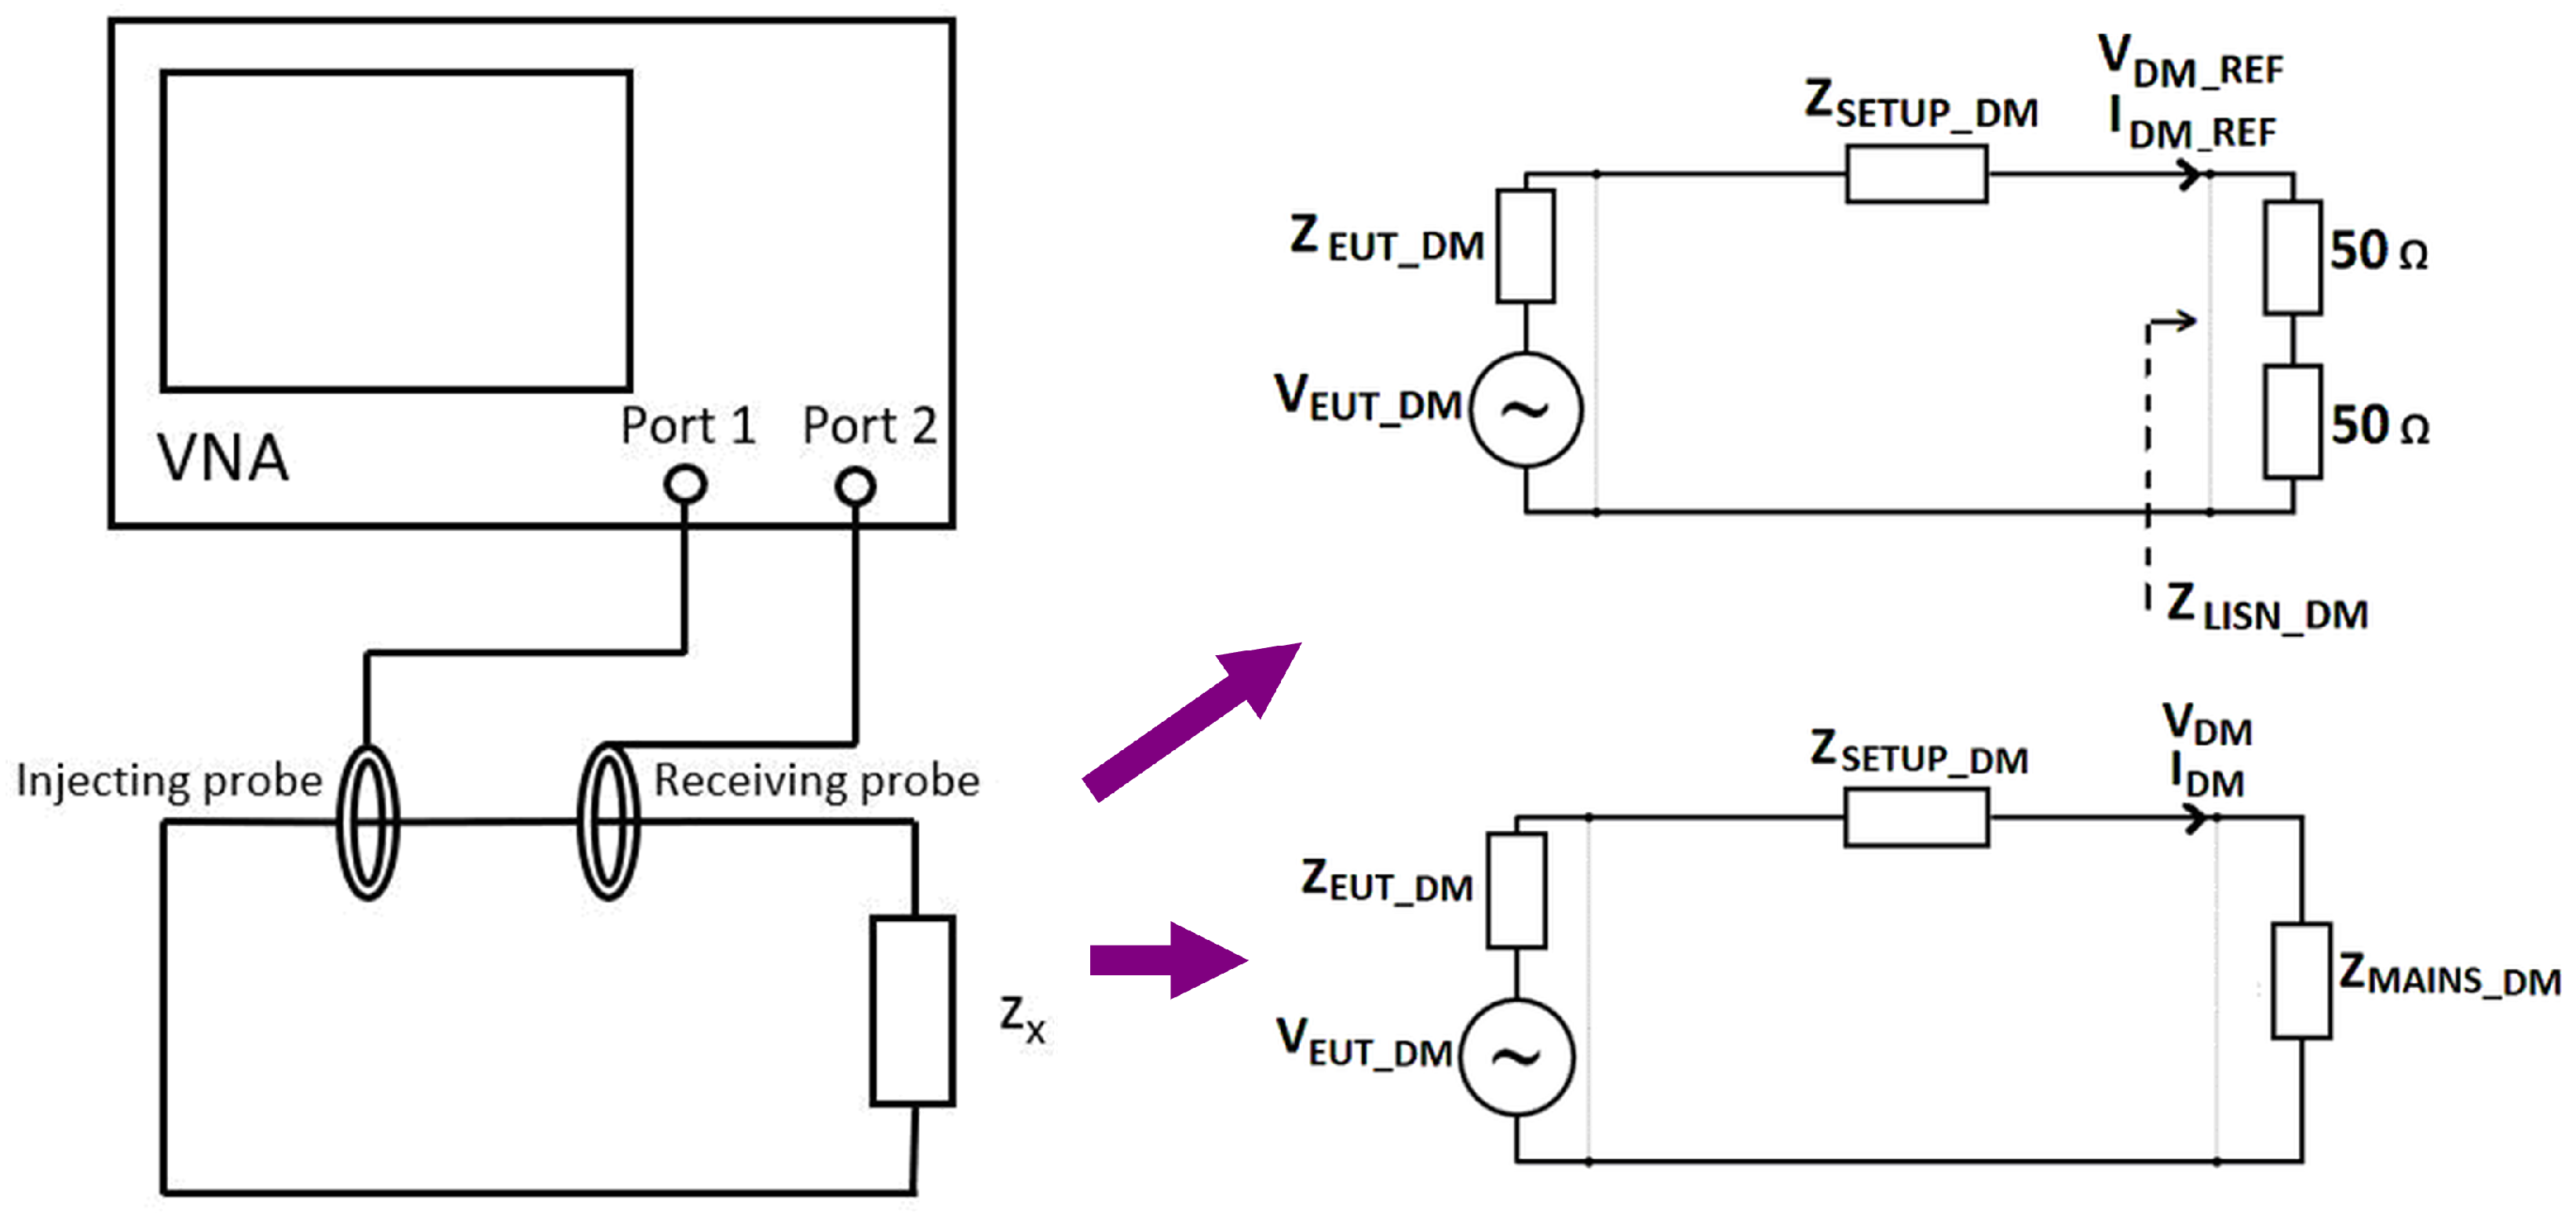
With the purpose of providing a numerical representation of the frequency-dependent grid impedance, the so-called reference impedance was developed by standardization and regulatory bodies, based on simplified assumptions [93]. Hence, the Artificial Mains Network (AMN) was defined by the standard IEC 61000-4-7 [119] as the reference grid impedance in the 2-9 kHz frequency band, while the LISN was defined by the CISPR 16-1-2 [120] as the reference impedance for the 9-150 kHz range. However, it has been proven that these reference impedances largely overestimate the real on-site values of the grid impedance [93,103,117,121]. This has been discussed in [92], where various curves are compared as extracted from the harmonic limits for even and odd harmonics and assuming rms summation for a certain number (10 and 15) of concomitant sources of emissions. The results suggest that the reference impedance curve was not based on measurement results, but on simple assumptions of high-order harmonic emissions. As an example of this fact, Figure 16 shows the values of the reference impedances and the grid impedances measured in three EVCSs during the charging processes [117].
Different initiatives to redefine AMN and LISN, in order to include impedance values closer to real grid impedances, have been developed. One of the most relevant attempts was the Z-NET project [122], with the purpose of defining and implementing a metrological traceable static reference impedance, calibrated with a LCR meter. This reference impedance would allow the calibration of impedance measurement systems. Four different measurement systems, based on different approaches, were employed in this project. The project obtained relevant results, but it did not provide a definite reference impedance representative of distribution grids of different countries. It was also concluded that the measurement conditions and connections could affect the results, so further research is needed in this sense. The need of a time variant and programmable reference impedance, in order to quantify the short-term dynamic impedance, was also highlighted in this project.

4.3. Types of Impact

The conducted emissions above 2 kHz may impact on the equipment connected to the LV grid, causing thermal stress, malfunction, and audible noise [123,124,125]. The thermal stress is caused by power dissipation in the grid elements: transformers, cables and electronic components within connected equipment [32]. This phenomenon is known to reduce the lifetime of electrical and electronic equipment [126]. Regarding equipment malfunction, this phenomenon is related to high amplitude impulsive emissions injected in frequencies above 2 kHz [123]. Lastly, the audible noise is created by mechanical oscillations generated by conducted emissions in capacitors, coils and transformers for frequencies up to 20 kHz [124].
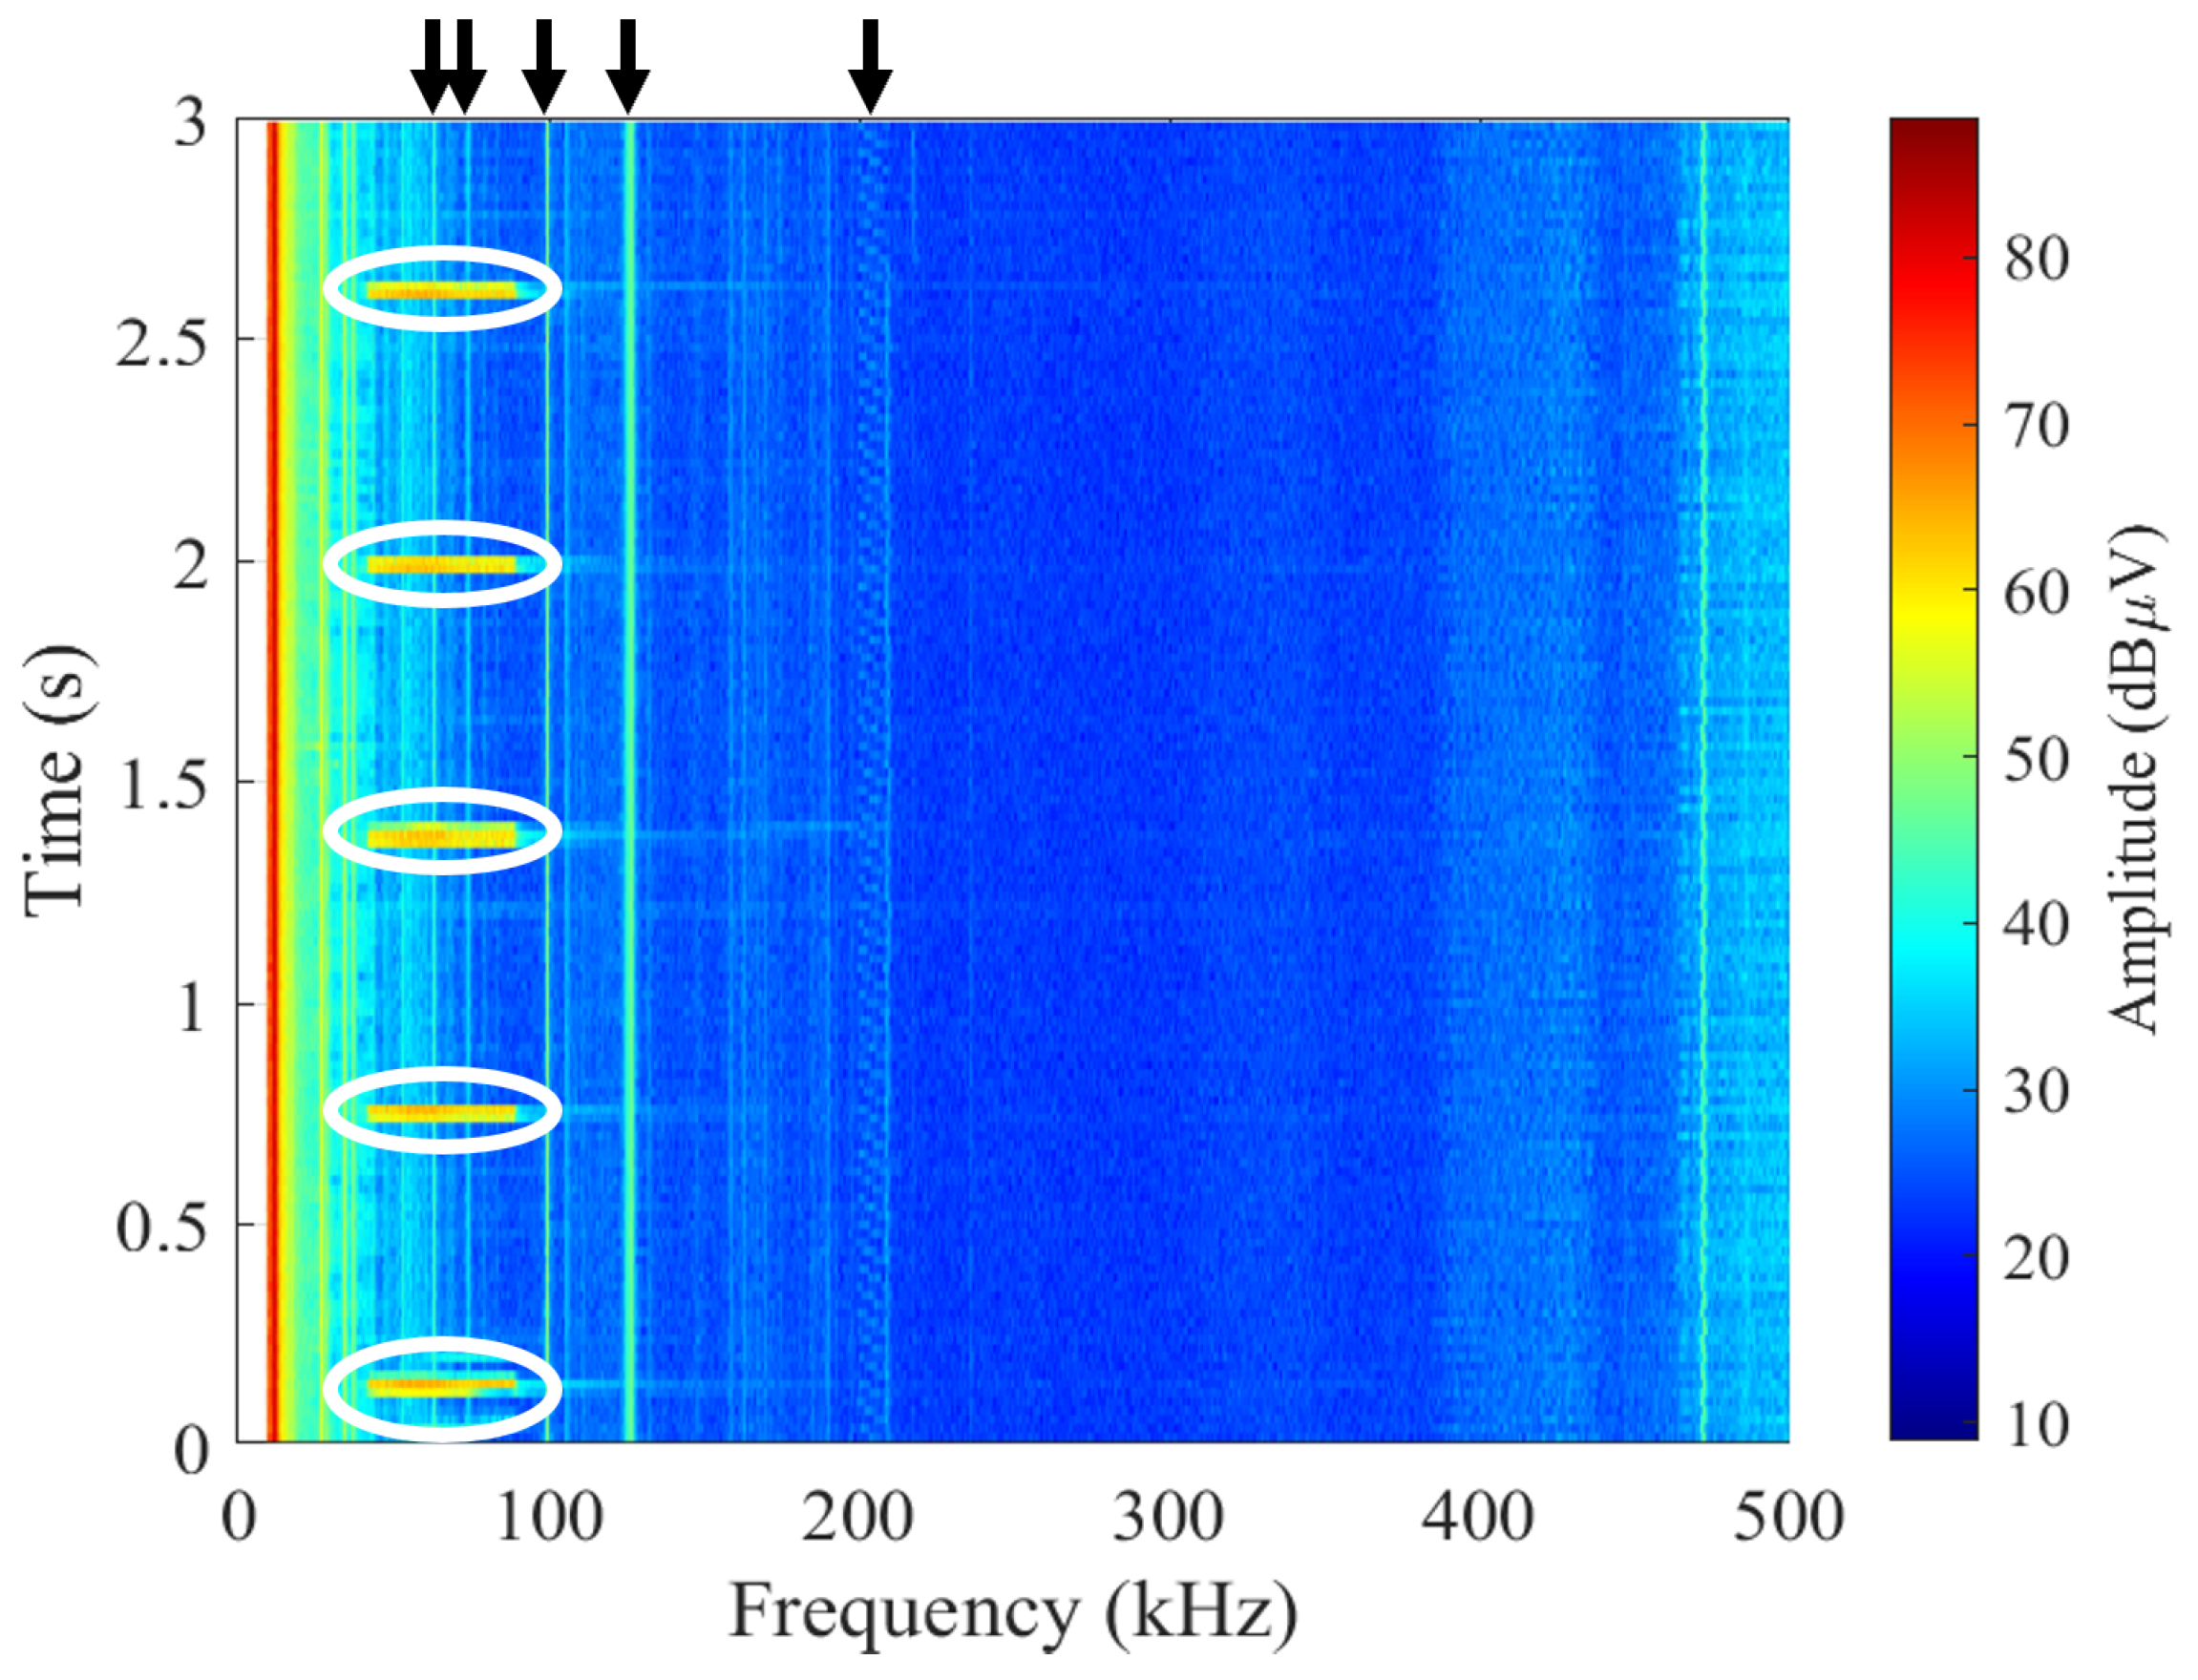
In the 9-500 kHz range, conducted emissions are also a significant source of interference for PLCs [94,95,96,97,127,128]. These communication platforms, which are implemented in smart electricity meters, use the LV distribution grid as the transmission medium to transmit telemetry information, such as energy consumption and generation of EV charging stations and PV inverters, respectively. Since PLC is one of the fundamental enablers of Smart Grid deployment, any degradation in PLC performance may negatively affect the implementation and operation of Smart Grid applications. Figure 17 describes how conducted emissions may interfere PLC frames, since both are in the same frequency range. The spectrogram represents the amplitude of the noise and emissions registered in the LV distribution grid for the 9–500 kHz range over time. In the figure, the short PLC transmission bursts are identified as horizontal lines in the 40–90 kHz range, as they are multi-carrier bursts of a few milliseconds, while the narrowband continuous disturbances appear as vertical lines. Depending on the relative amplitude of the conducted emissions and the PLC transmissions, conducted emissions may provoke smart meters to be unable to decode the PLC frames when overlapped [129].
The power that can be transferred between loads and the distribution grid directly depends on the ratio of the impedances of both elements. Hence, the signal power that is transferred between transmitter/receiver devices connected to the grid can be calculated as the ratio between the transmitter and grid impedances, and the grid and receiver impedances, respectively. As an example, Figure 18 shows how the frequency-dependent impedance has a direct influence on the level of the received PLC signal burst [107].
The grid impedance that a PLC device faces is usually referred as “grid access impedance”, which is a combination of (i) the loads connected in different points of the grid, such as home appliances, lightning equipment, EV charging stations and PV panels, (ii) the type of electrical cable employed in the distribution grid, and (iii) the grid topology (number of branches and bifurcations), which determines how the loads are interconnected.
Finally, the resonance effects of the grid impedance reduce or increase the level of signals generated by all the devices connected to the grid, regardless they are PLC signals or conducted disturbances. In the case of conducted disturbances, the potential interfering effects on the reception of the PLCs data is significantly increased [103]. Therefore, the identification of the devices generating resonance effects and the representative values of frequency-dependent grid access impedance is a relevant factor that determines the propagation of both PLCs data and interfering conducted disturbances [116].
As many of the current and future Smart Grids applications are based on robust and prompt data transmission through the grid, the detailed knowledge of the grid impedance, and its dependence with frequency and time, are key aspects for the proper performance of reliable and fast PLC technologies, and, as a result, for the deployment of new uses and applications of Smart Grids.

5. Measurement Methods, Metering Issues and Standardization Aspects

5.1. Impact of Distortion on Energy Metering and Efficiency Assessment

Distortion has a direct impact on energy metering, as different devices and measurement methods may exhibit significantly different responses under non-sinusoidal conditions. This issue has become increasingly relevant with the widespread adoption of power-electronic converters. Several studies have shown that traditional energy meters can be affected by harmonics and supraharmonics [130,131,132], leading to deviations in the measured energy, both in favor of and against the final user.
In the context of EV charging stations, current characterization approaches are largely based on conventional AC metering standards. However, the presence of high-frequency distortion, together with the increasing diffusion of DC charging and high-power fast-charging systems, introduces additional complexity. These aspects are not yet fully covered by existing standards and may lead to inaccuracies in the estimation of both transferred energy and conversion efficiency.
Accurate assessment of EVCS performance therefore requires measurement methods capable of accounting for distorted waveforms over an extended frequency range, ensuring adequate accuracy and repeatability. In particular, the definition of suitable metrics and test procedures for both AC and DC charging systems remains an open issue, especially under realistic operating conditions where distortion levels and spectral content vary dynamically during the charging process.
Recent efforts in standardization are addressing these challenges. The OIML guide G22 provides initial guidance for EVCS metrological control and performance verification, although its practical implementation remains complex. In parallel, IEC/CENELEC TC13 [133] is working toward harmonized requirements for energy metering in EV applications, including both AC and DC configurations. These developments highlight the need for improved measurement frameworks specifically tailored to EVCS operation.
When it comes to impose requirements to improve EVCS efficiency favoring its integration in the existing grid, such requirements must be accompanied by agreed and appropriate measurement methods delivering an efficiency estimate with adequately low uncertainty. Efficiency in fact relates on the one hand to an overall goal of energy saving and to the power loss of the EVCS as a product (with consequential cooling necessities), but on the other hand affects the relationship with the user who may be billed a variable amount of the power losses. The other side of the coin is then the billing of the utility for the energy absorbed by the EVCS that includes the entirety of the power losses. EVCS efficiency and power losses then bear a legal connotation as an invisible element of a contract between the utility selling the energy, the EVCS providing it to the EV and the final user.
Only recently, the International Organization of Legal Metrology (OIML) working group “Instruments for measuring electrical quantities” has published the guide G22 [134], providing a first guidance for EVCS metrological controls and performance verification. However, its practical implementation is challenging because some tests require expensive hardware and are very time consuming.
Similarly, the IEC/CENELEC TC13 [133] is working on the regulatory aspects for energy metering in this respect, trying to cover both AC and DC implementations. To this aim the newly started Met4EVCS project [135,136] will study the two implementations in its WP 2 and WP 3 work packages, respectively.
A strategic and important point is the harmonization of regulations for EVCSs across Europe (one of the objectives in particular of the European Cooperation in Legal Metrology, WELMEC, with the working group WG11 “Utility meters” [137]), easing the commercialization of EVCSs and recharging energy, and increasing transparency and the level of confidence and trust in consumers, promoting the electromobility transition throughout Europe.

5.2. Emission Limits, Immunity Levels and Compatibility Levels

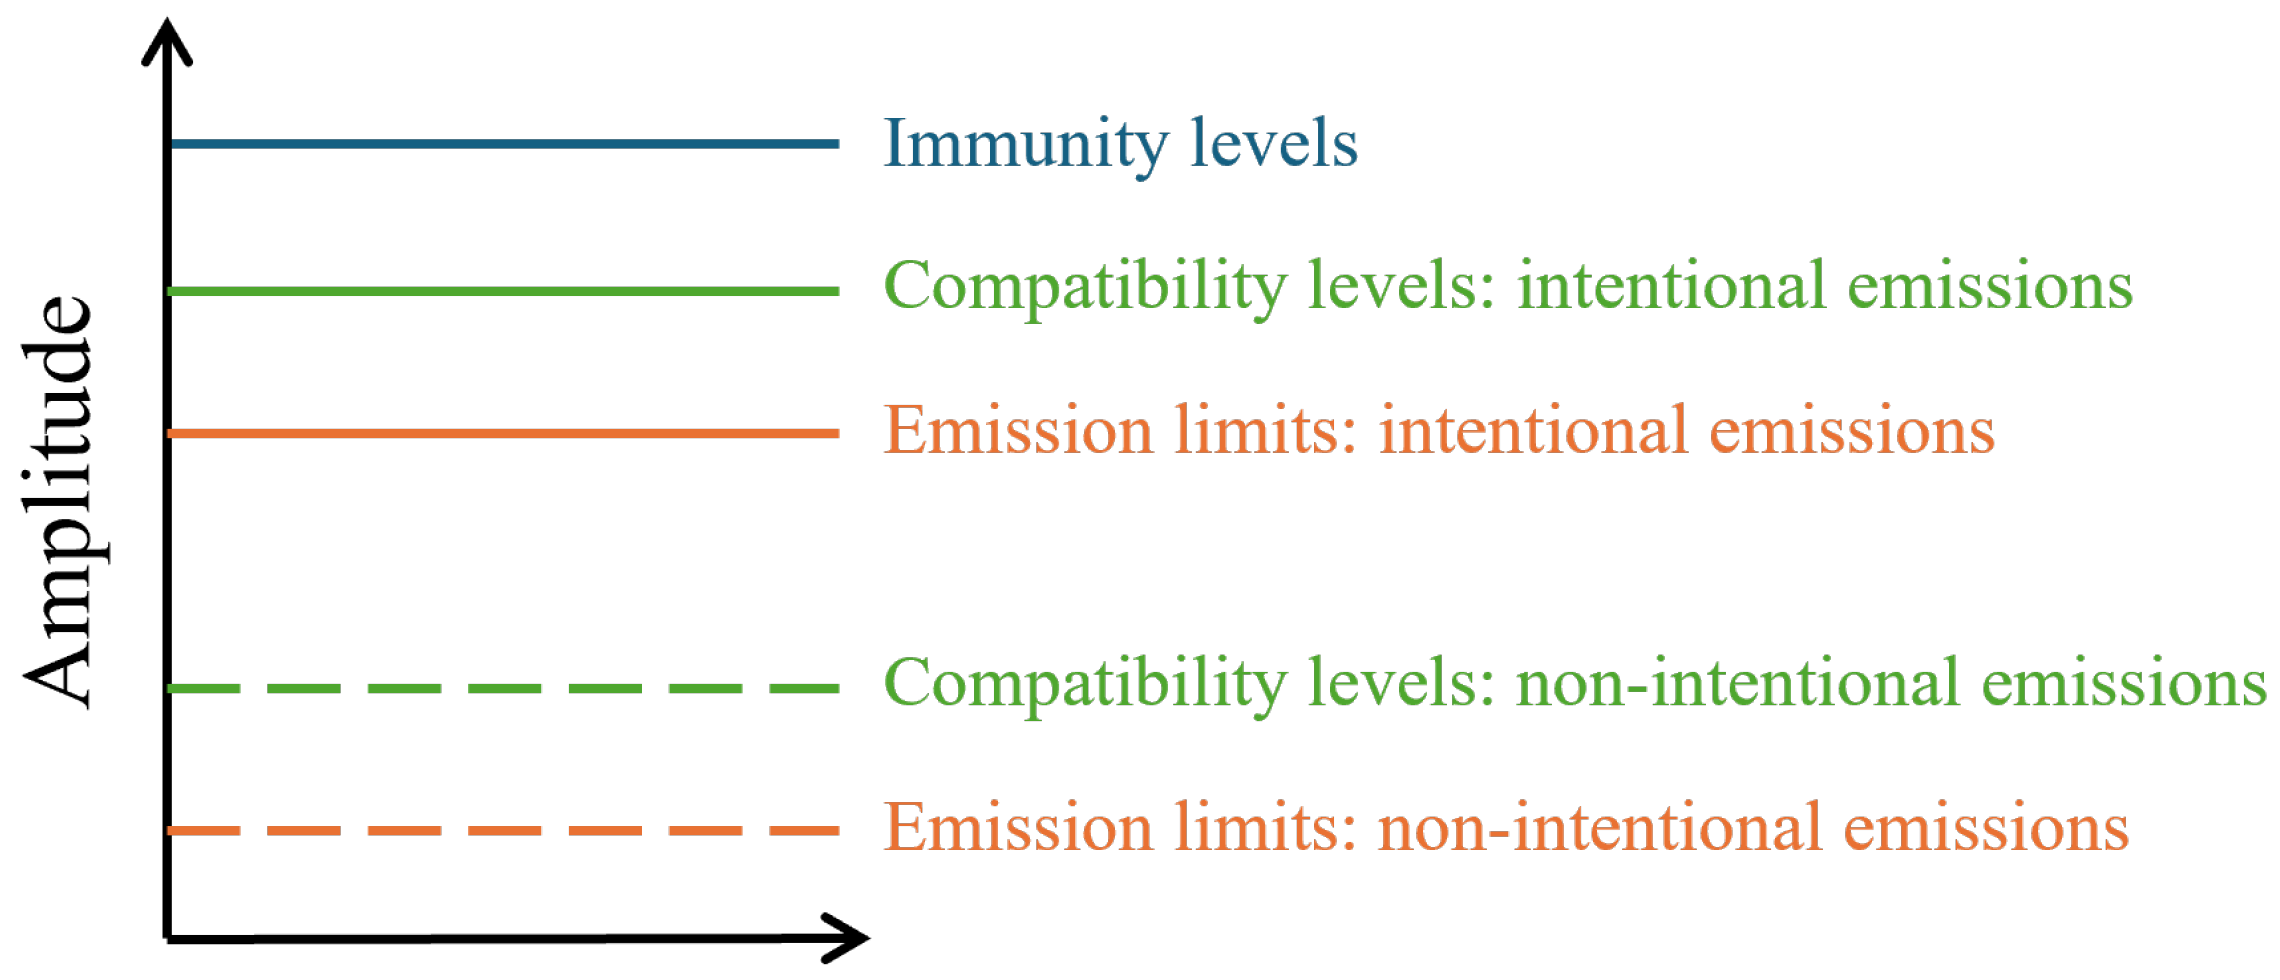
To avoid the impact of conducted emissions in the equipment connected to the LV grid, international standards have defined limits to these perturbations, such as, immunity levels, compatibility levels, and emissions limits. As shown in Figure 19, these limits have different amplitude values due to the purpose with which are defined. The emission limits, such as the ones defined in CISPR 14-1:2020 [138], CISPR 15:2018 [139], and CISPR 32: 2015 [140], are the maximum amplitude that the disturbances of individual devices could inject in the LV grid. The emission limits have different amplitude limits depending on their purpose. If the conducted emissions are spurious disturbances, or non-intentional disturbances, generated by the devices, the allowed maximum amplitude for these emissions is lower (see Figure 19). Instead, if the conducted emissions are injected intentionally in the LV grid, e.g., for communication or measurement purposes, the allowed maximum amplitude is higher than for the former (see Figure 19). Regarding the compatibility levels regulated in IEC 61000-2-2 [141], these limits are defined for the combination of all disturbances present in the LV grid. These limits, which are also divided in intentional and non-intentional disturbances, allow higher amplitude values since they consider the combination of all individual emissions generated by the devices connected to the LV grid. The immunity levels, such as those defined in IEC 61000-4-19 [142], are the maximum amplitude values of disturbances up to which the equipment connected to the LV grid must operate normally. That is why these amplitude limits are higher than the previous ones (see Figure 19). Therefore, the manufacturers of appliances have to design their equipment to be able to withstand conducted emissions up to those levels.

5.3. Conducted Emissions: Measurement Methods, Metrics and Setups

5.3.1. Harmonics

The measurement techniques used for the evaluation of harmonic voltages and harmonic currents are described in IEC 61000-4-30 [144] and IEC 61000-4-7 [119]. A ten-cycle measurement interval (for the 50 Hz signals) is considered to ensure a frequency resolution of 5 Hz. The sampled voltage waveform synchronized to the fundamental frequency is considered for harmonic calculations employing the Discrete Fourier Transform (DFT) algorithm. Calculated harmonic magnitudes for voltage and current are consecutively aggregated (for high-performance instruments of Class A) into a 3 s and a 10 min interval without gaps.

5.3.2. Supraharmonics

Measurement Systems
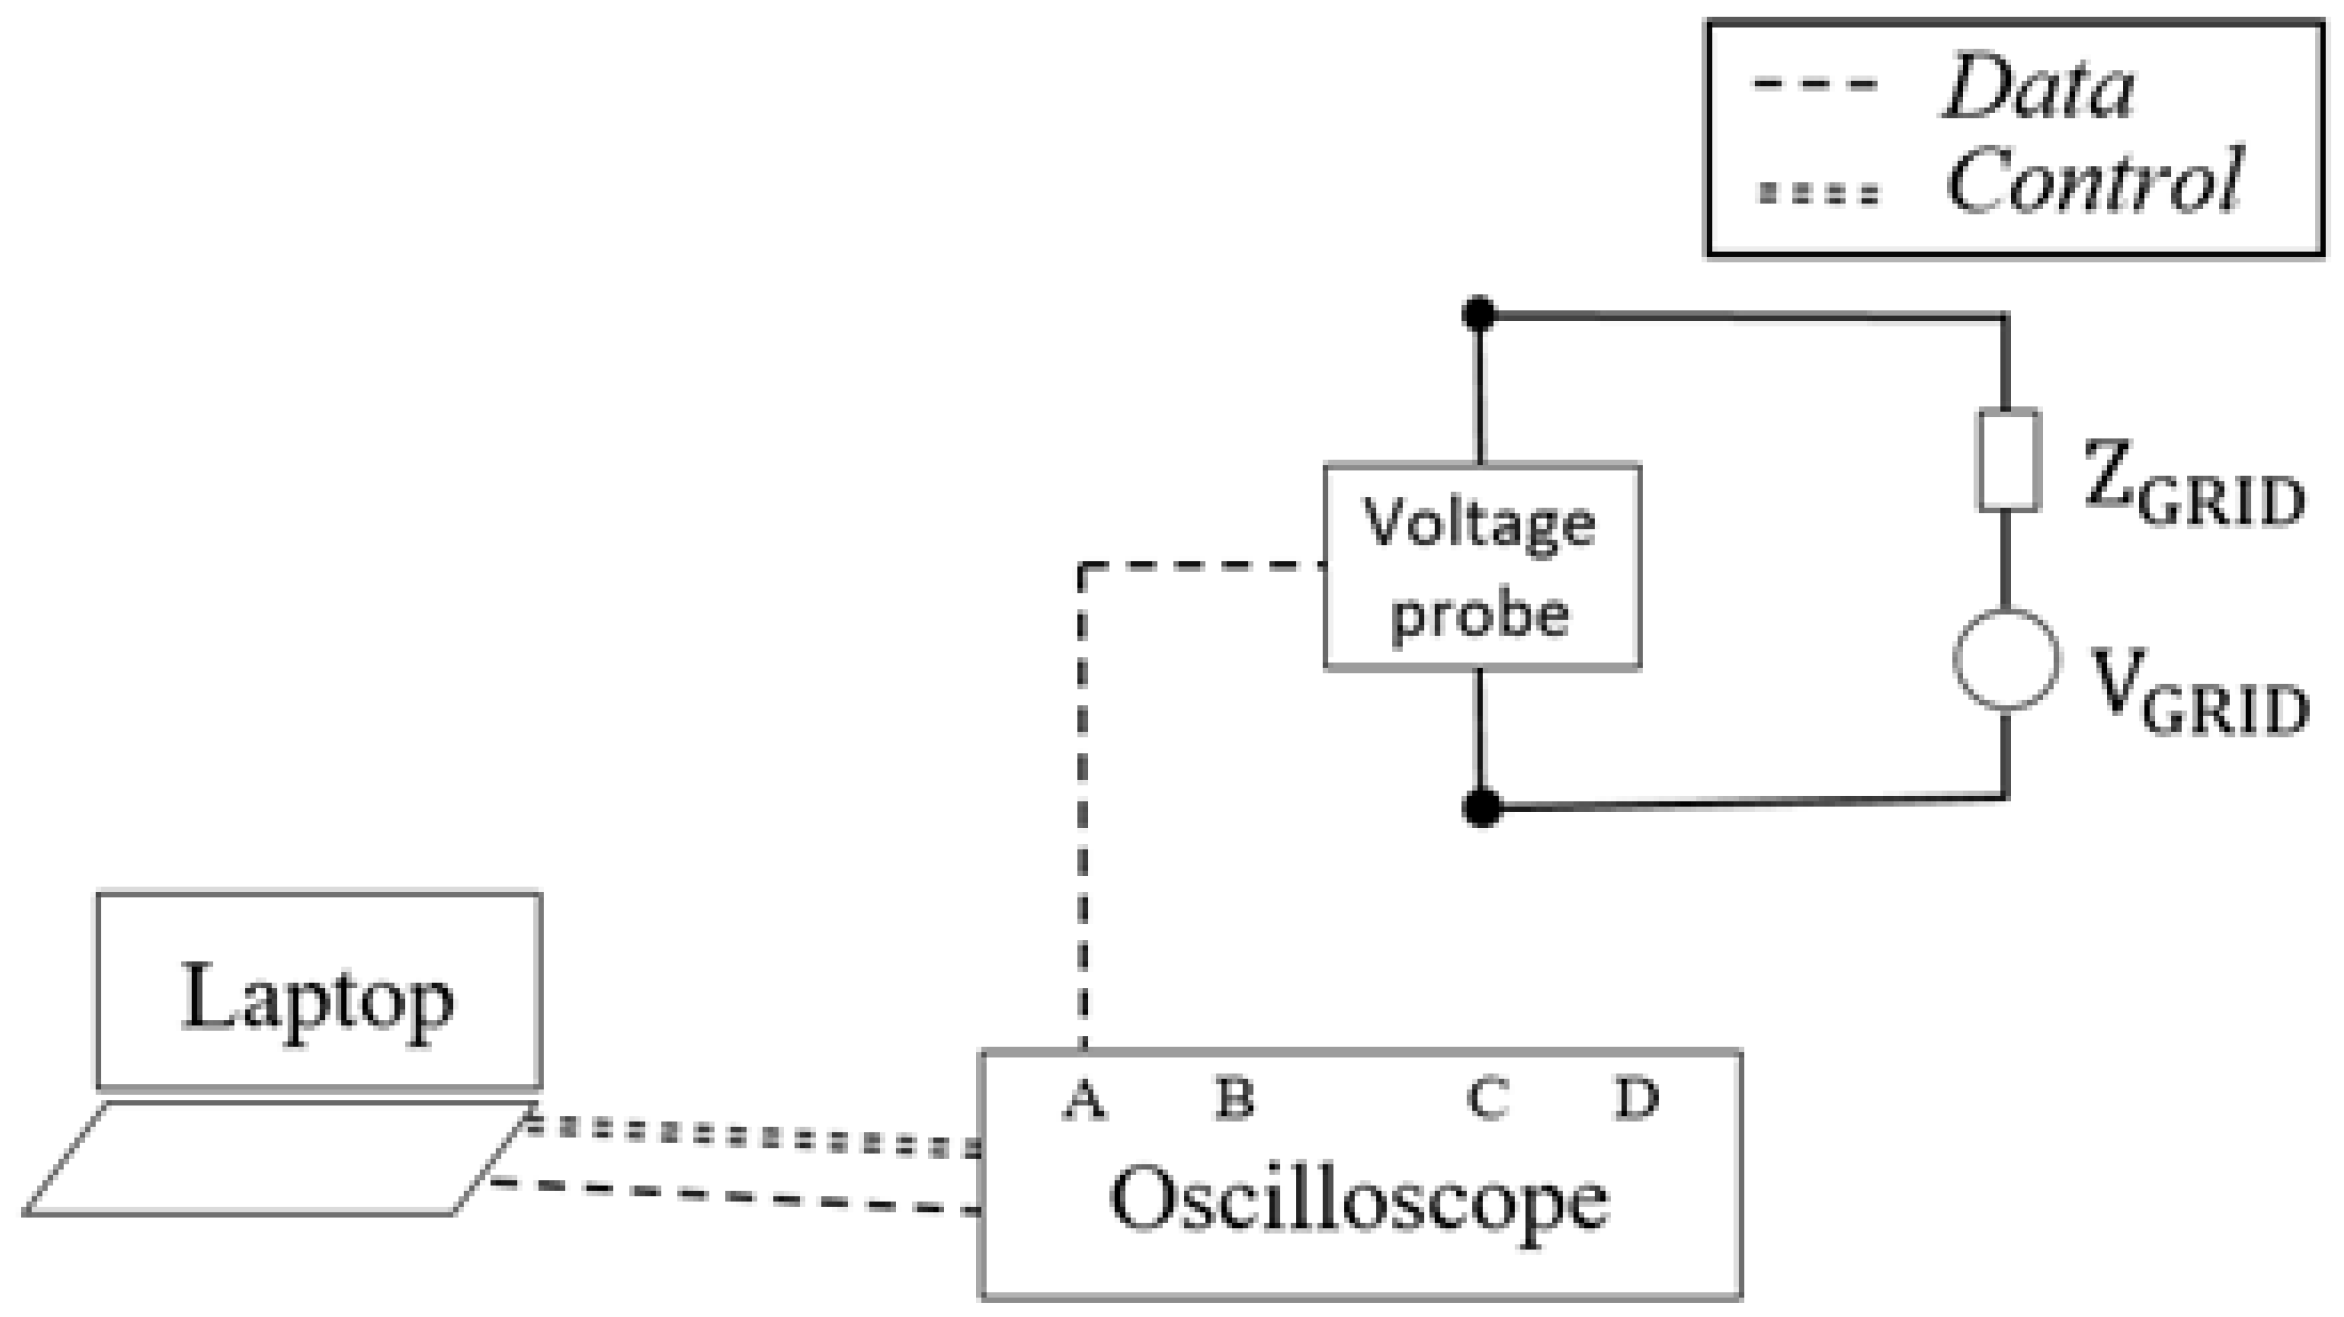
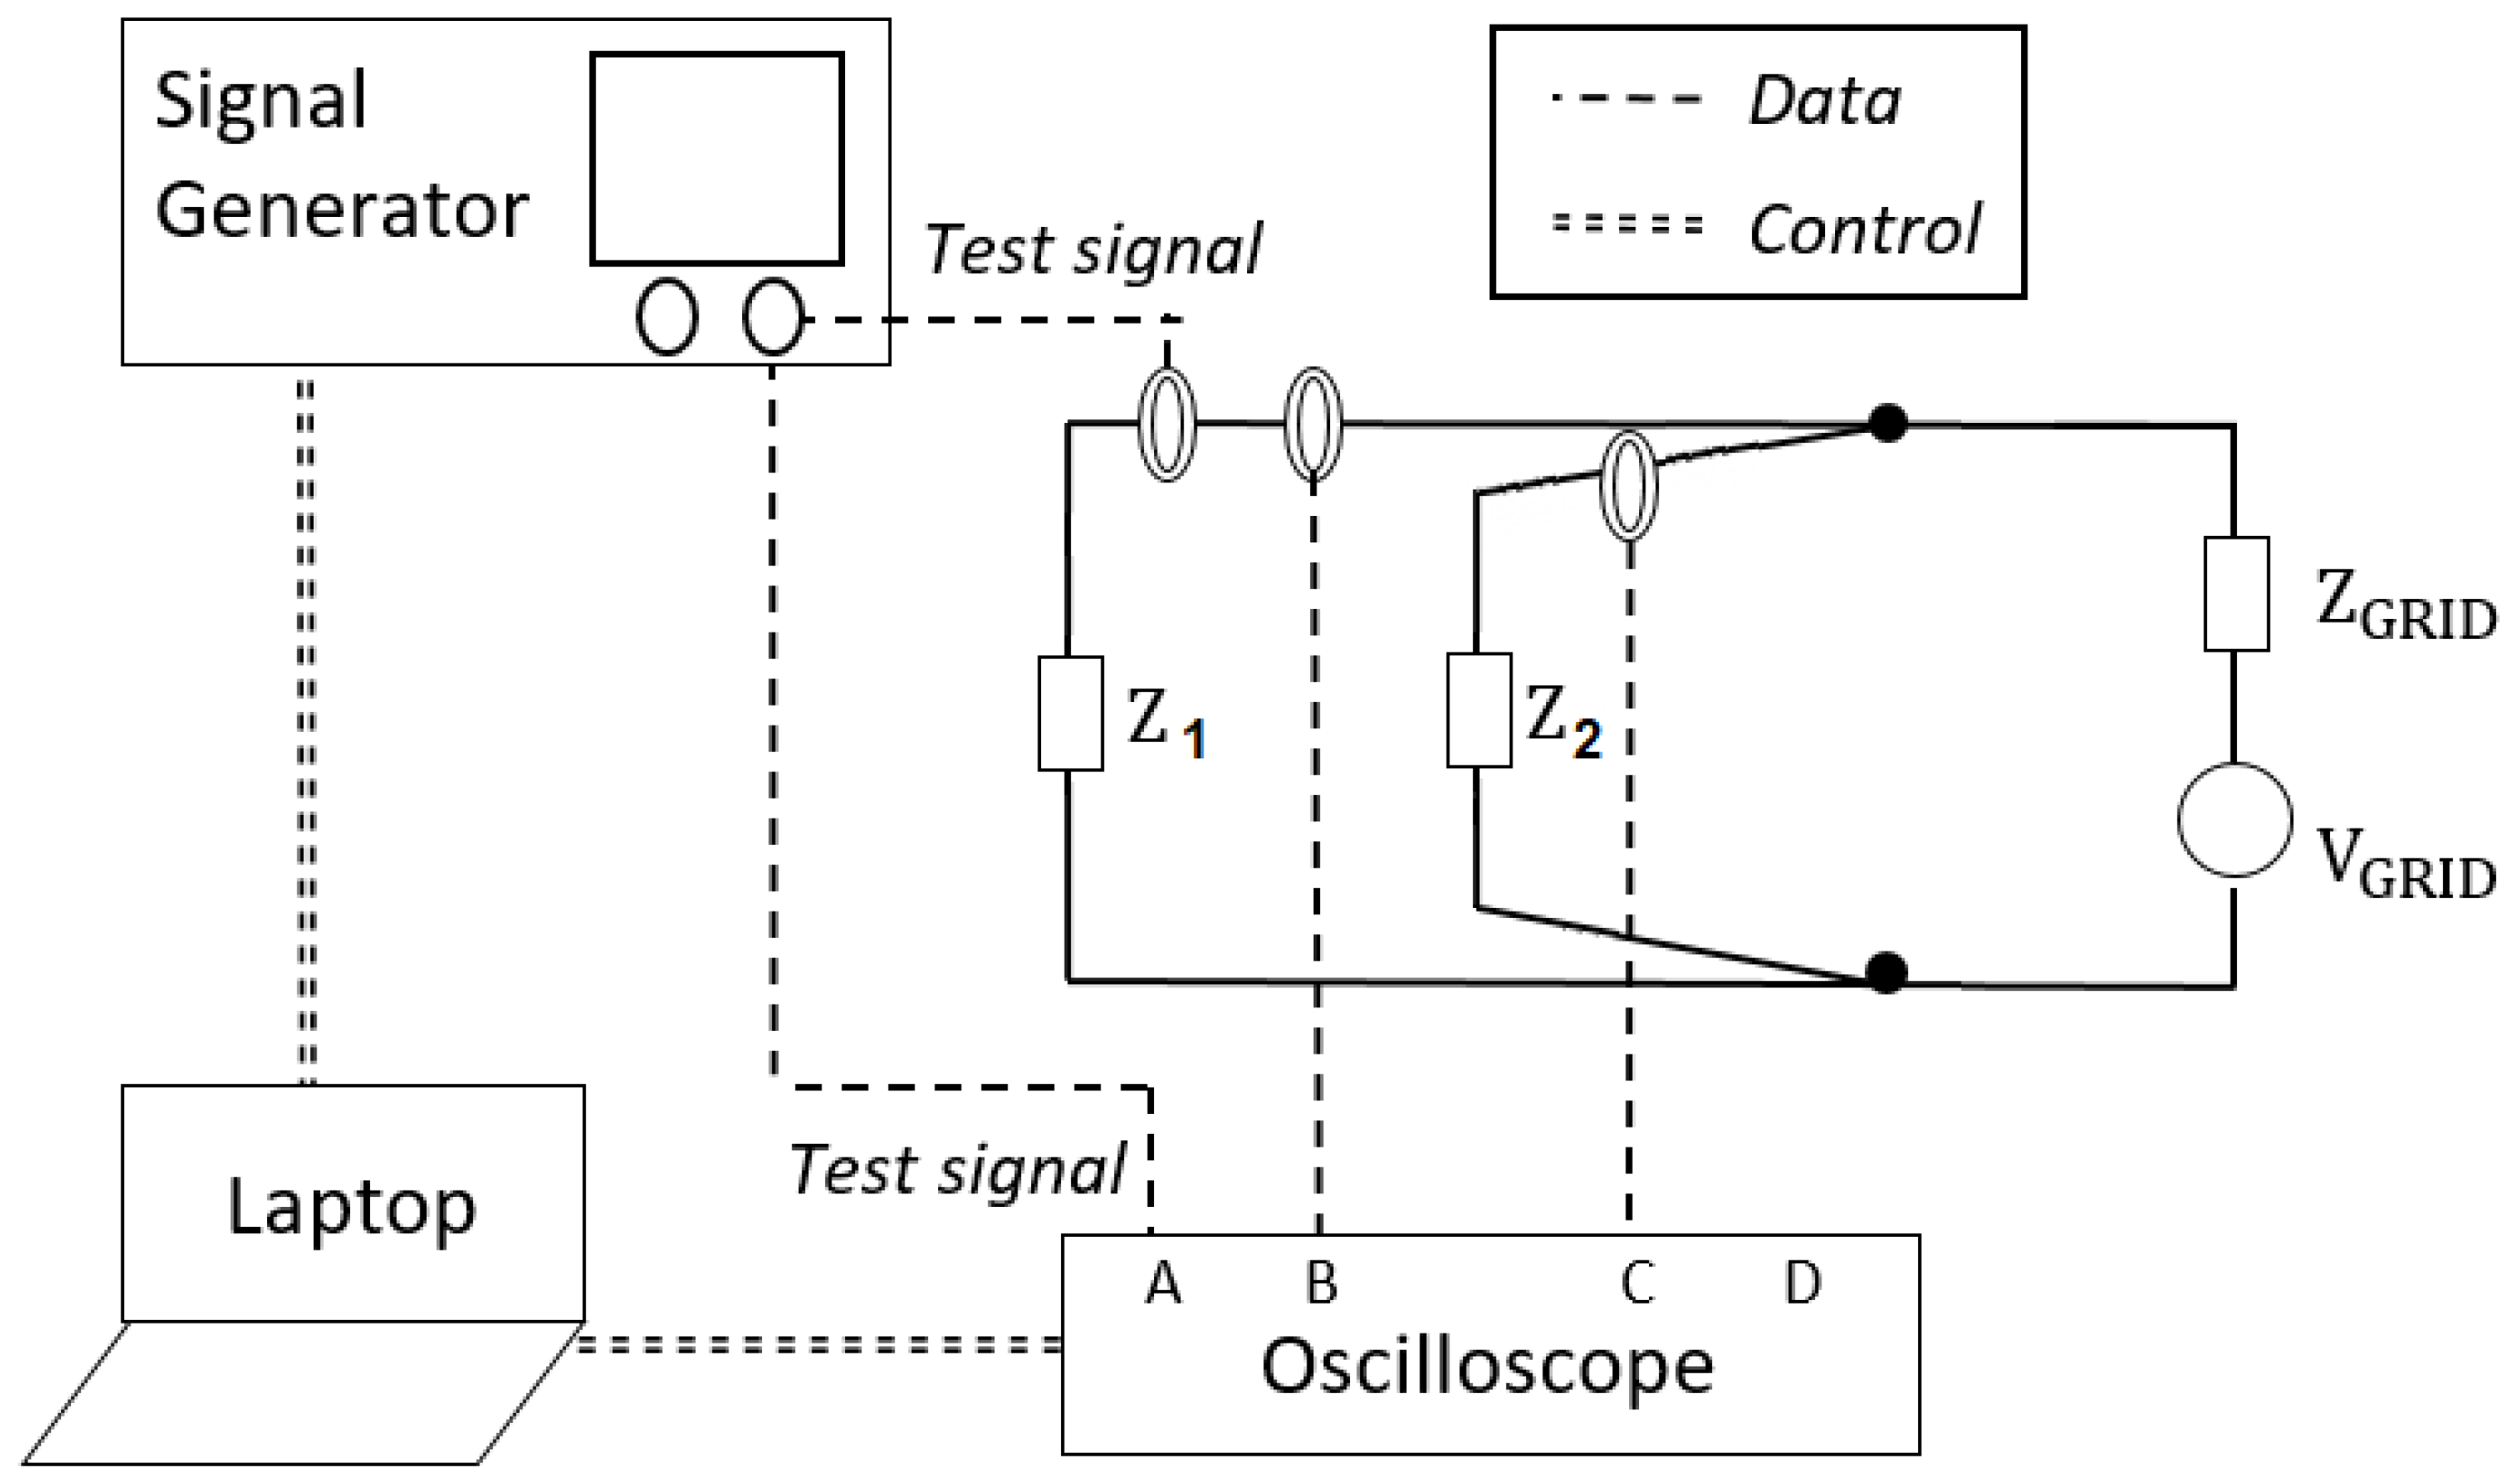
The measurement systems to assess the conducted emissions above 2 kHz can be grouped into two types, according to the acquisition instrument: they can be based on a network analyzer or an oscilloscope. In the first group, commercial network analyzers can be used to assess the conducted emissions in the frequency domain [110,128]. They are accurate instruments that provide direct results, but are not prepared to face impulsive events and over-voltages that are usually present in the LV distribution grid, and may severely damage the instrument. In the second group, measurement systems based on oscilloscopes [101,127] are equipped with a more robust interface. These devices acquire and sample the waveforms in the time domain, which implies that post-processing techniques are required to assess the emission levels. For that, different metrics and assessment methods can be applied to obtain the spectral content of the magnitude of the conducted emissions. Figure 20 represents an example of a measurement system based on an oscilloscope, using a voltage probe to obtain the open circuit voltage grid (VGRID); this voltage probe should be a high impedance probe so that the current over the impedance grid (ZGRID) can be considered negligible.
Metrics and Measurement Methods for the 2–150 kHz Range
For the 2–9 kHz frequency range, the standard measurement method to assess the level of the conducted emissions is described in the Annex B of the IEC 61000–4-7 [119]. This method provides the RMS spectra in a form that can be directly compared against the compatibility levels defined for this frequency range (see IEC 61000–2-2) [141]. As shown in Figure 21, this method applies a discrete Fourier transform (DFT) to calculate the spectral components of the measured signals. The DFT uses non-overlapping rectangular windows of 200 ms to obtain spectral values with a resolution bandwidth of 5 Hz. Then the spectral components are grouped in order to obtain a resolution bandwidth of 200 Hz, which are applied to an RMS and detectors with the aggregation intervals (3 s, 10 min, etc.) defined in IEC 61000-4-30 Ed. 3 [144]. Peak values are also provided by this method.
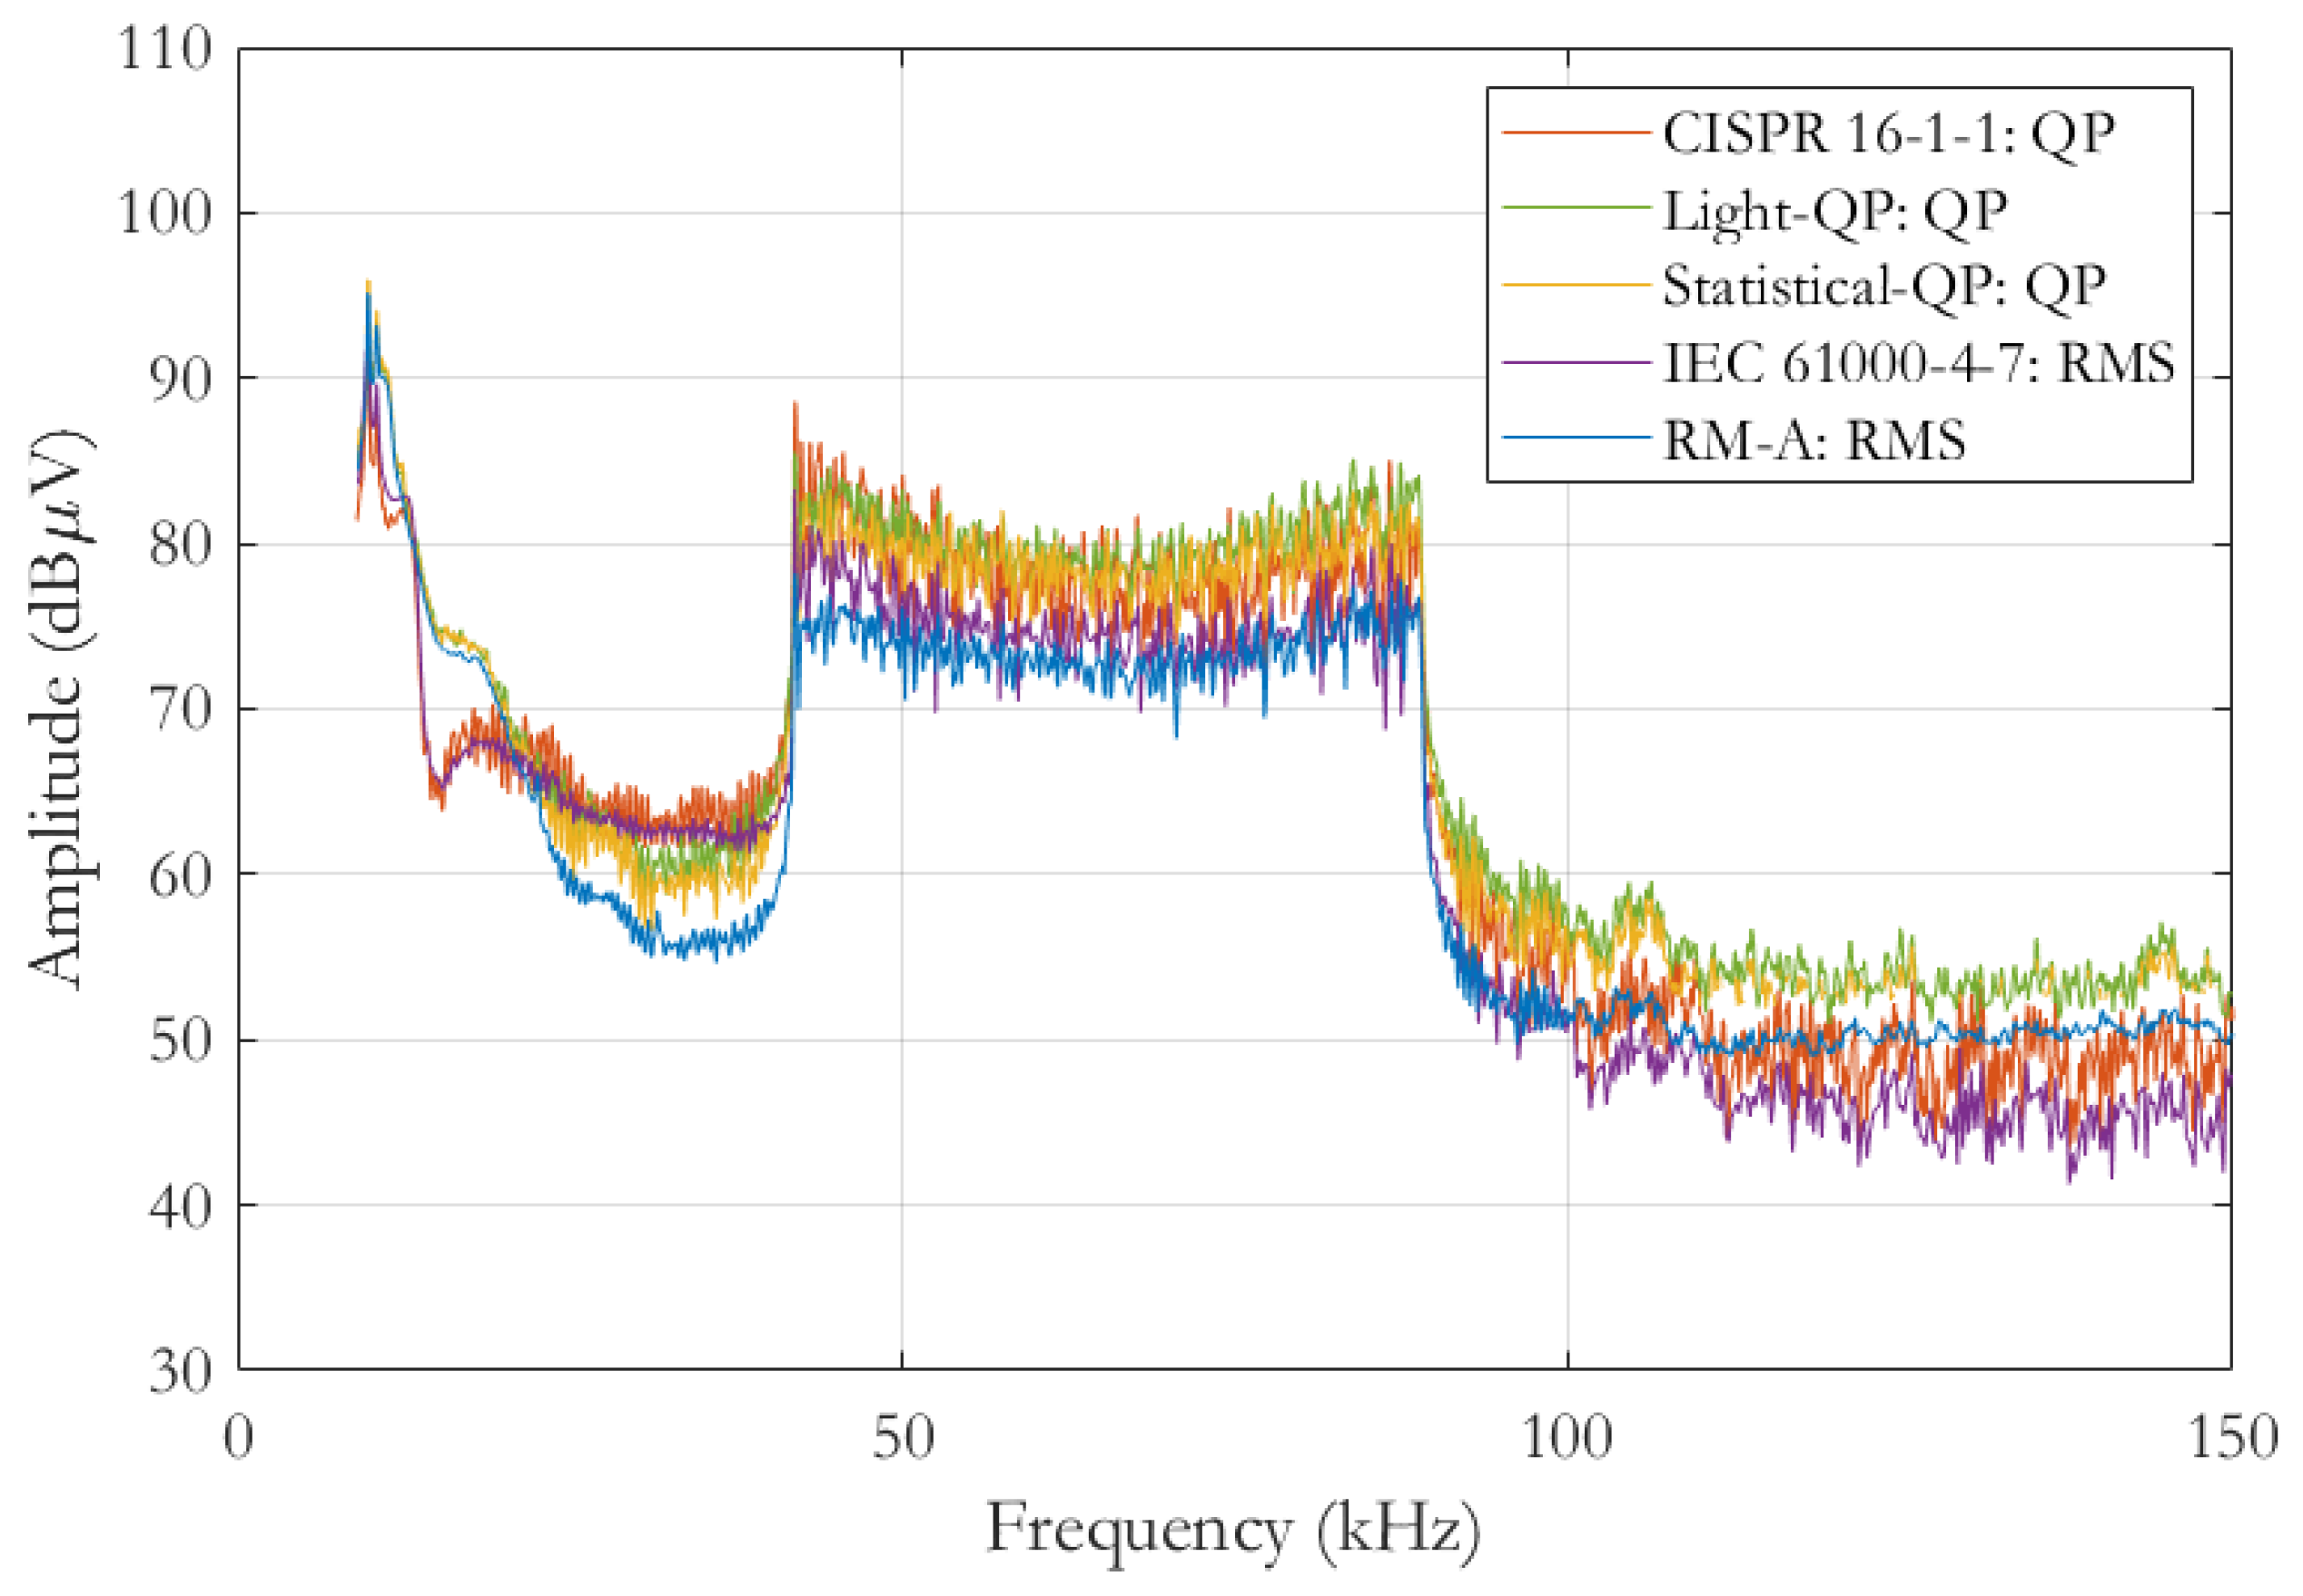
For the 9–150 kHz range, the standard IEC 61000-4-30 Ed. 3 Ed. 3 [144], in Annex C, proposes three measurement methods for PQ analysis to assess the conducted emission in the 9–150 kHz range. However, Annex C is stated as ‘informative’; therefore, its content is not mandatory. Moreover, the measurement methods proposed in Annex C present several drawbacks that impede a proper characterization and analysis of the conducted emissions in the LV grid for the 9–500 kHz range. The first proposed method is the calculation procedure defined in the IEC 61000-4-7–Annex B [119], which was initially defined for the 2–9 kHz range. This method provides spectral results with high-frequency resolution and accurate RMS results [145]; however, there is no guidance on how to extend the method described in this standard to upper frequencies. The second proposed method is the CISPR 16-1-1 [146], defined as a receiver designed for electromagnetic compatibility (EMC) lab tests; therefore, its application to LV grid recordings is not straightforward. In addition, this method does not ensure consistency with the PQ measurement methodology due to its ambiguous definition and the usage metrics not defined for PQ studies, such as quasi-peak, RMS-average, and average. Moreover, some studies have raised several concerns about the reproducibility of this method, proving that for the same input signal, different implementations can provide high deviations in results [147]. Lastly, the third method proposed in the standard is an alternative technique defined in IEC 61000-4-30 Ed. 3 [144]–Annex C, designed with the purpose of requiring lighter resources than in the previous two methods. Therefore, some adjustments were included in the discrete Fourier transform (DFT) block, reducing the computational burden but omitting 92% of the signal.
The measurement methods defined in standard documents present several issues that do not ensure consistency with PQ measurement methodology, which is required to adequately characterize conducted emissions in the 9-500 kHz range. The measurement methods present different configurations on the DFT block, discontinuities in results, and non-comparable metrics. In addition, there is no guidance on which method should be used for the 150–500 kHz range [145]. As a result, standard documents propose a set of inconsistent measurement methods, but not a consistent measurement framework [145].
In recent years, research contributions have proposed novel techniques to overcome certain limitations of standardized measurement methods [148,149,150,151,152,153,154,155,156]. Among the novel techniques proposed in research contributions are the following: Wavelet approach [152], Subsampling approach [153], techniques based on Compressing Sensing [154,155], Matrix Pencil Method-based approach [156], the RM-A method [145], Light-QP [148], Statistical-QP [149], Approximated-QP and Conservative-QP [150], and the technique to characterize impulsive disturbances in the joint time-frequency domain [151], etc. All of them provide different results and implement different configurations as shown in Figure 22 for five different assessment methods applied over the same input signal; moreover, they do not individually solve all the issues in the measurement of conducted emissions. In particular, a set of methods has been defined with a common basis (the RM-A method) in order to define a consistent measurement framework [150]. This framework ensures consistency with PQ measurement methodology since the RM-A method is an adaptation of the IEC 61000-4-7 method up to 500 kHz [145]. Nonetheless, this framework also provides the EMC output metrics, i.e., the spectral results of Light-QP [148], Statistical-QP [149], Approximated-QP and Conservative-QP [150] methods. Additionally, this framework introduces the technique to characterize the impulsive disturbances in the joint time-frequency domain [151], which allows an isolated characterization of these emissions, improving their understanding.
In research contributions, additional measurement needs have been identified. One of them is the definition of measurement uses cases (MUCs) for the characterization/monitoring of conducted emissions in the LV distribution grid. Different measurement purposes would require different configurations of the instruments, accuracy requirements or number of instruments for simultaneous measurements. In [157] 5 MUCs are proposed to address this gap in LV grid measurements, which are focused on (i) assessing amplitude of the emissions against the compatibility levels, (ii) monitoring the grid for supervision and statistical purposes, (iii) assessing the power of the emissions related to the thermal stress, (iv) characterizing the maximum amplitude of impulsive emissions, and (v) in-depth measurements to assess malfunctions in devices connected to the grid or interferences in PLCs transmissions.

5.4. Grid Impedance: Measurement Systems

Grid impedance measurement methods in live conditions may be classified from different viewpoints:
  • for being used in out-of-service or in live operating conditions;
  • for using excitation test signals injected into thee network (active method) or listening and exploiting existing network signals (passive method);
  • for the domain in which data measurement and processing occurs, distinguishing between time and frequency domain (so focusing on sine-waves at various frequencies or step-like or impulse-like signals, including grid transients), with a wide range of different approaches.
In general the preferred classification is among active and passive methods:
  • Active methods inject an excitation signal to probe Z g at the selected port by either measuring directly voltage and current (voltamperometric methods) or the full representation of direct and reflected components (VNA-like methods). The excitation signal may be a set of tones or a swept sine (chirp signal) in a frequency-domain perspective, or an impulsive or step-like signal in a time-domain perspective.
    VNA based methods, using 2-probe configuration [158], perform better in the high-frequency range, and may suffer from non-ideality of the used probes (saturation), complex wiring for on-site use and limitations of VNA performance while approaching LF [159,160];
    voltamperometric methods, where a test signal is applied to the measuring port and voltage and current are separately measured; this method can be used at high frequency [161], but is suitable also for the LF interval (from nearly DC up to 9 kHz).
  • Passive methods exploit instead excitation signals occurring during operation, passively listening to the grid. These methods are particularly suitable for electric grids with large power levels and/or high voltage, where external excitation would be quite impractical. A common approach is to use a multitude of measuring points by means of phasor measurement units [162], which, however, are hardly applicable to the distribution level and pose a significant accuracy requirement in amplitude and phase of voltage and current transformers, besides a tight time reference [163]. In general, for single-port measurements numerical methods for reduction of indeterminacy and improvement of the signal-to-noise ratio have been proposed (e.g., using least mean squares, Lagrangian multipliers, Kalman filter [164,165]). Focusing on the exploitation of grid background harmonics, the impedance can only then be determined at such specific frequencies [166,167] with unfavorable coherent noise at the harmonic frequencies from a multitude of time-varying sources.
The methods we discuss in the following are all of the active type.
The impedance of isolated devices can be measured accurately employing commercial impedance bridges, impedance analyzers and Vector Network Analyzers (VNA) in controlled laboratory conditions [110,168,169,170,171]. These measurement systems cannot be instead connected directly to the grid, even at the LV level for a matter of electrical safety and performance, for which the two-probe method was conceived [158]. The method uses a VNA for its extended frequency range and accuracy with the principle depicted in Figure 23. A test current is injected into the system and picked up by two current probes with bi-directional (transformer-like) behavior, to allow the full calibration and measurement of the VNA of direct and reflected components.
The metrological performance depends highly on the probe performance, especially in terms of extension to the low frequency range (where RF probes usually become desensitized), saturation (in case the measurement is in live conditions with the mains current flowing through), and system noise (affecting the signal-to-noise ratio, especially when cheap portable VNAs are used suffering deterioration of sensitivity and directivity at LF, e.g., below about 10 kHz). Another relevant problem of this type of measurement in real conditions is the variability of wiring and connections and its effect on the result, as it affects the high-frequency response of the setup that is “canceled” mathematically with the calibration.
Some experimental results evaluating the spread of data and uncertainty due to the above problems appear in [159], where the most critical frequency intervals are 2 kHz to 10 kHz and 20 MHz to 30 MHz, the latter well beyond the scope of this discussion. Performance, of course, are highly dependent on the selected coupling probes. A significant improvement comes from using high-end VNAs and sensitive probes with their operating frequency intervals extended down to a few kHz .
With the purpose of solving this problem, some measurement systems specifically developed for on-site grid impedance measurements have been also proposed. They are classified under the active methods and are slightly invasive, requiring a connection for the measurement of the port voltage and possibly for the injection of the external test signal to excite the grid. The impedance is then estimated directly in the desired frequency band as the ratio of the test port voltage and current [107,116,172,173,174,175,176].
Figure 24 shows, as an example, a specific invasive measurement system based on: a commercial signal generator to inject a test signal, current probes both for injecting the test signal and for measuring the current over two known impedances (Z1 and Z2) [161], a commercial digital oscilloscope for data acquisition and a laptop for control and processing of the measurement procedure. The grid impedance in the frequency domain can be obtained by applying Ohm’s and Kirchhoff’s laws to the current values obtained in the measurements.
Some measurement systems and assessment procedures have been proposed with the aim of characterizing the sub-cycle impedance too. They are based on the injection of ad-hoc test signals that cover a specific frequency range [161,177,178,179].

6. Discussion: Challenges, Improvements and Future Research Directions

6.1. Conducted Emissions

The main challenges related to the conducted emissions in the 9–500 kHz range that should be addressed in the near future are: (i) the detailed characterization of time variation and spectral patterns of disturbances generated by EV charging stations; (ii) the harmonization and definition of consistent measurement methods of conducted disturbances for frequencies above 9 kHz; (iii) the statement and agreement of emission limits specific for different types of electronic devices and compatibility levels for the frequency range 150 kHz–500 kHz; and (iv) the definition, testing and implementation of different mitigation techniques that avoid a severe impact on PLC devices (and therefore, in their performance to support novel and advanced Smart Grids applications) and/or degradation of electronic devices connected to the distribution grid.
Various agents are involved in studying these challenges: the standardization committees are responsible of the definition of new measurement methods for higher frequencies and the statement of Emission Limits and Compatibility Levels; the power electronics industry sector has great expertise in the design and development of mitigation techniques that avoid the generation and propagation of high-level EMI phenomena that generate different types of degradation (Power Quality, communications through the electrical grid and/or aging of connected devices); the manufacturer of measurement instruments can provide their deep knowledge in the use of different metrics and assessment methods to evaluate the disturbances in time and frequency domains; last, research centers and universities are a key partner to investigate in new methods, mitigation techniques and creative solutions for these challenges. The collaboration of all these agents is necessary to develop efficient solutions and reach agreements among the different interests in the electrical sector.
The detailed characterization of the conducted disturbances is crucial in order to develop mitigation measures to limit their impact on the LV grid. The characterization of conducted emissions requires adequate measurement instruments with characteristics adapted to the purpose of the measurements. Moreover, the trade-off between the robustness, the measurement accuracy, and the cost of the instruments should be considered by manufacturers for instruments that would be deployed massively into the grid.
Regarding the analysis of the conducted emissions generated by EV charging stations in AC grids, the standardization bodies should overcome the current situation. A harmonized and consistent measurement framework in international standards should replace the current set of inconsistent measurement methods. Moreover, new measurement methods, providing advanced metrics, should be included in the measurement framework to obtain not only results in the frequency domain, but also in the joint time-frequency domain. These advanced metrics would allow a better understanding of the disturbances and their impact on the equipment connected to the grid or in the PLCs transmissions. The entire regulation related to the conducted emissions generated by EV charging stations in the 9–500 kHz range in DC grids is still to be defined. Currently, neither the measurement methods to characterize the conducted emissions, nor the compatibility levels for these grids are defined. DC grids are expected to become increasingly abundant due to the expansion of distributed energy resources and microgrids. Therefore, robust regulation is necessary to ensure that the deployment of EVCSs in DC grids has a minimal impact.
Emissions limits for the conducted emissions generated by EV charging stations should be defined in international standards. Concerning harmonic emissions up to 2 kHz, studies have shown that high levels of distortions can easily be found under low EV penetration scenarios, indicating that the capacity of the distribution system is not the bottleneck that could limit the massive penetration of EVs, but the harmonic injection limits. The dynamics and variability of harmonic magnitudes and phase angles within short timeframes remain unknown, making it impossible to establish patterns and correlations with harmonic impedance variability under renewable and power-electronic load-dominated grid scenarios. Further studies are therefore recommended to establish margins of harmonic impedance variability to better evaluate the harmonic hosting capacity for fleets of EV charging stations and appropriately inform decision-making bodies and guidelines. Currently, there are no emissions limits specified, neither for AC nor DC EV charging stations. A reasonable proposal would be to define emission limits for this equipment linked to compatibility levels, being a percentage of them. For example, these limits might be 10 dB or 12 dB below the compatibility levels for non-intentional emissions regulated in IEC 61000-2-2 [141]. The interaction and the propagation of the conducted emissions generated by EV charging stations in the 9-500 kHz is an open topic currently. Even though some studies have been conducted analyzing these phenomena, a better understanding is needed to define advanced mitigation measures. A more detailed modeling of the interaction between disturbances should be performed, analyzing the combination of their amplitudes and the intermodulation products. It would be of great interest to relate these effects with the configurations of the electronic components inside the EV charging stations, to know which components provoke which effects. Additionally, the propagation and attenuation of conducted emissions due to cables and grid topologies should be studied in-depth. This work would allow the definition of efficient EV charging stations deployment strategies to minimize their impact on the LV grids.
In addition, advanced mitigation measures, techniques, and devices should be developed to minimize the impact of the EV charging stations in the LV grid. A potential measure is the design of adaptive active filters to attenuate conducted emissions with changing amplitudes and frequencies. These devices would allow flexible filtering of the disturbances, adapting their characteristics to the properties of the emissions. Another possible solution would be to design advanced components for EV charging stations, implementing techniques based on spreading codes. These components would spread the spectrum of the narrow band disturbances, allowing the power of the narrow band emissions to be diffused in broader frequency ranges.
Lastly, the massive deployment of EVCS carries practical implications for DSOs, manufacturers, and standardization bodies. For DSOs, more accurate monitoring of conducted emissions is essential to ensure the reliability of smart metering and grid automation, as cumulative emissions from multiple EVCS directly degrade PLC transmissions. For EVCS manufacturers, the high variability of supraharmonics during charging process and the increase of complex intermodulation products mean that standard laboratory tests are no longer sufficient. For regulatory bodies, there is an urgent need to set a standardized framework specifically for large-scale EV charging hubs. A coordinated standardized framework is essential to guarantee the electromagnetic coexistence of EVCS technologies and critical distribution grid telemetry.

6.2. Grid Impedance

The analysis of the research carried out so far expresses the need of characterizing the grid impedance, since it has been demonstrated that it changes in both time and frequency domains during the EV charging processes, and this phenomenon has a relevant influence on the propagation and the magnitude of the conducted disturbances.
Due to the actual variety of charging systems (AC, DC, fast and ultra-fast, V2G), the implementation of measurement systems adapted to different values of voltage and currents and to the wide variety of types of connections, considering the demanding requirements of robustness and accuracy, is still a challenge to be solved. These measurement systems should be able to:
  • assess the short- and long-term dynamic grid impedance, including modulation effects e.g., with the varying instantaneous phase of the fundamental;
  • cope with an exigency of a large dynamic range, that may pose a challenge for out of scale or insufficient resolution and sensitivity;
  • tolerate the presence of large voltage and current at the fundamental (including DC) and main harmonics, causing issues of electrical stress, overheating, saturation.
Another important aspect is the characterization of the effects of the connection cables used by the measurement systems on the measured impedance values, which can lead to high deviations with respect to the real value. A method for modelling and correcting these effects is proposed in [180], but this proposal is not able to achieve the maximum acceptable uncertainty of ±30% defined in IEC 61557-3 [181] for all the cases.
The methodologies for modelling the frequency-dependent grid impedance, as a function of the grid topology, types of cable, home densities, and generation or storage devices connected (number of EV charging stations, PV panels or battery storage devices) should be refined, based on extensive measurement campaigns, both for AC and DC grids.
The sources of resonance and anti-resonance effects in the grid impedance, not only some specific connected devices, but also the grid topologies that may generate these effects, should be clearly identified, in order to anticipate the effects of these phenomena in the propagation of the conducted emissions at some specific frequencies. The definition and implementation of a reference grid impedance for frequencies up to 500 kHz, with representative values of the distribution grid, is still a challenge to be solved, both for AC and DC grids, and for static and sub-cycle grid impedance. The reference grid impedance will allow the accurate calibration of the measurement systems and, consequently, it will be a valuable tool for the development of accurate laboratory and on-site measurements.

6.3. Metering, Regulatory and Standardization Challenges

In addition to technical challenges related to power quality, emissions, and grid impedance, the large-scale deployment of EV charging stations raises important metering and regulatory issues. Accurate measurement of transferred energy is essential not only for system performance assessment, but also for ensuring transparency and fairness in the interaction between utilities, EVCS operators, and final users.
The presence of distorted waveforms, high-frequency emissions, and the increasing adoption of DC charging introduce significant complexity in energy metering. Traditional metering approaches, largely developed for sinusoidal AC conditions, may not provide sufficient accuracy under these operating scenarios. As a consequence, discrepancies in measured energy can arise, affecting both efficiency evaluation and billing processes.
In this context, EVCS efficiency and associated power losses acquire a broader relevance. On one hand, they are directly related to energy efficiency targets and system optimization; on the other hand, they influence how energy is accounted for and billed across different stakeholders. This introduces a metrological and regulatory dimension, where measurement uncertainty and lack of standardized procedures may translate into inconsistencies in commercial transactions.
Recent initiatives are addressing these challenges. The OIML guide G22 [134] represents a first effort to define requirements for EVCS metrological control and performance verification, although its practical implementation remains complex due to demanding testing procedures. In parallel, IEC/CENELEC TC13 [133] is working toward harmonized standards for energy metering in EV applications, covering both AC and DC charging systems. Additional efforts, such as the Met4EVCS project, aim to develop improved measurement methodologies and reference frameworks.
A key aspect for the future development of electromobility is the harmonization of regulations across different regions. Initiatives promoted by organizations, such as WELMEC [137], aim to ensure consistency in metering practices, facilitate the commercialization of EVCS technologies, and increase user confidence in billing accuracy. However, significant work is still required to define standardized measurement methods capable of addressing the combined effects of distortion, high-frequency phenomena, and dynamic operating conditions.
Overall, metering and standardization represent a critical enabling factor for the reliable and transparent operation of EV charging infrastructure, complementing the technical solutions required to mitigate their impact on the electrical grid.
The interaction between metering accuracy, power quality phenomena, and grid dynamics highlights the need for an integrated approach, where measurement methods, converter design, and grid operation are considered jointly, rather than as separate domains. In particular, the presence of harmonics and supraharmonics [32,131,182], together with time-varying operating conditions, challenges the traditional assumptions underlying energy measurement and requires the development of metrologically sound procedures applicable to real-world EVCS operation.
From a system perspective, reliable and harmonized metering is a prerequisite for the large-scale deployment of EV charging infrastructure, as it underpins not only technical performance assessment but also user trust, market transparency, and regulatory compliance. Addressing these aspects in coordination with advances in power quality mitigation and grid modeling will be essential to ensure that the transition toward electromobility is both technically robust and commercially sustainable [33,34,183].
Recent standardization efforts are beginning to address these issues, with initial frameworks for EVCS metrological control and performance verification being proposed [133,134,136]. However, significant gaps remain in the definition of measurement procedures capable of accounting for distorted and high-frequency operating conditions, particularly for DC and high-power charging systems. Further harmonization of standards and validation of measurement techniques under realistic operating scenarios will therefore be essential to support the reliable integration of EVCSs into future power systems.
These technical, metrological, and regulatory challenges define a critical research frontier for the reliable and scalable integration of EV charging infrastructure into modern power systems.

7. Conclusions

The large-scale deployment of EVCSs, particularly in dense urban environments and in conjunction with ultra-fast DC charging technologies and Vehicle-to-Grid (V2G) operation, is introducing a new class of challenges for low-voltage distribution networks. These challenges extend beyond traditional load growth considerations and are strongly driven by the widespread adoption of power-electronic interfaces.
From a technical perspective, the main key impacts can be grouped into four key domains: (i) increased power demand and potential overloading of network assets, (ii) voltage profile degradation and grid unbalance, (iii) power quality deterioration due to harmonic and supraharmonic emissions, and (iv) dynamic interactions between converters and the grid, including stability issues and impedance variations. These aspects are strongly interrelated and cannot be addressed independently.
In particular, the analysis presented in this paper highlights that the integration of EVCSs fundamentally changes the nature of the load seen by the grid, shifting from passive and predictable consumption to actively controlled, highly dynamic, and frequency-dependent behavior. As a consequence, classical assumptions used in network planning, power quality assessment, and energy metering are no longer fully valid and require revision.
In addition to the high-level synthesis provided above, the analysis carried out in this work highlights a set of practical and technology-driven observations that are particularly relevant for the operation of real-world EVCS installations. These observations point at different types of research gaps that should be further investigated:
  • Grid loading and congestion: simultaneous operation of multiple chargers, especially under fast-charging conditions, can lead to transformer and cable overloading during peak periods, requiring coordinated and adaptive load management strategies.
  • Voltage profile and unbalance: high penetration of single-phase chargers may cause significant voltage deviations and phase unbalance, with impacts that depend on network topology and load distribution.
  • Power quality and high-frequency phenomena: EVCSs introduce harmonic and supraharmonic emissions over a wide frequency range (up to hundreds of kHz), which can increase network losses and interfere with other systems, such as power line communication (PLC).
  • Dynamic grid interaction and stability: the converter-based nature of EVCSs leads to time-varying and frequency-dependent behavior, including impedance variations and potential stability issues, especially in weak grids or under high penetration levels.
  • Grid impedance and resonance effects: the interaction between EVCSs and network impedance can generate resonance phenomena that amplify disturbances and modify the propagation of both emissions and communication signals.
  • Standardization and measurement challenges: the lack of harmonized measurement methods and emission limits, particularly in the supraharmonic range and for DC charging systems, remains a key barrier for consistent performance assessment and large-scale deployment.
These observations complement the structured overview provided in Table 3, which summarizes the main technical challenges identified in this work, their grid impacts, and the associated research needs and ways forward.
Looking forward, the integration of ultra-fast and high-power EVCSs into modern power grids calls for future research on the following mitigation options:
  • coordinated and adaptive control strategies for large fleets of chargers;
  • improved characterization and mitigation of high-frequency emissions;
  • accurate modeling and measurement of dynamic grid impedance;
  • development of standardized and robust metering procedures for distorted and DC conditions;
  • integration of data-driven and AI-based approaches for real-time monitoring and control.
Ultimately, the transition toward electromobility will not only increase the electrical load of distribution systems, but will also transform their operational paradigm. Ensuring that this transition is technically robust, economically fair, and interoperable across regions will depend on the ability to address the combined technical, metrological, and regulatory challenges identified in this work.

Author Contributions

Conceptualization, A.M., Y.S. and D.D.l.V.; investigation, A.M., A.G., Y.S., S.B., B.G.S., I.F., D.D.l.V. and G.B.; data curation, A.M.; writing—original draft preparation, A.M., A.G., Y.S., S.B., I.F. and G.B.; writing—review and editing, A.M., A.G., Y.S., S.B., B.G.S., I.F., D.D.l.V. and G.B. All authors have read and agreed to the published version of the manuscript.

Funding

The project 23IND06 Met4EVCS has received funding from the European Partnership on Metrology, co-financed from the European Union’s Horizon Europe Research and Innovation Programme and by the Participating States. This work has also been funded by the Basque Government under the grants IT1910-26 and Ikermugikortasuna 2024 MV_2024_1_0018. UK participant in Horizon Europe Project Metrology for electric vehicle charging systems (Met4EVCS) is supported by UKRI grant number 10137975.

Institutional Review Board Statement

Not applicable.

Informed Consent Statement

Not applicable.

Data Availability Statement

The compact dataset used to generate Figure 1, Figure 2, Figure 3, Figure 4, Figure 5, Figure 6 and Figure 7 is available on Zenodo: Mariscotti, A. EV and EVCS Deployment Statistics and Grid-Impact Indicators, 2013–2023, Zenodo, 2026, doi:10.5281/zenodo.21291704. The original data sources are cited in Section 2.1.

Conflicts of Interest

The authors declare no conflict of interest.

References

  1. European Union. European Green Deal: Commission Proposes Transformation of EU Economy and Society to Meet Climate Ambitions; European Union: Luxembourg, 2021. [Google Scholar]
  2. European Union. Directive 2014/94/EU—Alternative Fuels Infrastructure. 2014. Available online: https://eur-lex.europa.eu/legal-content/EN/TXT/HTML/?uri=CELEX:32014L0094&from=EN (accessed on 19 June 2026).
  3. Al-Amin.; Shafiullah, G.; Shoeb, M.; Ferdous, S.; Anda, M. Grid Integration of EV: A review on stakeholder’s objectives, challenges, and strategic implications. e-Prime-Adv. Electr. Eng. Electron. Energy 2025, 11, 100930. [Google Scholar] [CrossRef] [Scilit]
  4. Ellingsen, L.A.W.; Singh, B.; Strømman, A.H. Life Cycle Assessment of a Lithium-Ion Battery Vehicle Pack. J. Ind. Ecol. 2014, 18, 113–124. [Google Scholar] [CrossRef] [Scilit]
  5. IVL Swedish Environmental Research Institute. The Life Cycle Energy Consumption and Greenhouse Gas Emissions from Lithium-Ion Batteries; Technical Report; IVL: Stockholm, Sweden, 2019. [Google Scholar]
  6. Kubli, M. EV drivers’ willingness to accept smart charging: Measuring preferences of potential adopters. Transp. Res. Part D. Transp. Environ. 2022, 109, 103396. [Google Scholar] [CrossRef] [Scilit]
  7. Sierzchula, W.; Bakker, S.; Maat, K.; van Wee, B. The Influence of Financial Incentives and Other Socio-Economic Factors on Electric Vehicle Adoption. Energy Policy 2014, 68, 183–194. [Google Scholar] [CrossRef] [Scilit]
  8. Nicholas, M.; Hall, D. Lessons Learned on Early Electric Vehicle Fast-Charging Deployments; Technical Report; International Council on Clean Transportation (ICCT): Washington, DC, USA, 2018. [Google Scholar]
  9. Hampannavar, S.; Omowunmi, L.M.; Himabindu, N.; Deepa, B.; Swapna, M. Reliability modeling and assessment of a community microgrid with electric vehicle charging station as a critical load. e-Prime-Adv. Electr. Eng. Electron. Energy 2024, 8, 100610. [Google Scholar] [CrossRef] [Scilit]
  10. Axsen, J.; Kurani, K.S. Developing Sustainability-Oriented Values: Insights from Households in a Trial of Plug-in Hybrid Electric Vehicles. Transp. Res. Part A Policy Pract. 2013, 23, 70–80. [Google Scholar] [CrossRef] [Scilit]
  11. Sovacool, B.K.; Noel, L.; Axsen, J.; Kempton, W. The neglected social dimensions to a vehicle-to-grid (V2G) transition: A critical and systematic review. Environ. Res. Lett. 2018, 13, 013001. [Google Scholar] [CrossRef] [Scilit]
  12. Hardman, S.; Shiu, E.; Steinberger-Wilckens, R. A Review of Consumer Preferences of and Interactions with Electric Vehicle Charging Infrastructure. Transp. Res. Part D Transp. Environ. 2017, 62, 508–523. [Google Scholar] [CrossRef] [Scilit]
  13. Jenn, A.; Springel, K.; Gopal, A.R. Effectiveness of Electric Vehicle Incentives in the United States. Energy Policy 2018, 119, 349–356. [Google Scholar] [CrossRef] [Scilit]
  14. Bieker, G. A Global Comparison of the Life-Cycle Greenhouse Gas Emissions of Combustion Engine and Electric Passenger Cars; Technical Report; International Council on Clean Transportation (ICCT): Washington, DC, USA, 2021. [Google Scholar]
  15. IEA. IEA Global EV Outlook 2024. 2024. Available online: https://www.iea.org/reports/global-ev-outlook-2024 (accessed on 30 June 2025).
  16. Shenoy, K.L.; Venkateshkumar, M.; Chin, C.S. Evaluation of Advanced Optimization Algorithms for Integrating Hybrid PV/Wind Systems into Microgrids and Optimizing Power Flow in Grid-to-Vehicle and Vehicle-to-Grid Systems. e-Prime–Nexus Electr. Electron. Intell. Eng. 2026, 17, 201207. [Google Scholar] [CrossRef] [Scilit]
  17. Salman, A.; Salem, A.A.; Suppiah, M.S.; Ho, P.W.; Sarimuthu, C.R. A Comprehensive Review of Artificial Intelligence Techniques for Power Quality Improvement in Renewable Energy-Based Microgrids: Recent Trends, Challenges, and Future Directions. Comput. Electr. Eng. 2026, 139, 111364. [Google Scholar] [CrossRef] [Scilit]
  18. Bayati, M.; Abedi, M.; Farahmandrad, M.; Gharehpetian, G.B.; Tehrani, K. Important Technical Considerations in Design of Battery Chargers of Electric Vehicles. Energies 2021, 14, 5878. [Google Scholar] [CrossRef] [Scilit]
  19. Town, G.; Taghizadeh, S.; Deilami, S. Review of Fast Charging for Electrified Transport: Demand, Technology, Systems, and Planning. Energies 2022, 15, 1276. [Google Scholar] [CrossRef] [Scilit]
  20. Annamalai, M.C.; Amutha Prabha, N. A comprehensive review on isolated and non-isolated converter configuration and fast charging technology: For battery and plug in hybrid electric vehicle. Heliyon 2023, 9, e18808. [Google Scholar] [CrossRef] [Scilit] [PubMed]
  21. Ali, A.; Mousa, H.H.H.; Shaaban, M.F.; Azzouz, M.A.; Awad, A.S.A. A Comprehensive Review on Charging Topologies and Power Electronic Converter Solutions for Electric Vehicles. J. Mod. Power Syst. Clean Energy 2024, 12, 675–694. [Google Scholar] [CrossRef] [Scilit]
  22. Masud Rana, M.; Mahfuz Alam, S.M.; Allahma Rafi, F.; Bashu Deb, S.; Agili, B.; He, M.; Hasan Ali, M. Comprehensive Review on the Charging Technologies of Electric Vehicles (EV) and Their Impact on Power Grid. IEEE Access 2025, 13, 35124–35156. [Google Scholar] [CrossRef] [Scilit]
  23. Energy Technology Policy (ETP) Division. Global EV Outlook 2018; Technical Report; Directorate of Sustainability, Technology and Outlooks (STO) of the International Energy Agency (IEA): Paris, France, 2018. [Google Scholar]
  24. Energy Technology Policy (ETP) Division. Global EV Outlook 2019; Technical Report; Directorate of Sustainability, Technology and Outlooks (STO) of the International Energy Agency (IEA): Paris, France, 2019. [Google Scholar]
  25. Energy Technology Policy (ETP) Division. Global EV Outlook 2020; Technical Report; Directorate of Sustainability, Technology and Outlooks (STO) of the International Energy Agency (IEA): Paris, France, 2020. [Google Scholar]
  26. Energy Technology Policy (ETP) Division. Global EV Outlook 2021; Technical Report; Directorate of Sustainability, Technology and Outlooks (STO) of the International Energy Agency (IEA): Paris, France, 2021. [Google Scholar]
  27. Energy Technology Policy (ETP) Division. Global EV Outlook 2022; Technical Report; Directorate of Sustainability, Technology and Outlooks (STO) of the International Energy Agency (IEA): Paris, France, 2022. [Google Scholar]
  28. Mariscotti, A. EV and EVCS Deployment Statistics and Grid-Impact Indicators, 2013–2023. Dataset. 2026. Available online: https://zenodo.org/records/21291704 (accessed on 10 July 2026).
  29. Auer, M.; Kaffe, E.; La Fauci, R. Impact of fast charging and home charging infrastructure for electric vehicles on the power quality of the distribution grid. In Proceedings of the 25th International Conference on Electricity Distribution, Madrid, Spain, 3–6 June 2019. [Google Scholar]
  30. Kazerani, M.; Tehrani, K. Grid of Hybrid AC/DC Microgrids: A New Paradigm for Smart City of Tomorrow. In Proceedings of the 2020 IEEE 15th International Conference of System of Systems Engineering (SoSE); IEEE: Piscataway, NJ, USA, 2020; pp. 175–180. [Google Scholar] [CrossRef] [Scilit]
  31. Mariscotti, A. Impact of Harmonic Power Terms on the Energy Measurement in AC Railways. IEEE Trans. Instrum. Meas. 2020, 69, 6731–6738. [Google Scholar] [CrossRef] [Scilit]
  32. Mariscotti, A.; Mingotti, A. The Effects of Supraharmonic Distortion in MV and LV AC Grids. Sensors 2024, 24, 2465. [Google Scholar] [CrossRef] [Scilit] [PubMed]
  33. Khalid, M.R.; Alam, M.S.; Sarwar, A.; Asghar, M.J. A Comprehensive review on electric vehicles charging infrastructures and their impacts on power-quality of the utility grid. ETransportation 2019, 1, 100006. [Google Scholar] [CrossRef] [Scilit]
  34. Shareef, H.; Islam, M.M.; Mohamed, A. A review of the stage-of-the-art charging technologies, placement methodologies, and impacts of electric vehicles. Renew. Sustain. Energy Rev. 2016, 64, 403–420. [Google Scholar] [CrossRef] [Scilit]
  35. Balcells, J.; García, J. Impact of plug-in electric vehicles on the supply grid. In Proceedings of the 2010 IEEE Vehicle Power and Propulsion Conference; IEEE: Piscataway, NJ, USA, 2010; pp. 1–4. [Google Scholar] [CrossRef] [Scilit]
  36. Nguyen, V.L.; Tran-Quoc, T.; Bacha, S. Harmonic distortion mitigation for electric vehicle fast charging systems. In Proceedings of the 2013 IEEE Grenoble Conference; IEEE: Piscataway, NJ, USA, 2013; pp. 1–6. [Google Scholar] [CrossRef] [Scilit]
  37. Dharmakeerthi, C.; Mithulananthan, N.; Saha, T. Overview of the impacts of plug-in electric vehicles on the power grid. In Proceedings of the 2011 IEEE PES Innovative Smart Grid Technologies; IEEE: Piscataway, NJ, USA, 2011; pp. 1–8. [Google Scholar] [CrossRef] [Scilit]
  38. Kütt, L.; Saarijärvi, E.; Lehtonen, M.; Mõlder, H.; Niitsoo, J. A review of the harmonic and unbalance effects in electrical distribution networks due to EV charging. In Proceedings of the 2013 12th International Conference on Environment and Electrical Engineering; IEEE: Piscataway, NJ, USA, 2013; pp. 556–561. [Google Scholar] [CrossRef] [Scilit]
  39. Langella, R.; Testa, A.; Alii, E. IEEE recommended practice and requirements for harmonic control in electric power systems. In IEEE Recommended Practice; IEEE: Piscataway, NJ, USA, 2014. [Google Scholar]
  40. Gomez, J.; Morcos, M. Impact of EV battery chargers on the power quality of distribution systems. IEEE Trans. Power Deliv. 2003, 18, 975–981. [Google Scholar] [CrossRef] [Scilit]
  41. Ramsey, D.; Bouscayrol, A.; Boulon, L.; Vaudrey, A. Simulation of an electric vehicle to study the impact of cabin heating on the driving range. In Proceedings of the 2020 IEEE 91st Vehicular Technology Conference (VTC2020-Spring); IEEE: Piscataway, NJ, USA, 2020; pp. 1–5. [Google Scholar] [CrossRef] [Scilit]
  42. Senol, M.; Bayram, I.S.; Naderi, Y.; Galloway, S. Electric Vehicles Under Low Temperatures: A Review on Battery Performance, Charging Needs, and Power Grid Impacts. IEEE Access 2023, 11, 39879–39912. [Google Scholar] [CrossRef] [Scilit]
  43. Delos Reyes, J.R.M.; Parsons, R.V.; Hoemsen, R. Winter Happens: The Effect of Ambient Temperature on the Travel Range of Electric Vehicles. IEEE Trans. Veh. Technol. 2016, 65, 4016–4022. [Google Scholar] [CrossRef] [Scilit]
  44. Koncar, I.; Bayram, I.S. A Probabilistic Methodology to Quantify the Impacts of Cold Weather on Electric Vehicle Demand: A Case Study in the U.K. IEEE Access 2021, 9, 88205–88216. [Google Scholar] [CrossRef] [Scilit]
  45. Vidal, C.; Gross, O.; Gu, R.; Kollmeyer, P.; Emadi, A. xEV Li-Ion Battery Low-Temperature Effects—Review. IEEE Trans. Veh. Technol. 2019, 68, 4560–4572. [Google Scholar] [CrossRef] [Scilit]
  46. Jaguemont, J.; Boulon, L.; Dubé, Y. A comprehensive review of lithium-ion batteries used in hybrid and electric vehicles at cold temperatures. Appl. Energy 2016, 164, 99–114. [Google Scholar] [CrossRef] [Scilit]
  47. Andersson, D.; Carlsson, D. Measurement of ABB’s Prototype Fast Charging Station for Electric Vehicles. Master’s Thesis, Department of Energy and Environment, Chalmers University of Technology, Gothenburg, Sweden, 2012. [Google Scholar]
  48. Liu, R.; Dow, L.; Liu, E. A survey of PEV impacts on electric utilities. In Proceedings of the ISGT 2011; IEEE: Piscataway, NJ, USA, 2011; pp. 1–8. [Google Scholar] [CrossRef] [Scilit]
  49. Jain, A.; Bhullar, S. Operating modes of grid integrated PV-solar based electric vehicle charging system- a comprehensive review. e-Prime-Adv. Electr. Eng. Electron. Energy 2024, 8, 100519. [Google Scholar] [CrossRef] [Scilit]
  50. Papadopoulos, P.; Cipcigan, L.M.; Jenkins, N.; Grau, I. Distribution networks with Electric Vehicles. In Proceedings of the 2009 44th International Universities Power Engineering Conference (UPEC); IEEE: Piscataway, NJ, USA, 2009; pp. 1–5. [Google Scholar]
  51. Lopes, J.A.P.; Soares, F.J.; Almeida, P.M.R.; Baptista, P.C.; Silva, C.M.; Farias, T.L. Quantification of technical impacts and environmental benefits of electric vehicles integration on electricity grids. In Proceedings of the 2009 8th International Symposium on Advanced Electromechanical Motion Systems & Electric Drives Joint Symposium; IEEE: Piscataway, NJ, USA, 2009; pp. 1–6. [Google Scholar] [CrossRef] [Scilit]
  52. Shadnam Zarbil, M.; Vahedi, A. Power Quality of Electric Vehicle Charging Stations and Optimal Placement in the Distribution Network. J. Oper. Autom. Power Eng. 2023, 11, 193–202. [Google Scholar] [CrossRef]
  53. Moses, P.S.; Deilami, S.; Masoum, A.S.; Masoum, M.A.S. Power quality of smart grids with Plug-in Electric Vehicles considering battery charging profile. In Proceedings of the 2010 IEEE PES Innovative Smart Grid Technologies Conference Europe (ISGT Europe); IEEE: Piscataway, NJ, USA, 2010; pp. 1–7. [Google Scholar] [CrossRef] [Scilit]
  54. Lee, S.J.; Kim, J.H.; Kim, D.U.; Go, H.S.; Kim, C.H.; Kim, E.S.; Kim, S.K. Evaluation of voltage sag and unbalance due to the system connection of electric vehicles on distribution system. J. Electr. Eng. Technol. 2014, 9, 452–460. [Google Scholar] [CrossRef] [Scilit]
  55. Leou, R.C.; Su, C.L.; Lu, C.N. Stochastic Analyses of Electric Vehicle Charging Impacts on Distribution Network. IEEE Trans. Power Syst. 2014, 29, 1055–1063. [Google Scholar] [CrossRef] [Scilit]
  56. Leemput, N.; Geth, F.; Van Roy, J.; Delnooz, A.; Büscher, J.; Driesen, J. Impact of Electric Vehicle On-Board Single-Phase Charging Strategies on a Flemish Residential Grid. IEEE Trans. Smart Grid 2014, 5, 1815–1822. [Google Scholar] [CrossRef] [Scilit]
  57. Jiang, C.; Torquato, R.; Salles, D.; Xu, W. Method to Assess the Power-Quality Impact of Plug-in Electric Vehicles. IEEE Trans. Power Deliv. 2014, 29, 958–965. [Google Scholar] [CrossRef] [Scilit]
  58. Tie, C.H.; Gan, C.K.; Ibrahim, K.A. The impact of electric vehicle charging on a residential low voltage distribution network in Malaysia. In Proceedings of the 2014 IEEE Innovative Smart Grid Technologies-Asia (ISGT ASIA); IEEE: Piscataway, NJ, USA, 2014; pp. 272–277. [Google Scholar] [CrossRef] [Scilit]
  59. Shahnia, F.; Ghosh, A.; Ledwich, G.; Zare, F. Voltage unbalance sensitivity analysis of plug-in electric vehicles in distribution networks. In Proceedings of the AUPEC 2011; IEEE: Piscataway, NJ, USA, 2011; pp. 1–6. [Google Scholar]
  60. Jiménez, A.; García, N. Unbalanced three-phase power flow studies of distribution systems with plug-in electric vehicles. In Proceedings of the 2012 North American Power Symposium (NAPS); IEEE: Piscataway, NJ, USA, 2012; pp. 1–6. [Google Scholar] [CrossRef] [Scilit]
  61. Meyer, J.; Hähle, S.; Schegner, P.; Wald, C. Impact of electrical car charging on unbalance in public low voltage grids. In Proceedings of the 11th International Conference on Electrical Power Quality and Utilisation; IEEE: Piscataway, NJ, USA, 2011; pp. 1–6. [Google Scholar] [CrossRef] [Scilit]
  62. Senol, M.; Bayram, I.S.; Campos-Gaona, D.; Sevdari, K.; Gehrke, O.; Pepper, B.; Galloway, S. Measurement-based harmonic analysis of electric vehicle smart charging. In Proceedings of the 2024 IEEE Transportation Electrification Conference & Expo; IEEE: Piscataway, NJ, USA, 2024. [Google Scholar]
  63. Caro, L.M.; Ramos, G.; Rauma, K.; Rodriguez, D.F.C.; Martinez, D.M.; Rehtanz, C. State of Charge Influence on the Harmonic Distortion From Electric Vehicle Charging. IEEE Trans. Ind. Appl. 2021, 57, 2077–2088. [Google Scholar] [CrossRef] [Scilit]
  64. EN 61000-3-2; Electromagnetic Compatibility (EMC). Part 3-2: Limits—Limits for Harmonic Current Emissions (Equipment Input Current ≤ 16 A per Phase). CENELEC: Brussels, Belgium, 2019.
  65. EN 61000-3-12; Electromagnetic Compatibility (EMC). Part 3-12: Part 3-12: Limits—Limits for Harmonic Currents Produced by Equipment Connected to Public Low-Voltage Systems with Input Current > 16 A and ≤75 A per Phase. CENELEC: Brussels, Belgium, 2019.
  66. Srivastava, A.; Saravanan, S. Harmonic mitigation using optimal active power filter for the improvement of power quality for a electric vehicle changing station. e-Prime-Adv. Electr. Eng. Electron. Energy 2024, 8, 100527. [Google Scholar] [CrossRef] [Scilit]
  67. Melo, N.; Mira, F.; de Almeida, A.; Delgado, J. Integration of PEV in Portuguese distribution grid: Analysis of harmonic current emissions in charging points. In Proceedings of the 11th International Conference on Electrical Power Quality and Utilisation; IEEE: Piscataway, NJ, USA, 2011. [Google Scholar] [CrossRef] [Scilit]
  68. Lucas, A.; Bonavitacola, F.; Kotsakis, E.; Fulli, G. Grid harmonic impact of multiple electric vehicle fast charging. Electr. Power Syst. Res. 2015, 127, 13–21. [Google Scholar] [CrossRef] [Scilit]
  69. Lucas, A.; Trentadue, G.; Scholz, H.; Otura, M. Power quality performance of fast-charging under extreme temperature conditions. Energies 2018, 11, 2635. [Google Scholar] [CrossRef] [Scilit]
  70. Idaho National Laboratory. DC Fast Charger Fact Sheet: ABB Terra 53 CJ charging a 2015 Nissan Leaf; Idaho National Laboratory: Idaho Falls, ID, USA, 2016. [Google Scholar]
  71. Karady, G.G.; Berisha, S.H.; Blake, T.; Hobbs, R. Power Quality Problems at Electric Vehicle’s Charging Station. SAE Trans. 1994, 103, 252–258. [Google Scholar]
  72. Hernandez, J.; Medina, A.; Jurado, F. Power quality assessment of current electrical vehicle charging processes. In Proceedings of the 2016 IEEE PES Asia-Pacific Power and Energy Engineering Conference (APPEEC); IEEE: Piscataway, NJ, USA, 2016; pp. 1523–1527. [Google Scholar] [CrossRef] [Scilit]
  73. Collin, A.J.; Xu, X.; Djokic, S.Z.; Möller, F.; Meyer, J.; Kutt, L.; Lehtonen, M. Survey of harmonic emission of electrical vehicle chargers in the European market. In Proceedings of the 2016 International Symposium on Power Electronics, Electrical Drives, Automation and Motion (SPEEDAM); IEEE: Piscataway, NJ, USA, 2016; pp. 1208–1213. [Google Scholar] [CrossRef] [Scilit]
  74. Kattmann, C.; Rudion, K.; Tenbohlen, S. Detailed power quality measurement of electric vehicle charging infrastructure. CIRED 2017, 2017, 581–584. [Google Scholar] [CrossRef] [Scilit]
  75. Miraftabzadeh, S.M.; Pejovski, D.; Longo, M.; Brenna, M.; Pasetti, M. Impact of Electric Vehicle Charging on Voltage and Current Harmonics at the Point of Common Coupling. In Proceedings of the 2023 IEEE International Conference on Environment and Electrical Engineering and 2023 IEEE Industrial and Commercial Power Systems Europe (EEEIC/I&CPS Europe); IEEE: Piscataway, NJ, USA, 2023; pp. 1–6. [Google Scholar] [CrossRef] [Scilit]
  76. Mazurek, P.; Chudy, A. An Analysis of Electromagnetic Disturbances from an Electric Vehicle Charging Station. Energies 2021, 15, 244. [Google Scholar] [CrossRef] [Scilit]
  77. Senol, M.; Bayram, I.S.; Hunter, L.; Sevdari, K.; McGarry, C.; Gaona, D.C.; Gehrke, O.; Galloway, S. Harmonics Measurement, Analysis, and Impact Assessment of Electric Vehicle Smart Charging. IEEE Open J. Veh. Technol. 2025, 6, 109–127. [Google Scholar] [CrossRef] [Scilit]
  78. Ziyat, I.; Gola, A.; Palmer, P.R.; Makonin, S.; Popowich, F. EV Charging Profiles and Waveforms Dataset (EV-CPW) and Associated Power Quality Analysis. IEEE Access 2023, 11, 138445–138456. [Google Scholar] [CrossRef] [Scilit]
  79. Slangen, T.M.H.; van Wijk, T.; Cuk, V.; Cobben, J.F.G. The Harmonic and Supraharmonic Emission of Battery Electric Vehicles in The Netherlands. In Proceedings of the 2020 International Conference on Smart Energy Systems and Technologies (SEST); IEEE: Piscataway, NJ, USA, 2020; pp. 1–6. [Google Scholar] [CrossRef] [Scilit]
  80. Cavanagh, K.; Vorobev, P.; Turitsyn, K. Stability of DC Networks with Generic Load Models. arXiv 2018. [Google Scholar] [CrossRef] [Scilit]
  81. NERC. Potential Bulk Power System Impact of Electric Vehicle Chargers; NERC: Washington, DC, USA, 2024. [Google Scholar]
  82. Wang, L.; Qin, Z.; Slangen, T.; Bauer, P.; van Wijk, T. Grid Impact of Electric Vehicle Fast Charging Stations: Trends, Standards, Issues and Mitigation Measures—An Overview. IEEE Open J. Power Electron. 2021, 2, 56–74. [Google Scholar] [CrossRef] [Scilit]
  83. Liao, Y.; Liu, Z.; Zhang, G.; Xiang, C. Vehicle-Grid System Modeling and Stability Analysis With Forbidden Region-Based Criterion. IEEE Trans. Power Electron. 2017, 32, 3499–3512. [Google Scholar] [CrossRef] [Scilit]
  84. Mayo-Maldonado, J.; Ruiz-Martinez, O.; Escobar, G.; Maupong, T.; Valdez-Resendiz, J.; Rosas-Caro, J. Power shaping control of DC–DC converters with constant power loads. Control Eng. Pract. 2020, 105, 104639. [Google Scholar] [CrossRef] [Scilit]
  85. Guerreiro, J.F.; Busarello, T.D.C.; Guillardi, H.; Maronni, I.A.; Filho, J.D.A.O.; Paredes, H.K.M.; Pomilio, J.A. Self-Stabilization of Grid-Connected Inverters by Means of an Impedance-Based Adaptive Controller. IEEE Open J. Ind. Appl. 2025, 6, 366–381. [Google Scholar] [CrossRef] [Scilit]
  86. Fu, Q.; Du, W.; Wang, H. Planning of the DC System Considering Restrictions on the Small-Signal Stability of EV Charging Stations and Comparison Between Series and Parallel Connections. IEEE Trans. Veh. Technol. 2020, 69, 10724–10735. [Google Scholar] [CrossRef] [Scilit]
  87. Bhagat, S.; Mariscotti, A.; Simonazzi, M.; Sandrolini, L. Variability of Conducted Emissions of EV Chargers due to Mutual Effects on a DC Grid. In 2023 International Symposium on Electromagnetic Compatibility–EMC Europe; IEEE: Piscataway, NJ, USA, 2023. [Google Scholar] [CrossRef] [Scilit]
  88. Liserre, M.; Blaabjerg, F.; Hansen, S. Design and Control of an LCL-Filter-Based Three-Phase Active Rectifier. IEEE Trans. Ind. Appl. 2005, 41, 1281–1291. [Google Scholar] [CrossRef] [Scilit]
  89. IEEE Std 519; Standard for Harmonic Control in Electric Power Systems Systems. IEEE: Piscataway, NJ, USA, 1992.
  90. Bhagat, S.; Mariscotti, A.; Simonazzi, M.; Sandrolini, L. Constraint-Aware Optimization of LCL Filters for Grid-Connected EV Charging Systems. Electronics 2026, 15, 857. [Google Scholar] [CrossRef] [Scilit]
  91. Souri, N.; Mehrizi-Sani, A.; Tehrani, K. Stability Enhancement of LCL-Type Grid-Following Inverters Using Capacitor Voltage Active Damping. In Proceedings of the 2024 IEEE Power & Energy Society General Meeting (PESGM); IEEE: Piscataway, NJ, USA, 2024; pp. 1–5. [Google Scholar] [CrossRef] [Scilit]
  92. Mariscotti, A. Harmonic and Supraharmonic Emissions of Plug-In Electric Vehicle Chargers. Smart Cities 2022, 5, 496–521. [Google Scholar] [CrossRef] [Scilit]
  93. Stiegler, R.; Meyer, J.; Höckel, M.; Schori, S.; Scheida, K.; Hanžlík, T.; Drápela, J. Survey of network impedance in the frequency range 2–9 kHz in public low voltage networks in AT/CH/CZ/GE. In Proceedings of the 25th International Conference on Electricity Distribution (CIRED), Madrid, Spain, 3–6 June 2019. [Google Scholar] [CrossRef] [PubMed]
  94. Yigit, M.; Gungor, V.C.; Tuna, G.; Rangoussi, M.; Fadel, E. Power line communication technologies for smart grid applications: A review of advances and challenges. Comput. Netw. 2014, 70, 366–383. [Google Scholar] [CrossRef] [Scilit]
  95. Bollen, M.H.J.; Das, R.; Djokic, S.; Ciufo, P.; Meyer, J.; Ronnberg, S.K.; Zavodam, F. Power Quality Concerns in Implementing Smart Distribution-Grid Applications. IEEE Trans. Smart Grid 2017, 8, 391–399. [Google Scholar] [CrossRef] [Scilit]
  96. Shrestha, D.; Mestre, X.; Payaró, M. On channel estimation for power line communication systems in the presence of impulsive noise. Comput. Electr. Eng. 2018, 72, 406–419. [Google Scholar] [CrossRef] [Scilit]
  97. Wasowski, M.; Habrych, M.; Sikorski, T.; Kostyla, P.; Jurczyk, M.; Gornicki, L.; Sokol, J.; Golemo, M. Sources of Non-Intentional Supraharmonics in LV Network and Its Impact on OSGP PLC Communication–Experimental Study. IEEE Trans. Power Deliv. 2022, 37, 5244–5254. [Google Scholar] [CrossRef] [Scilit]
  98. Hedayati, M.H.; John, V. Filter Configuration and PWM Method For Single-Phase Inverters With Reduced Conducted EMI Noise. IEEE Trans. Ind. Appl. 2015, 51, 3236–3243. [Google Scholar] [CrossRef] [Scilit]
  99. Gil-de Castro, A.; Rönnberg, S.K.; Bollen, M.H.J. Harmonic interaction between an electric vehicle and different domestic equipment. In Proceedings of the 2014 International Symposium on Electromagnetic Compatibility; IEEE: Piscataway, NJ, USA, 2014; pp. 991–996. [Google Scholar] [CrossRef] [Scilit]
  100. González-Ramos, J.; Gallarreta, A.; Fernández, I.; Angulo, I.; de la Vega, D.; Arrinda, A. Comparison of conducted emissions due to electric vehicle charging processes under isolated and on-line conditions in the 9–500 kHz frequency range. Sustain. Energy Grids Netw. 2024, 38, 101333. [Google Scholar] [CrossRef] [Scilit]
  101. Slangen, T.; van Wijk, T.; Ćuk, V.; Cobben, S. The Propagation and Interaction of Supraharmonics from Electric Vehicle Chargers in a Low-Voltage Grid. Energies 2020, 13, 3865. [Google Scholar] [CrossRef] [Scilit]
  102. González-Ramos, J.; Gallarreta, A.; Fernández, I.; Angulo, I.; de la Vega, D.; Arrinda, A. Emissions generated by electric vehicles in the 9–500 kHz band: Characterization, propagation, and interaction. Electr. Power Syst. Res. 2024, 231, 110289. [Google Scholar] [CrossRef] [Scilit]
  103. Grasel, B.; Baptista, J.; Tragner, M. Supraharmonic and Harmonic Emissions of a Bi-Directional V2G Electric Vehicle Charging Station and Their Impact to the Grid Impedance. Energies 2022, 15, 2920. [Google Scholar] [CrossRef] [Scilit]
  104. Meyer, J.; Mueller, S.; Ungethuem, S.; Xiao, X.; Collin, A.; Djokic, S. Harmonic and supraharmonic emission of on-board electric vehicle chargers. In Proceedings of the 2016 IEEE PES Transmission & Distribution Conference and Exposition-Latin America (PES T&D-LA); IEEE: Piscataway, NJ, USA, 2016; pp. 1–7. [Google Scholar] [CrossRef] [Scilit]
  105. Schottke, S.; Meyer, J.; Schegner, P.; Bachmann, S. Emission in the frequency range of 2 kHz to 150 kHz caused by electrical vehicle charging. In Proceedings of the 2014 International Symposium on Electromagnetic Compatibility; IEEE: Piscataway, NJ, USA, 2014. [Google Scholar] [CrossRef] [Scilit]
  106. Mariscotti, A.; Sandrolini, L.; Pasini, G. Variability caused by Setup and Operating Conditions for Conducted EMI of Switched Mode Power Supplies over the 2–1000 kHz Interval. IEEE Trans. Instrum. Meas. 2022, 71, 1501009. [Google Scholar] [CrossRef] [Scilit]
  107. Fernández, I.; de la Vega, D.; Roggo, D.; Stiegler, R.; Capponi, L.; Angulo, I.; Meyer, J.; Arrinda, A. Comparison of Measurement Methods of LV Grid Access Impedance in the Frequency Range Assigned to NB-PLC Technologies. Electronics 2019, 8, 1155. [Google Scholar] [CrossRef] [Scilit]
  108. Hallak, G.; Bumiller, G. Impedance measurement of electrical equipment loads on the power line network. In Proceedings of the 2017 IEEE International Symposium on Power Line Communications and its Applications (ISPLC); IEEE: Piscataway, NJ, USA, 2017. [Google Scholar] [CrossRef] [Scilit]
  109. Chakravorty, D.; Meyer, J.; Schegner, P.; Yanchenko, S.; Schocke, M. Impact of Modern Electronic Equipment on the Assessment of Network Harmonic Impedance. IEEE Trans. Smart Grid 2017, 8, 382–390. [Google Scholar] [CrossRef] [Scilit]
  110. Takmaz, E. Impedance, attenuation and noise measurements for power line communication. In Proceedings of the 2016 4th International Istanbul Smart Grid Congress and Fair (ICSG); IEEE: Piscataway, NJ, USA, 2016. [Google Scholar] [CrossRef] [Scilit]
  111. Sigle, M.; Liu, W.; Dostert, K. On the impedance of the low-voltage distribution grid at frequencies up to 500 kHz. In Proceedings of the 2012 IEEE International Symposium on Power Line Communications and Its Applications; IEEE: Piscataway, NJ, USA, 2012. [Google Scholar] [CrossRef] [Scilit]
  112. Hallak, G.; Niess, C.; Bumiller, G. Accurate Low Access Impedance Measurements With Separated Load Impedance Measurements on the Power-Line Network. IEEE Trans. Instrum. Meas. 2018, 67, 2282–2293. [Google Scholar] [CrossRef] [Scilit]
  113. Chu, G.; Li, J.; Liu, W. Narrow band power line channel characteristics for low voltage access network in China. In Proceedings of the 2013 IEEE 17th International Symposium on Power Line Communications and Its Applications; IEEE: Piscataway, NJ, USA, 2013. [Google Scholar] [CrossRef] [Scilit]
  114. Zhu, S.; Kikkert, C.J.; Ertugrul, N. Software for control and calibration of an inductive shunt on-line impedance analyzer. In Proceedings of the 2015 IEEE International Symposium on Power Line Communications and Its Applications (ISPLC); IEEE: Piscataway, NJ, USA, 2015. [Google Scholar] [CrossRef] [Scilit]
  115. Kikkert, C.J.; Zhu, S. Resistive Shunt On-line Impedance Analyzer. In Proceedings of the 2016 International Symposium on Power Line Communications and Its Applications (ISPLC); IEEE: Piscataway, NJ, USA, 2016. [Google Scholar] [CrossRef] [Scilit]
  116. Erhan, V.; Slangen, T.M.H.; Cuk, V.; Cobben, J.; Van Wijk, T. Measurement and Analysis of the Low Voltage Network Impedance in the Supraharmonic Range. In Proceedings of the 2022 20th International Conference on Harmonics & Quality of Power (ICHQP); IEEE: Piscataway, NJ, USA, 2022. [Google Scholar] [CrossRef] [Scilit]
  117. González-Ramos, J.; Angulo, I.; Fernández, I.; Gallarreta, A.; Arrinda, A.; de la Vega, D. Influence of Electric Vehicle Charging on the Grid Access Impedance from 20 kHz to 500 kHz. In Proceedings of the 2023 International Conference on Smart Energy Systems and Technologies (SEST); IEEE: Piscataway, NJ, USA, 2023. [Google Scholar] [CrossRef] [Scilit]
  118. Khokhlov, V.; Lodetti, S.; Fernández, I.; Stiegler, R.; Davis, P.; González-Ramos, J.; Meyer, J.; Wright, P.; Gallarreta, A.; De La Vega, D. Impedance characteristics at socket outlets in residential and commercial buildings in the frequency range 2–150 kHz. In Proceedings of the 27th International Conference on Electricity Distribution (CIRED 2023); Institution of Engineering and Technology: London, UK, 2023. [Google Scholar] [CrossRef] [Scilit]
  119. IEC 61000-4-7; Electromagnetic Compatibility (EMC)—Part 4-7: Testing and Measurement Techniques—General Guide on Harmonics and Interharmonics Measurements and Instrumentation, for Power Supply Systems and Equipment Connected Thereto. IEC: Geneva, Switzerland, 2008.
  120. CISPR 16-1-2; Specification for Radio Disturbance and Immunity Measuring Apparatus and Methods—Part 1-2: Radio Disturbance and Immunity Measuring Apparatus—Coupling Devices for Conducted Disturbance Measurements. IEC: Geneva, Switzerland, 2017.
  121. Khokhlov, V.; Meyer, J.; Schegner, P.; Agudelo-Martínez, D.; Pavas, A. Immunity Assessment of Household Appliances in the Frequency Range from 2 to 150 kHz. In Proceedings of the 25th International Conference on Electricity Distribution (CIRED), Madrid, Spain, 3–6 June 2019. [Google Scholar] [CrossRef] [PubMed]
  122. Roggo, D.; Braun, J.; Meyer, J.; de la Vega, D.; Evequoz, B.; Blaser, C.; Stiegler, R.; Fernandez, I. Pre-normalisation of grid impedance measurement in the power line communication frequency band. In Proceedings of the 26th International Conference and Exhibition on Electricity Distribution (CIRED); Institution of Engineering and Technology: London, UK, 2021. [Google Scholar] [CrossRef] [Scilit]
  123. Espín-Delgado, A.; Rönnberg, S.; Sudha Letha, S.; Bollen, M. Diagnosis of supraharmonics-related problems based on the effects on electrical equipment. Electr. Power Syst. Res. 2021, 195, 107179. [Google Scholar] [CrossRef] [Scilit]
  124. Korner, P.M.; Stiegler, R.; Meyer, J.; Wohlfahrt, T.; Waniek, C.; Myrzik, J.M. Acoustic noise of massmarket equipment caused by supraharmonics in the frequency range 2 to 20 kHz. In Proceedings of the 2018 18th International Conference on Harmonics and Quality of Power (ICHQP); IEEE: Piscataway, NJ, USA, 2018. [Google Scholar] [CrossRef] [Scilit]
  125. Sakar, S.; Ronnberg, S.; Bollen, M. Interferences in AC–DC LED Drivers Exposed to Voltage Disturbances in the Frequency Range 2–150 kHz. IEEE Trans. Power Electron. 2019, 34, 11171–11181. [Google Scholar] [CrossRef] [Scilit]
  126. Wohlfahrt, T.; Waniek, C.; Myrzik, J.M.; Meyer, J.; Schegner, P. Supraharmonic disturbances: Lifetime reduction of electronic mass-market equipment by the aging of electrolytic capacitors. In Proceedings of the 2018 18th International Conference on Harmonics and Quality of Power (ICHQP); IEEE: Piscataway, NJ, USA, 2018. [Google Scholar] [CrossRef] [Scilit]
  127. Antoniali, M.; Versolatto, F.; Tonello, A.M. An Experimental Characterization of the PLC Noise at the Source. IEEE Trans. Power Deliv. 2016, 31, 1068–1075. [Google Scholar] [CrossRef] [Scilit]
  128. Elfeki, I.; Jacques, S.; Aouichak, I.; Doligez, T.; Raingeaud, Y.; Le Bunetel, J.C. Characterization of Narrowband Noise and Channel Capacity for Powerline Communication in France. Energies 2018, 11, 3022. [Google Scholar] [CrossRef] [Scilit]
  129. Liong, A.A.; Juwono, F.H.; Gopal, L.; Chiong, C.W.; Rong, Y. Multiple blanking preprocessors for impulsive noise mitigation in OFDM-based power-line communication systems. Int. J. Electr. Power Energy Syst. 2021, 130, 106911. [Google Scholar] [CrossRef] [Scilit]
  130. Leferink, F.; Keyer, C.; Melentjev, A. Static energy meter errors caused by conducted electromagnetic interference. IEEE Electromagn. Compat. Mag. 2016, 5, 49–55. [Google Scholar] [CrossRef] [Scilit]
  131. Shklyarskiy, Y.; Hanzelka, Z.; Skamyin, A. Experimental Study of Harmonic Influence on Electrical Energy Metering. Energies 2020, 13, 5536. [Google Scholar] [CrossRef] [Scilit]
  132. van den Brom, H.E.; van Leeuwen, R.; Marais, Z.; ten Have, B.; Hartman, T.; Azpurua, M.; Pous, M.; Kok, G.; van Veghel, M.; Kolevatov, I.; et al. EMC Testing of Electricity Meters Using Real-World and Artificial Current Waveforms. IEEE Trans. Electromagn. Compat. 2021, 63, 1865–1874. [Google Scholar] [CrossRef] [Scilit]
  133. IEC. TC 13 Electrical Energy Measurement and Control. 2024. Available online: https://www.iec.ch/dyn/www/f?p=103:7:0::::FSP_ORG_ID,FSP_LANG_ID:1258,25 (accessed on 19 June 2026).
  134. International Organization of Legal Metrology. Guide G22: Electric Vehicle Supply Equipment (EVSE). 2022. Available online: https://www.oiml.org/en/files/pdf_g/g022-e22.pdf/view (accessed on 19 June 2026).
  135. Delle Femine, A.; Iodice, C.; Kučera, J.; Dierikx, E.; Mariscotti, A.; Torres, I.H.; de Aguilar, J.D.; Van Wijk, T. Metrology for Electric Vehicle Charging Systems: An Overview of the European Research Project. In Proceedings of the IEEE International Workshop on Metrology for Automotive (MetroAutomotive); IEEE: Piscataway, NJ, USA, 2024; pp. 118–123. [Google Scholar] [CrossRef] [Scilit]
  136. 23IND06 Met4EVCS: Metrology for Electric Vehicle Charging Systems. 2024. Available online: https://www.vsl.nl/en/met4evcs/ (accessed on 19 June 2026).
  137. WELMEC. Working Group 11: Gas and Electricity Meters. 2024. Available online: https://www.welmec.org/working-groups/working-group-11 (accessed on 19 June 2026).
  138. CISPR 14-1; Electromagnetic Compatibility (EMC)—Requirements for Household Appliances, Electric Tools and Similar apparatus—Part 1: Emission. IEC: Geneva, Switzerland, 2020.
  139. CISPR 15; Electromagnetic Compatibility (EMC)—Limits and Methods of Measurement of Radio Disturbance Characteristics of Electrical Lighting and Similar Equipment. IEC: Geneva, Switzerland, 2018.
  140. CISPR 32:2015+AMD1:2019; Electromagnetic Compatibility of Multimedia Equipment-Emission Requirements. IEC: Geneva, Switzerland, 2019.
  141. IEC 61000-2-2; Electromagnetic Compatibility (EMC)-Environment-Compatibility Levels for Low-Frequency Conducted Disturbances and Signalling in Public Low-Voltage Power Supply Systems. IEC: Geneva, Switzerland, 2018.
  142. IEC 61000-4-19; Electromagnetic Compatibility (EMC)—Part 4-19: Testing and Measurement Techniques—Test for Immunity to Conducted, Differential Mode Disturbances and Signalling in the Frequency Range 2 kHz to 150 kHz at a.c. Power Ports. IEC: Geneva, Switzerland, 2014.
  143. Meyer, J.; Khokhlov, V.; Klatt, M.; Blum, J.; Waniek, C.; Wohlfahrt, T.; Myrzik, J. Overview and Classification of Interferences in the Frequency Range 2–150 kHz (Supraharmonics). In Proceedings of the 2018 International Symposium on Power Electronics, Electrical Drives, Automation and Motion (SPEEDAM); IEEE: Piscataway, NJ, USA, 2018. [Google Scholar] [CrossRef] [Scilit]
  144. IEC 61000-4-30; Electromagnetic Compatibility (EMC)—Part 4-30: Testing and Measurement Techniques—Power Quality Measurement Methods. IEC: Geneva, Switzerland, 2015.
  145. Gallarreta, A. On the Measurement of Conducted Emissions in the LV distribution grid (2–500 kHz). Ph.D. Dissertation, University of the Basque Country (UPV/EHU), Bilbao, Spain, 2024. Available online: https://addi.ehu.es/handle/10810/71635 (accessed on 19 June 2026).
  146. CISPR 16-1-1; Specification for Radio Disturbance and Immunity Measuring Apparatus and Methods—Part 1-1: Radio Disturbance and Immunity Measuring Apparatus—Measuring Apparatus. IEC: Geneva, Switzerland, 2019.
  147. Azpurua, M.A.; Pous, M.; Oliva, J.A.; Pinter, B.; Hudlicka, M.; Silva, F. Waveform Approach for Assessing Conformity of CISPR 16-1-1 Measuring Receivers. IEEE Trans. Instrum. Meas. 2018, 67, 1187–1198. [Google Scholar] [CrossRef] [Scilit]
  148. Gallarreta, A.; Fernandez, I.; Ritzmann, D.; Lodetti, S.; Khokhlov, V.; Wright, P.; Meyer, J.; de la Vega, D. A Light Measurement Method for 9–150 kHz Disturbances in Power Grids Comparable to CISPR Quasi-Peak. IEEE Trans. Instrum. Meas. 2022, 71, 9005410. [Google Scholar] [CrossRef] [Scilit]
  149. Gallarreta, A.; Fernández, I.; Ritzmann, D.; Lodetti, S.; Khokhlov, V.; de la Vega, D.; Wright, P.; Meyer, J. Statistical relationship between RMS and QP spectra of voltage measurements in the 9–150 kHz range. Electr. Power Syst. Res. 2023, 218, 109213. [Google Scholar] [CrossRef] [Scilit]
  150. Gallarreta, A.; González-Ramos, J.; Lodetti, S.; Davis, P.; Fernández, I.; de la Vega, D.; Angulo, I.; Arrinda, A. Measurement framework for the consistent and fast measurement of conducted grid emissions in the 9–500 kHz range. Comput. Electr. Eng. 2025, 124, 110314. [Google Scholar] [CrossRef] [Scilit]
  151. Gallarreta, A.; Fernández, I.; González-Ramos, J.; de la Vega, D.; Angulo, I.; Arrinda, A. Technique for the comprehensive characterization of supraharmonic disturbances (9–150 kHz) in the joint time-frequency domain. Sustain. Energy Grids Netw. 2023, 36, 101181. [Google Scholar] [CrossRef] [Scilit]
  152. Lodetti, S.; Bruna, J.; Melero, J.J.; Khokhlov, V.; Meyer, J. A Robust Wavelet-Based Hybrid Method for the Simultaneous Measurement of Harmonic and Supraharmonic Distortion. IEEE Trans. Instrum. Meas. 2020, 69, 6704–6712. [Google Scholar] [CrossRef] [Scilit]
  153. Mendes, T.M.; Duque, C.A.; Silva, L.R.; Ferreira, D.D.; Meyer, J. Supraharmonic analysis by filter bank and compressive sensing. Electr. Power Syst. Res. 2019, 169, 105–114. [Google Scholar] [CrossRef] [Scilit]
  154. Zhuang, S.; Zhao, W.; Wang, R.; Wang, Q.; Huang, S. New Measurement Algorithm for Supraharmonics Based on Multiple Measurement Vectors Model and Orthogonal Matching Pursuit. IEEE Trans. Instrum. Meas. 2019, 68, 1671–1679. [Google Scholar] [CrossRef] [Scilit]
  155. Zhuang, S.; Zhao, W.; Wang, Q.; Wang, Z.; Chen, L.; Huang, S. A High-Resolution Algorithm for Supraharmonic Analysis Based on Multiple Measurement Vectors and Bayesian Compressive Sensing. Energies 2019, 12, 2559. [Google Scholar] [CrossRef] [Scilit]
  156. Li, K.; Zhao, W.; Li, S.; Huang, S. Supraharmonics Measurement Based on Colored Noise Suppressed Matrix Pencil Method. IEEE Access 2023, 11, 94346–94357. [Google Scholar] [CrossRef] [Scilit]
  157. Gallarreta, A.; González-Ramos, J.; Fernández, I.; Angulo, I.; Lavenu, C.; Gouraud, S.; de la Vega, D.; Arrinda, A. On the definition of measurement use cases for the assessment of LV grid emissions in the supraharmonic (2–500 kHz) region. Electr. Power Syst. Res. 2025, 242, 111459. [Google Scholar] [CrossRef] [Scilit]
  158. Tarateeraseth, V.; Hu, B.; See, K.Y.; Canavero, F. Accurate Extraction of Noise Source Impedance of an SMPS Under Operating Conditions. IEEE Trans. Power Electron. 2010, 25, 111–117. [Google Scholar] [CrossRef] [Scilit]
  159. Büyük, S.; Mariscotti, A.; Štibernik, K.; Şen, O.; Wojciechowski, M. A portable VNA-based system for grid impedance measurements. In Proceedings of the International Symposium on Electromagnetic Compatibility (EMC Europe); IEEE: Piscataway, NJ, USA, 2024; pp. 464–469. [Google Scholar] [CrossRef] [Scilit]
  160. Mariscotti, A.; Mayerhofer, M. Testing non-linearity and saturation of a RF current probe. In Proceedings of the EMC Europe, Paris, France, 1–5 September 2025. [Google Scholar] [CrossRef] [Scilit]
  161. Fernández, I.; Gallarreta, A.; González-Ramos, J.; Wright, P.; de la Vega, D.; Angulo, I.; Arrinda, A. Measurement System of the Mean and Sub-Cycle LV Grid Access Impedance From 20 kHz To 10 MHz. IEEE Trans. Power Deliv. 2023, 38, 2204–2212. [Google Scholar] [CrossRef] [Scilit]
  162. Asprou, M.; Kyriakides, E.; Albu, M.M. Uncertainty Bounds of Transmission Line Parameters Estimated From Synchronized Measurements. IEEE Trans. Instrum. Meas. 2019, 68, 2808–2818. [Google Scholar] [CrossRef] [Scilit]
  163. Mingotti, A.; Peretto, L.; Tinarelli, R. A novel equivalent power network impedance approach for assessing the time reference in asynchronous measurements. In Proceedings of the IEEE International Instrumentation and Measurement Technology Conference (I2MTC); IEEE: Piscataway, NJ, USA, 2017; pp. 1–6. [Google Scholar] [CrossRef] [Scilit]
  164. Hoffmann, N.; Fuchs, F.W. Minimal Invasive Equivalent Grid Impedance Estimation in Inductive – Resistive Power Networks Using Extended Kalman Filter. IEEE Trans. Power Electron. 2014, 29, 631–641. [Google Scholar] [CrossRef] [Scilit]
  165. Kodaira, D.; Park, J.; Kim, S.; Han, S.; Han, S. Impedance Estimation with an Enhanced Particle Swarm Optimization for Low-Voltage Distribution Networks. Energies 2019, 12, 1167. [Google Scholar] [CrossRef] [Scilit]
  166. Serfontein, D.; Rens, J.; Botha, G.; Desmet, J. Continuous Event-Based Harmonic Impedance Assessment Using Online Measurements. IEEE Trans. Instrum. Meas. 2016, 65, 2214–2220. [Google Scholar] [CrossRef] [Scilit]
  167. Singh, R.S.; Ćuk, V.; Cobben, S. Measurement-Based Distribution Grid Harmonic Impedance Models and Their Uncertainties. Energies 2020, 13, 4259. [Google Scholar] [CrossRef] [Scilit]
  168. Colen, G.R.; Marques, C.A.G.; Oliveira, T.R.; de Campos, F.P.V.; Ribeiro, M.V. Measurement setup for characterizing low-voltage and outdoor electric distribution grids for PLC systems. In Proceedings of the 2013 IEEE PES Conference on Innovative Smart Grid Technologies (ISGT Latin America); IEEE: Piscataway, NJ, USA, 2013. [Google Scholar] [CrossRef] [Scilit]
  169. Sabo, O.M.S.; Pace, L.; Le Bunetel, J.C.; Descamps, A.S.; Batard, C.; Idir, N. Impedance measurement in operating conditions for PLC applications. In Proceedings of the 2018 IEEE 22nd Workshop on Signal and Power Integrity (SPI); IEEE: Piscataway, NJ, USA, 2018; pp. 1–4. [Google Scholar] [CrossRef] [Scilit]
  170. Weerasinghe, A.; Zhao, Z.; Narampanawe, N.; Yang, Z.; Svimonishvili, T.; See, K.Y. Single-Probe Inductively Coupled In-Circuit Impedance Measurement. IEEE Trans. Electromagn. Compat. 2022, 64, 2–10. [Google Scholar] [CrossRef] [Scilit]
  171. Ramírez-Chavarría, R.G.; Müller, M.I.; Mattila, R.; Quintana-Carapia, G.; Sánchez-Pérez, C. A framework for high-resolution frequency response measurement and parameter estimation in microscale impedance applications. Measurement 2019, 148, 106913. [Google Scholar] [CrossRef] [Scilit]
  172. Rhode, J.; Kelley, A.; Baran, M. Complete characterization of utilization-voltage power system impedance using wideband measurement. IEEE Trans. Ind. Appl. 1997, 33, 1472–1479. [Google Scholar] [CrossRef]
  173. Chruszczyk, L. Low-voltage grid impedance measurements in 10 kHz – 1 MHz frequency range. In Proceedings of the 2015 IEEE 3rd Workshop on Advances in Information, Electronic and Electrical Engineering (AIEEE); IEEE: Piscataway, NJ, USA, 2015; pp. 1–6. [Google Scholar] [CrossRef] [Scilit]
  174. Aderibole, A.O.; Saathoff, E.K.; Kircher, K.J.; Langham, A.W.; Norford, L.K.; Leeb, S.B. Characterizing Low-Data-Rate Power Line Communication Channels. IEEE Trans. Instrum. Meas. 2023, 72, 5500512. [Google Scholar] [CrossRef] [Scilit]
  175. Artale, G.; Caravello, G.; Cataliotti, A.; Cosentino, V.; Di Cara, D.; Fiorelli, R.; Guaiana, S.; Panzavecchia, N.; Tine, G. A Line Impedance Calculator Based on a G3 PLC Modem Platform. IEEE Trans. Instrum. Meas. 2022, 71, 5500610. [Google Scholar] [CrossRef] [Scilit]
  176. Jensen, P.T.; Davari, P. Power Converter Impedance and Emission Characterization Below 150 kHz. In Proceedings of the 2021 IEEE International Joint EMC/SI/PI and EMC Europe Symposium; IEEE: Piscataway, NJ, USA, 2021. [Google Scholar] [CrossRef] [Scilit]
  177. Hallak, G.; Bumiller, G.; Nieb, C. Accurate access impedance measurements on the power line with optimized calibration procedures. In Proceedings of the 2017 IEEE International Instrumentation and Measurement Technology Conference (I2MTC); IEEE: Piscataway, NJ, USA, 2017; pp. 1–6. [Google Scholar] [CrossRef] [Scilit]
  178. Stiegler, R.; Meyer, J.; Schegner, P.; Chakravorty, D. Measurement of network harmonic impedance in presence of electronic equipment. In Proceedings of the 2015 IEEE International Workshop on Applied Measurements for Power Systems (AMPS); IEEE: Piscataway, NJ, USA, 2015; pp. 1–6. [Google Scholar] [CrossRef] [Scilit]
  179. Elfeki, I.; Doligez, T.; Aouichak, I.; Lebunetel, J.C.; Raingeaud, Y. A new method for input installation impedance measurement. In Proceedings of the 2018 IEEE International Symposium on Power Line Communications and Its Applications (ISPLC); IEEE: Piscataway, NJ, USA, 2018; pp. 1–6. [Google Scholar] [CrossRef] [Scilit]
  180. Arrinda, A.; González-Ramos, J.; Herranz, A.; Gallarreta, A.; Fernández, I.; De La Vega, D.; Angulo, I. Modeling of power cables for measurement calibration and PLC simulation up to 20 MHz. In Proceedings of the 27th International Conference on Electricity Distribution (CIRED 2023); Institution of Engineering and Technology: London, UK, 2023. [Google Scholar] [CrossRef] [Scilit]
  181. IEC 61557-3; Electrical Safety in Low Voltage Distribution System Up to 1000 Va.c. and 1500 Vd.c.—Equipment for Testing, Measuring or Monitoring of Protective Measures—Part 3: Loop Impedance. IEC: Geneva, Switzerland, 2019.
  182. CLC/TR 50579; Electricity Metering Equipment (a.c.)—Severity Levels, Immunity Requirements and Test Methods for Conducted Disturbances in the Frequency Range 2 kHz–150 kHz. CENELEC: Brussels, Belgium, 2012.
  183. Dharmakeerthi, C.; Mithulananthan, N.; Saha, T. Impact of electric vehicle fast charging on power system voltage stability. Int. J. Electr. Power Energy Syst. 2014, 57, 241–249. [Google Scholar] [CrossRef] [Scilit]
Figure 1. Yearly electricity consumption in GWh of EVs over the period 2013–2023: (a) cars, (b) buses, (c) vans. (Note: ‘World’ means the entire world (not the rest of the world)).
Smartcities 09 00127 g001
Figure 2. Yearly electricity consumption of EVs as a fraction of the overall transportation energy consumption (named for brevity “fractional consumption”) over the period 2013–2023: (a) cars (index h c a r s , t r ), (b) all EVs (index h E V , t r ). (Note: ‘World’ means the entire world).
Smartcities 09 00127 g002
Figure 3. Yearly electricity consumption of EVs as a fraction of the global energy consumption (named for brevity “fractional consumption”) over the period 2013–2023: (a) cars (index h c a r s , g l ), (b) all EVs (index h E V , g l ).
Smartcities 09 00127 g003
Figure 4. Percentage of EV car sales over the period 2013–2023 (relative figure per year).
Smartcities 09 00127 g004
Figure 5. Availability of EVCSs measured vs. population q p and area of a country q a for 2023.
Smartcities 09 00127 g005
Figure 6. Ratio of EVs of all kinds (cars, buses, and vans) over available EVCSs k: (a) both slow and fast EVCS; (b) only slow EVCS; (c) only fast EVCS.
Smartcities 09 00127 g006
Figure 7. Distribution of the two types of EVCSs, showing z, the ratio of fast over slow EVCSs.
Smartcities 09 00127 g007
Figure 8. Harmonic impedance determined from harmonic distortion limits for selected groups: odd harmonics multiple of 3 (green dots), even harmonics (blue dots) and odd characteristic harmonics (red dots); recalculated network impedance Z ^ for even ( Z ^ e , light blue) and odd characteristic ( Z ^ o , light brown) harmonics (triangles are for the n = 10 case, squares for n = 15 ). The violet curve is the linear extrapolation with harmonic order of the reference impedance of the IEC 61000-3-11. (reproduced from [92] with permission).
Smartcities 09 00127 g008
Figure 9. Reference LV network with two branches fed from an internal point of coupling (colors match the curves in the following figures).
Smartcities 09 00127 g009
Figure 10. Impedance curves over 10 Hz to 10,000 Hz for the two-branch network with 4 EVCSs each branch: (a) basic case with no EVCS connected; (b) charger 1 switched on: overlapped curves of Z 1 through Z 4 with the basic case; (c) charger 1 switched on: overlapped curves of Z 5 through Z 8 with the basic case; (d) all chargers switched on: Z 1 through Z 4 (solid line), Z 5 through Z 8 (dashed line) [87]. The four colors are associated to the charging points as in Figure 9.
Smartcities 09 00127 g010
Figure 11. A cycle of the mains (50 Hz system) and a close-up view of ‘supraharmonic’ emissions measured in the LV distribution grid.
Smartcities 09 00127 g011
Figure 12. QP values of the amplitude of the emissions ( dB μ V ) generated by EV2 (a) and EV3 (b) with a charging current of 8 A under isolated (with LISN) and on-line conditions (without LISN) [100].
Smartcities 09 00127 g012
Figure 13. Intermodulation products generated by the simultaneous charging of three EVs [102].
Smartcities 09 00127 g013
Figure 14. Amplitude (up) and phase (down) of the impedance of some EMC filters [107].
Smartcities 09 00127 g014
Figure 15. Amplitude (a) and phase (b) of the grid impedance in an EV charging station with an EV in charging process [117].
Smartcities 09 00127 g015
Figure 16. Magnitude (up) and phase (down) of the grid impedance measured in default situations when no EV are connected (D1, D2 and D3) and when EVs are charging in different EV charging stations (EVCS1, EVCS2 and EVCS3), together with the CISPR 16-1-2 reference impedance.
Smartcities 09 00127 g016
Figure 17. Spectrogram of a recording taken in the LV distribution grid, where PLC transmissions (white ovals) and conducted emissions (indicated with black arrows) were captured.
Smartcities 09 00127 g017
Figure 18. Impact of grid impedance on the communication between two smart meters located at the end of a grid section: spectra of both PLC signals, registered in the transmitter and in the receiver, and frequency response of the grid impedance measured for that grid section [107].
Smartcities 09 00127 g018
Figure 19. Overview of the limits defined for conducted emissions [143].
Smartcities 09 00127 g019
Figure 20. Measurement system based on oscilloscopes.
Smartcities 09 00127 g020
Figure 21. Schematic overview of IEC 61000-4-7 - Annex B method [145].
Smartcities 09 00127 g021
Figure 22. Spectra provided by different assessment methods over the same input signal.
Smartcities 09 00127 g022
Figure 23. Impedance measurement system based on VNA: the arbitrary Z x quantity represents the mains grid impedance Z g subject to measurement, but also the calibration point; useful to compare the real Z g value to that normalized by the use of LISN, and the consequential difference in emissions amplitude.
Smartcities 09 00127 g023
Figure 24. Impedance measurement system based on invasive methods.
Smartcities 09 00127 g024
Table 1. EVCS harmonic emissions dependency due to charger and EV characteristics.
SourceEnvironmentChargerEVCS ModeEV ModelEV SOCResults
[70]LaboratoryDC fast chargerCC + CVNissan Leaf.0% to 80%In CC mode charger efficiency improves to 91–93% and power factor (PF) improves to 0.96–0.98. In CV mode current THD increases, whereas voltage THD remains unaffected. Relevant current harmonics are the 7th, 11th, 13th, 23rd, and 25th.
[62]LaboratorySingle-phase AC charger & Three-phase AC chargerSmart charger operating in CC modeNissan Leaf & Renault Zoe R90, Peugeot e-20830% to 70%Renault and Peugeot produced up to 31st harmonics, whereas Nissan Leaf up to 49th. Renault produces the highest harmonic magnitudes and Peugeot the lowest. Most of the individual harmonics produced by Renault Zoe exceed the IEC 61000-3-2 current limits. Harmonics with the largest magnitudes during charging are: 7th (0.7 A), 17th (0.3 A), 19th (0.3 A), 23rd, 25th, 27th, and 29th (0.1 A). As charging current decreases, current THD rises to 10% while voltage THD remains nearly constant (1.4% to 1.6%). Charging multiple EVs simultaneously reduces current THD.
[63]LaboratoryLevel 1, 2, and 3MSCCRenault Twizy74% to 100%Current THD remains high below 90% battery SOC and decreases between 90% and 100% SOC. The main current harmonics are the 3rd (0.31 A), 5th (0.15 A), 7th (0.06 A), 9th (0.02 A), and 11th (0.03 A).
CCRenault Zoe80% to 100%Current THD remains constant between 80% and 100% SOC. Dominant current harmonics are the 3rd (0.7 A), 5th (2 A), 7th (1.7 A), 9th (0.5 A), and 11th (0.7 A), with the 5th and the 7th having the largest magnitudes.
CC + CVMitsubishi i-MIEV68% to 100%Current THD increases when the charging algorithm switches from CC to CV operation mode. Dominant current harmonics are the 3rd (1.2 A), 5th (0.8 A), 7th (0.55 A), 9th (0.4 A), and 11th (0.22 A) which reduce in CV mode.
CC + CVNissan Leaf25% to 100%Current THD increases when the charging algorithm switches from CC to CV operation mode. Dominant current harmonics are the 3rd (0.17 A), 5th (0.1 A), and 7th (0.05 A), which reduce in CV mode.
CC + CVBMW i330% to 100%Current THD increases with SOC. Dominant current harmonics are the 3rd (0.25 A), 5th (0.05 A), 7th (0.12 A), 9th (0.1 A), 11th (0.07 A), 13th (0.35 A), and 15th (0.1 A), which reduce in CV mode.
[71]Urban network EV racing cars Current harmonics up to the 24th order are generated by the chargers with magnitudes ranging from 5% (0.6 A), to 75% (3rd, 9.5 A) of the fundamental, resulting in 50% THD. Current THD decreases as more chargers are used simultaneously.
[67]Urban networkMode 2 AC chargerCC + CVNissan Leaf Voltage THD remains nearly constant at 2% to 3% during charging. Current THD is about 12% in CC mode and rises to 16% in CV mode. The 3rd harmonic is dominant at 11.6% (1.9 A) of the fundamental, followed by the 5th (0.62 A), 7th (0.35 A), 9th (0.2 A), 11th (0.17 A), 13th (0.14 A), and 15th (0.12 A).
Mode 4 DC chargerMitsubishi i-MIEV Voltage THD remains nearly constant at 1% during charging. Current THD is about 12% in CC mode and increases to 24% in CV mode. The 5th harmonic is dominant, reaching 12% (2.4 A) of the fundamental.
[72]Radial networkSingle and Two stage power conversion. EV1 with Li-Ion, EV2 with lead-acid battery0% to 100%Current THD profiles for both EVs differ due to different charging strategies and battery types. Current THD rises at the start and end of charging, reaching 39% and 51% respectively. The main harmonics are the 3rd (1.35 A), 5th (1.05 A), 7th (0.76 A), 9th (0.2A), 11th (0.5 A), 13th (0.38 A) and 15th (0.15 A), and they depend on charging power levels. The 5th and 7th harmonics show the greatest phase-angle variability.
[68]LaboratorySingle-phase AC chargerCC + CVVolkswagen E-Up5% to 100%Significant current harmonics include the 3rd (6.8 A), 5th (6.7 A), 7th (4.7 A), 9th (2.7 A), 11th (10.8 A), 13th (6 A), 23rd (2 A) and 25th (2 A). The 3rd and 9th harmonics show higher phase variability. Voltage THD remains near 1.2%, while current THD increases when charging switches to CV mode.
[73]LaboratorySingle- and three-phase level 2 chargersCCanonymous EVs Current THD varied across 18 EV charging tests, ranging from 2.6% to 11.9%. The main harmonics are the 3rd (1.8 A), 5th (1.8 A) and 7th (0.6 A). Even harmonics were negligible less than 0.1% of the fundamental, whereas supply voltage variations within ±10% had no significant effect on harmonic emissions.
[69]LaboratoryThree-phase fast chargerCCNissan Leaf Voltage THD remains nearly constant at 3%. Current THD increased as temperature decreased, exceeding EN 61000-3-12 limits and reaching 24% at −15 °C and 39% at −20 °C.
[74]LaboratoryThree-phase chargers Harmonic magnitudes varied within the 2–10 kHz range, with no components detected above 50 kHz. As the fundamental current decreased to 47%, the 3rd, 5th, 7th, and 9th harmonics decreased to 52% (0.98 A), 39% (0.72 A), 85% (2.07 A), and 21.9% (0.3 A), respectively.
[75]Urban network30 chargers Renault Kangoo ZE & Zoe Voltage harmonics remain below 1.2% of the fundamental and are nearly balanced across phases. Harmonic current unbalance is observed due to single-phase EV charging, with the 3rd harmonic current increasing with charging power.
[76]Laboratory + LISNThree-phase BMW i330%The 25th, 27th, 29th, 33rd, 35th, 37th, and 39th harmonic currents exceeded limits specified in IEC 61000-3-2.
[77]LaboratoryThree-phase AC chargersSmart charging8 EVs Eight EVs were evaluated under smart charging with 1 A current steps: Renault Zoe R90, Renault Zoe ZE50, Nissan Leaf e+, Peugeot e-208, Peugeot e-2008, VW ID.3 Pro, VW ID.4 Pro, and Tesla Model Y. Current THD generally increased as charging current decreased. The Volkswagen models produced the lowest distortion (current THD < 5%), while the Peugeot e-2008 exhibited the highest (up to 25%). The remaining vehicles caused current THD levels between 5% and 14%. Voltage THD remained low for all vehicles (1.5% and 2%). The dominant current harmonics were the 3rd, 5th, and 7th. The Renault Zoe R90, Renault Zoe ZE50, Tesla Model Y, and Peugeot e-2008 exceeded IEC 61000-3-2 limits for several individual harmonics. During simultaneous charging, harmonic distortion decreased due to harmonic cancellation effects.
[78]Urban & suburban networkSingle-phase Level 2 AC chargersCC + CV12 EVs Emissions from twelve EVs were evaluated: Tesla Model Y, Tesla Model 3, Volvo XC-40, BMW iX xDrive50, Ford Mustang Mach E, Hyundai Ioniq 5, Hyundai Ioniq Electric, Kia Nero EV, Lexus NX 450h+, Nissan Leaf SV, Mitsubishi Outlander, and Toyota Prius Prime. Voltage THD remained below 2% for all EVs except for the Mitsubishi which recorded a THD of approximately 4.5%, with its 3rd harmonic voltage exceeding IEEE 519 limits. In general, current distortions increased as charging current decreased. The shape of current waveforms also varied among EVs, with the Nissan Leaf SV, Lexus NX, and Hyundai Ioniq 5 waveforms approaching a triangular shape at low charging power.
[79]LaboratorySingle-phase AC chargersCC9 anonymous EVs Odd harmonics are relevant, whereas even harmonics negligible. Four EVs produced several individual harmonic emissions that exceeded the limits recommended in IEC 61000-3-2. Total demand distortion for several EVs increases with charging current.
Table 2. Main results of the studies related to conducted emissions generated in the EV charging processes.
SourceEnvironmentEV ChargerMain Results
[105]Laboratory and public LV gridThree-phase AC charging of 20 EV modelsEmission levels at switching frequencies vary during the charging cycle and for different EV models. Highest levels are found in the 3–29 kHz range. Emission levels are below the immunity levels for electricity meters and maximum transmission levels of PLC.
[100]Public LV gridMono-phase AC charging of 4 EV models. Measured with and without LISNHigher emission levels for the setup without LISN. Tonal and narrowband emissions at specific frequencies in the 9–150 kHz range.
[101]Laboratory with controlled EV grid optionThree-phase AC charging of 2 EV modelsNarrowband emissions at 10 kHz and broader emissions for 45–49 kHz. Focus for EV chargers on minimizing intermodulation distortion appears.
[102]User controlled LV grid, separated from the distribution gridSingle-phase AC charging of 3 EV modelsEmission levels attenuated with distance, although higher levels can be found due to impedance resonances. For close EV chargers in operation, intermodulation distortion appears.
[103]Reconstruction of LV distribution grid in a laboratoryThree-phase AC charging of 1 EV model. Bi-directional V2G modeThe highest emissions are for the switching frequency of the charging station and its multiples. Highest emission levels in different frequencies due to DC-DC converters and auxiliary devices of the EV also present.
[99]LV distribution grid emulated in a laboratoryThree-phase AC chargerSupraharmonic emissions generated by the Renault Kangoo show higher magnitudes up to 15 kHz and only negligible amplitudes around 1 mA in the frequency beyond 15 kHz to 110 kHz.
[105]Laboratory and public LV distribution gridSingle-phase AC chargEmissions due to the switching frequency of one EV at 51.2 kHz and its repetition at 102.4 kHz show magnitudes of 1.1 mV and 5 mV respectively. Switching frequencies of other EVs (10 kHz, 28 kHz, 6.55 kHz, and 11 kHz) appear in the supraharmonic frequency range as narrow band or wide band emissions with current levels varying from 10 μA (minimum) to 1 A (maximum).
[104]Laboratory and public LV distribution gridSingle, two, and three-phase AC chargersHarmonics and supraharmonic emissions of 19 EV battery chargers have been measured. For sinusoidal applied voltage and zero impedance conditions, harmonic current decreases as the harmonic order increases. The 3rd harmonic current sometimes exceeds 1.5 A, whereas magnitudes of 0.5 A are common up to the 7th harmonic order. Supply voltage distortions can significantly affect harmonic emissions. Emissions in the 2 kHz to 100 kHz band are common and variable (within charging cycles) due to the switching frequencies of the chargers, with magnitudes varying from 8 mA to 1.8 A.
Table 3. Summary of key technical challenges, grid impacts, and research gaps for EVCS integration.
AspectObserved IssueGrid Impact/ImplicationResearch Gap and Way Forward
Grid Loading & CapacitySimultaneous fast charging causes transformer and cable overloadThermal stress, voltage dropsCoordinated charging, hosting-capacity assessment, transformer/feeder reinforcement criteria, and integration of local storage or MV connection for high-power hubs
Voltage UnbalanceSingle-phase chargers and uneven/asymmetric load distributionVoltage unbalance, neutral current increase, unequal phase loading, possible derating or additional stress of network assetsPhase-aware EVCS allocation, coordinated phase balancing, voltage-based charging control, and assessment under realistic LV feeder configurations
Communication & ControlLimited reliability and latency of PLC/data exchangeDelayed or degraded monitoring, metering, protection, and coordinated charging/control actionsCommunication robustness assessment, low-latency protocol design, prioritized data handling techniques and AI-assisted data management/control, integration of PLC constraints into grid monitoring and smart charging protocols
Power Quality & Power Line CommunicationsHigh-frequency emissions from convertersPQ deterioration, additional losses, equipment stress, metering errors, and PLC interferenceEmission characterization under realistic grid impedance, aggregation studies, filtering/equalization techniques, and compatibility assessment for PLC coexistence
Grid Impedance & ResonanceDynamic impedance variation during chargingResonant amplification or attenuation of conducted emissions and PLC signalsRepresentative impedance models, on-site impedance measurement methods, programmable reference impedances, and revised AMN/LISN assumptions
StandardizationLack of harmonized limits and metrics, test conditions and measurement methodsInconsistent compliance assessment and limited transferability from laboratory tests to real gridsHarmonized IEC/CISPR/IEEE frameworks including realistic grid impedance, clustered EVCS operation, PLC coexistence, and metering accuracy
System-Level StabilityConstant-power-load behaviour and interaction among parallel converter-interfaced chargers, especially in weak gridsLow-frequency oscillations, reduced damping, converter-control interactions, and possible instability after disturbancesImpedance-based stability assessment, adaptive or droop-based control, validated multi-converter models, and stability criteria for EVCS clusters
Disclaimer/Publisher’s Note: The statements, opinions and data contained in all publications are solely those of the individual author(s) and contributor(s) and not of MDPI and/or the editor(s). MDPI and/or the editor(s) disclaim responsibility for any injury to people or property resulting from any ideas, methods, instructions or products referred to in the content.