
Article

Global Distribution of Monk Parakeets (Myiopsitta monachus): How the Monk Parakeet Invasive Map Is Drawn upon Nations’ Wealth


by
Valentina López-Jara
1,
Matilde Larraechea
1,2 and
Cristóbal Briceño
1,*
1
ConserLab, Animal Preventive Medicine Department, Faculty of Animal and Veterinary Sciences, University of Chile, Santiago 8820808, Chile
2
Programa de Doctorado en Ciencias Silvoagropecuarias y Veterinarias, Campus Sur Universidad de Chile, Santiago 8820808, Chile
*
Author to whom correspondence should be addressed.
Birds 2026, 7(2), 31; https://doi.org/10.3390/birds7020031
Submission received: 11 March 2026 / Revised: 25 May 2026 / Accepted: 26 May 2026 / Published: 28 May 2026

Simple Summary

The Monk Parakeet is a highly adaptable parrot species that has been described as invasive in 26 territories globally. Its adaptability to new environments and resilience is associated with the wide variety of habitats and resources the species can colonize and use for survival. In addition, it is highly sociable and has the unique ability among parrots to build communal nests. The Monk Parakeet is considered a pest in many countries due to the economic losses it produces. Besides impacts to agriculture, it damages urban structures and produces socioeconomic costs related to control measures. Here, we assessed the changes in the global distribution of Monk Parakeets during the last century and related them to economic variables. We used Monk Parakeet’s sighting data from the eBird online platform to collect historic and recent reports on its distribution. We also used available economic information from official sources to test whether Monk Parakeet expansion was related to economic prosperity. We found an association between Monk Parakeet new reports in cities and prosperity in those countries, being the richest where Monk Parakeets are more reported. We aim to provide an update on Monk Parakeet distribution and explore potential causes of its expansion. This preliminary assessment may support informed decisions regarding Monk Parakeet control.

Abstract

The Monk Parakeet (Myiopsitta monachus) is a psittacid species native to central and eastern South America that was introduced into many countries by traders, for its popularity as caged pets. After escapes or releases, it has been successful in establishing in new territories, capable of reproducing, dispersing, and exhibiting population growth in introduction sites during recent decades. It is considered a pest due to negative impacts, especially for its damage to agriculture and urban infrastructure. Although its global distribution has been previously described, given its high adaptability and effectiveness in colonizing new environments, many of these distribution maps may be outdated. We used eBird, a free online birding database, to locate sightings of this species globally and compared it with the reported range for the species. Additionally, we overlaid compiled data on species distribution with economic data to explore if there is a correlation between the reported parakeet presence in new cities and wealth. We compiled data from 1900 to 2024 and compared reported differences in the Monk Parakeet presence. Our results indicate that Monk Parakeets have invaded at least 31 countries, being present in capital cities, cities, towns, and rural territories. The number of cities where the species was reported as invasive increased significantly since 1985, by an average of 150% by decade. We found a positive pooled association between country-level Gross Domestic Product (GDP) per capita and the number of cities with Monk Parakeet records, although this pattern should be interpreted cautiously, given potential biases from observation effort, country size, and temporal co-variation. We present new evidence on Monk Parakeet’s rapid global expansion and deliver an updated map of the Monk Parakeet global distribution, relevant for planning and implementing control measures.

1. Introduction

Invasive alien species are primarily the result of human activities. Either intentionally or accidentally, humans have been increasing the distribution of many species [1]. A fraction of these are able to establish and become abundant, producing associated impacts [1,2]. Invasive species are increasing globally and are a major direct driver of biodiversity loss, particularly on islands, where they are the leading cause [3,4,5]. Their associated economic costs are estimated to be greater than US$423 billion per year globally [6,7,8]. Invasive birds may produce large environmental impacts, through competition with other animals, predation and/or parasitism. They have also caused large socioeconomic impacts through effects upon agriculture, human infrastructure, human health and human social life [9]. Among birds, parrots are popular pets worldwide, and the large volume of trade, combined with escapes and releases, has resulted in the establishment of many alien psittacid populations globally [10].
Monk Parakeets (Myiopsitta monachus) have been recognized among the most invasive bird species worldwide, displaying a strong inclination to invade a wide range of territories and environments [11]. There is growing evidence that biological invasions have detrimental effects on public health, agriculture, biodiversity, and ecosystem health [12,13]. In many countries, such as Chile, Mexico, and numerous others, imports of Monk Parakeets have been banned by law for various reasons. Additionally, they are classified as pests in many countries [14,15]. They have been associated with agricultural losses and are considered pests, even in Argentina, where Monk Parakeets are native and cost millions of US$ per year in crop damages [16,17,18,19]. Additional impacts arise from nest construction on buildings and electric poles, where nests may become large and heavy, potentially damaging these structures. In Florida (USA), it was estimated that these nests cause more than 1000 power outages per year, with annual costs up to one million dollars a year for their removal, adding the risk to personnel conducting these interventions [20]. In Chile, over a span of almost five decades, the invasive range of Monk Parakeets has expanded significantly [21]. Initially, they were restricted to the Metropolitan Region and its immediate surroundings when they first became naturalized invaders in 1972 [16]. Today, their presence has been documented outside their original introduction range [16,21] and recorded on the eBird platform [22] in nine other regions in Chile, and in at least 15 other cities to the north and south of the Metropolitan Region.
In a long-term longitudinal study conducted by Senar et al. [23] in Spain, Monk Parakeets displayed exponential population growth since 1970, when their first nest was detected in Barcelona. The aforementioned researchers determined breeding parameters of Monk Parakeets in their invasive range. This invasive population showed a higher reproductive capacity compared to native populations, even doubling their fledging success rate (i.e., offspring able to leave the nest). Furthermore, 55% of the first-year birds bred, which contrasts with South America’s native populations, where breeding in first-years is extremely rare. There was also a threefold increase in the proportion of pairs attempting second broods. This phenomenon could be attributed to a much lower incidence of nest predation in their invasive range [23]. Additionally, the breeding season was one month longer in the European invasive range, lasting nearly seven months, from March to the end of September, as opposed to the native range, where it spans around six months, from October to March [23].
In recent studies, zoonotic pathogens and ectoparasites have been identified in Monk Parakeets, posing health threats to both humans and local fauna [24,25,26,27,28]. However, to date, these agents have been scarcely investigated regarding the role of Monk Parakeets as potential reservoirs and their potential impacts upon human health.
We ought to consider that the primary reason for the existence of naturalized parrots globally is human activity [29]. Regardless of Monk Parakeet’s negative impacts, the general public has a positive view of this species and often appreciates it [30,31]. Monk Parakeets are still regarded as pets, and in their natural habitat, people commonly seek contact with the species through practices like bird feeding [32,33]. However, in its invasive distribution, there is a growing awareness among some citizens who recognize the negative effects of these parrots and prefer to see them removed from natural ecosystems [29,31]. These significant human–wildlife interactions can often hinder the implementation of control measures for invasive species, particularly when dealing with “charismatic” wildlife like Monk Parakeets [34]. In England, for instance, control measures for Monk Parakeets have faced significant public opposition [34]. Understanding a species’ invasion dynamics is important to define control measures, mitigate negative impacts, and predict future expansion ranges [31,35,36,37,38,39].
Given that importation of exotic Monk Parakeets would have associated costs and thus would require purchasing power to some extent, we predict that the importation flow is linked to people’s income. To approach this, we used the Gross Domestic Product per capita to reveal the average economic income per person, as a proxy to prosperity and standard of living.
The present study aims to update the documented global distribution of invasive Monk Parakeets based on compiled occurrence records and reports, and to evaluate whether the number of cities with records is associated with economic prosperity. We expect that wealthier countries will have more new Monk Parakeet reports in cities, signaling their expansion.

2. Materials and Methods

2.1. Study Species

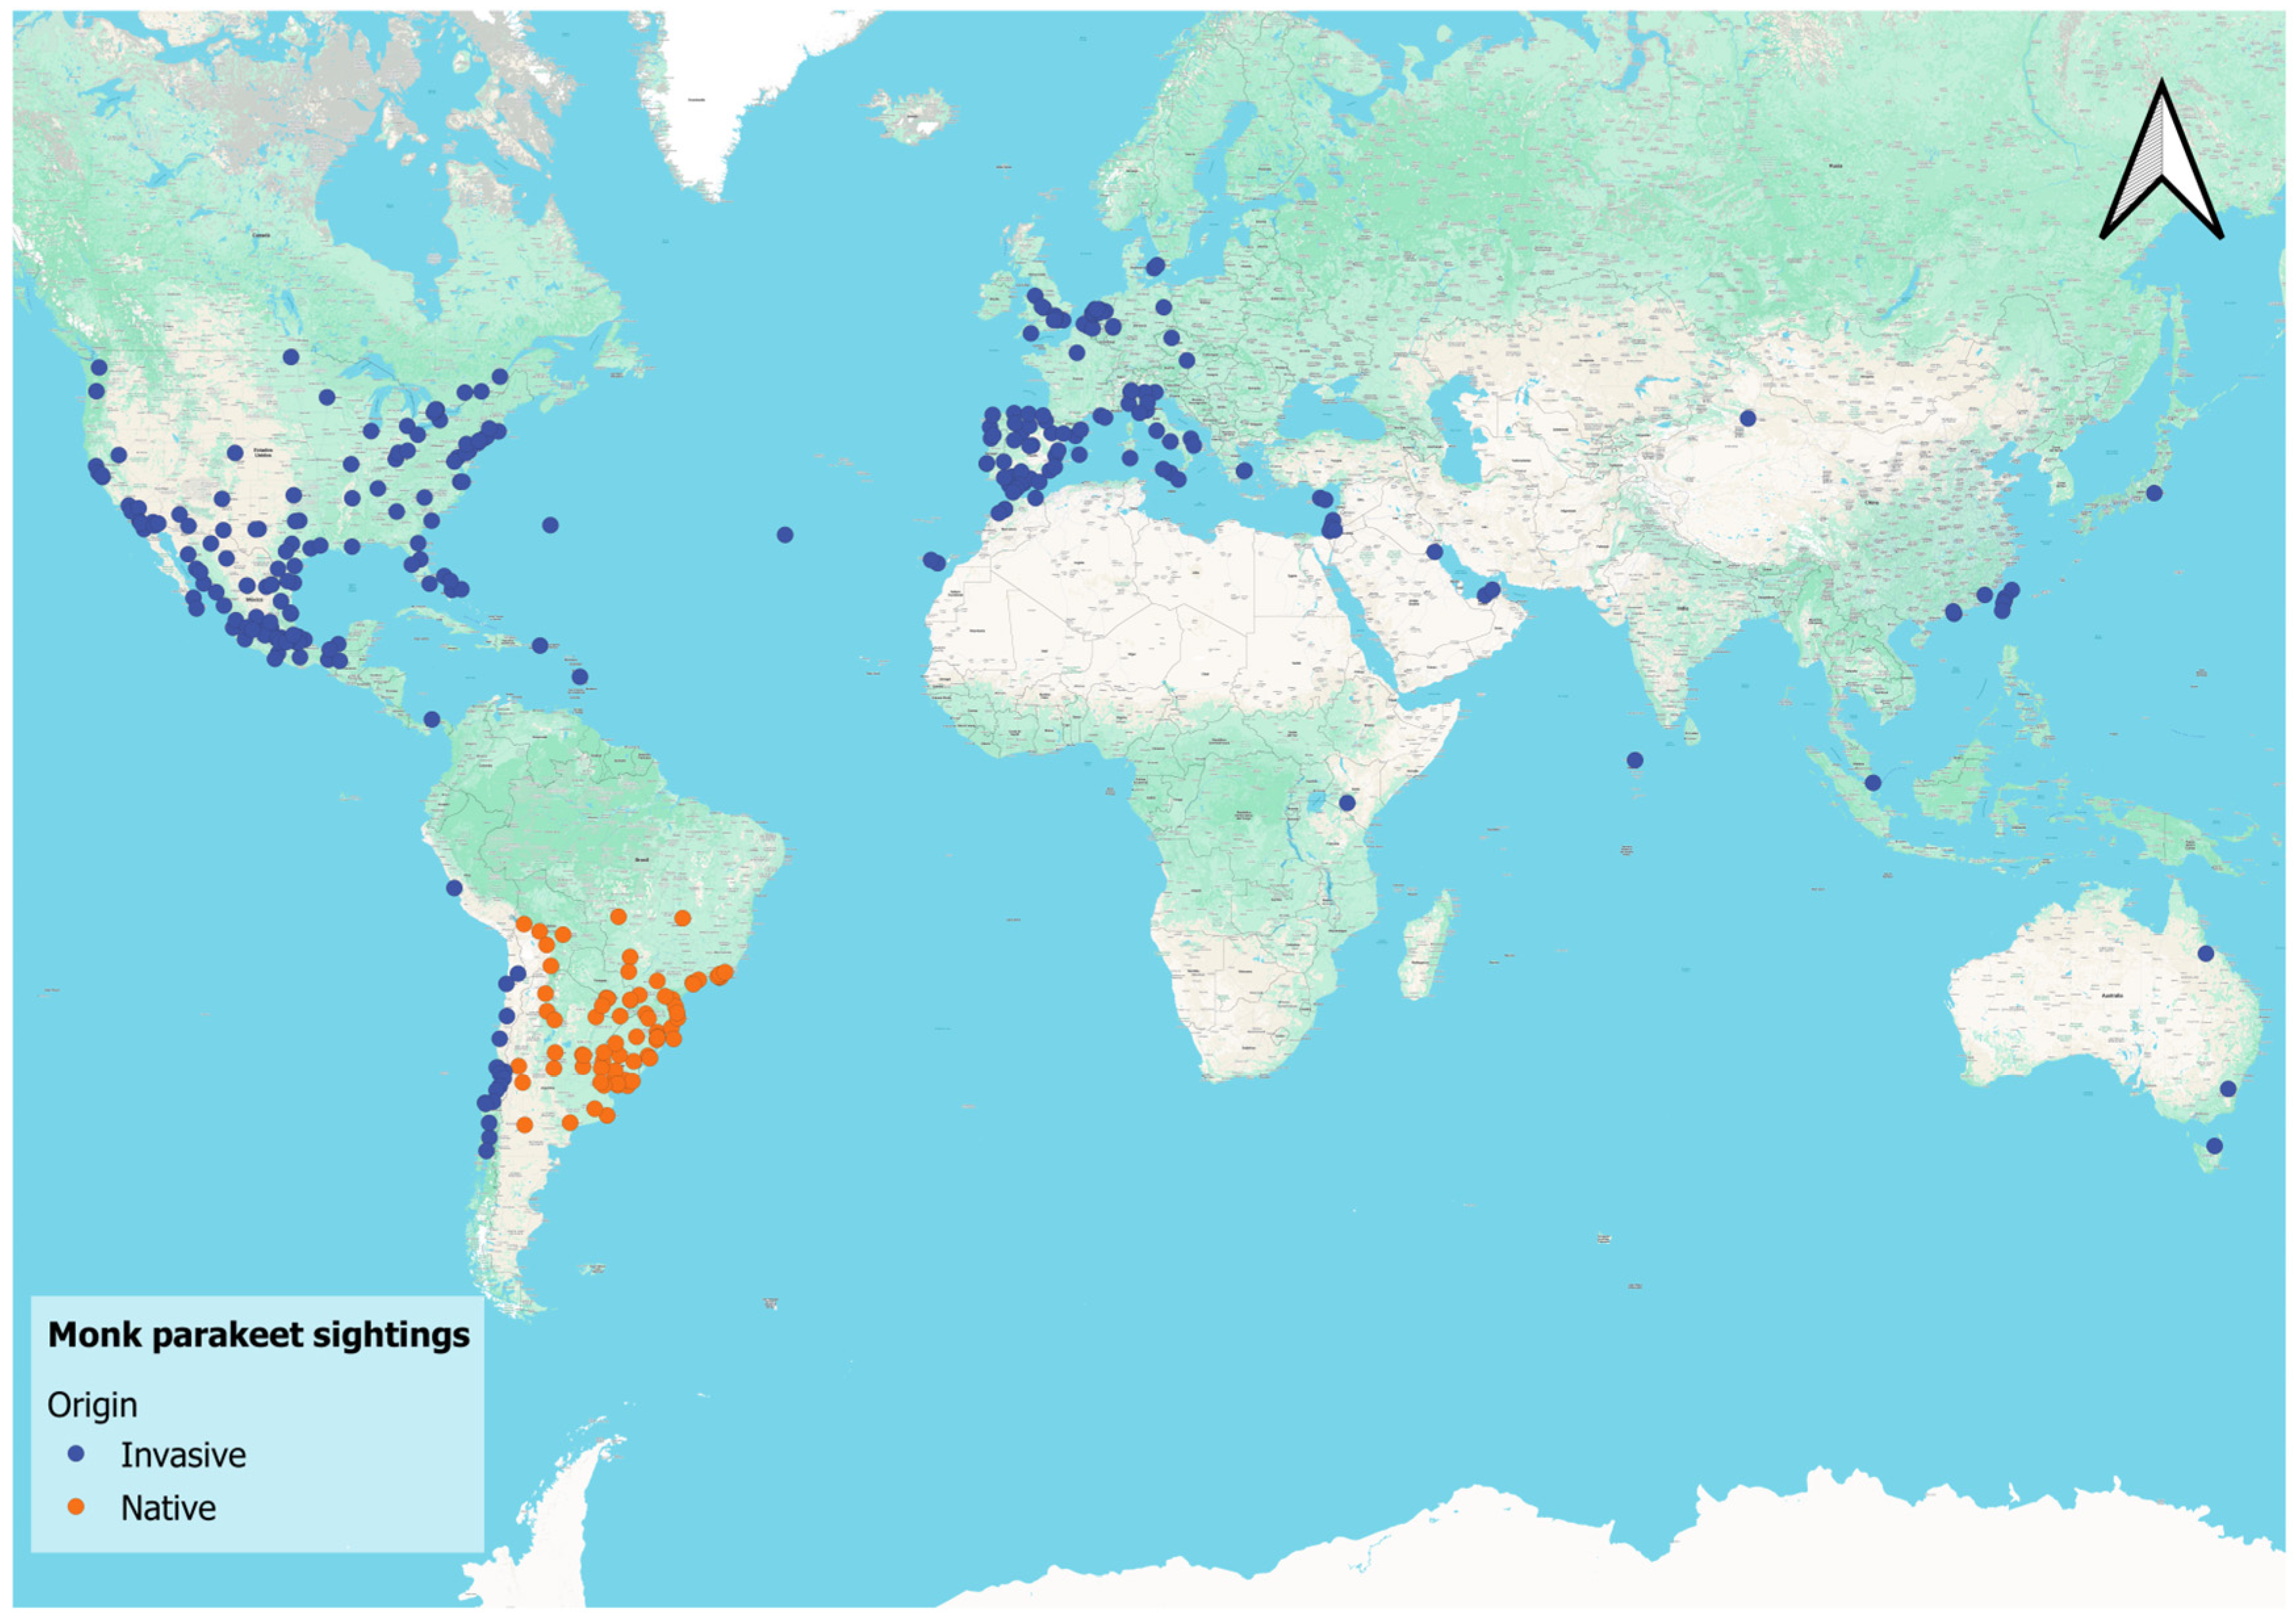
The Monk Parakeet is a parrot species native to the central and eastern South American countries of Argentina, Bolivia, Brazil, Paraguay and Uruguay (Figure 1; orange dots). Due to wild species trafficking to provide for the pet demand, the global distribution of this species has increased drastically over the last few decades [21,40]. Currently, it is considered an invasive species in 26 territories worldwide [41].
This medium-size, non-migratory bird species inhabits its nests year-round and is typically found near human settlements, in both urban and suburban environments [32,42,43,44]. It is non-territorial and a highly social parrot species, capable of living in a wide range of habitats, including open forests, savanna woodlands, farmland, urban parks, and others [11,32]. Its natal dispersal is very variable, and likely shorter in its native range (~500 m) compared to its invasive range (up to 105,000 m) [45]. Its diet is based on seeds, leaf buds, some fruits, berries, flowers of various plants, and occasionally insect larvae [32]. It has also been described that a significant portion of the Monk Parakeets’ diet comes from anthropic sources, such as bread, peanuts, rice, and others, especially in countries where bird feeding is a common practice [32,46]. Monk Parakeet’s broad ecological niche, high behavioral plasticity, and feeding opportunism explain its success in expanding and adapting to new environments [47,48].
Among the Psittaciformes order, the Monk Parakeet is the only species capable of building large communal nests with twigs and branches, allowing them to form large family groups [49]. This species is considered an ecosystem engineer due to its capacity of modifying richness and distribution of sympatric birds that use their nests [50]. In addition to their impacts upon communities of native fauna, their large nests can cause damage to infrastructure, such as electric poles [20], and pose a hazard to humans, as these heavy nests may detach from tall trees. There is also an economic cost associated with this, as many cities must allocate public funds to remove Monk Parakeet nests [11,51].

2.2. Species’ Distribution Data (eBird)

eBird is a free online desktop platform and mobile app, developed and managed by The Cornell Lab of Ornithology, a part of Cornell University [22,52]. It is one of the world’s largest citizen science projects, collecting bird sightings from around the world, including data about presence and distribution. This information is gathered through the internet and a global network of volunteers, creating a data repository for various bird species that is available worldwide [53,54]. This platform enables people to actively participate in citizen science by registering bird sightings, which include details such as the location and time of the event. These sightings can be enriched with sound recordings, photos, and videos [22,54].
Citizen science can be a powerful tool for understanding the distribution, movements, and changes in invasive species over time. However, data collected by citizens can sometimes be unreliable, lacking the assurance of data quality and highly dependent on the methods used by researchers [55]. To address this issue, eBird has implemented a rigorous evaluation system for the data they receive: First, users are presented with a list of common species that can be sighted in a specific area. If the species being registered is rare, previously unseen, or if there is an unusually high count of that species in a particular region, the birding sighting is flagged for further scrutiny by an expert reviewer, who is typically a regional birding expert [22,54]. If the reviewer determines that a mistake was made, the user is notified, and the sighting will not be entered into the central eBird database [22]. This review–feedback system of the eBird platform not only improves data quality by preventing false positives from entering the database during species identification, but also aids in the training of eBird volunteers, helping them become better birdwatchers with a more precise ability to discern species for future sightings [55]. eBird is designed to minimize data integrity problems, making it a valuable resource for large-scale questions and research [56].
Currently, eBird is widely used across various scientific disciplines, including conservation science and peer-reviewed papers. It is a trusted source for avian biodiversity data, with more than 100 million bird sightings contributed annually by 1.2 million eBirders, partner organizations and regional experts [22,54]. Since its launch in 2002, eBirders have contributed 2.1 billion bird observations globally, with 302 million new observations in 2025, and there have been at least 1180 scientific publications, a significant number of which are peer reviewed [57,58]. These publications either explore the functionality of the eBird project or conduct scientific research using data from the platform [57].
eBird sighting records yield results comparable to those from standardized surveys, with higher diversity and species richness due to the greater effort contributed by users worldwide. Since these sightings are made in the field by volunteers, this increased effort reduces costs compared to traditional birding surveys [56].
To compile the documented global distribution of Monk Parakeets, we reviewed eBird records corresponding to “Monk Parakeet—Myiopsitta monachus” up to 2024 [22]. On the 7th of January of 2025, we downloaded the file ebd_monpar_smp_relNov-2024 from eBird containing all Monk Parakeet records (e.g., country, observation date, observer id, etc.) from 1900 to 2024. We used this information as occurrence data and visualized it through the species range map available on the platform. For each country and period, we recorded whether Monk Parakeets had documented occurrence and counted the number of cities with records according to the inclusion criteria described below.
Because eBird is an opportunistic citizen–science platform, these data were not treated as effort-standardized estimates of true occupancy or abundance. Instead, they were used to compile documented occurrence records. To complement eBird, especially for early periods and territories with few or uncertain platform records, we also reviewed published information from Web of Science (WoS), the Invasive Species Specialist Group (ISSG), the CABI Invasive Species Compendium, Google Scholar and other literature sources reporting Monk Parakeet occurrence or invasion status [59,60,61]. The literature search was conducted by V.L.-J. and M.L. between 3 March 2024 and 7 July 2024 and included “Monk Parakeet”, “Quaker Parrot” and “Myiopsitta monachus” plus the Boolean operators “AND/OR”, retrieving 2680 results. These documents were revised, and inclusion criteria (n = 10) considered distributions or time periods previously not present in our compiled dataset from eBird. Exclusion criteria considered all manuscripts that were already in our dataset retrieved from eBird. When the literature sources confirmed occurrence in a country but did not provide sufficient detail to assign the number of cities meeting our inclusion criteria, those countries were retained as part of the documented distribution but were not used to increase city counts beyond the information directly available.

2.3. Statistical Analyses

The main analytical unit was country by decade, because both the response variable (number of cities with Monk Parakeet records) and the economic predictor (mean GDP per capita) were compiled at the country–period level. For each country and period, we recorded the number of cities with Monk Parakeet records and the corresponding mean GPD per capita. Thus, each row in the analytical dataset represented one country–period combination.
We defined cities following the Organization for Economic Co-operation and Development (OECD) threshold of urban centers with at least 100,000 inhabitants [62]. This criterion was used to improve comparability across countries. However, in a limited number of small territories or islands systems where applying this threshold would exclude the entire invaded area, exceptions were retained (e.g., Bermuda, Gibraltar, Cayman Islands). These cases were treated as exceptions to improve geographic coverage, but should be interpreted cautiously because they reduce strict comparability with larger urban systems. These exceptions were not intended to standardize city size across all territories, but to avoid omitting documented occurrence from small insular or territorial systems.
Time was grouped into five periods: 1900–1984, 1985–1994, 1995–2004, 2005–2014, and 2015–2024 (Appendix A). The first period was broader because relatively few records were available prior to 1985, making finer temporal subdivision poorly informative.
Descriptive summaries were used to characterize the documented distribution of Monk Parakeets across countries and periods. Inferential analyses were then used to address the second objective of the study, namely, whether the number of cities with records was associated with economic prosperity and whether the documented distribution increased over time.
To assess whether socioeconomic conditions were associated with the documented distribution, we obtained country-level Gross Domestic Product (GDP) per capita (current US dollars) from the World Bank World Development Indicators database [63] and, when unavailable, from official national statistics (e.g., Cayman Islands, Taiwan). For each country and decade, we calculated the mean GDP per capita, harmonizing number formats across sources. We first evaluated the relationship between the number of cities with Monk Parakeet records and GDP per capita using Spearman rank correlations, both across the full dataset and within each decade.
To evaluate whether the number of cities with Monk Parakeet records was associated with economic prosperity, we then used generalized linear models (GLMs) for count data, because the response variable was the number of cities with records per country–period combination. We first fitted a Poisson model, which is a standard starting point for count responses. Model diagnostics were then used to assess whether the Poisson error structure was appropriate. Specifically, overdispersion was evaluated by comparing the Pearson residual variance to the residual degrees of freedom. Because the Poisson model showed severe overdispersion, we also fitted a Negative Binomial model, which allows the variance to exceed the mean and is therefore more appropriate for overdispersed count data [64]. Additionally, the Negative Binomial distribution is often preferred and produces better results when investigating invasion biology, especially in species that form colonies and aggregate in space and time. GPD per capita was included as the main predictor, and decade and distributional status (native vs. invasive) were included as co-variates to reduce confounding. Because each country contributed repeated observations across periods, we calculated cluster-robust standard errors grouped by country. We also explored mixed-effects models with country as a random intercept. However, these models did not converge reliably, likely due to data sparsity, excess zeros, limited within-country variation, and influential GDP values. To address the remaining non-independence of repeated observations within countries, we retained the generalized linear model framework and used cluster-robust standard errors grouped by country. To test the overall temporal increase in the documented distribution of Monk Parakeets, we fitted an additional Negative Binomial regression using the number of cities with records as the response variable and the decade as an ordered predictor. We first evaluated a Poisson model, but severe overdispersion was detected. Therefore, the Negative Binomial model was retained. Because each country was represented across multiple time periods, we calculated cluster-robust standard errors grouped by country. We report temporal effect sizes as incidence rate ratios (IRRs) with 95% confidence intervals.

3. Results

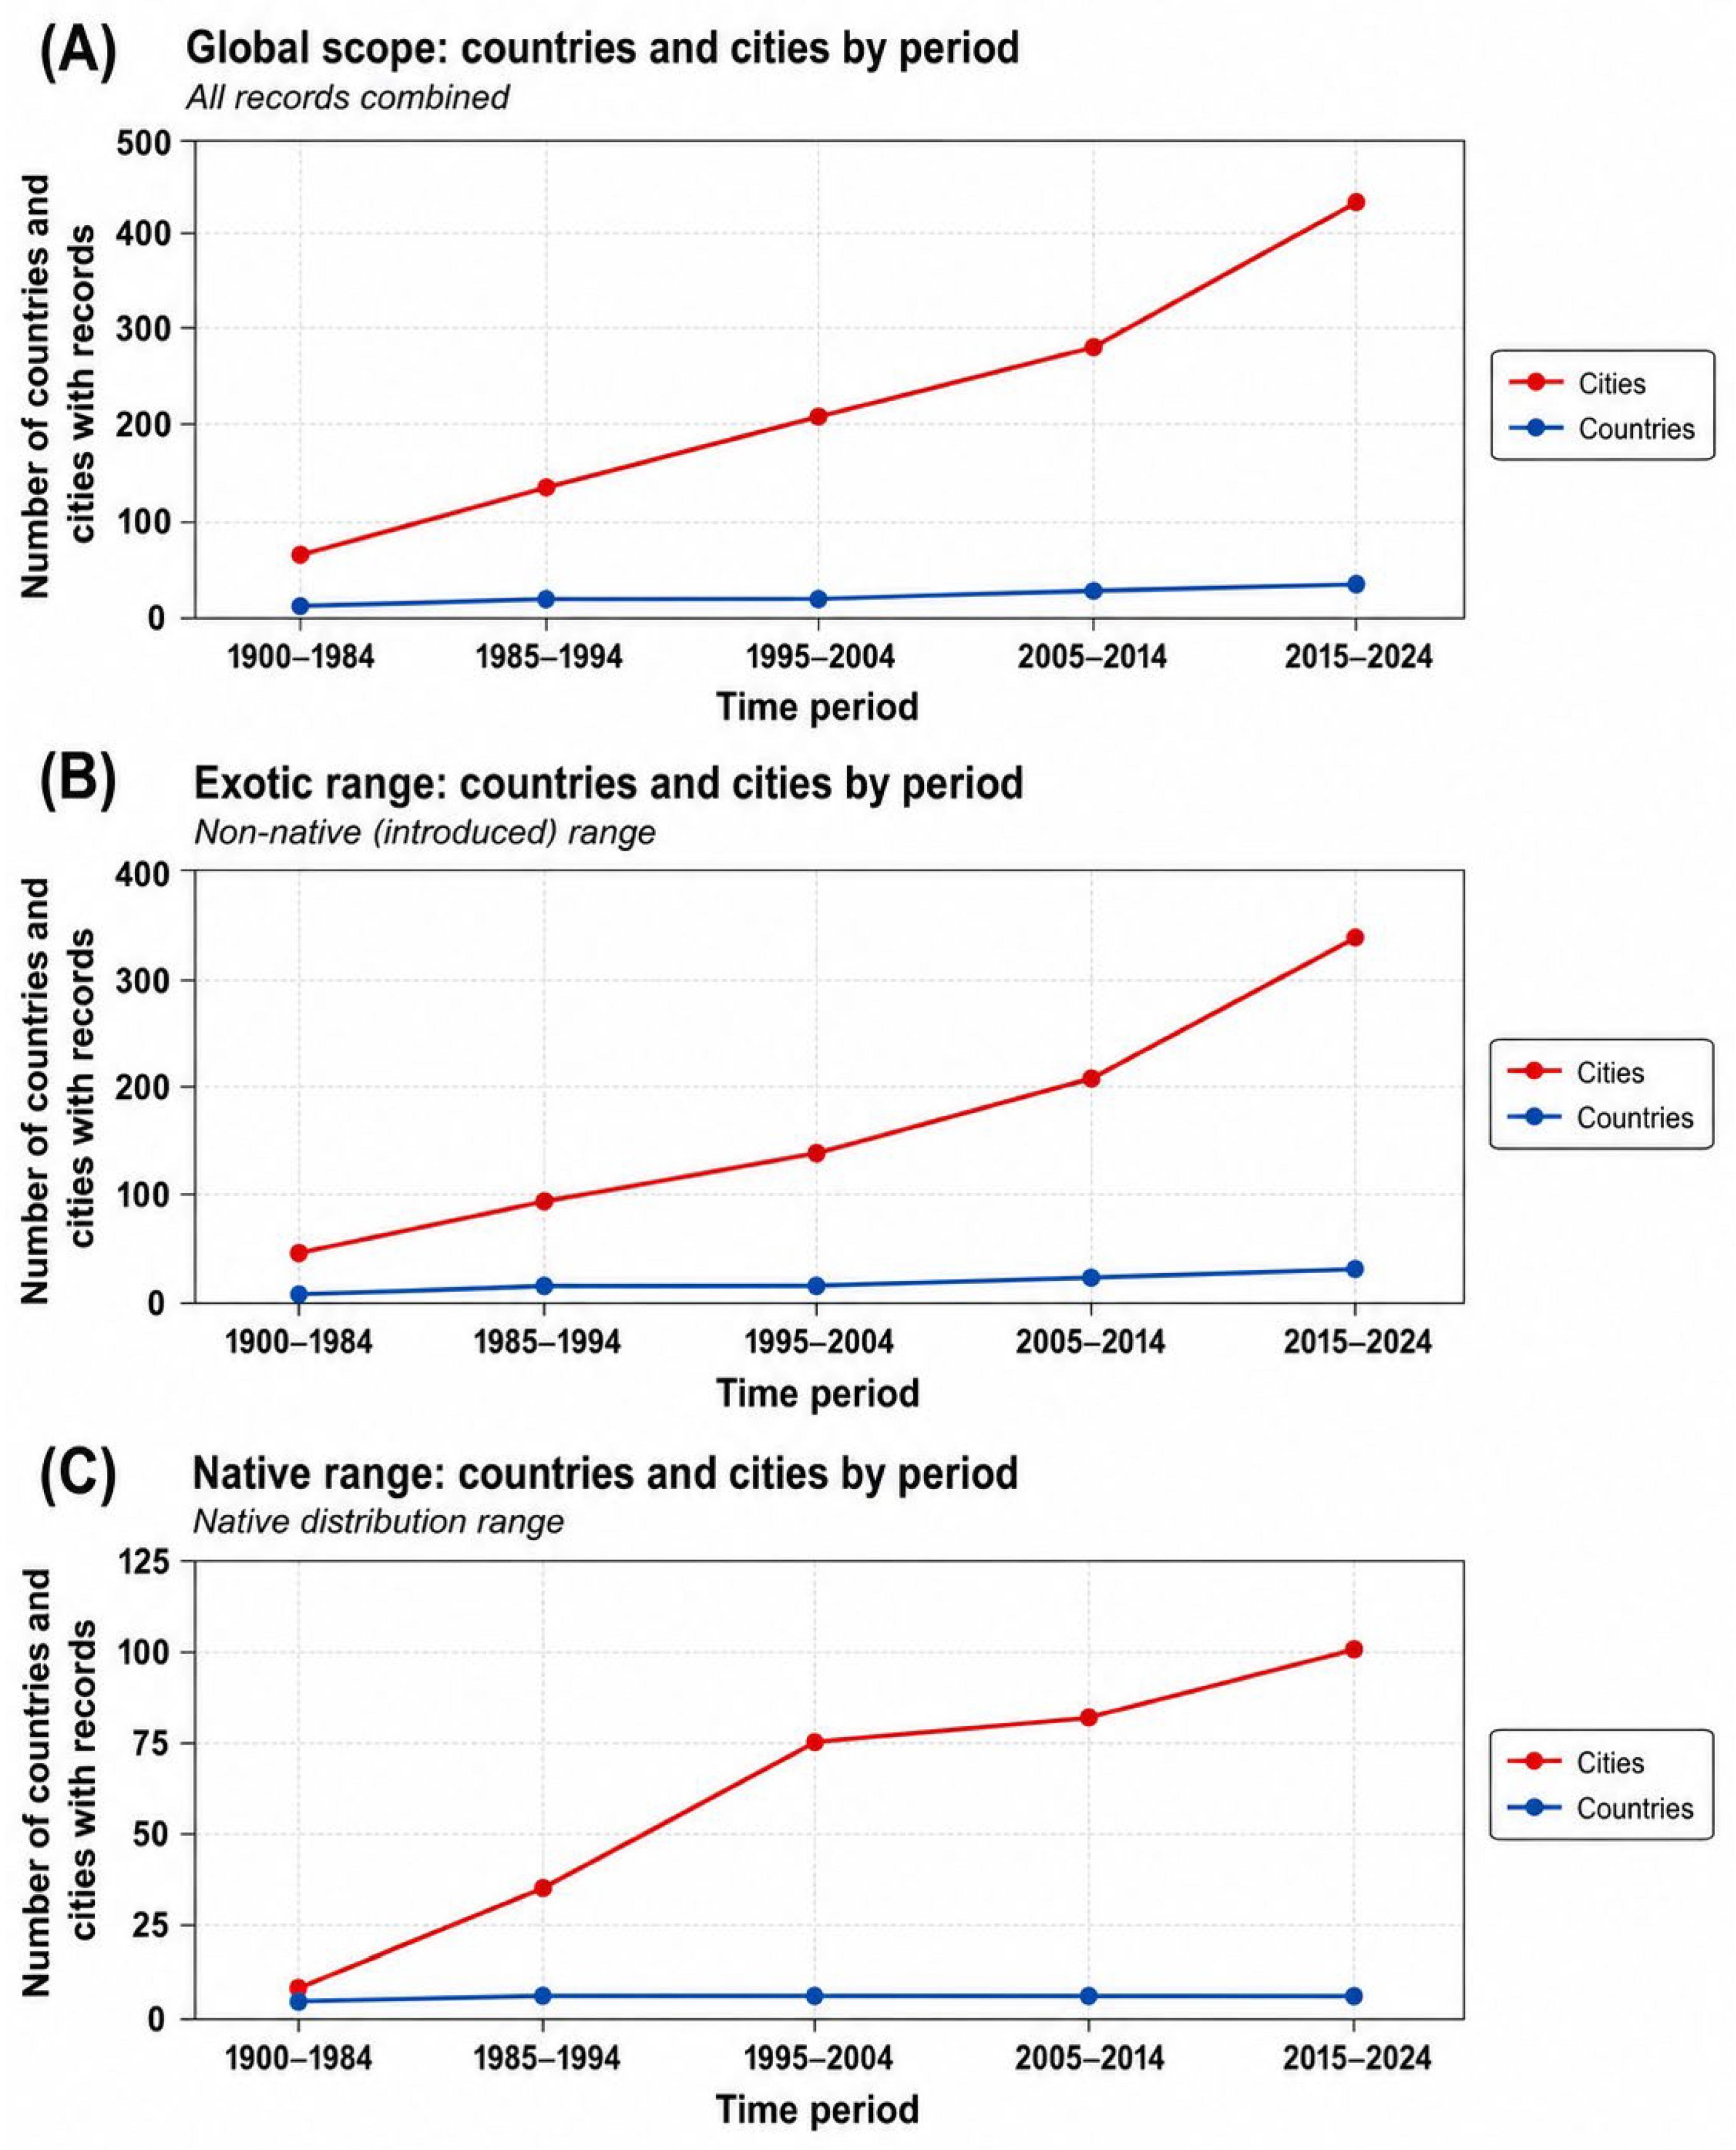
Based on historical, published reports and observations registered on the eBird platform from 1900 to 2024, we found that the invasive range of Monk Parakeets encompasses at least 31 countries (Figure 1). At the global scale, the number of cities with Monk Parakeet records increased from 66 in 1900–1984 to 434 in 2015–2024, whereas cities with documented Monk Parakeet records in the invasive range increased from 59 to 333 (Table 1). Since 1985, the number of invaded cities with a documented Monk Parakeet record increased by an average of 154% per decade, reaching 333 invaded cities in 2015–2024 (Table 1). This pattern indicates a marked increase in the documented distribution of the species over time. A negative binomial regression showed a significant positive temporal trend in the number of cities with Monk Parakeet records (β = 0.446, SE = 0.159, z = 2.80, p = 0.005), corresponding to a 56% increase in the expected number of cities with records per time period (IRR = 1.56, 95% CI = 1.14–2.13). This result indicates that the temporal pattern is unlikely to reflect random fluctuations alone, although part of the observed increase may still be influenced by temporal growth in observer effort and eBird coverage. The percentage increases presented in Table 1 are descriptive and should be interpreted as summaries of documented records across periods, whereas inferential uncertainty is provided by the regression-based temporal trend estimates. Overall, the increase in the Monk Parakeet distribution was steeper in cities than in countries (Figure 2). The invasive documented distribution increased by 564% since the first period, while the global documented distribution increased by 657.58% (Table 1).
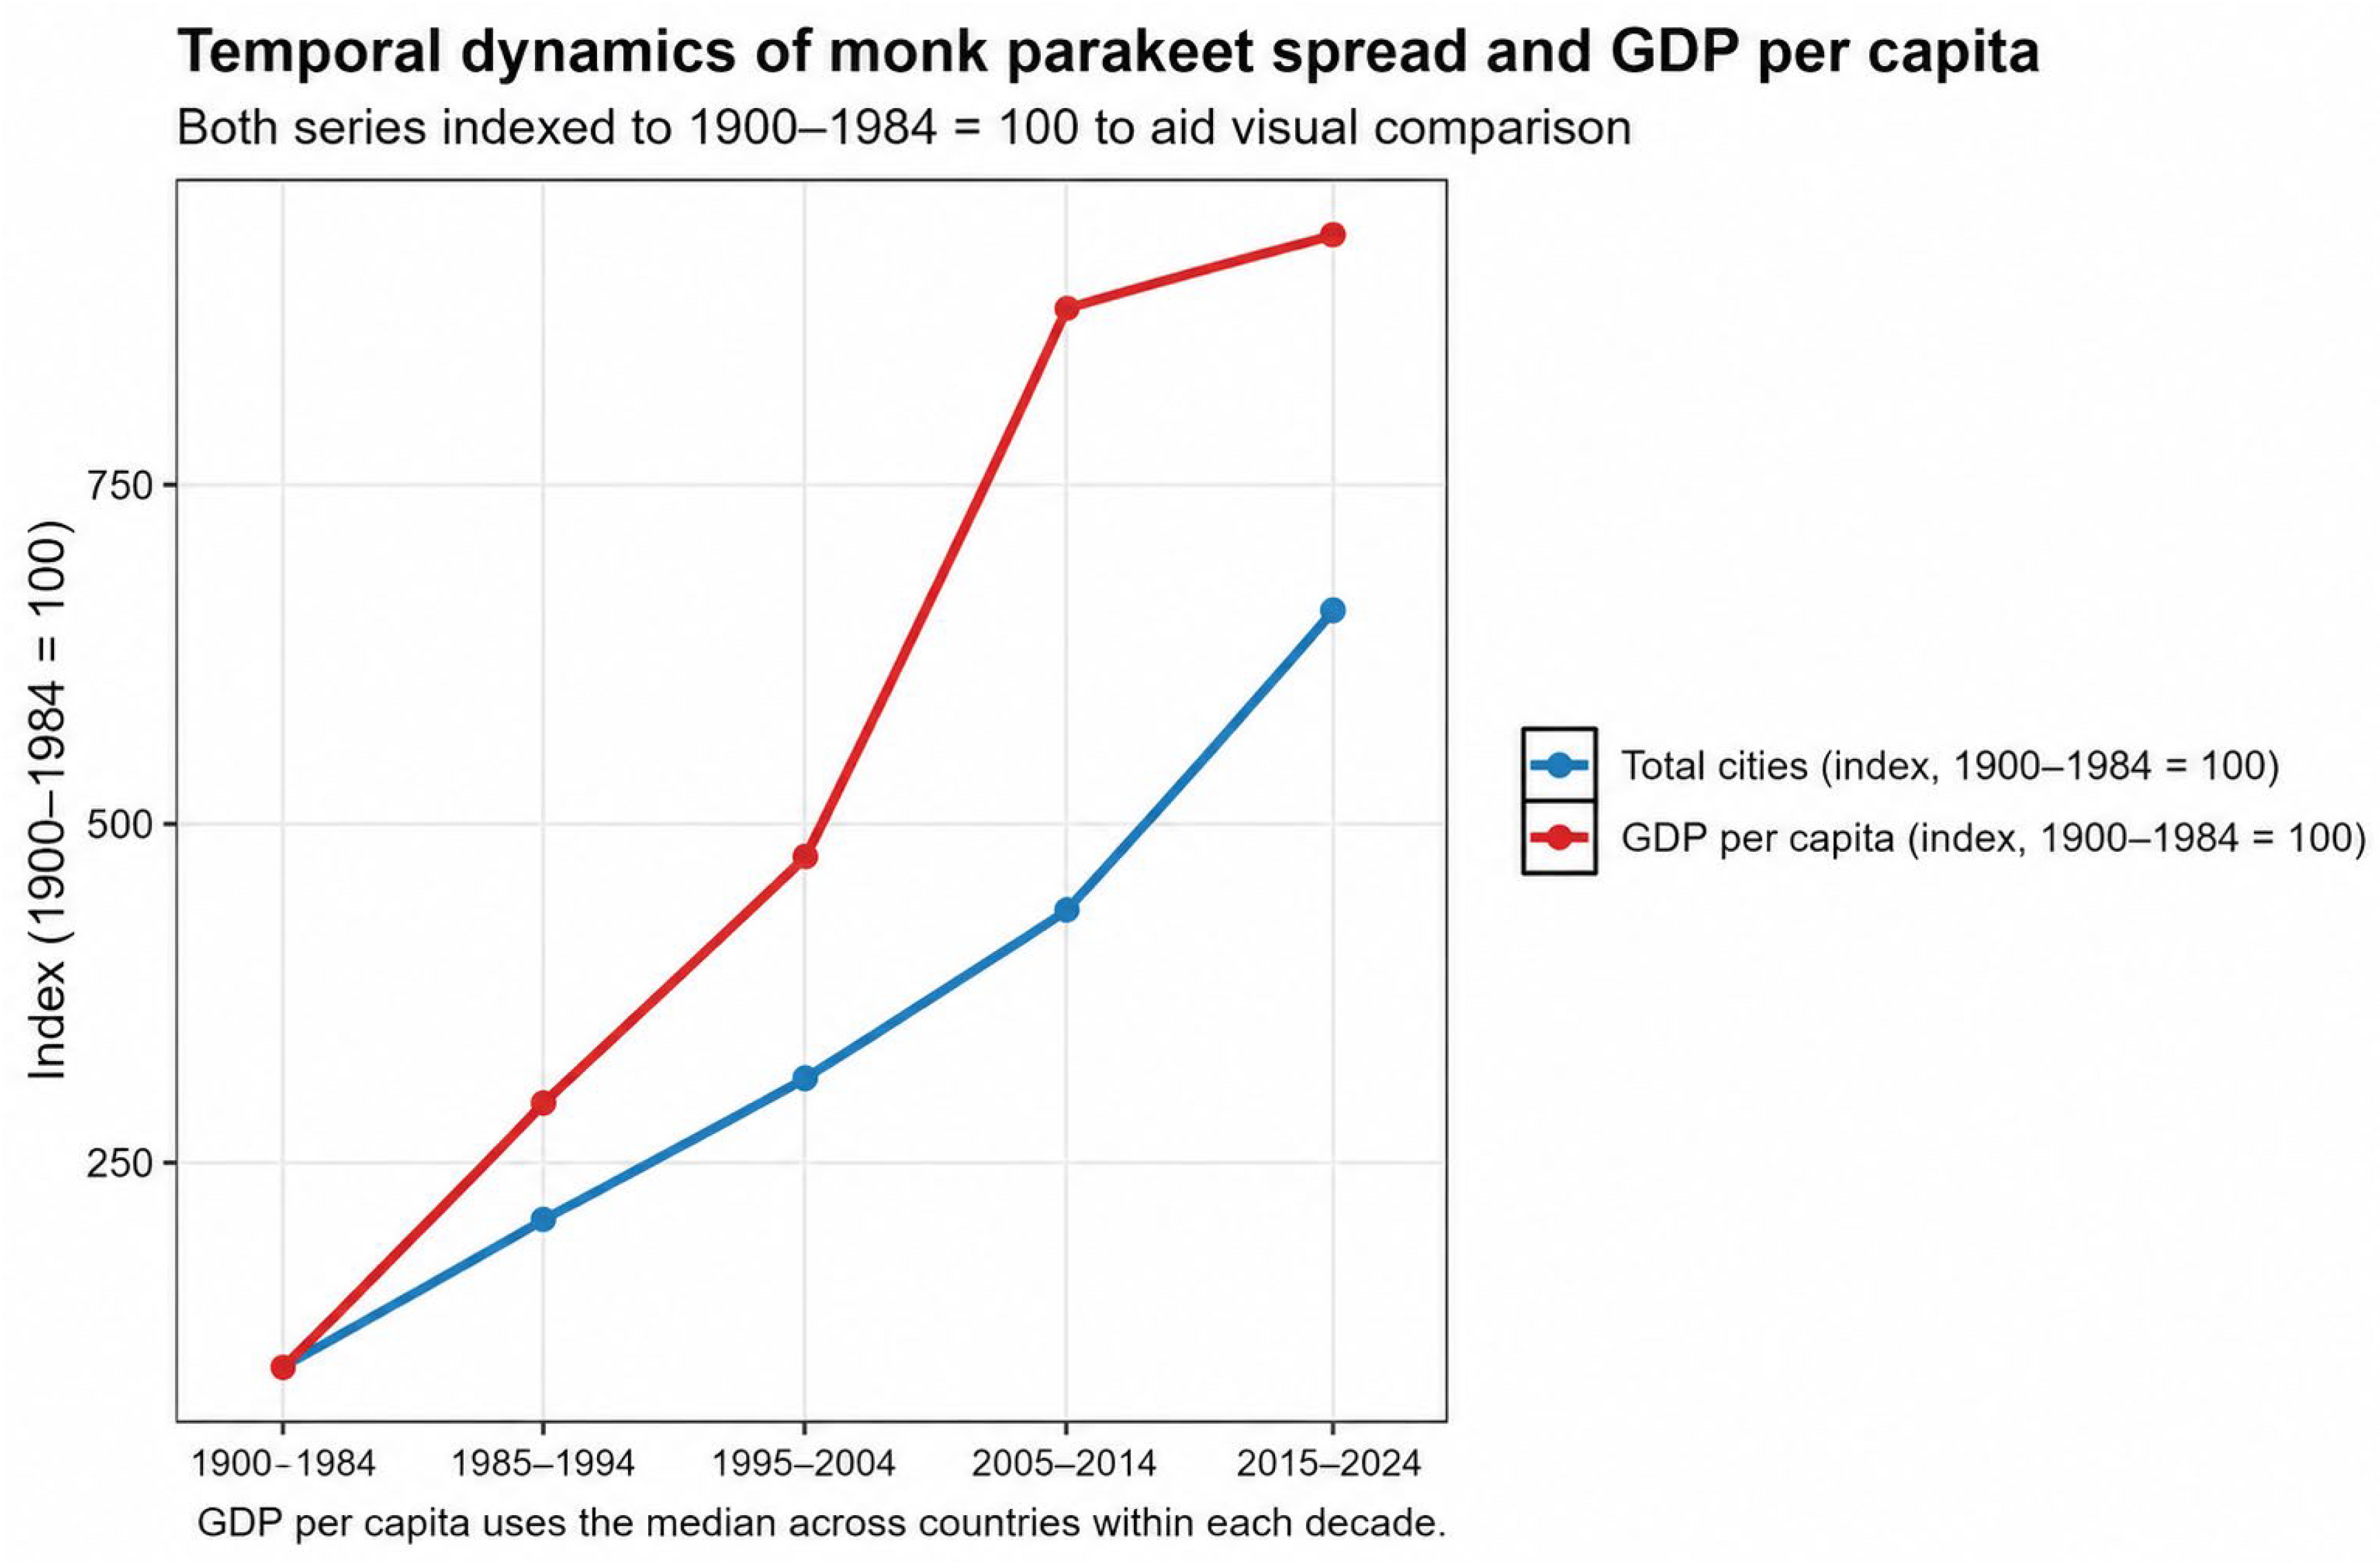
The global Spearman correlation revealed a significant positive association between GDP per capita and the number of cities with Monk Parakeet records (ρ = 0.33, p < 0.001; Figure 3). However, when stratified by decade, the relationship was not significant in any individual period, with coefficients ranging from near zero to weak and nonsignificant (ρ between –0.07 and 0.21). This suggests that the pooled association shown in Figure 3 should be interpreted as a broad historical pattern across the full dataset, rather than as evidence of a temporally consistent within-period relationship between GDP per capita and the number of cities with Monk Parakeet records. Diagnostics indicated overdispersion in the Poisson model (dispersion ratio = 26.7); so, we retained the Negative Binomial model as the appropriate inferential model. In this model, GDP per capita remained significantly associated with the number of cities with Monk Parakeet records, after adjusting for decade and distributional status (rate ratio = 3.31, p < 0.001). Temporal effects showed a marginal quadratic pattern (p ≈ 0.055), while native countries exhibited substantially higher numbers of cities with records than invasive countries (rate ratio ≈ 0.07 for invasive vs. native, p < 0.001). This contrast should be interpreted cautiously, given the longer occupancy history and different ecological baseline of the native range. Mixed-effects models including country as a random intercept were also explored, but they did not converge reliably, likely due to sparse data, excess zeros, limited within-country variation, and influential GDP values. Overall, these results indicate a positive pooled association between country-level economic wealth and the number of cities with documented Monk Parakeets records, although this pattern should be interpreted cautiously, given potential confounding by observation effort, country size, temporal aggregation, and heterogenous data sources.
The countries and number of cities with Monk Parakeet reports are listed in Appendix A. For some countries, the presence of Monk Parakeets was described only in scientific reports and not on the eBird platform. Thus, for these records, we lack the information regarding the number of cities invaded. However, we set a threshold of at least 100,000 inhabitants for inclusion criteria; certain countries and cities were still included. These exceptions considered small countries/territories such as Bermuda and Cyprus. In Bermuda, for example, eBird sightings covered the entire island, despite its total population being only 67,749 people. Similarly, in Cyprus, only the city of Ayia Nappa reports sightings on eBird, with a population of merely 2798 inhabitants. Additionally, an exception was made for Denmark, where sightings were recorded in the small city of Køge Bugt, which has only 33,885 inhabitants.

4. Discussion

In this study, we found a positive association between country-level GDP per capita and the number of cities with Monk Parakeet records over the last forty years. However, this pattern should be interpreted cautiously, as it may partly reflect variation in reporting effort, platform adoption, and other structural country-level differences rather than ecological differences in invasion success alone. Nonetheless, this association may reflect socioeconomic factors influencing either introduction pathways or detection/reporting effort. Wildlife trade has increased Psittacid distribution and abundance globally [41], and Monk Parakeets in particular have been imported since the ‘70s for pet trade in many areas of the world [40,50,65]. This demand for parrots boosted a massive exportation of Monk Parakeets from Uruguay and Argentina, given their high abundance in their native distribution and lack of regulation, especially up to the ‘90s, when importation began to be banned in several countries [15,16,66].
The higher increase in the Monk Parakeet distribution in the native range, and especially in the first time period (557%), was likely produced by imperfect records. Also, underreporting is likely, provided a lack of novelty for the species in its native range. Nonetheless, evidence of Monk Parakeet expansion is reported in the native distributions of Argentina, Brazil and Uruguay [45,65,67]. This demonstrates the successful spread of Monk Parakeets globally, despite methodological limitations that may underrepresent their real distribution.
The Monk Parakeet continues to expand its distribution globally and represents an important avian invasion, especially given its ability to construct nests and shape its environment to its needs [21,50]. Up to 2024, invasive Monk Parakeet populations were reported in 36 countries globally, of which 31 were invaded. In these countries, Monk Parakeets were introduced for the pet trade, and escapes or deliberate releases led to the establishment of viable populations [16,40]. Given their capacity to construct nests, their omnivorous diet, their synanthropic nature and potential lack of predators [49,68], they thrived and flourished in cities, persisting and expanding in urban environments [21,23,41,50,66,69].
Citizen science has emerged as a valuable tool, increasingly utilized in recent decades to study bird species’ distribution patterns globally [70,71,72]. However, applying citizen science presents well-documented challenges and limitations, particularly in data collection [73]. Specifically, Monk Parakeet sightings reported may be susceptible to type I and type II errors (false detections and false absences), despite the data quality filters implemented by the eBird platform [74]. It is important to consider that the use of online platforms can vary significantly depending on the country, especially in countries or regions where technology and internet access are limited [75,76], as well as due to other variables such as education, income, and location of citizens [77]. Consequently, this study relied on a compilation of the existing literature and data obtained from the eBird platform. Despite criticisms of eBird for potential biases in estimating the abundance for urban birds [78], we have confidence in its utility for mapping the global distribution of Monk Parakeets for three reasons: First, reporting intensity is expected to be higher in urban areas than in less densely populated regions, because birdwatching activity tends to increase with human population density. This may increase the probability that Monk Parakeets are detected and reported in urban settings [79]. Second, the distinctive features of Monk Parakeets, including their plumage, vocalizations, and communal nests, may facilitate recognition by citizens once the species is present and noticed. However, detectability in citizen–science datasets is not determined by species traits alone and may also depend strongly on observer density, accessibility, and reporting behavior. Third, a significant proportion of the population may already be familiar with Monk Parakeets in some urban settings, which could further influence reporting probability. For example, in Porto, Portugal, over 60% of residents reported being familiar with Monk Parakeets [80], while in Santiago Chile, at least 57% of residents recognize the species [31]. Therefore, neither the pooled association with GDP per capita nor the apparent influence of species conspicuousness should be interpreted as evidence that observation processes have been separated from ecological processes in the present analysis. The apparent global increase in the distribution and abundance of Monk Parakeet populations may be attributed, in part, to the increased use of eBird in specific countries or regions. Because eBird provides opportunistic presence-only records, temporal and spatial variation in observer effort may influence the apparent increase in Monk Parakeet records over time. Therefore, the temporal patterns reported here should be interpreted as changes in the documented distribution of the species based on compiled occurrence records, rather than as effort-corrected estimates of true range expansion. In this sense, our study provides an updated occurrence-based overview of the Monk Parakeet global distribution, while future studies should explicitly incorporate checklist-level effort or other standardized sampling frameworks to estimate temporal trends more robustly [36,81]. Thus, although the regression analysis supports a significant non-random temporal increase in the number of cities with Monk Parakeet records, this pattern should still be interpreted cautiously because opportunistic sampling effort and platform coverage have also increased over time. It is worth noting that eBird experiences an annual growth rate in reports of approximately 20% [22]. Hence, it is crucial to complement citizen science data with other research methods to accurately assess the distribution of Monk Parakeet populations in countries listed in this study. Additionally, long-term studies are necessary to monitor population growth over time [37]. Urgent investigations are also required to determine the presence or absence of Monk Parakeets in countries bordering territories where invasions have occurred. Given Monk Parakeet’s invasive attributes and maintenance as pets, invasion is possible in neighboring invaded countries or territories. One example of this is Malaysia, where sightings have not been registered in the country, while sightings in Singapore are recorded on eBird [82].
Another important limitation of the study is that, although the multivariable models adjusted for temporal period and distributional status, other potentially relevant confounding factors were not available in a comparable form for all country–period combinations and therefore could not be incorporated consistently in the present global analysis. These include country size, which may influence the total number of cities potentially available for colonization, as well as trade intensity and spatial heterogeneity in observer effort. In addition, the positive association between GDP per capita and the number of cities with Monk Parakeet records may partly reflect temporal co-variation in the pooled dataset rather than a consistent within-country effect over time. This interpretation is supported by the fact that the association was significant in the full pooled analysis but not within individual decades. Therefore, the association between GDP per capita and the number of cities with Monk Parakeet records should be interpreted with caution. In the present study, GDP may capture a mixture of processes, including historical pet-trade pathways, differences in urbanization, country size, observer effort, access to digital reporting platforms, and broader variation in eBird adoption among countries. Because these factors cannot be fully separated in the current occurrence-based framework, the observed relationship should not be interpreted as direct evidence that economic prosperity drives invasion success.
Demographic data in this study is approximate and subjected to imprecision. For instance, application of filters resulted in the exclusion of numerous other cities, implying that the true extent of the Monk Parakeet distribution may be underestimated. To our knowledge, successful eradication efforts have been reported only in Deventer, The Netherlands, and in Palma de Mallorca and Zaragoza in Spain [83]. Efforts to eradicate Monk Parakeets in England have faced social opposition [34]. Despite these localized eradication attempts, the Monk Parakeet remains a successful invasive species, steadily increasing in both abundance and distribution. Notably, Spain has banned the trade and possession of Monk Parakeets [83,84,85]. Unfortunately, the Spanish decision to ban Monk Parakeets was a perverse incentive to fuel massive importation and invasion in Mexico [15].
In various locations, the status of Monk Parakeet invasion remains outdated or unknown. In some cases, the presence of breeding or established populations is uncertain; yet, these areas are still included in the distribution range of invasive Monk Parakeets. These uncertainties are particularly notable in Denmark, Austria, Kenya, Japan, the Czech Republic, and Australia. For instance, in Denmark, the only recorded evidence of Monk Parakeet breeding in the wild dates to 1990 [86] and has not been reassessed since. In Japan, while some authors suggest the existence of breeding or established Monk Parakeet populations [87], others argue that populations have failed to establish themselves [88]. As of our latest knowledge, there are no current reports on invasive Monk Parakeet sightings in the remaining aforementioned countries.
We observed significant disparities in the percentage of increase between the invasive range of Monk Parakeets (averaging 160%) and the growth observed within their native range (at 124%) over the last decade. While the increase in Monk Parakeet sightings could be explained in part by the annual expansion of eBird, as previously mentioned [22], the rapid increase in sightings within the invasive distribution of these birds, in terms of the number of countries and cities, requires further investigation. It is important to ascertain whether this growth is related to more reports on the eBird platform, the high invasive capacity of the species, or other factors. Additionally, it is possible that eBird is not the main birder platform in all countries (e.g., Sweden and Finland) [89]. For instance, iNaturalist and Birda are mobile applications gaining popularity.
Based on the information about distribution that we present here, we project that more than 295 million people are potentially in sympatry with Monk Parakeets, and almost 246 million people are sympatric with invasive parakeet populations globally. Monk Parakeets are frequently observed flying above densely populated areas, including cities (for our calculations, this includes urban areas above 100,000 inhabitants). Further, parrots in general may represent an important group in urban ecosystems, at least in the Neotropics [90]. Biological invasions are linked to the emergence of diseases and may also affect the health of people and domestic animals [91,92], as biological invasions have been identified as sources of the spread of zoonoses [93]. Parakeets may be reservoirs of several bacterial and viral pathogens, many that can also be zoonotic [94]. Given the wide global distribution of Monk Parakeets, we emphasize the need for active surveillance of these zoonotic pathogens and suggest including others, such as the Newcastle virus and Avian Influenza Virus (AIV), as they have been identified in the Rose-Ringed Parakeet (Psittacula krameri), a species sharing invasive distribution and many similarities with Monk Parakeets [95]. However, considering differences in local systems, we recommend that surveillance efforts be conducted with centralized governmental coordination and funding, rather than depending on local urban administrations (e.g., municipalities). This approach would enable a more equitable and comparative effort to be implemented. Moreover, we advocate for the consideration of health impacts in economic assessments of invasive species globally.
However, the impact of invasive Monk Parakeets upon public health has been inadequately assessed [24,25,27]. Risks to human health are related to proximity to parakeets, given that several zoonotic agents have been reported in this species [24,25,27,28,95,96,97]. Genetic evidence suggests that most Monk Parakeet propagules founding populations globally originated from Uruguay and Argentina [40,98]. It is therefore reasonable to assume that the health status of Monk Parakeets in their regions of origin was somehow similar. Further, the health risks posed by invasive species have yet to be fully incorporated into economic impact assessments [99,100].
This risk is underscored by emerging evidence of zoonotic pathogens carried by Monk Parakeets in several areas of the world. The mite Ornithonyssus bursa has been found in invasive Monk Parakeet populations [25,101,102]. O. bursa bites may produce dermatitis, asthma, irritation and skin rashes in humans [103]. In Brazil, eight family members were infected with psittacosis after exposure to a Monk Parakeet obtained from illegal trade [97]. C. psittaci has also been detected in Monk Parakeets in Chile, Spain and their native Argentina [28,97,104]. Enteropathogenic E. coli has been detected in Monk Parakeet populations in Spain [95]. Moreover, as Monk Parakeets interact with other bird and animal species, transmission of these pathogens to other taxa is possible [26,50]. In Barcelona, 38% of Monk Parakeets were seropositive for New Castle Disease Virus [96]. This virus can infect several other vertebrates, including humans [105].
The Monk Parakeet is increasing its abundance and distribution in invaded territories globally [23,41,106]. Nonetheless, other factors are yet to be studied, for instance, if climate change could affect the parakeet distribution and abundance. Many countries are experiencing a decrease in the number of frost days, alongside rising urbanization and human population, all of which contribute to creating a more favorable environment for the establishment of Monk Parakeet populations [107]. Also, as recently reported, Monk Parakeets were seen for the first time nesting in rural areas in Spain, which could be a new niche for invasive Monk Parakeet to exploit and continue its expansion [108]. Coordinated action and partnership is required, from citizens, to park and animal managers, and to stakeholders. We advocate for a governmental and private alliance for cooperation, to maximize resources and improve chances of controlling Monk Parakeet expansion [109]. Otherwise, the Monk Parakeet will continue increasing its invasive global abundance, distribution and impact.

5. Conclusions

The Monk Parakeet emerges as a highly adaptable and invasive bird species that is increasing its global distribution. Our study highlights the need to increase research efforts to map the Monk Parakeet distribution in order to understand Monk Parakeets’ impacts and hopefully unveil their role in the epidemiology of zoonotic pathogens, especially given their proximity to densely populated human areas.
Through available online repositories such as eBird, together with the complementary literature sources, we updated the documented global distribution of Monk Parakeets and identified their presence in at least 31 invaded countries. The number of cities with Monk Parakeet records increased markedly over time and was positively associated with country-level economic wealth. However, because eBird records are presence only and the observed effort has increased over time, these temporal patterns should be interpreted as changes in the documented distribution rather than as effort-corrected estimates of true range expansion. With an estimated 295,649,288 people residing in areas cohabited by Monk Parakeets [110], the large amount of the human population exposed to its potential impacts warrants attention. There is a pressing need for governmental coordinated and implemented alliances to design strategies for Monk Parakeet population containment and control.
Further studies should assess and quantify the Monk Parakeet impact in sympatry with human populations.
Future management should also consider mitigating ecological and public health risks posed by Monk Parakeets in an interdisciplinary collaboration addressing complex challenges at the intersection of wildlife, environment, and human health.

Author Contributions

Conceptualization, C.B.; methodology, V.L.-J., M.L. and C.B.; formal analysis, V.L.-J. and M.L.; investigation, V.L.-J., M.L. and C.B.; data curation, V.L.-J.; writing—original draft preparation, V.L.-J. and M.L.; writing—review and editing, C.B.; supervision, C.B. All authors have read and agreed to the published version of the manuscript.

Funding

This research received no external funding.

Institutional Review Board Statement

Not applicable.

Informed Consent Statement

Not applicable.

Data Availability Statement

The original contributions presented in this study are included in the article. Further inquiries can be directed to the corresponding author.

Acknowledgments

We are grateful to constructive corrections from four anonymous reviewers that substantially improved earlier manuscript versions.

Conflicts of Interest

The authors declare no conflicts of interest.

Appendix A

CountryDistributionDecadeN° Reported CitiesPer Capita GDP (USD)GDP Source (Accessed on 10 January 2025)
Antigua and BarbudaInvasive1900–198402167.99https://data.worldbank.org/indicator/NY.GDP.PCAP.CD?locations=ATG
Antigua and BarbudaInvasive1985–199406919.93https://data.worldbank.org/indicator/NY.GDP.PCAP.CD?locations=ATG
Antigua and BarbudaInvasive1995–2004111,181.25https://data.worldbank.org/indicator/NY.GDP.PCAP.CD?locations=ATG
Antigua and BarbudaInvasive2005–2014116,035.84https://data.worldbank.org/indicator/NY.GDP.PCAP.CD?locations=ATG
Antigua and BarbudaInvasive2015–2024018,481.38https://data.worldbank.org/indicator/NY.GDP.PCAP.CD?locations=ATG
ArgentinaNative1900–198441902.48https://data.worldbank.org/indicator/NY.GDP.PCAP.CD?locations=ARG
ArgentinaNative1985–1994214737.04https://data.worldbank.org/indicator/NY.GDP.PCAP.CD?locations=ARG
ArgentinaNative1995–2004356400.28https://data.worldbank.org/indicator/NY.GDP.PCAP.CD?locations=ARG
ArgentinaNative2005–2014349632.76https://data.worldbank.org/indicator/NY.GDP.PCAP.CD?locations=ARG
ArgentinaNative2015–20243912,387.58https://data.worldbank.org/indicator/NY.GDP.PCAP.CD?locations=ARG
BahamasInvasive1900–198403499.83https://data.worldbank.org/indicator/NY.GDP.PCAP.CD?locations=BHS
BahamasInvasive1985–1994110,602.97https://data.worldbank.org/indicator/NY.GDP.PCAP.CD?locations=BHS
BahamasInvasive1995–2004021,940.76https://data.worldbank.org/indicator/NY.GDP.PCAP.CD?locations=BHS
BahamasInvasive2005–2014228,464.03https://data.worldbank.org/indicator/NY.GDP.PCAP.CD?locations=BHS
BahamasInvasive2015–2024032,868.51https://data.worldbank.org/indicator/NY.GDP.PCAP.CD?locations=BHS
BelgiumInvasive1900–198405320.54https://data.worldbank.org/indicator/NY.GDP.PCAP.CD?locations=BEL
BelgiumInvasive1985–1994218,048https://data.worldbank.org/indicator/NY.GDP.PCAP.CD?locations=BEL
BelgiumInvasive1995–2004126,852.03https://data.worldbank.org/indicator/NY.GDP.PCAP.CD?locations=BEL
BelgiumInvasive2005–2014344,485.35https://data.worldbank.org/indicator/NY.GDP.PCAP.CD?locations=BEL
BelgiumInvasive2015–2024348,001.9https://data.worldbank.org/indicator/NY.GDP.PCAP.CD?locations=BEL
BoliviaNative1900–19840418.75https://data.worldbank.org/indicator/NY.GDP.PCAP.CD?locations=BOL
BoliviaNative1985–19942714.7https://data.worldbank.org/indicator/NY.GDP.PCAP.CD?locations=BOL
BoliviaNative1995–20045938.71https://data.worldbank.org/indicator/NY.GDP.PCAP.CD?locations=BOL
BoliviaNative2005–201441973.36https://data.worldbank.org/indicator/NY.GDP.PCAP.CD?locations=BOL
BoliviaNative2015–202453415.9https://data.worldbank.org/indicator/NY.GDP.PCAP.CD?locations=BOL
BrazilNative1900–19841927.53https://data.worldbank.org/indicator/NY.GDP.PCAP.CD?locations=BRA
BrazilNative1985–199472298.95https://data.worldbank.org/indicator/NY.GDP.PCAP.CD?locations=BRA
BrazilNative1995–2004124038.79https://data.worldbank.org/indicator/NY.GDP.PCAP.CD?locations=BRA
BrazilNative2005–2014209781.41https://data.worldbank.org/indicator/NY.GDP.PCAP.CD?locations=BRA
BrazilNative2015–2024279116.95https://data.worldbank.org/indicator/NY.GDP.PCAP.CD?locations=BRA
CanadaInvasive1900–198416512.29https://data.worldbank.org/indicator/NY.GDP.PCAP.CD?locations=CAN
CanadaInvasive1985–1994518,938.37https://data.worldbank.org/indicator/NY.GDP.PCAP.CD?locations=CAN
CanadaInvasive1995–2004224,001.45https://data.worldbank.org/indicator/NY.GDP.PCAP.CD?locations=CAN
CanadaInvasive2005–2014146,518.67https://data.worldbank.org/indicator/NY.GDP.PCAP.CD?locations=CAN
CanadaInvasive2015–2024148,511.42https://data.worldbank.org/indicator/NY.GDP.PCAP.CD?locations=CAN
Cayman IslandsInvasive1900–19840NAAlternativa: Cayman Islands Economics & Statistics Office
Cayman IslandsInvasive1985–19940NAAlternativa: Cayman Islands Economics & Statistics Office
Cayman IslandsInvasive1995–20046NAAlternativa: Cayman Islands Economics & Statistics Office
Cayman IslandsInvasive2005–20147NAAlternativa: Cayman Islands Economics & Statistics Office
Cayman IslandsInvasive2015–20245NAAlternativa: Cayman Islands Economics & Statistics Office
ChileInvasive1900–198401220.36https://data.worldbank.org/indicator/NY.GDP.PCAP.CD?locations=CHL
ChileInvasive1985–199402522.16https://data.worldbank.org/indicator/NY.GDP.PCAP.CD?locations=CHL
ChileInvasive1995–200425145.17https://data.worldbank.org/indicator/NY.GDP.PCAP.CD?locations=CHL
ChileInvasive2005–2014412,050.28https://data.worldbank.org/indicator/NY.GDP.PCAP.CD?locations=CHL
ChileInvasive2015–20241615,062.31https://data.worldbank.org/indicator/NY.GDP.PCAP.CD?locations=CHL
ChinaInvasive1900–19840140.6https://data.worldbank.org/indicator/NY.GDP.PCAP.CD?locations=CHN
ChinaInvasive1985–19940330.02https://data.worldbank.org/indicator/NY.GDP.PCAP.CD?locations=CHN
ChinaInvasive1995–20040986.51https://data.worldbank.org/indicator/NY.GDP.PCAP.CD?locations=CHN
ChinaInvasive2005–201404572.95https://data.worldbank.org/indicator/NY.GDP.PCAP.CD?locations=CHN
ChinaInvasive2015–2024310,857.83https://data.worldbank.org/indicator/NY.GDP.PCAP.CD?locations=CHN
CuracaoInvasive1900–19840NAAlternativa: Central Bureau of Statistics Curaçao
CuracaoInvasive1985–19940NAAlternativa: Central Bureau of Statistics Curaçao
CuracaoInvasive1995–20040NAAlternativa: Central Bureau of Statistics Curaçao
CuracaoInvasive2005–20140NAAlternativa: Central Bureau of Statistics Curaçao
CuracaoInvasive2015–20241NAAlternativa: Central Bureau of Statistics Curaçao
CyprusInvasive1900–198402883.65https://data.worldbank.org/indicator/NY.GDP.PCAP.CD?locations=CYP
CyprusInvasive1985–199408529.76https://data.worldbank.org/indicator/NY.GDP.PCAP.CD?locations=CYP
CyprusInvasive1995–2004116,436.35https://data.worldbank.org/indicator/NY.GDP.PCAP.CD?locations=CYP
CyprusInvasive2005–2014029,819.17https://data.worldbank.org/indicator/NY.GDP.PCAP.CD?locations=CYP
CyprusInvasive2015–2024030,568.55https://data.worldbank.org/indicator/NY.GDP.PCAP.CD?locations=CYP
Czech RepublicInvasive1900–19840NAhttps://data.worldbank.org/indicator/NY.GDP.PCAP.CD?locations=CZE
Czech RepublicInvasive1985–199403786.12https://data.worldbank.org/indicator/NY.GDP.PCAP.CD?locations=CZE
Czech RepublicInvasive1995–200407388.04https://data.worldbank.org/indicator/NY.GDP.PCAP.CD?locations=CZE
Czech RepublicInvasive2005–2014019,226.88https://data.worldbank.org/indicator/NY.GDP.PCAP.CD?locations=CZE
Czech RepublicInvasive2015–2024124,811.67https://data.worldbank.org/indicator/NY.GDP.PCAP.CD?locations=CZE
EnglandInvasive1900–198404215.93https://data.worldbank.org/indicator/NY.GDP.PCAP.CD?locations=GBR
EnglandInvasive1985–1994116,219https://data.worldbank.org/indicator/NY.GDP.PCAP.CD?locations=GBR
EnglandInvasive1995–2004129,245.28https://data.worldbank.org/indicator/NY.GDP.PCAP.CD?locations=GBR
EnglandInvasive2005–2014243,819.96https://data.worldbank.org/indicator/NY.GDP.PCAP.CD?locations=GBR
EnglandInvasive2015–2024744,794.26https://data.worldbank.org/indicator/NY.GDP.PCAP.CD?locations=GBR
FranceInvasive1900–198405347.06https://data.worldbank.org/indicator/NY.GDP.PCAP.CD?locations=FRA
FranceInvasive1985–1994018,666.11https://data.worldbank.org/indicator/NY.GDP.PCAP.CD?locations=FRA
FranceInvasive1995–2004025,910.6https://data.worldbank.org/indicator/NY.GDP.PCAP.CD?locations=FRA
FranceInvasive2005–2014241,111.24https://data.worldbank.org/indicator/NY.GDP.PCAP.CD?locations=FRA
FranceInvasive2015–2024440,905.95https://data.worldbank.org/indicator/NY.GDP.PCAP.CD?locations=FRA
GermanyInvasive1900–198405220.2https://data.worldbank.org/indicator/NY.GDP.PCAP.CD?locations=DEU
GermanyInvasive1985–1994120,074.78https://data.worldbank.org/indicator/NY.GDP.PCAP.CD?locations=DEU
GermanyInvasive1995–2004028,232.41https://data.worldbank.org/indicator/NY.GDP.PCAP.CD?locations=DEU
GermanyInvasive2005–2014043,427.24https://data.worldbank.org/indicator/NY.GDP.PCAP.CD?locations=DEU
GermanyInvasive2015–2024148,596.95https://data.worldbank.org/indicator/NY.GDP.PCAP.CD?locations=DEU
GreeceInvasive1900–198402626.35https://data.worldbank.org/indicator/NY.GDP.PCAP.CD?locations=GRC
GreeceInvasive1985–199408375.67https://data.worldbank.org/indicator/NY.GDP.PCAP.CD?locations=GRC
GreeceInvasive1995–2004014,204.03https://data.worldbank.org/indicator/NY.GDP.PCAP.CD?locations=GRC
GreeceInvasive2005–2014125,286.25https://data.worldbank.org/indicator/NY.GDP.PCAP.CD?locations=GRC
GreeceInvasive2015–2024120,140.68https://data.worldbank.org/indicator/NY.GDP.PCAP.CD?locations=GRC
HollandInvasive1900–198405827.66https://data.worldbank.org/indicator/NY.GDP.PCAP.CD?locations=NLD
HollandInvasive1985–1994019,053.76https://data.worldbank.org/indicator/NY.GDP.PCAP.CD?locations=NLD
HollandInvasive1995–2004030,048.83https://data.worldbank.org/indicator/NY.GDP.PCAP.CD?locations=NLD
HollandInvasive2005–2014351,334.94https://data.worldbank.org/indicator/NY.GDP.PCAP.CD?locations=NLD
HollandInvasive2015–2024555,515https://data.worldbank.org/indicator/NY.GDP.PCAP.CD?locations=NLD
IsraelInvasive1900–198403771.19https://data.worldbank.org/indicator/NY.GDP.PCAP.CD?locations=ISR
IsraelInvasive1985–1994312,362.83https://data.worldbank.org/indicator/NY.GDP.PCAP.CD?locations=ISR
IsraelInvasive1995–2004020,169.23https://data.worldbank.org/indicator/NY.GDP.PCAP.CD?locations=ISR
IsraelInvasive2005–2014530,297.37https://data.worldbank.org/indicator/NY.GDP.PCAP.CD?locations=ISR
IsraelInvasive2015–2024945,961.29https://data.worldbank.org/indicator/NY.GDP.PCAP.CD?locations=ISR
ItalyInvasive1900–198403675.74https://data.worldbank.org/indicator/NY.GDP.PCAP.CD?locations=ITA
ItalyInvasive1985–1994017,016.52https://data.worldbank.org/indicator/NY.GDP.PCAP.CD?locations=ITA
ItalyInvasive1995–2004523,227.19https://data.worldbank.org/indicator/NY.GDP.PCAP.CD?locations=ITA
ItalyInvasive2005–2014536,222.79https://data.worldbank.org/indicator/NY.GDP.PCAP.CD?locations=ITA
ItalyInvasive2015–20241234,748.19https://data.worldbank.org/indicator/NY.GDP.PCAP.CD?locations=ITA
JordanInvasive1900–19840985.89https://data.worldbank.org/indicator/NY.GDP.PCAP.CD?locations=JOR
JordanInvasive1985–199401564.17https://data.worldbank.org/indicator/NY.GDP.PCAP.CD?locations=JOR
JordanInvasive1995–200401596.34https://data.worldbank.org/indicator/NY.GDP.PCAP.CD?locations=JOR
JordanInvasive2005–201403395.14https://data.worldbank.org/indicator/NY.GDP.PCAP.CD?locations=JOR
JordanInvasive2015–202414203.26https://data.worldbank.org/indicator/NY.GDP.PCAP.CD?locations=JOR
KuwaitInvasive1900–198408612.68https://data.worldbank.org/indicator/NY.GDP.PCAP.CD?locations=KWT
KuwaitInvasive1985–1994011,242.94https://data.worldbank.org/indicator/NY.GDP.PCAP.CD?locations=KWT
KuwaitInvasive1995–2004018,669.35https://data.worldbank.org/indicator/NY.GDP.PCAP.CD?locations=KWT
KuwaitInvasive2005–2014045,282.79https://data.worldbank.org/indicator/NY.GDP.PCAP.CD?locations=KWT
KuwaitInvasive2015–2024131,555.56https://data.worldbank.org/indicator/NY.GDP.PCAP.CD?locations=KWT
MaldivesInvasive1900–19840239.98https://data.worldbank.org/indicator/NY.GDP.PCAP.CD?locations=MDV
MaldivesInvasive1985–19940969.25https://data.worldbank.org/indicator/NY.GDP.PCAP.CD?locations=MDV
MaldivesInvasive1995–200402521.69https://data.worldbank.org/indicator/NY.GDP.PCAP.CD?locations=MDV
MaldivesInvasive2005–201406729.96https://data.worldbank.org/indicator/NY.GDP.PCAP.CD?locations=MDV
MaldivesInvasive2015–2024210,836.78https://data.worldbank.org/indicator/NY.GDP.PCAP.CD?locations=MDV
MexicoInvasive1900–198401262.36https://data.worldbank.org/indicator/NY.GDP.PCAP.CD?locations=MEX
MexicoInvasive1985–199403458.54https://data.worldbank.org/indicator/NY.GDP.PCAP.CD?locations=MEX
MexicoInvasive1995–200406550.18https://data.worldbank.org/indicator/NY.GDP.PCAP.CD?locations=MEX
MexicoInvasive2005–20142710,101.17https://data.worldbank.org/indicator/NY.GDP.PCAP.CD?locations=MEX
MexicoInvasive2015–20246010,776.43https://data.worldbank.org/indicator/NY.GDP.PCAP.CD?locations=MEX
MoroccoInvasive1900–19840452.21https://data.worldbank.org/indicator/NY.GDP.PCAP.CD?locations=MAR
MoroccoInvasive1985–199411107.68https://data.worldbank.org/indicator/NY.GDP.PCAP.CD?locations=MAR
MoroccoInvasive1995–200401652.09https://data.worldbank.org/indicator/NY.GDP.PCAP.CD?locations=MAR
MoroccoInvasive2005–201413008.88https://data.worldbank.org/indicator/NY.GDP.PCAP.CD?locations=MAR
MoroccoInvasive2015–202443486.76https://data.worldbank.org/indicator/NY.GDP.PCAP.CD?locations=MAR
PalestineInvasive1900–19840NAhttps://data.worldbank.org/indicator/NY.GDP.PCAP.CD?locations=PSE
PalestineInvasive1985–199411201.58https://data.worldbank.org/indicator/NY.GDP.PCAP.CD?locations=PSE
PalestineInvasive1995–200401364.56https://data.worldbank.org/indicator/NY.GDP.PCAP.CD?locations=PSE
PalestineInvasive2005–201402417.78https://data.worldbank.org/indicator/NY.GDP.PCAP.CD?locations=PSE
PalestineInvasive2015–202433439.88https://data.worldbank.org/indicator/NY.GDP.PCAP.CD?locations=PSE
PanamaInvasive1900–198401332.8https://data.worldbank.org/indicator/NY.GDP.PCAP.CD?locations=PAN
PanamaInvasive1985–199402937.58https://data.worldbank.org/indicator/NY.GDP.PCAP.CD?locations=PAN
PanamaInvasive1995–200403909.29https://data.worldbank.org/indicator/NY.GDP.PCAP.CD?locations=PAN
PanamaInvasive2005–201408655.39https://data.worldbank.org/indicator/NY.GDP.PCAP.CD?locations=PAN
PanamaInvasive2015–2024116,116.09https://data.worldbank.org/indicator/NY.GDP.PCAP.CD?locations=PAN
ParaguayNative1900–19842625.26https://data.worldbank.org/indicator/NY.GDP.PCAP.CD?locations=PRY
ParaguayNative1985–199461359.04https://data.worldbank.org/indicator/NY.GDP.PCAP.CD?locations=PRY
ParaguayNative1995–2004121777.34https://data.worldbank.org/indicator/NY.GDP.PCAP.CD?locations=PRY
ParaguayNative2005–2014104523.55https://data.worldbank.org/indicator/NY.GDP.PCAP.CD?locations=PRY
ParaguayNative2015–2024146015.05https://data.worldbank.org/indicator/NY.GDP.PCAP.CD?locations=PRY
PeruInvasive1900–19840697.01https://data.worldbank.org/indicator/NY.GDP.PCAP.CD?locations=PER
PeruInvasive1985–199401308.61https://data.worldbank.org/indicator/NY.GDP.PCAP.CD?locations=PER
PeruInvasive1995–200402119.91https://data.worldbank.org/indicator/NY.GDP.PCAP.CD?locations=PER
PeruInvasive2005–201414866.29https://data.worldbank.org/indicator/NY.GDP.PCAP.CD?locations=PER
PeruInvasive2015–202406985.05https://data.worldbank.org/indicator/NY.GDP.PCAP.CD?locations=PER
PolandInvasive1900–19840NAhttps://data.worldbank.org/indicator/NY.GDP.PCAP.CD?locations=POL
PolandInvasive1985–199402359.55https://data.worldbank.org/indicator/NY.GDP.PCAP.CD?locations=POL
PolandInvasive1995–200404814.24https://data.worldbank.org/indicator/NY.GDP.PCAP.CD?locations=POL
PolandInvasive2005–2014012,139.72https://data.worldbank.org/indicator/NY.GDP.PCAP.CD?locations=POL
PolandInvasive2015–2024117,139.32https://data.worldbank.org/indicator/NY.GDP.PCAP.CD?locations=POL
PortugalInvasive1900–198401573.43https://data.worldbank.org/indicator/NY.GDP.PCAP.CD?locations=PRT
PortugalInvasive1985–199407021.72https://data.worldbank.org/indicator/NY.GDP.PCAP.CD?locations=PRT
PortugalInvasive1995–2004213,027.62https://data.worldbank.org/indicator/NY.GDP.PCAP.CD?locations=PRT
PortugalInvasive2005–2014321,972https://data.worldbank.org/indicator/NY.GDP.PCAP.CD?locations=PRT
PortugalInvasive2015–2024323,538.51https://data.worldbank.org/indicator/NY.GDP.PCAP.CD?locations=PRT
Puerto RicoInvasive1900–19841NAAlternativa sugerida: Puerto Rico Planning Board/IMF
Puerto RicoInvasive1985–19947NAAlternativa sugerida: Puerto Rico Planning Board/IMF
Puerto RicoInvasive1995–200421NAAlternativa sugerida: Puerto Rico Planning Board/IMF
Puerto RicoInvasive2005–20142828,479.7Alternativa sugerida: Puerto Rico Planning Board/IMF
Puerto RicoInvasive2015–20245932,847.5Alternativa sugerida: Puerto Rico Planning Board/IMF
RomaniaInvasive1900–19840NAhttps://data.worldbank.org/indicator/NY.GDP.PCAP.CD?locations=ROU
RomaniaInvasive1985–199401460.95https://data.worldbank.org/indicator/NY.GDP.PCAP.CD?locations=ROU
RomaniaInvasive1995–200402009.22https://data.worldbank.org/indicator/NY.GDP.PCAP.CD?locations=ROU
RomaniaInvasive2005–201408413.91https://data.worldbank.org/indicator/NY.GDP.PCAP.CD?locations=ROU
RomaniaInvasive2015–2024113,670.75https://data.worldbank.org/indicator/NY.GDP.PCAP.CD?locations=ROU
SingaporeInvasive1900–198402340.76https://data.worldbank.org/indicator/NY.GDP.PCAP.CD?locations=SGP
SingaporeInvasive1985–1994012,299.26https://data.worldbank.org/indicator/NY.GDP.PCAP.CD?locations=SGP
SingaporeInvasive1995–2004024,020.04https://data.worldbank.org/indicator/NY.GDP.PCAP.CD?locations=SGP
SingaporeInvasive2005–2014145,330.6https://data.worldbank.org/indicator/NY.GDP.PCAP.CD?locations=SGP
SingaporeInvasive2015–2024171,457.27https://data.worldbank.org/indicator/NY.GDP.PCAP.CD?locations=SGP
SpainInvasive1900–198402508.74https://data.worldbank.org/indicator/NY.GDP.PCAP.CD?locations=ESP
SpainInvasive1985–19941111,124.25https://data.worldbank.org/indicator/NY.GDP.PCAP.CD?locations=ESP
SpainInvasive1995–20042617,104.38https://data.worldbank.org/indicator/NY.GDP.PCAP.CD?locations=ESP
SpainInvasive2005–20143830,528.41https://data.worldbank.org/indicator/NY.GDP.PCAP.CD?locations=ESP
SpainInvasive2015–20245029,861.8https://data.worldbank.org/indicator/NY.GDP.PCAP.CD?locations=ESP
SwitzerlandInvasive1900–198408672.81https://data.worldbank.org/indicator/NY.GDP.PCAP.CD?locations=CHE
SwitzerlandInvasive1985–1994033,821.32https://data.worldbank.org/indicator/NY.GDP.PCAP.CD?locations=CHE
SwitzerlandInvasive1995–2004044,912.49https://data.worldbank.org/indicator/NY.GDP.PCAP.CD?locations=CHE
SwitzerlandInvasive2005–2014175,486.02https://data.worldbank.org/indicator/NY.GDP.PCAP.CD?locations=CHE
SwitzerlandInvasive2015–2024089,581.19https://data.worldbank.org/indicator/NY.GDP.PCAP.CD?locations=CHE
TaiwanInvasive1900–19840NAAlternativa: IMF/Our World in Data (Taiwan)
TaiwanInvasive1985–19940NAAlternativa: IMF/Our World in Data (Taiwan)
TaiwanInvasive1995–20040NAAlternativa: IMF/Our World in Data (Taiwan)
TaiwanInvasive2005–20141NAAlternativa: IMF/Our World in Data (Taiwan)
TaiwanInvasive2015–20244NAAlternativa: IMF/Our World in Data (Taiwan)
ThailandInvasive1900–19840358https://data.worldbank.org/indicator/NY.GDP.PCAP.CD?locations=THA
ThailandInvasive1985–199401515.15https://data.worldbank.org/indicator/NY.GDP.PCAP.CD?locations=THA
ThailandInvasive1995–200402324.79https://data.worldbank.org/indicator/NY.GDP.PCAP.CD?locations=THA
ThailandInvasive2005–201404645.44https://data.worldbank.org/indicator/NY.GDP.PCAP.CD?locations=THA
ThailandInvasive2015–202416813.34https://data.worldbank.org/indicator/NY.GDP.PCAP.CD?locations=THA
USAInvasive1900–1984577635.79https://data.worldbank.org/indicator/NY.GDP.PCAP.CD?locations=USA
USAInvasive1985–19946622,935.32https://data.worldbank.org/indicator/NY.GDP.PCAP.CD?locations=USA
USAInvasive1995–20046435,016.3https://data.worldbank.org/indicator/NY.GDP.PCAP.CD?locations=USA
USAInvasive2005–20146849,306.73https://data.worldbank.org/indicator/NY.GDP.PCAP.CD?locations=USA
USAInvasive2015–20246968,466.18https://data.worldbank.org/indicator/NY.GDP.PCAP.CD?locations=USA
United Arab EmiratesInvasive1900–1984026,250.68https://data.worldbank.org/indicator/NY.GDP.PCAP.CD?locations=ARE
United Arab EmiratesInvasive1985–1994024,900.33https://data.worldbank.org/indicator/NY.GDP.PCAP.CD?locations=ARE
United Arab EmiratesInvasive1995–2004028,245.5https://data.worldbank.org/indicator/NY.GDP.PCAP.CD?locations=ARE
United Arab EmiratesInvasive2005–2014346,669.9https://data.worldbank.org/indicator/NY.GDP.PCAP.CD?locations=ARE
United Arab EmiratesInvasive2015–2024344,599.45https://data.worldbank.org/indicator/NY.GDP.PCAP.CD?locations=ARE
UruguayNative1900–198401333.26https://data.worldbank.org/indicator/NY.GDP.PCAP.CD?locations=URY
UruguayNative1985–199433228.11https://data.worldbank.org/indicator/NY.GDP.PCAP.CD?locations=URY
UruguayNative1995–2004126045.27https://data.worldbank.org/indicator/NY.GDP.PCAP.CD?locations=URY
UruguayNative2005–20141311,850.36https://data.worldbank.org/indicator/NY.GDP.PCAP.CD?locations=URY
UruguayNative2015–20241619,226.99https://data.worldbank.org/indicator/NY.GDP.PCAP.CD?locations=URY

References

  1. Richardson, D.M.; Pyšek, P.; Rejmánek, M.; Barbour, M.G.; Panetta, F.D.; West, C.J. Naturalization and invasion of alien plants: Concepts and definitions. Divers. Distrib. 2000, 6, 93–107. [Google Scholar] [CrossRef] [Scilit]
  2. Essl, F.; Bacher, S.; Genovesi, P.; Hulme, P.E.; Jeschke, J.M.; Katsanevakis, S.; Kowarik, I.; Kühn, I.; Pyšek, P.; Rabitsch, W.; et al. Which taxa are alien? Criteria, applications, and uncertainties. BioScience 2018, 68, 496–509. [Google Scholar] [CrossRef] [Scilit]
  3. Clavero, M.; García-Berthou, E. Invasive species are a leading cause of animal extinctions. Trends Ecol. Evol. 2005, 20, 110. [Google Scholar] [CrossRef] [Scilit]
  4. Simberloff, D.; Martin, J.L.; Genovesi, P.; Maris, V.; Wardle, D.A.; Aronson, J.; Courchamp, F.; Galil, B.; García-Berthou, E.; Pascal, M.; et al. Impacts of biological invasions: What’s what and the way forward. Trends Ecol. Evol. 2013, 28, 58–66. [Google Scholar] [CrossRef] [Scilit]
  5. Seebens, H.; Blackburn, T.M.; Dyer, E.E.; Genovesi, P.; Hulme, P.E.; Jeschke, J.M.; Pagad, S. No saturation in the accumulation of alien species worldwide. Nat. Commun. 2017, 8, 14435. [Google Scholar] [CrossRef] [Scilit]
  6. Pimentel, D.; Lach, L.; Zuniga, R.; Morrison, D. Environmental and economic costs of nonindigenous species in the United States. BioScience 2000, 50, 53–65. [Google Scholar] [CrossRef] [Scilit]
  7. Genovesi, P. Are we turning the tide? Eradications in times of crisis: How the global community is responding to biological invasions. In Island Invasives: Eradication and Management; IUCN: Gland, Switzerland, 2011; pp. 5–8. [Google Scholar]
  8. IPBES. Summary for Policymakers of the Thematic Assessment Report on Invasive Alien Species and their Control of the Intergovernmental Science-Policy Platform on Biodiversity and Ecosystem Services. In Invasive Alien Species Assessment; Roy, H.E., Pauchard, A., Stoett, P., Renard Truong, T., Bacher, S., Galil, B.S., Hulme, P.E., Ikeda, T., Sankaran, K.V., McGeoch, M.A., et al., Eds.; IPBES Secretariat: Bonn, Germany, 2023; pp. 1–56. [Google Scholar] [CrossRef]
  9. Shivambu, T.C.; Shivambu, N.; Downs, C.T. Impact assessment of seven alien invasive bird species already introduced to South Africa. Biol. Invasions 2020, 22, 1829–1847. [Google Scholar] [CrossRef] [Scilit]
  10. Reino, L.; Figueira, R.; Beja, P.; Araújo, M.B.; Capinha, C.; Strubbe, D. Networks of global bird invasion altered by regional trade ban. Sci. Adv. 2017, 3, e1700783. [Google Scholar] [CrossRef] [Scilit] [PubMed]
  11. Senar, J.C.; Conroy, M.J.; Montalvo, T. Decision-making models and management of the monk parakeet. In Naturalized Parrots of the World: Distribution, Ecology, and Impacts of the World’s Most Colorful Colonizers; Pruett-Jones, S., Ed.; Princeton University Press: Princeton, NJ, USA, 2021; Volume 7, pp. 102–122. [Google Scholar]
  12. Mack, R.N.; Simberloff, D.; Lonsdale, W.M.; Evans, H.C.; Clout, M.N.; Bazzaz, F.A. Biotic invasions: Causes, epidemiology, global consequences, and control. Ecol. Appl. 2000, 10, 689–710. [Google Scholar] [CrossRef]
  13. Sakai, A.K.; Allendorf, F.W.; Holt, J.S.; Lodge, D.M.; Molofsky, J.; Baughman, S.; Cabin, R.J.; Cohen, J.E.; Ellstrand, N.C.; McCauley, D.E.; et al. The population biology of invasive species. Annu. Rev. Ecol. Syst. 2001, 32, 305–332. [Google Scholar] [CrossRef] [Scilit]
  14. Ley de Caza de 1996, No. 19.473. Diario Oficial de la República de Chile. 1996. Available online: https://www.bcn.cl/leychile/navegar?idNorma=30840 (accessed on 7 July 2024).
  15. Hobson, E.A.; Smith-Vidaurre, G.; Salinas-Melgoza, A. History of nonnative Monk Parakeets in Mexico. PLoS ONE 2017, 12, e0184771. [Google Scholar] [CrossRef] [Scilit]
  16. Iriarte, J.; Lobos, G.; Jaksic, F.M. Invasive vertebrate species in Chile and their control and monitoring by governmental agencies. Rev. Chil. Hist. Nat. 2005, 78, 143–154. [Google Scholar] [CrossRef] [Scilit]
  17. Senar, J.C.; Domènech, J.; Arroyo, L.; De La Torre, I.; Gordo, Ó. An evaluation of monk parakeet damage to crops in the metropolitan area of Barcelona. Anim. Biodivers. Conserv. 2016, 39, 141–145. [Google Scholar] [CrossRef] [Scilit]
  18. Butcher, G.; Droege, S.; Ralph, C.J. Needs Assessment: Monitoring Neotropical Migratory Birds; Partners in Flight: Ithaca, NY, USA, 1992. [Google Scholar]
  19. Spreyer, M.F.; Bucher, E.H. Monk Parakeet (Myiopsitta monachus). Birds N. Am. 1998, 322, 24. [Google Scholar]
  20. Avery, M.L.; Greiner, E.C.; Lindsay, J.R.; Newman, J.; Pruett-Jones, S. Monk parakeet management at electric utility facilities in south Florida. Proc.–Vertebr. Pest Conf. 2002, 20, 140–145. [Google Scholar] [CrossRef] [Scilit]
  21. Briceño, C.; Larraechea, M.; Alvarado, S. Monk Parakeet’s (Myiopsitta monachus) Ecological Parameters after Five Decades of Invasion in Santiago Metropolis, Chile. Birds 2022, 3, 341–358. [Google Scholar] [CrossRef] [Scilit]
  22. eBird. Basic Dataset; Version: EBD_relNov-2024; Cornell Lab of Ornithology: Ithaca, NY, USA, 2024. [Google Scholar]
  23. Senar, J.C.; Carrillo-Ortiz, J.; Ortega-Segalerva, A.; Pell, F.S.E.D.; Pascual, J.; Arroyo, L.; Mazzoni, D.; Montalvo, T.; Hatchwell, B.J. The reproductive capacity of Monk Parakeets Myiopsitta monachus is higher in their invasive range. Bird Study 2019, 66, 136–140. [Google Scholar] [CrossRef] [Scilit]
  24. Briceño, C.; Surot, D.; González-Acuña, D.; Martínez, F.J.; Fredes, F. Parasitic survey on introduced monk parakeets (Myiopsitta monachus) in Santiago, Chile. Rev. Bras. Parasitol. Vet. 2017, 26, 129–135. [Google Scholar] [CrossRef] [Scilit] [PubMed]
  25. Briceño, C.; Yévenes, K.; Larraechea, M.; Sandoval-Rodríguez, A.; La Fuente, M.C.S.; Fredes, F.; Hidalgo, H.; Alcayaga, V.; Oyarzún-Ruiz, P.; Munita, C.; et al. First record of Ornithonyssus bursa (Berlese, 1888) (Mesostigmata: Macronyssidae) parasitizing invasive monk parakeets in Santiago, Chile. Rev. Bras. Parasitol. Vet. 2021, 30, e024020. [Google Scholar] [CrossRef] [Scilit] [PubMed]
  26. Sandoval-Rodríguez, A.; Marcone, D.; Alegría-Morán, R.; Larraechea, M.; Yévenes, K.; Fredes, F.; Briceño, C. Cryptosporidium spp. and Giardia spp. in Free-Ranging Introduced Monk Parakeets from Santiago, Chile. Animals 2021, 11, 801. [Google Scholar] [CrossRef] [Scilit]
  27. Briceño, C.; Marcone, D.; Larraechea, M.; Hidalgo, H.; Fredes, F.; Ramírez-Toloza, G.; Cabrera, G. Zoonotic Cryptosporidium meleagridis in urban invasive monk parakeets. Zoonoses Public Health 2023, 70, 705–710. [Google Scholar] [CrossRef] [Scilit] [PubMed]
  28. Larraechea, M.; Hidalgo, H.; Ramírez-Toloza, G.; Sandoval-Rodríguez, A.; Ibáñez, D.B.; Briceño, C. Seropositividad a Chlamydophila psittaci en cotorras argentinas (Myiopsitta monachus) invasoras de la ciudad de Santiago de Chile. Rev. Chil. Infectología 2023, 40, 35–41. [Google Scholar] [CrossRef] [Scilit]
  29. Crowley, S.L. Parrots and people: Human dimensions of naturalized parrots. In Naturalized Parrots of the World: Distribution, Ecology, and Impacts of the World’s Most Colorful Colonizers; Princeton University Press: Princeton, NJ, USA, 2021; pp. 41–53. [Google Scholar]
  30. Ribeiro, J.; Carneiro, I.; Nuño, A.; Porto, M.; Edelaar, P.; Luna, Á.F.; Reino, L. Investigating people’s perceptions of alien parakeets in urban environments. Eur. J. Wildl. Res. 2021, 67, 3. [Google Scholar] [CrossRef] [Scilit]
  31. Larraechea, M.; Dos Santos, A.; Cerda, C.; Alegría-Morán, R.; Briceño, C. Perceptions and attitudes toward control of invasive monk parakeets (Myiopsitta monachus) in citizens from Santiago metropolis, Chile. Prev. Vet. Med. 2025, 242, 106577. [Google Scholar] [CrossRef] [Scilit]
  32. Sol, D.; Santos, D.M.; Feria, E.; Clavell, J. Habitat Selection by the Monk Parakeet during Colonization of a New Area in Spain. Condor 1997, 99, 39–46. [Google Scholar] [CrossRef] [Scilit]
  33. Peng, S.; Broom, D.M. The sustainability of keeping birds as pets: Should any be kept? Animals 2021, 11, 582. [Google Scholar] [CrossRef] [Scilit]
  34. Crowley, S.L.; Hinchliffe, S.; McDonald, R.A. The parakeet protectors: Understanding opposition to introduced species management. J. Environ. Manag. 2019, 229, 120–132. [Google Scholar] [CrossRef] [Scilit]
  35. Dawson Pell, F.S.E.; Senar, J.C.; Franks, D.W.; Hatchwell, B.J. Fine-scale genetic structure reflects limited and coordinated dispersal in the colonial monk parakeet, Myiopsitta Monachus. Mol. Ecol. 2021, 30, 1531–1544. [Google Scholar] [CrossRef] [Scilit]
  36. Martín-Taboada, A.; Román Muñoz, A.; Romero, D. Assessing the risk of Myiopsitta monachus (Monk Parakeet) invasion: Global perspectives and implications. Ornithol. Appl. 2025, 127, 3. [Google Scholar] [CrossRef] [Scilit]
  37. Thoma, C.T.; Makridou, K.N.; Bakaloudis, D.E. Spatial and Temporal Trends in the Invasion Dynamics of the Ring-Necked Parakeet (Psittacula krameri) in the Urban Complex of Thessaloniki, Greece. Animals 2026, 16, 224. [Google Scholar] [CrossRef] [Scilit] [PubMed]
  38. Blanco-González, J.; Cayuela, L.; Enríquez, F.; Aldea, I.; Ortiz, J.C.; López-Rull, I. Developing best management practices for the invasive monk parakeet (Myiopsitta monachus) in urban environments. NeoBiota 2025, 98, 163–196. [Google Scholar] [CrossRef] [Scilit]
  39. Marcolin, F.; Alba, R.; Mammola, S.; Assandri, G.; Ilahiane, L.; Rubolini, D.; Reino, L.; Chamberlain, D. Non-native parrot species expand the trait space of avian communities by filling empty niches in urban areas. Ibis 2026. [Google Scholar] [CrossRef] [Scilit]
  40. Edelaar, P.; Roques, S.; Hobson, E.A.; Gonçalves da Silva, A.; Avery, M.L.; Russello, M.A.; Senar, J.C.; Wright, T.F.; Carrete, M.; Tella, J.L. Shared genetic diversity across the global invasive range of the monk parakeet suggests a common restricted geographic origin and the possibility of convergent selection. Mol. Ecol. 2015, 24, 2164–2176. [Google Scholar] [CrossRef] [Scilit] [PubMed]
  41. Calzada Preston, C.E.; Pruett-Jones, S. The Number and Distribution of Introduced and Naturalized Parrots. Diversity 2021, 13, 412. [Google Scholar] [CrossRef] [Scilit]
  42. Eberhard, J.R. Breeding Biology of the Monk Parakeet. Wilson Bull. 1998, 110, 463–473. [Google Scholar]
  43. Forshaw, J.M. Parrots of the World; Princeton University Press: Princeton, NJ, USA, 2010. [Google Scholar]
  44. Senar, J.C.; Moya, A.; Pujol, J.; Tomas, X.; Hatchwell, B.J. Sex and age effects on monk parakeet home-range variation in the urban habitat. Diversity 2021, 13, 648. [Google Scholar] [CrossRef] [Scilit]
  45. Gonçalves da Silva, A.; Eberhard, J.R.; Wright, T.F.; Avery, M.L.; Rusello, M.A. Genetic evidence for high propagule pressure and long-distance dispersal in Monk parakeet (Myiopsitta monachus) invasive populations. Mol. Ecol. 2010, 19, 3336–3350. [Google Scholar] [CrossRef] [Scilit]
  46. Mazzoni, D.; Pascual, J.; Arroyo, L.; Montalvo, T.; González-Solís, J.; Senar, J.C. The diet of Monk Parakeet Myiopsitta monachus nestlings in an urban area: A study using stable isotopes. Bird Study 2021, 68, 455–461. [Google Scholar] [CrossRef] [Scilit]
  47. Postigo, J.; Carrillo-Ortiz, J.; Domènech, J.; Tomàs, X.; Arroyo, L.; Senar, J.C. Dietary plasticity in an invasive species and implications for management: The case of the monk parakeet in a Mediterranean city. Anim. Biodivers. Conserv. 2021, 44, 185–194. [Google Scholar] [CrossRef] [Scilit]
  48. Bucher, E.H.; Aramburú, R.M. Land-use changes and monk parakeet expansion in the Pampas grasslands of Argentina. J. Biogeogr. 2014, 41, 1160–1170. [Google Scholar] [CrossRef] [Scilit]
  49. Martin, L.F.; Bucher, E.H. Natal dispersal and first breeding age in monk parakeets. Auk 1993, 110, 930–933. [Google Scholar] [CrossRef] [Scilit]
  50. Briceño, C.; Sandoval-Rodríguez, A.; Yévenes, K.; Larraechea, M.; Morgado, A.; Chappuzeau, C.; Muñoz, V.; Dufflocq, P.; Olivares, F. Interactions between Invasive Monk Parakeets (Myiopsitta monachus) and Other Bird Species during Nesting Seasons in Santiago, Chile. Animals 2019, 9, 923. [Google Scholar] [CrossRef] [Scilit] [PubMed]
  51. Burger, J.; Gochfeld, M. Exotic monk parakeets (Myiopsitta monachus) in New Jersey: Nest site selection, rebuilding following removal, and their urban wildlife appeal. Urban Ecosyst. 2009, 12, 185–196. [Google Scholar] [CrossRef] [Scilit]
  52. eBird. eBird: An Online Database of Birds Distribution and Abundance; Cornell Laboratory of Ornithology: Ithaca, NY, USA, 2021; Available online: http://www.ebird.org (accessed on 5 November 2024).
  53. eBird. eBird: About. Available online: https://ebird.org/about (accessed on 5 November 2024).
  54. Sullivan, B.L.; Aycrigg, J.L.; Barry, J.H.; Bonney, R.; Bruns, N.E.; Cooper, C.B.; Damoulas, T.; Dhondt, A.A.; Dietterich, T.G.; Farnsworth, A.; et al. The eBird enterprise: An integrated approach to development and application of citizen science. Biol. Conserv. 2014, 169, 31–40. [Google Scholar] [CrossRef] [Scilit]
  55. Kosmala, M.; Wiggins, A.; Swanson, A.; Simmons, B. Assessing data quality in citizen science. Front. Ecol. Environ. 2016, 14, 551–560. [Google Scholar] [CrossRef] [Scilit]
  56. Callaghan, C.T.; Gawlik, D.E. Efficacy of eBird data as an aid in conservation planning and monitoring. J. Field Ornithol. 2015, 86, 298–304. [Google Scholar] [CrossRef] [Scilit]
  57. eBird. Publications. Available online: https://science.ebird.org/en/research-and-conservation/publications (accessed on 5 November 2025).
  58. eBird. 2025 Year in Review: eBird, Merlin, Macaulay Library, and Birds of the World. 2025. Available online: https://ebird.org/news/2025-year-in-review (accessed on 24 May 2025).
  59. Avery, M.L. Monk Parakeet (Myiopsitta monachus Boddaert, 1783). In Invasive Birds: Global Trends and Impacts; Downs, C.T., Hart, L.A., Eds.; CAB International: Wallingford, UK, 2020; pp. 76–84. [Google Scholar]
  60. CABI Compendium. Myiopsitta monachus (Monk Parakeet). 2010. Available online: https://www.cabidigitallibrary.org/doi/10.1079/cabicompendium.74616 (accessed on 7 July 2024).
  61. Invasive Species Specialist Group. Myiopsitta monachus. 2010. Available online: http://www.iucngisd.org/gisd/species.php?sc=1021 (accessed on 21 July 2024).
  62. OECD. Urban Population by City Size [Data File]. 2019. Available online: https://web.archive.org/web/20190603220158/https:/data.oecd.org/popregion/urban-population-by-city-size.htm (accessed on 17 September 2024).
  63. World Bank. Available online: https://data.worldbank.org/ (accessed on 5 November 2025).
  64. Lindén, A.; Mäntyniemi, S. Using the negative binomial distribution to model overdispersion in ecological count data. Ecology 2011, 92, 1414–1421. [Google Scholar] [CrossRef] [Scilit] [PubMed]
  65. Russello, M.A.; Avery, M.L.; Wright, T.F. Genetic evidence links invasive Monk parakeet populations in the United States to the international pet trade. BMC Evol. Biol. 2008, 8, 217. [Google Scholar] [CrossRef] [Scilit] [PubMed]
  66. Souviron-Priego, L.; Román Muñoz, A.; Olivero, J.; Vargas, M.; Fa, J.E. The legal international wildlife trade favours invasive species establishment: The monk and ring-necked parakeets in Spain. Ardeola 2018, 65, 233–246. [Google Scholar] [CrossRef] [Scilit]
  67. Viana, I.R.; Strubbe, D.; Zocche, J.J. Monk parakeet invasion success: A role for nest thermoregulation and bactericidal potential of plant nest material? Biol. Invasions 2016, 18, 1305–1315. [Google Scholar] [CrossRef] [Scilit]
  68. Di Santo, M.; Battisti, C.; Bologna, M.A. Interspecific interactions in nesting and feeding urban sites among introduced Monk Parakeet (Myiopsitta monachus) and syntopic bird species. Ethol. Ecol. Evol. 2017, 29, 138–148. [Google Scholar] [CrossRef] [Scilit]
  69. Van Bael, S.; Pruett-Jones, S. Exponential population growth of Monk Parakeets in the United States. Wilson Bull. 1996, 108, 584–588. [Google Scholar]
  70. Dickinson, J.L.; Zuckerberg, B.; Bonter, D.N. Citizen science as an ecological research tool: Challenges and benefits. Annu. Rev. Ecol. Evol. Syst. 2010, 41, 149–172. [Google Scholar] [CrossRef] [Scilit]
  71. Royle, K.; Donner, W.B. The distribution of naturalized parrot populations. In Naturalized Parrots of the World: Distribution, Ecology, and Impacts of the World’s Most Colorful Colonizers; Princeton University Press: Princeton, NJ, USA, 2021; pp. 22–40. Available online: https://www.researchgate.net/profile/Martina-Carrete/publication/357461547_1_The_World_Parrot_Trade/links/650bf7ddc05e6d1b1c1f32e7/1-The-World-Parrot-Trade.pdf#page=22 (accessed on 14 June 2025).
  72. Falcón, W.; Tremblay, R.L. From the cage to the wild: Introductions of Psittaciformes to Puerto Rico. PeerJ 2018, 6, e5669. [Google Scholar] [CrossRef] [Scilit]
  73. Robinson, O.J.; Ruiz-Gutierrez, V.; Fink, D. Correcting for bias in distribution modelling for rare species using citizen science data. Divers. Distrib. 2018, 24, 460–472. [Google Scholar] [CrossRef] [Scilit]
  74. eBird. eBird Basic Dataset; Cornell Lab of Ornithology: Ithaca, NY, USA, 2023; Available online: https://support.ebird.org/en/support/solutions/articles/48000795278 (accessed on 6 April 2024).
  75. Beza, E.; Steinke, J.; Van Etten, J.; Reidsma, P.; Fadda, C.; Mittra, S.; Mathur, P.; Kooistra, L. What are the prospects for citizen science in agriculture? Evidence from three continents on motivation and mobile telephone use of resource-poor farmers. PLoS ONE 2017, 12, e0175700. [Google Scholar] [CrossRef] [Scilit]
  76. Poushter, J. Smartphone Ownership and Internet Usage Continues to Climb in Emerging Economies; Pew Research Center: Washington, DC, USA, 2016; Volume 22, pp. 1–44. Available online: https://www.pewresearch.org/global/2016/02/22/smartphone-ownership-and-internet-usage-continues-to-climb-in-emerging-economies/ (accessed on 11 January 2026).
  77. Brammer, J.R.; Brunet, N.D.; Burton, A.C.; Cuerrier, A.; Danielsen, F.; Dewan, K.; Herrmann, T.M.; Jackson, M.V.; Kennett, R.; Larocque, G.; et al. The role of digital data entry in participatory environmental monitoring. Conserv. Biol. 2016, 30, 1277–1287. [Google Scholar] [CrossRef] [Scilit]
  78. Da Silva, S.; Matsushita, R.; Esquierro, L. The Granular Size Concept in Avian Ecology: A Critical Analysis of eBird Data Bias Using the Bird Rank Abundance Distribution. Birds 2023, 4, 330–336. [Google Scholar] [CrossRef] [Scilit]
  79. Tang, B.; Clark, J.S.; Gelfand, A.E. Modeling spatially biased citizen science effort through the eBird database. Environ. Ecol. Stat. 2021, 28, 609–630. [Google Scholar] [CrossRef] [Scilit]
  80. da Silva Carneiro, I.F. New Neighbours to Gossip About: People’s Attitudes Towards Alien Parakeets in Porto. Master’s Thesis, University of Porto, Porto, Portugal, 2018. Available online: https://www.proquest.com/openview/f4b23c372c9273659aabbe5ecbd78204/1?pq-origsite=gscholar&cbl=2026366&diss=y (accessed on 11 January 2026).
  81. Lourenço, R.; Godinho, C.; Salgueiro, P.A.; Pereira, P.F. Estimating changes in distribution trend of alien birds in urban areas using citizen science data. Urban Ecosyst. 2024, 27, 2165–2178. [Google Scholar] [CrossRef] [Scilit]
  82. Monk Parakeet eBird. Monk Parakeet. Available online: https://ebird.org/species/monpar (accessed on 5 November 2023).
  83. Postigo, J.L.; Strubbe, D.; Mori, E.; Ancillotto, L.; Carneiro, I.; Latsoudis, P.; Menchetti, M.; Pârâu, L.G.; Parrott, D.; Reino, L.; et al. Mediterranean versus Atlantic monk parakeets Myiopsitta monachus: Towards differentiated management at the European scale. Pest Manag. Sci. 2019, 75, 915–922. [Google Scholar] [CrossRef] [Scilit]
  84. Spanish Real Decreto 1799/2010. Listado y Catálogo Español de Especies Invasoras. 2011. Available online: https://www.boe.es/buscar/act.php?id=BOE-A-2011-19398 (accessed on 7 July 2025).
  85. Spanish Real Decreto 630/2013. Catalogo Español de Especies Invasoras. 2013. Available online: https://www.boe.es/buscar/act.php?id=BOE-A-2013-8565 (accessed on 7 July 2025).
  86. Fox, A.D.; Heldbjerg, H.; Nyegaard, T. Invasive alien birds in Denmark. Dan. Orn. Foren. Tidsskr. 2015, 109, 193–205. [Google Scholar]
  87. White, R.L.; Strubbe, D.; Dallimer, M.; Davies, Z.G.; Davis, A.J.; Edelaar, P.; Groombridge, J.; Jackson, H.A.; Menchetti, M.; Mori, E.; et al. Assessing the ecological and societal impacts of alien parrots in Europe using a transparent and inclusive evidence-mapping scheme. NeoBiota 2019, 48, 45–69. [Google Scholar] [CrossRef] [Scilit]
  88. Nishida, S.; Kitamura, W. An Influx of Non-Native Bird Species into the Natural Environment Owing to the Accidental Release of Pet Birds in Japan. Animals 2024, 14, 221. [Google Scholar] [CrossRef] [Scilit]
  89. Jokimäki, J. (University of Lapland, Rovaniemi, Finland). Personal communication, 2026.
  90. Lera, D.N.; Cozzani, N.; Camina, J.L.; Tella, J.L.; Zalba, S. Urban Parrots in Southern South America: Challenges and Opportunities. Birds 2024, 5, 752–773. [Google Scholar] [CrossRef] [Scilit]
  91. Dunn, A.M.; Hatcher, M.J. Parasites and biological invasions: Parallels, interactions, and control. Trends Parasitol. 2015, 31, 189–199. [Google Scholar] [CrossRef] [Scilit]
  92. Keesing, F.; Belden, L.K.; Daszak, P.; Dobson, A.; Harvell, C.D.; Holt, R.D.; Hudson, P.; Jolles, A.E.; Jones, K.E.; Mitchell, C.E.; et al. Impacts of biodiversity on the emergence and transmission of infectious diseases. Nature 2010, 468, 647–652. [Google Scholar] [CrossRef] [Scilit]
  93. Estrada-Peña, A.; Ostfeld, R.S.; Peterson, A.T.; Poulin, R.; de la Fuente, J. Effects of environmental change on zoonotic disease risk: An ecological primer. Trends Parasitol. 2014, 30, 205–214. [Google Scholar] [CrossRef] [Scilit]
  94. Mori, E.; Sala, J.P.; Fattorini, N.; Menchetti, M.; Montalvo, T.; Senar, J.C. Ectoparasite sharing among native and invasive birds in a metropolitan area. Parasitol. Res. 2019, 118, 399–409. [Google Scholar] [CrossRef] [Scilit]
  95. López, J.; Mogedas, M.; Ballesteros, C.; Martín-Maldonado, B.; Sacristán, I.; García, R.; Ortiz, J.C.; Esperón, F. Infectious agents present in monk parakeet (Myiopsitta monachus) and rose-ringed parakeet (Psittacula krameri) invasive species in the parks of Madrid and Seville, Spain. Front. Vet. Sci. 2023, 10, 1162402. [Google Scholar] [CrossRef] [Scilit]
  96. Blanco-González, J.; López-Rull, I.; Cayuela, L.; Majó, N.; Busquets, N.; Montalvo, T.; Senar, J.C. Native and invasive bird interactions increase the spread of Newcastle disease in urban environments. Biol. Invasions 2024, 26, 845–855. [Google Scholar]
  97. Raso, T.F.; Ferreira, V.L.; Timm, L.N.; Tostes Abreu, M.D. Psittacosis domiciliary outbreak associated with monk parakeets (Myiopsitta monachus) in Brazil: Need for surveillance and control. JMM Case Rep. 2014, 1, e003343. [Google Scholar] [CrossRef] [Scilit]
  98. Sandoval-Rodríguez, A.; Barría, A.; Méndez, M.A.; Larraechea, M.; Briceño, C. Population structure of free-ranging introduced monk parakeets (Myiopsitta monachus) in Santiago, Chile. Conserv. Genet. 2024, 25, 1325–1335. [Google Scholar] [CrossRef] [Scilit]
  99. Araos, A.; Cerda, C.; Skewes, O.; Cruz, G.; Tapia, P.; Baeriswyl, F. Estimated economic impacts of seven invasive alien species in Chile. Hum. Dimens. Wildl. 2020, 25, 398–403. [Google Scholar] [CrossRef] [Scilit]
  100. Cerda, C.; Araos, A.; Bidegain, I. Negative impacts on tourism of yellow jackets (Vespula germanica) in wilderness areas of Chile. In Tourism, Recreation and Biological Invasions; CABI: Wallingford, UK, 2022; pp. 88–96. [Google Scholar]
  101. Castelli, E.; Viviano, E.; Torina, A.; Caputo, V.; Bongiorno, M.R. Avian mite dermatitis: An Italian case indicating the establishment and spread of Ornithonyssus bursa (Acari: Gamasida: Macronyssidae) (Berlese, 1888) in Europe. Int. J. Dermatol. 2015, 54, 795–799. [Google Scholar] [CrossRef] [Scilit]
  102. Mori, E.; Ancillotto, L.; Groombridge, J.; Howard, T.; Smith, V.S.; Menchetti, M. Macroparasites of introduced parakeets in Italy: A possible role for parasite-mediated competition. Parasitol. Res. 2015, 114, 3277–3281. [Google Scholar]
  103. Orton, D.I.; Warren, L.J.; Wilkinson, J.D. Avian mite dermatitis. Clin. Exp. Dermatol. 2000, 25, 129–131. [Google Scholar] [CrossRef] [Scilit]
  104. Madariaga, M.J.; Caraballo, D.A.; Teijeiro, M.L.; Boeri, E.J.; Cadario, M.E. Molecular Detection and Genotyping of Chlamydia psittaci in Birds in Buenos Aires City, Argentina. Animals 2024, 14, 3286. [Google Scholar] [CrossRef] [Scilit]
  105. Ul-Rahman, A.; Ishaq, H.M.; Raza, M.A.; Shabbir, M.Z. Zoonotic potential of Newcastle disease virus: Old and novel perspectives related to public health. Rev. Med. Virol. 2022, 32, e2246. [Google Scholar]
  106. López-Ramírez, S.; Muñoz, A.R. A Local Approach to Better Understand the Spread and Population Growth of the Monk Parakeet as an Invasive Species. Birds 2022, 3, 277–284. [Google Scholar] [CrossRef] [Scilit]
  107. Strubbe, D.; Matthysen, E. Establishment success of invasive ring-necked and monk parakeets in Europe. J. Biogeogr. 2009, 36, 2264–2278. [Google Scholar] [CrossRef] [Scilit]
  108. Hernández-Brito, D.; Blanco, G.; Tella, J.L.; Carrete, M. A protective nesting association with native species counteracts biotic resistance for the spread of an invasive parakeet from urban into rural habitats. Front. Zool. 2020, 2, 13. [Google Scholar] [CrossRef] [Scilit]
  109. Briceño, C.; Knapp, L.A.; Silva, A.; Paredes, J.; Avendaño, I.; Vargas, A.; Sotomayor, J.; Vila, A. Detecting an increase in an Endangered huemul Hippocamelus bisulcus population following removal of cattle and cessation of poaching in coastal Patagonia, Chile. Oryx 2013, 47, 273–279. [Google Scholar] [CrossRef] [Scilit]
  110. United Nations Statistics Division. Demographic and Social Statistics. 2024. Available online: https://unstats.un.org/unsd/demographic-social/index.cshtml (accessed on 15 December 2024).
Figure 1. Global distribution of native (orange) and invasive (blue) Monk Parakeets (Myiopsitta monachus) retrieved from cumulative sightings on eBird platform during the period 1900–2024.
Birds 07 00031 g001
Figure 2. Temporal change in the number of countries and cities with documented Monk Parakeet records across periods for (A) Global, (B) Exotic, and (C) Native distributions. Values shown are descriptive summaries of compiled records.
Birds 07 00031 g002
Figure 3. Pooled association between country-level Gross Domestic Product (GDP) per capita and the number of cities with documented Monk Parakeet records across all country–period observations.
Birds 07 00031 g003
Table 1. Summary of information about Monk Parakeet distribution since 1900. Columns are organized according to global, exotic or native distributions. Cumulative increase in reported countries and cities is shown. Percentage (%) of increase represents descriptive changes in the number of cities between consecutive periods, and the total percentage increase represents the cumulative change from the first to the last period. Inferential uncertainty around the temporal trend is provided by the regression-based estimates reported in Section 3, Results.
DistributionGlobalExoticNative
Range of YearsN° CountriesN° Cities% IncreaseN° CountriesN° Cities% IncreaseN° CountriesN° Cities% Increase
1900–1984666.359.37.
1985–199416138209.091199167.80539557.14
1995–200417208150.7212132133.33576194.87
2005–201428289138.9423208157.58581106.58
2015–202436434150.1731333160.105101124.69
Total 657.58 564.41 938.28
Disclaimer/Publisher’s Note: The statements, opinions and data contained in all publications are solely those of the individual author(s) and contributor(s) and not of MDPI and/or the editor(s). MDPI and/or the editor(s) disclaim responsibility for any injury to people or property resulting from any ideas, methods, instructions or products referred to in the content.