Article

Integrated Ecological and Molecular Assessment of a Crown-of-Thorns Seastar (Acanthaster planci) Outbreak in the Gulf of Oman (UAE)


1
Department of Earth and Environmental Sciences (DISAT), University of Milan-Bicocca, Piazza della Scienza 1, 20126 Milan, Italy
2
MaRHE Center—Marine Research and Higher Education Center, Magoodhoo Island, Faafu Atoll 12030, Maldives
3
NBFC—National Biodiversity Future Center, 90133 Palermo, Italy
4
Department of Biotechnology and Biosciences (BtBs), University of Milan-Bicocca, Piazza della Scienza, 2, 20126 Milan, Italy
5
Emirates Diving Association, Dubai P.O. Box 33220, United Arab Emirates
6
Sharjah Marine Science Research Centre, College of Marine Science and Aquatic Biology, University of Khorfakkan, Sharjah 18119, United Arab Emirates
*
Author to whom correspondence should be addressed.
J. Mar. Sci. Eng. 2026, 14(8), 750; https://doi.org/10.3390/jmse14080750
Submission received: 25 February 2026 / Revised: 9 April 2026 / Accepted: 15 April 2026 / Published: 20 April 2026

Abstract

Outbreaks of crown-of-thorns sea stars (CoTS) threaten coral reef integrity and biodiversity, yet local dynamics and short-term responses to control remain insufficiently described. This study characterised an outbreaking Acanthaster population in two specific sites of the coast of Khor Fakkan (Gulf of Oman, United Arab Emirates) to resolve species identity, population composition, prey selection and the effects of targeted removals. All sequenced individuals clustered in two related haplotypes belonging to the species Acanthaster planci. Benthic surveys showed moderate live-coral cover, dominated by massive Porites sp. colonies. Moreover, the observations of 139 preyed colonies revealed pronounced genus-level selectivity, with branching and complex morphologies suffering disproportionately and massive forms largely avoided. However, the selection of massive Plesiastrea and Favites genera as preferred coral prey might suggest a shift towards less preferred coral in the CoTS diet, posing a severe threat to coral reefs’ integrity. Intensive removal reduced the local density, up to 86%, and provided substantial short-term relief, but continued monitoring is required to secure long-term reef resilience.

1. Introduction

Coral reefs are biodiversity hotspots increasingly threatened by multiple local and global stressors, including climate change, ocean acidification, and marine pollution [1,2]. Among biotic pressures, corallivory poses a major threat to coral health [3].
Crown-of-thorns sea stars (Acanthaster spp., CoTS) are among the most impactful corallivores, as their mass feeding activity and population density fluctuations can lead to severe losses of coral cover and structural reef complexity, amplifying the effects of other disturbances [4,5,6]. CoTS populations naturally fluctuate between low-density states and episodic outbreaks characterised by unsustainably high densities [5,7]. These events are generally classified as primary or secondary outbreaks. Primary outbreaks arise from prolonged, repeated recruitment events, resulting in populations with a broad, evenly represented range of size classes [8]. In contrast, secondary outbreaks are typically driven by a single, intense recruitment pulse that produces high and spatially concentrated densities, with size-frequency distributions dominated by a few size classes and often approximating a normal distribution [5,8]. Both outbreak types can result in a substantial decline of coral cover and reef-associated biomass, potentially leading to phase shifts in the benthic community structure [5,8]. Although historically rare, occurring approximately every 50–80 years, CoTS outbreaks appear to be increasing in frequency under contemporary anthropogenic and climatic pressures, including nutrient enrichment, habitat degradation, and ocean warming, hypothesised to enhance larval survival and contribute to outbreak formation [9,10,11].
During outbreaks, CoTS exert a strong impact on reef ecosystems through intense feeding activity. While feeding, individuals evert their stomachs and release extracellular digestive enzymes that macerate coral tissue, leaving characteristic feeding scars and exposed skeletons on consumed colonies [12,13]. Numerous studies have documented a marked preference for branching coral taxa, particularly within the families Acroporidae and Pocilloporidae, and a general avoidance of massive corals such as those belonging to the genus Porites [4,14,15,16,17,18]. However, CoTS feeding behaviour is flexible, and dietary shifts have been observed when preferred taxa are scarce. Under such conditions, individuals may consume higher proportions of less-preferred coral genera, consistent with density-dependent predation dynamics driven by prey availability [4,17,18,19]. Feeding selectivity is further influenced by coral morphology and spatial accessibility, which affect encounter rates and handling efficiency [14,20]. As a result, predation by Acanthaster spp. is widely regarded as a major biotic threat to coral reefs worldwide, contributing substantially to ecosystem degradation [5,21].
The ecological interpretation of CoTS outbreaks is further complicated by taxonomic uncertainty within the genus Acanthaster. Currently, five species are recognised: Acanthaster cf. solaris from the Pacific, Acanthaster brevispinus [22] from the Indo-Pacific, Acanthaster benziei [23] from the Red Sea, Acanthaster mauritiensis [24] from the Southern Indian Ocean, and Acanthaster planci [25] from the Northern Indian Ocean [6]. Pronounced morphological intraspecific variation, particularly in colouration, can obscure species identification and complicate outbreak assessments. Such variation may reflect intraspecific plasticity or the coexistence of multiple species within the same habitat, with important implications for understanding outbreak dynamics [6,23,26,27,28,29,30]. Although crown-of-thorns sea stars have been reported in the Gulf of Oman for several decades, surveys indicated generally low population densities and limited ecological impact ([31]). However, localised infestations and increases in abundance have been documented since the late 1990s, with evidence of coral community shifts associated with CoTS predation ([32]). In addition, recurrent outbreaks have been reported in nearby Oman reefs, occasionally reaching high population densities ([33]). Despite this, information on long-term trends and baseline population dynamics in the United Arab Emirates remains scarce, and no major outbreak had been formally documented in the region before 2024 ([34]).
The impacts of CoTS outbreaks have been widely documented across the Indo-Pacific, including the Indian Ocean, Southeast Asia, and the Pacific [4,8,13,14]. This broad geographic distribution highlights the potential vulnerability of diverse reef systems, including those in the Gulf of Oman. In the United Arab Emirates, the most recent confirmed CoTS outbreak was reported by Seveso et al. [34]. In January 2024, two sites off Khor Fakkan (Sharjah, UAE), Martini Bay and Hole in the Wall Bay, exhibited sea star densities exceeding commonly accepted outbreak thresholds (>15 individuals ha−1), above which coral mortality is typically observed with a mean density of 179 ± 39 individuals ha−1 [5,13]. Although additional nearby sites were surveyed, these two locations were the most severely affected. The observed presence of distinct colour morphotypes suggested the possible co-occurrence of two species, namely A. planci and A. mauritiensis. While CoTS outbreaks have previously been reported from reefs near Oman [35], this event represents the first documented outbreak of comparable intensity in the UAE.
The present study aims to give further insights and analyse the first documented large-scale outbreak of Acanthaster planci in the Gulf of Oman. Specifically, it aims to (i) clarify the species composition of the CoTS community, (ii) describe population size structure and outbreak dynamics, (iii) evaluate feeding preferences in relation to coral community composition, and (iv) assess the short-term effectiveness of targeted culling. Through this integrated approach, the study aims to improve understanding of the population dynamics and ecological impacts associated with CoTS outbreaks in the Gulf of Oman, with direct relevance for reef management and mitigation strategies.

2. Materials and Methods

2.1. Study Site

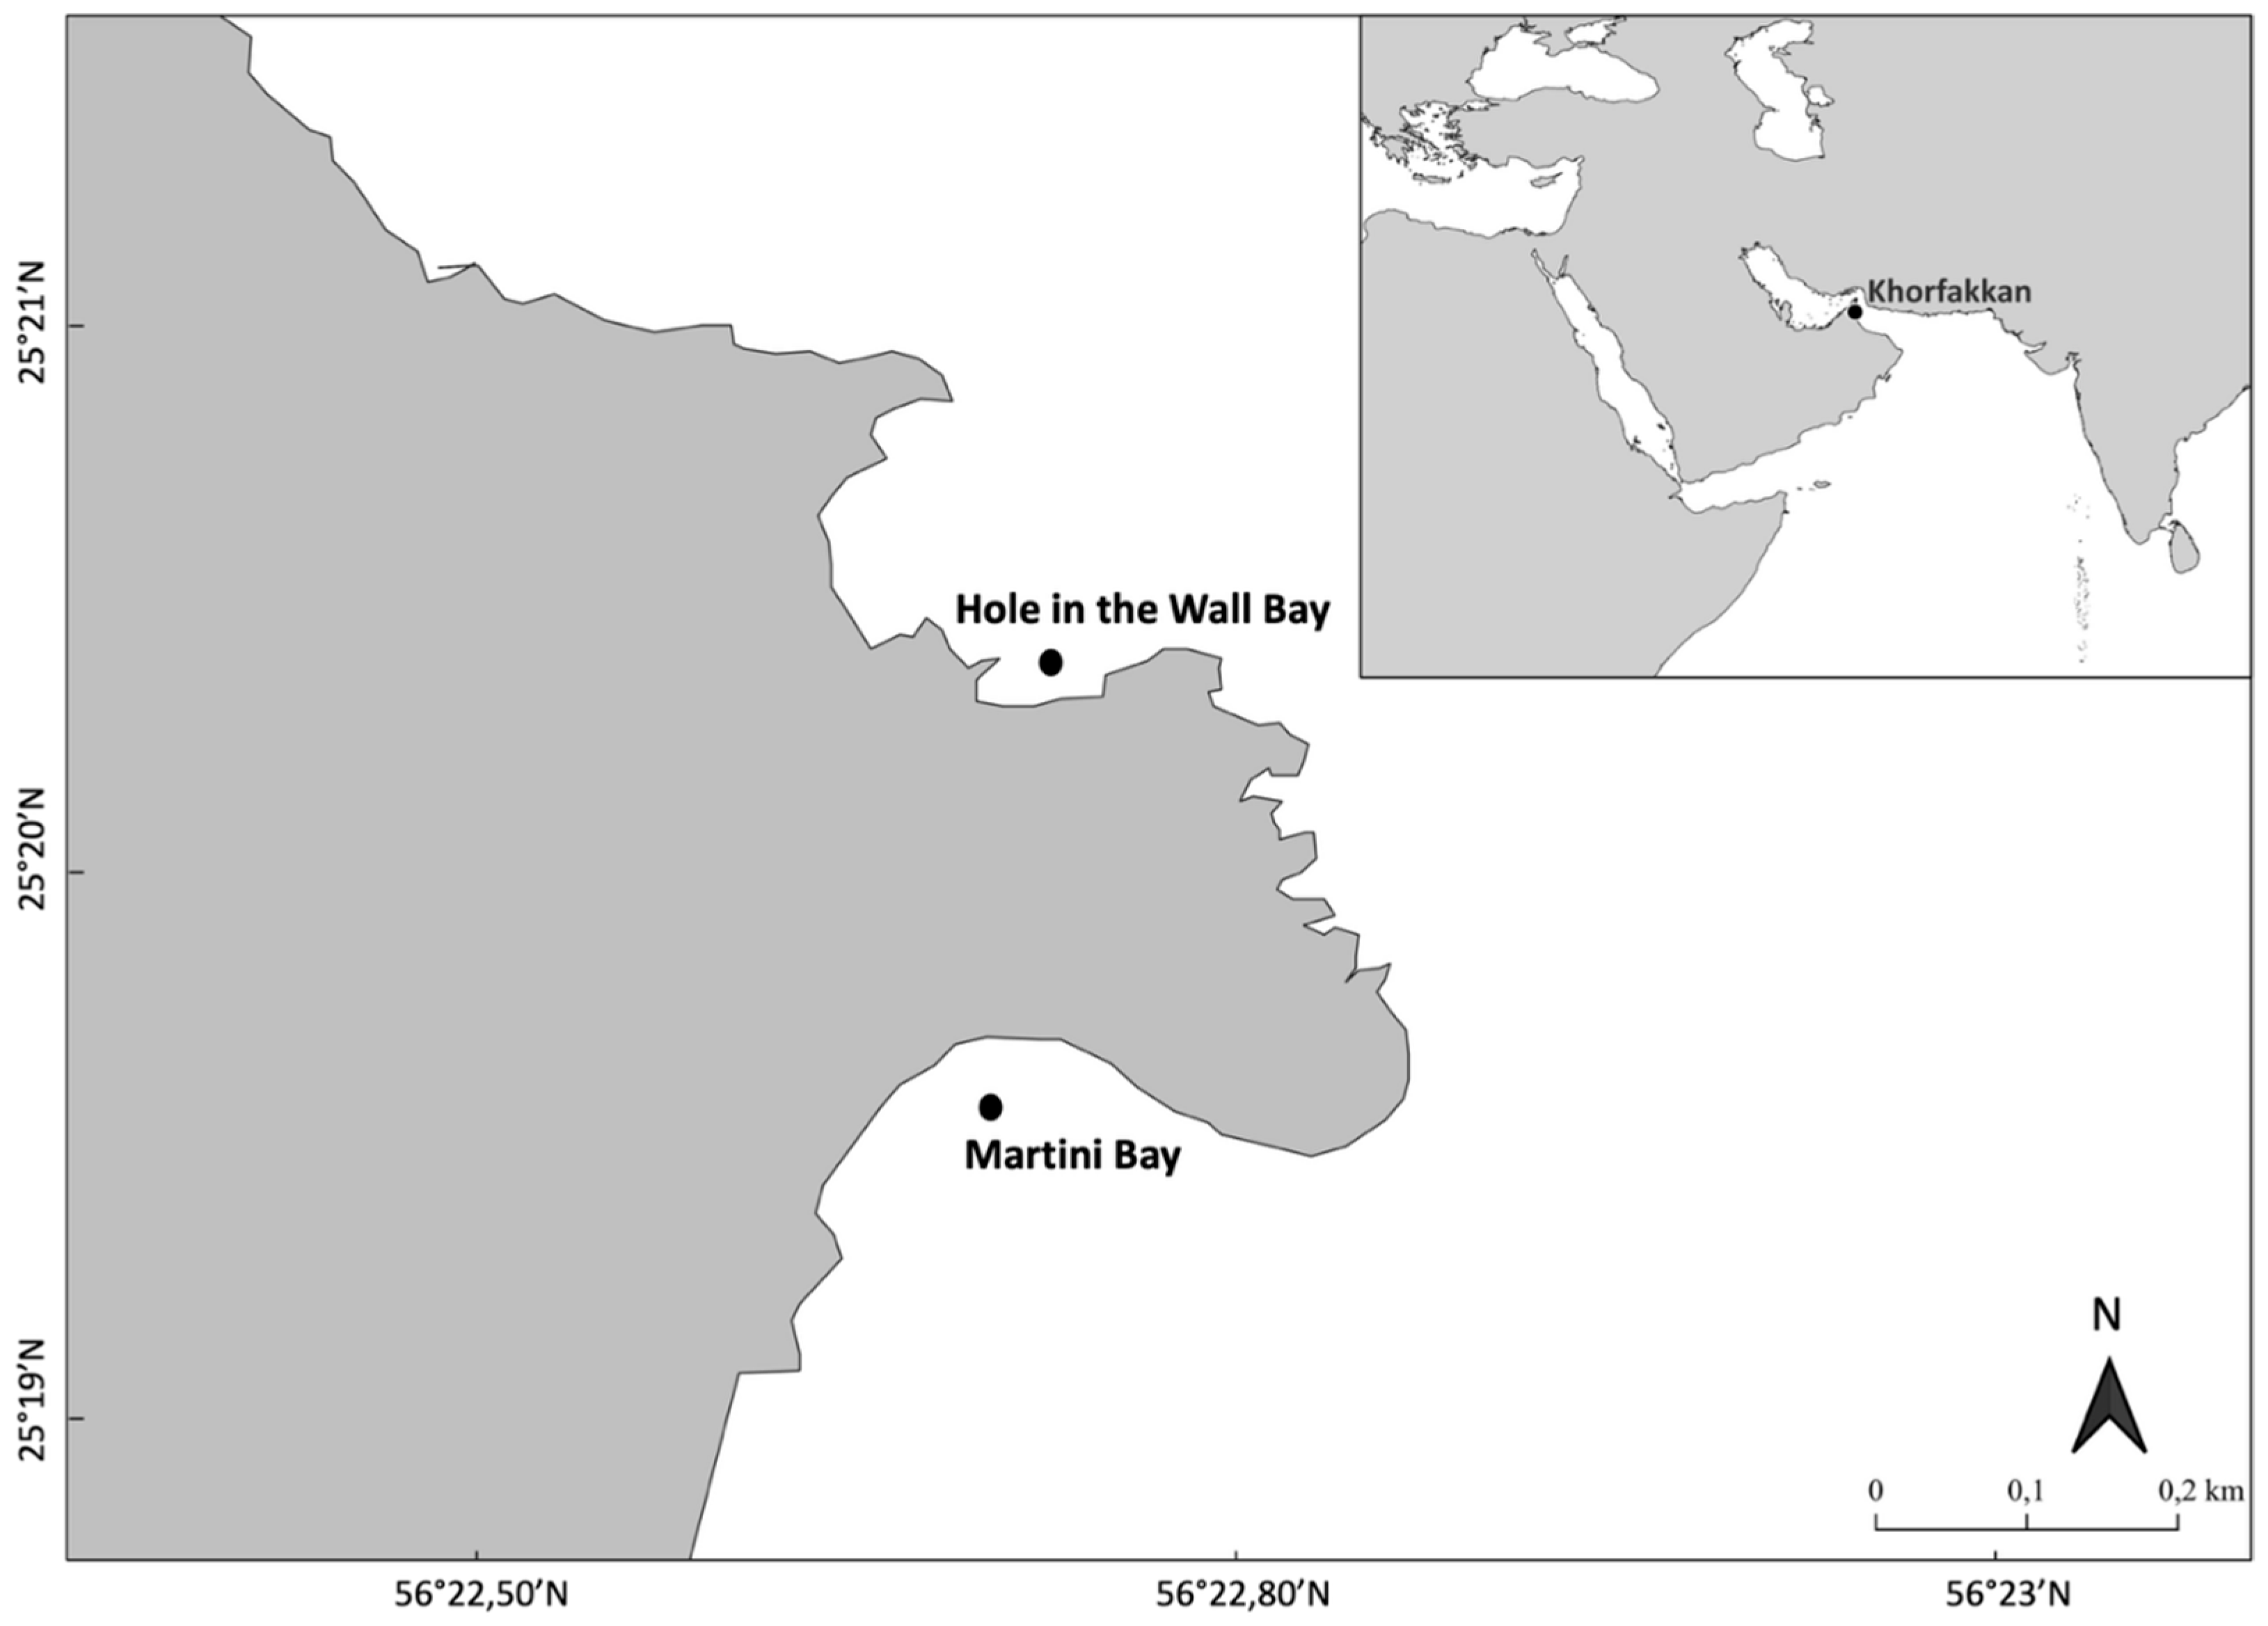
This study focused on the ecological characterisation of the crown-of-thorns sea star (CoTS) outbreak previously reported by Seveso et al. [34] in January 2024. Field surveys and sampling were conducted between April and June 2024 at the same two affected sites: Martini Bay (25°20′05″ N; 56°22′45″ E) and Hole in the Wall Bay (25°20′18″ N; 56°22′42″ E), located off the coast of Khor Fakkan (Sharjah, United Arab Emirates) in the Gulf of Oman (Figure 1). All activities were carried out by SCUBA diving at depths ranging from 2 to 8 m during daylight hours. These sites were specifically selected for further investigation of the outbreak dynamics and are the only reef sites affected by the outbreak in the area.

2.2. Molecular Identification of CoTS Morphotypes

To determine whether the observed colour morphotypes corresponded to different species, molecular analyses were conducted on a subset of individuals. A total of 24 CoTS specimens were sampled, and genomic DNA was extracted from 1 to 2 podia per individual using the DNeasy Blood & Tissue Kit (Qiagen, Hilden, Germany), following tissue lysis with 40 µL of Proteinase K for 4 h. Extracted DNA was diluted 1:50 and used to amplify a fragment of the mitochondrial cytochrome c oxidase I (COI) gene using the primer pair COIef–COIer [36]. PCR amplification followed an initial denaturation at 94 °C for 3 min, 35 cycles of denaturation at 94 °C for 30 s, annealing at 50 °C for 30 s, and elongation at 72 °C for 60 s, with a final elongation step at 72 °C for 5 min. Amplification success was verified on a 2% agarose gel. PCR products were purified and sequenced bidirectionally using an ABI 3730xl DNA Analyser (Applied Biosystems, Waltham, MA, USA). Chromatograms were visually inspected and assembled in Geneious Prime (version 2023.2.1, Biomatters, Auckland, New Zealand), and sequences were translated to verify the absence of stop codons. All sequences were deposited in GenBank under accession numbers PX893772-PX893795. Species identity was assessed by comparing sequences with those deposited in GenBank and the Barcode of Life Data System (BoLD) using BLAST (https://blast.ncbi.nlm.nih.gov/Blast.cgi, accessed on 12 November 2025) and the BoLD (https://boldsystems.org/, accessed on 12 November 2025) identification engine, respectively. To further evaluate species-level assignment, 665 publicly available Acanthaster COI sequences were retrieved from public repositories (Supplementary File S1) and aligned with the newly generated sequences using MAFFT v7.110 (E-INS-i algorithm) [37]. The alignment was collapsed into haplotypes using FaBox v1.61 [38], and phylogenetic reconstruction was performed with RAxML v8.2.12 using 1000 bootstrap replicates [39], after performing a model selection with ModelTest-NG [40]. Finally, sequences belonging to the A. planci clade were used to generate a median-joining haplotype network in PopART v1.7 [41], with haplotypes coloured according to geographic origin. Geographic regions were defined based on broad oceanographic divisions of the Indian Ocean (e.g., north-western, central, and eastern Indian Ocean), grouping sequences according to their reported sampling locations.

2.3. Benthic Community Characterisation

The benthic community structure and coral assemblage composition were assessed using a photo-quadrat approach. At each site, at depths ranging from 2 to 8 m, twenty-five 1 × 1 m2 PVC quadrats were randomly deployed with an inter-quadrat spacing of 10–20 m to capture overall variability within the reef. Photographs were collected using a Nikon D300 DSLR equipped with a Tokina 10–17 mm wide-angle lens in a Sea&Sea housing with dual strobes. Images were analysed using Coral Point Count with Excel extensions (CPCe v4.0), with 100 randomly distributed points per quadrat. Substrate coverage was quantified for the following benthic categories: live coral, dead coral with algae, sand/pavement, rock, turf algae, soft corals, sponges, and coral rubble. Scleractinian corals were additionally identified to the genus level, following Veron [42]. A total of 50 quadrats were analysed, and as no clear differences in benthic composition and coral genera were observed between the two sites, data were pooled for subsequent analyses. For each benthic category and coral genus, mean values and standard errors of the mean (SEM) were calculated.

2.4. CoTS Population Structure and Predation Assessment

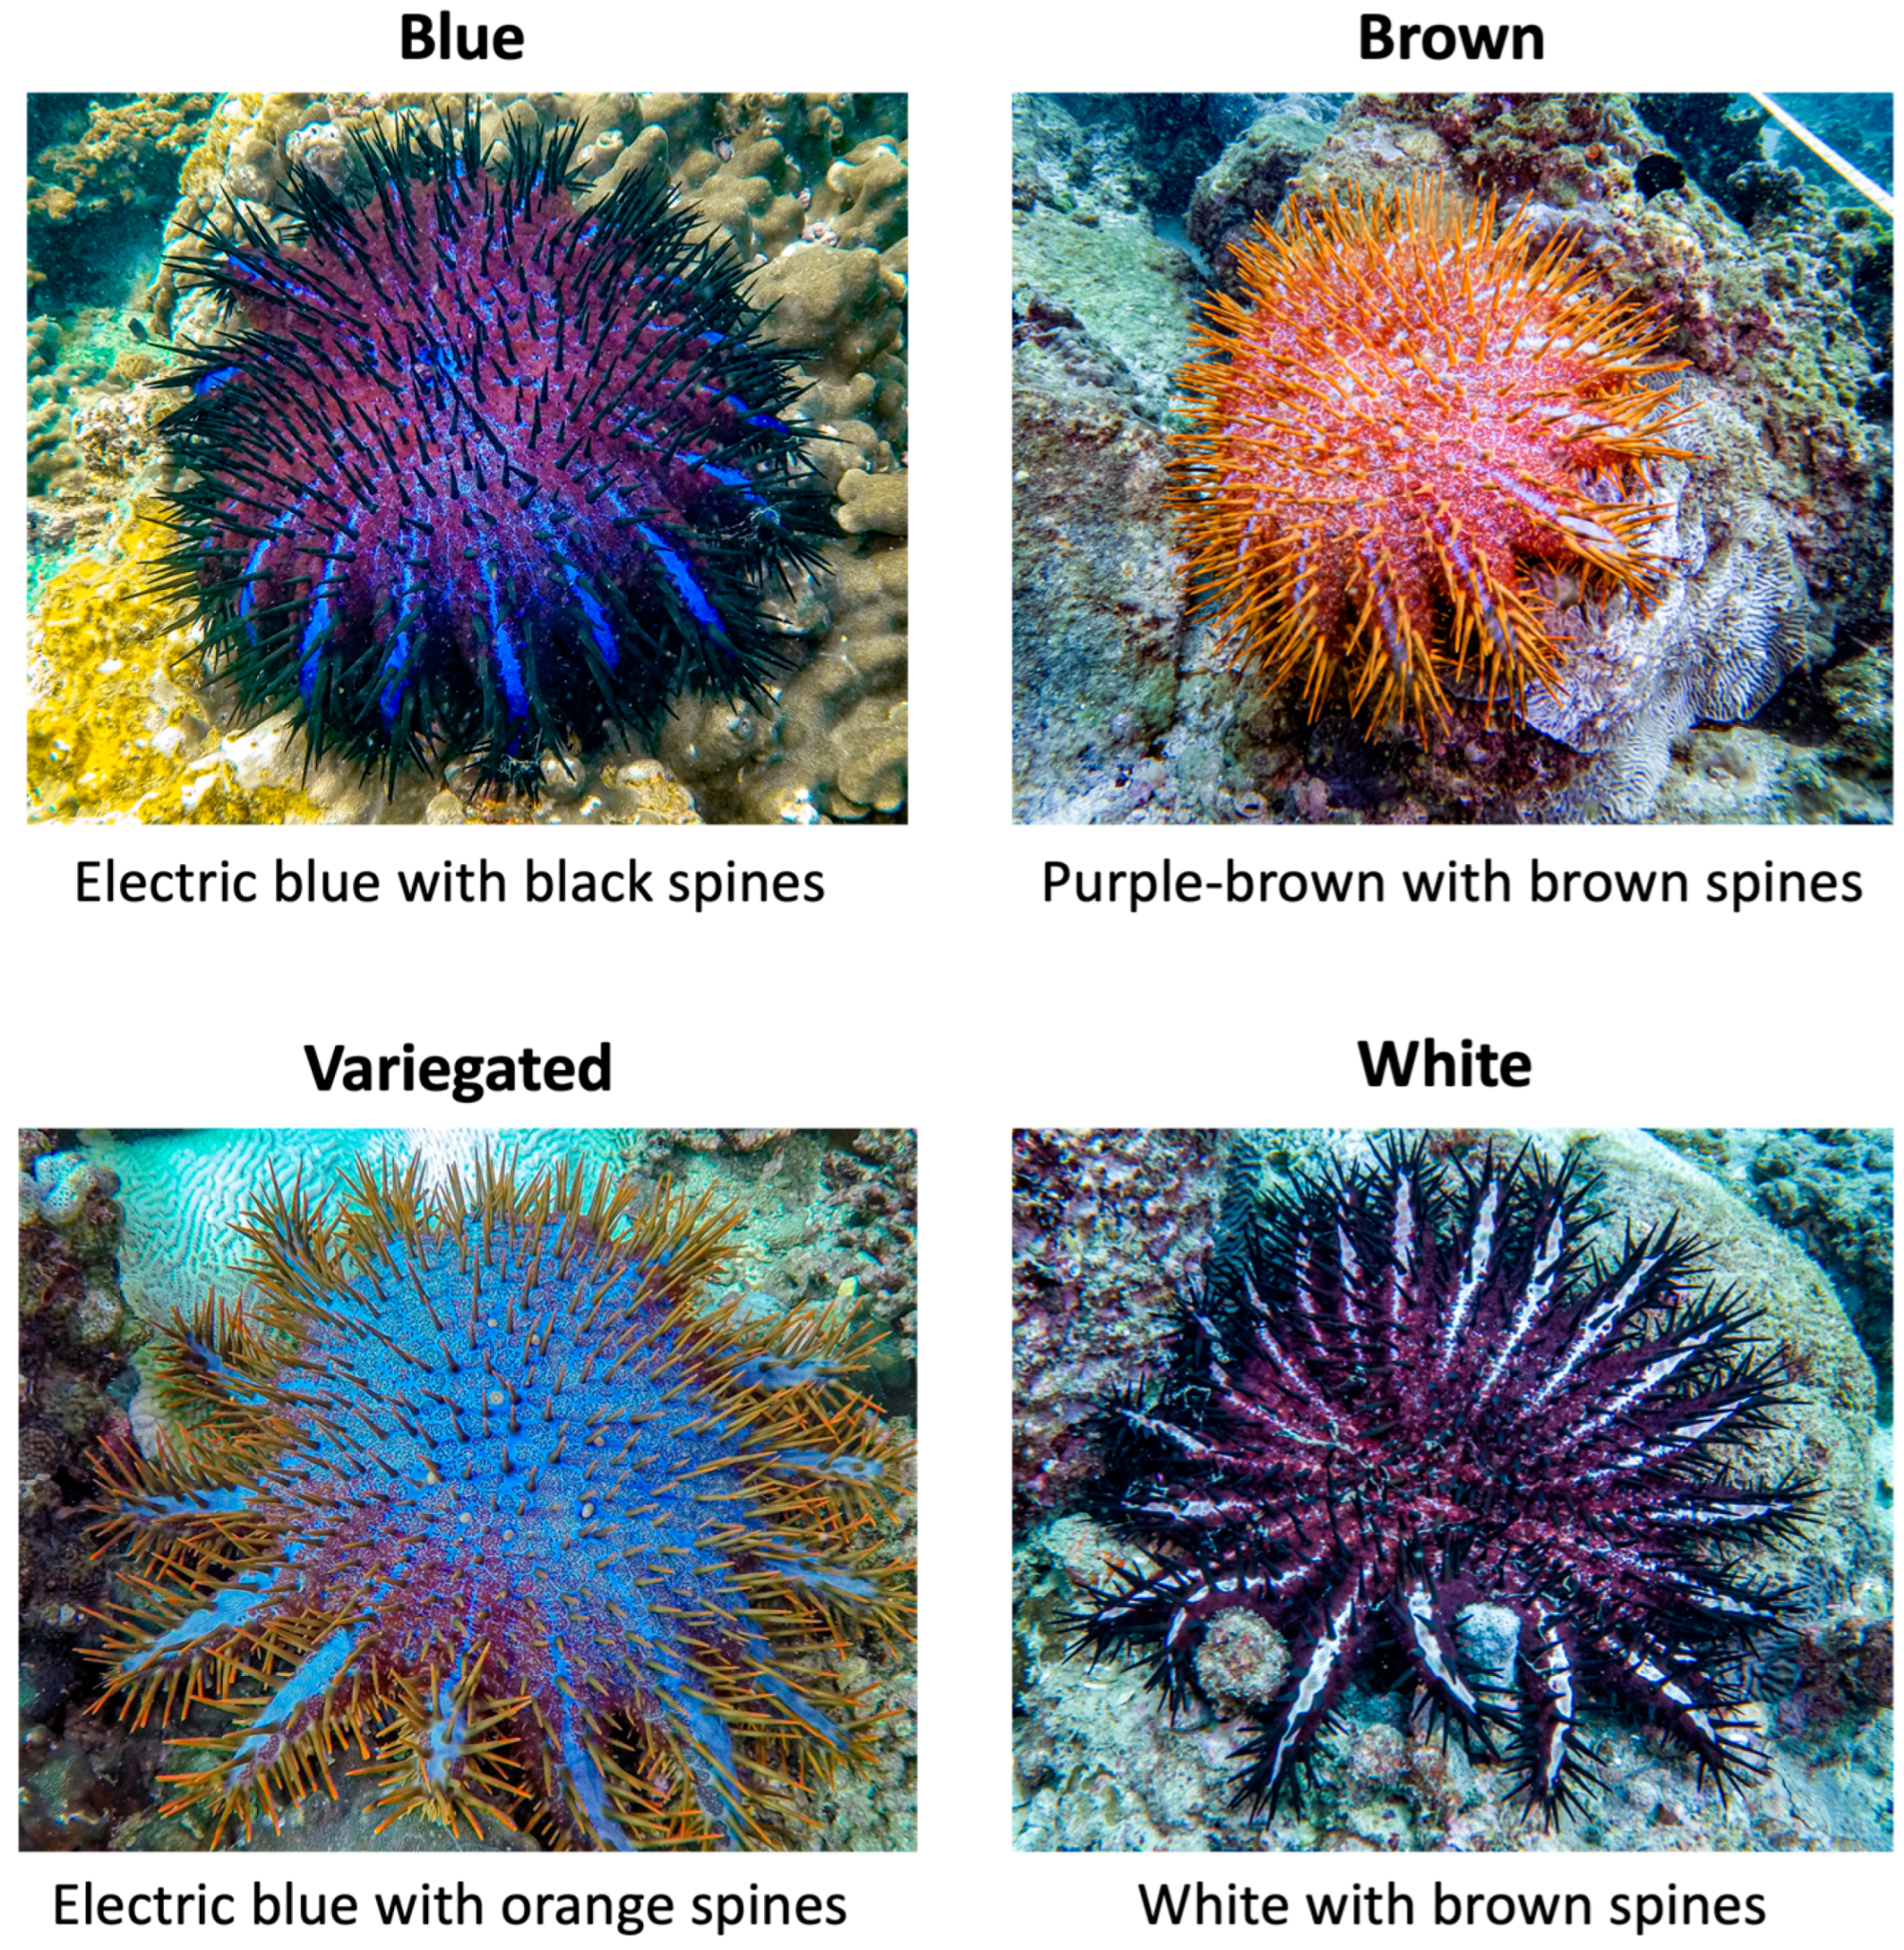
Crown-of-thorns sea star (CoTS) abundance, size structure, colour morphotype composition, and feeding activity were assessed using roving SCUBA surveys, following Montalbetti et al. [43]. Surveys were conducted for 1 h at each site within the 2–8 m depth range, for a total of six surveys per site. Upon encountering a sea star, colour morphotype was recorded (Figure 2), and maximum diameter (arm tip to opposite arm tip) was measured to the nearest centimetre using a ruler [6]. Individuals were subsequently assigned to predefined size classes (20–25 cm, 26–30 cm, 31–35 cm, 36–40 cm, 41–45 cm, and >45 cm), following Miller et al. [13].
To quantify predation pressure, feeding activity was assessed during the same surveys upon each encounter with CoTS. Following Montalbetti et al. [43], all coral colonies within a 2 m radius of a sea star were examined. Colonies exhibiting clear signs of active or recent predation, such as tissue loss, visible mucus, and fresh white skeletal scars, were classified as preyed. Older scars showing algal overgrowth or partial recolonisation were not taken into consideration. This integrated approach allowed simultaneous characterisation of CoTS population structure and associated impacts on coral assemblages.

2.5. CoTS Removal and Evaluation of Culling Effectiveness

Targeted culling operations were conducted in late April 2024 as a management intervention to reduce local densities of crown-of-thorns sea stars (CoTS) and mitigate their potential impact on reef communities. To evaluate the effectiveness of this intervention, CoTS abundance was quantified both immediately before and after the removal operations using standardised belt-transect surveys.
Baseline CoTS densities were assessed in late April before culling by laying consecutive 25 m belt transects along the reef at each site. During each transect, divers visually surveyed an area extending approximately 3 m on either side of the transect line, for a total surveyed area of 150 m2 per transect (25 m × 6 m) and recorded all encountered CoTS individuals. These pre-culling surveys provided a reference for comparison with post-removal densities.
Following baseline surveys, culling was performed by SCUBA divers who collected all encountered CoTS individuals and placed them into secured plastic bags. After removal, a small arm tip was collected from selected individuals representing different colour morphotypes and preserved in 99% ethanol for molecular analyses. Collected sea stars were subsequently euthanised using a 5% household vinegar solution, following the protocol described by Burt et al. [35].
To assess the success of the culling operation, post-removal CoTS densities were quantified in June 2024, approximately six weeks after removal, using the same belt-transect methodology. A total of 16 transects were conducted, seven in Martini Bay and nine in Hole in the Wall Bay, each covering 150 m2. This approach followed the methodology previously applied by Seveso et al. [34], allowing direct comparison of CoTS densities before and after culling. CoTS abundance was standardised and expressed as individuals per hectare (ind.·ha−1).

2.6. Statistical Analysis

Feeding preferences for different coral genera were assessed via Van der Ploeg and Scavia’s selectivity coefficient (Ei), following Lechowicz [44]. This coefficient is defined for group i as
E i = W i 1 n W i + 1 n
where Wi represents the value of Chesson’s α [43,45], and n represents the number of different prey items [44]. Chesson’s α value (Wi) is defined as
W i = r i P i / i r i / P i
where Pi represents the frequency of a prey category (coral genera) in the environment, and ri represents the frequency of the same prey category in the predator’s diet [46]. The range of the selectivity coefficient (Ei) is between −1 and 1, with 1 meaning exclusive preference and −1 meaning complete avoidance for a coral genus [47].
Normality of CoTS size distributions (pooled sample and by morphotype) was evaluated using the Shapiro–Wilk test (α = 0.05). To further assess potential differences in population structure, body diameter was also compared among the three main colour morphotypes (blue, brown, and white) and between the two study sites (Martini Bay and Hole in the Wall Bay). Differences among morphotypes were assessed using a Kruskal–Wallis test followed by pairwise Mann–Whitney U post hoc comparisons with Bonferroni correction, while differences between sites were tested using a Mann–Whitney U test. The statistical tests were performed in SPSS Statistics version 29 (IBM).

3. Results

3.1. Molecular Identification of CoTS Morphotypes

DNA extraction, amplification, and sequencing were successful for all samples, yielding 24 COI sequences of 615 bp after assembly and trimming. The obtained sequences were highly similar, differing by a single substitution in one individual, yielding two closely related haplotypes. Comparisons with sequences deposited in GenBank showed a 99.15–100% match with Acanthaster planci, with the highest similarity (100%) observed for sequences from the United Arab Emirates (GenBank accession FM174578) and the Maldives (FM174569). Similarly, comparison with the BoLD database resulted in 99.15–100% matches with A. planci.
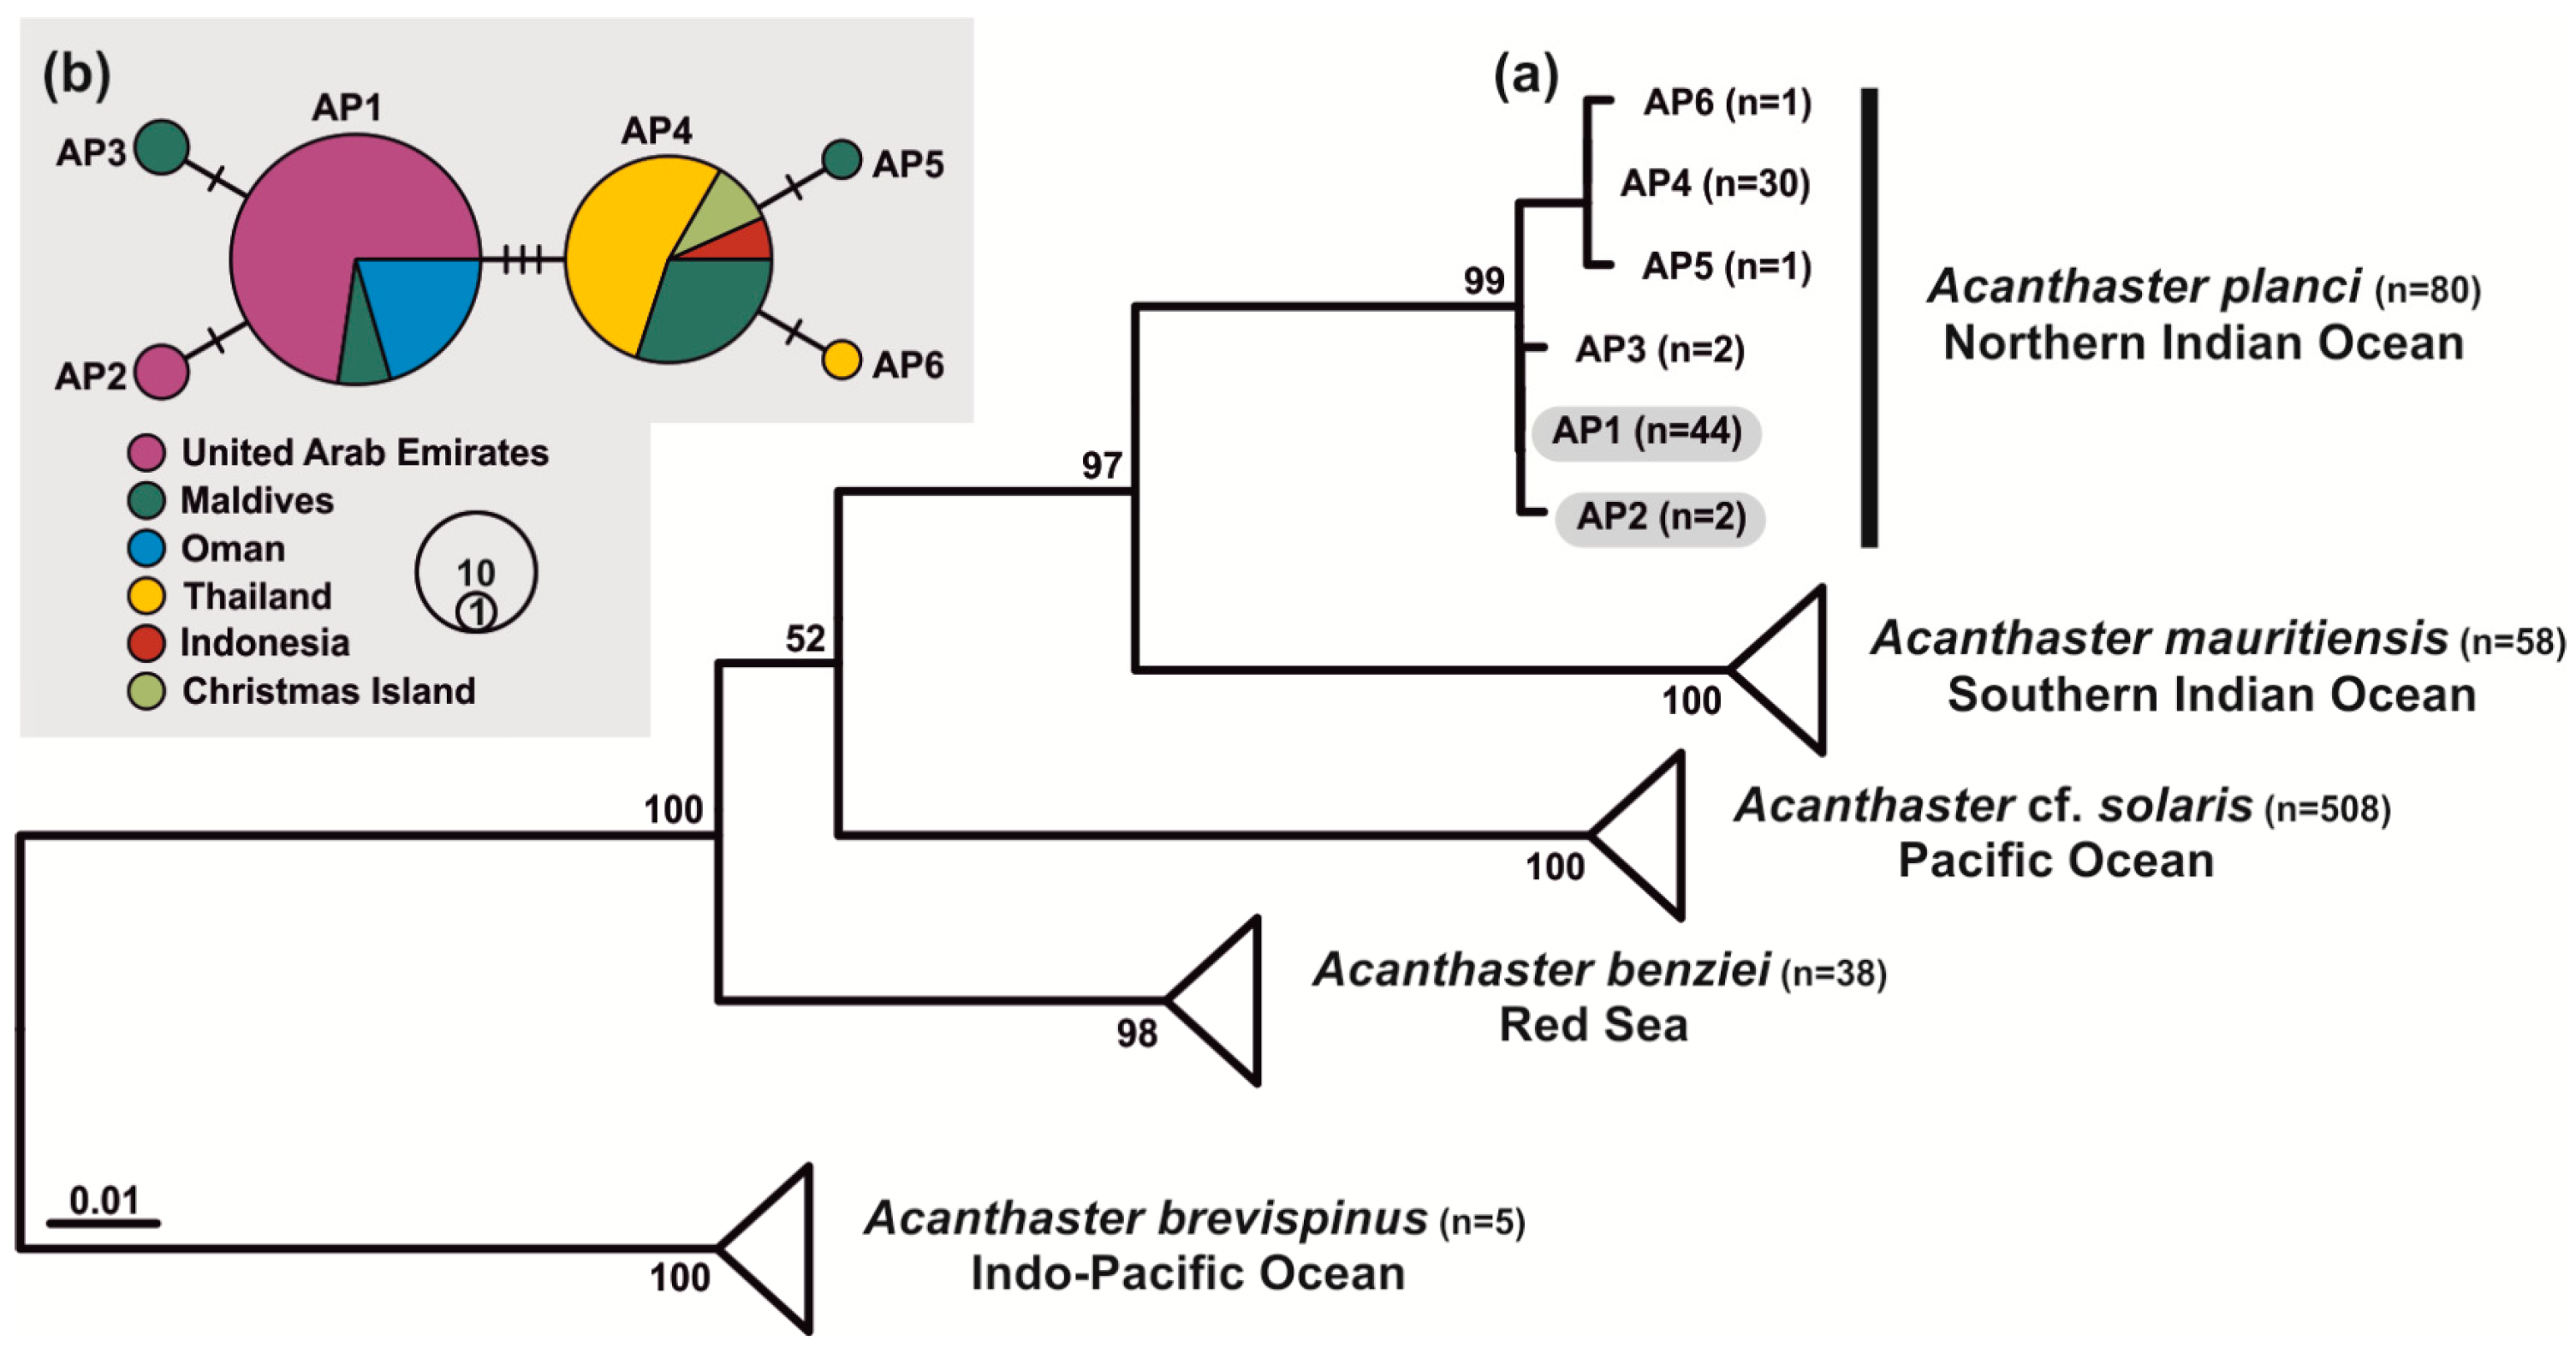
The phylogenetic reconstruction included 689 COI sequences representing 121 haplotypes and was consistent with previous studies [6,23]. All samples collected in this study clustered within the A. planci clade, which was monophyletic and strongly supported (bootstrap = 99), and clearly distinct from other Acanthaster species (Figure 3a).
The haplotype network reconstructed for 80 A. planci sequences revealed limited genetic diversity, with six haplotypes identified overall (Figure 3b). Samples from the United Arab Emirates were represented by two haplotypes: one exclusive to the UAE and one shared with specimens from the UAE, Oman, and the Maldives. Samples from the north-western Indian Ocean (UAE, Oman) were genetically separated from those from the eastern Indian Ocean (Thailand, Indonesia, Christmas Island), while samples from the central Indian Ocean (Maldives) shared haplotypes with both regions.

3.2. Benthic Community Characterisation

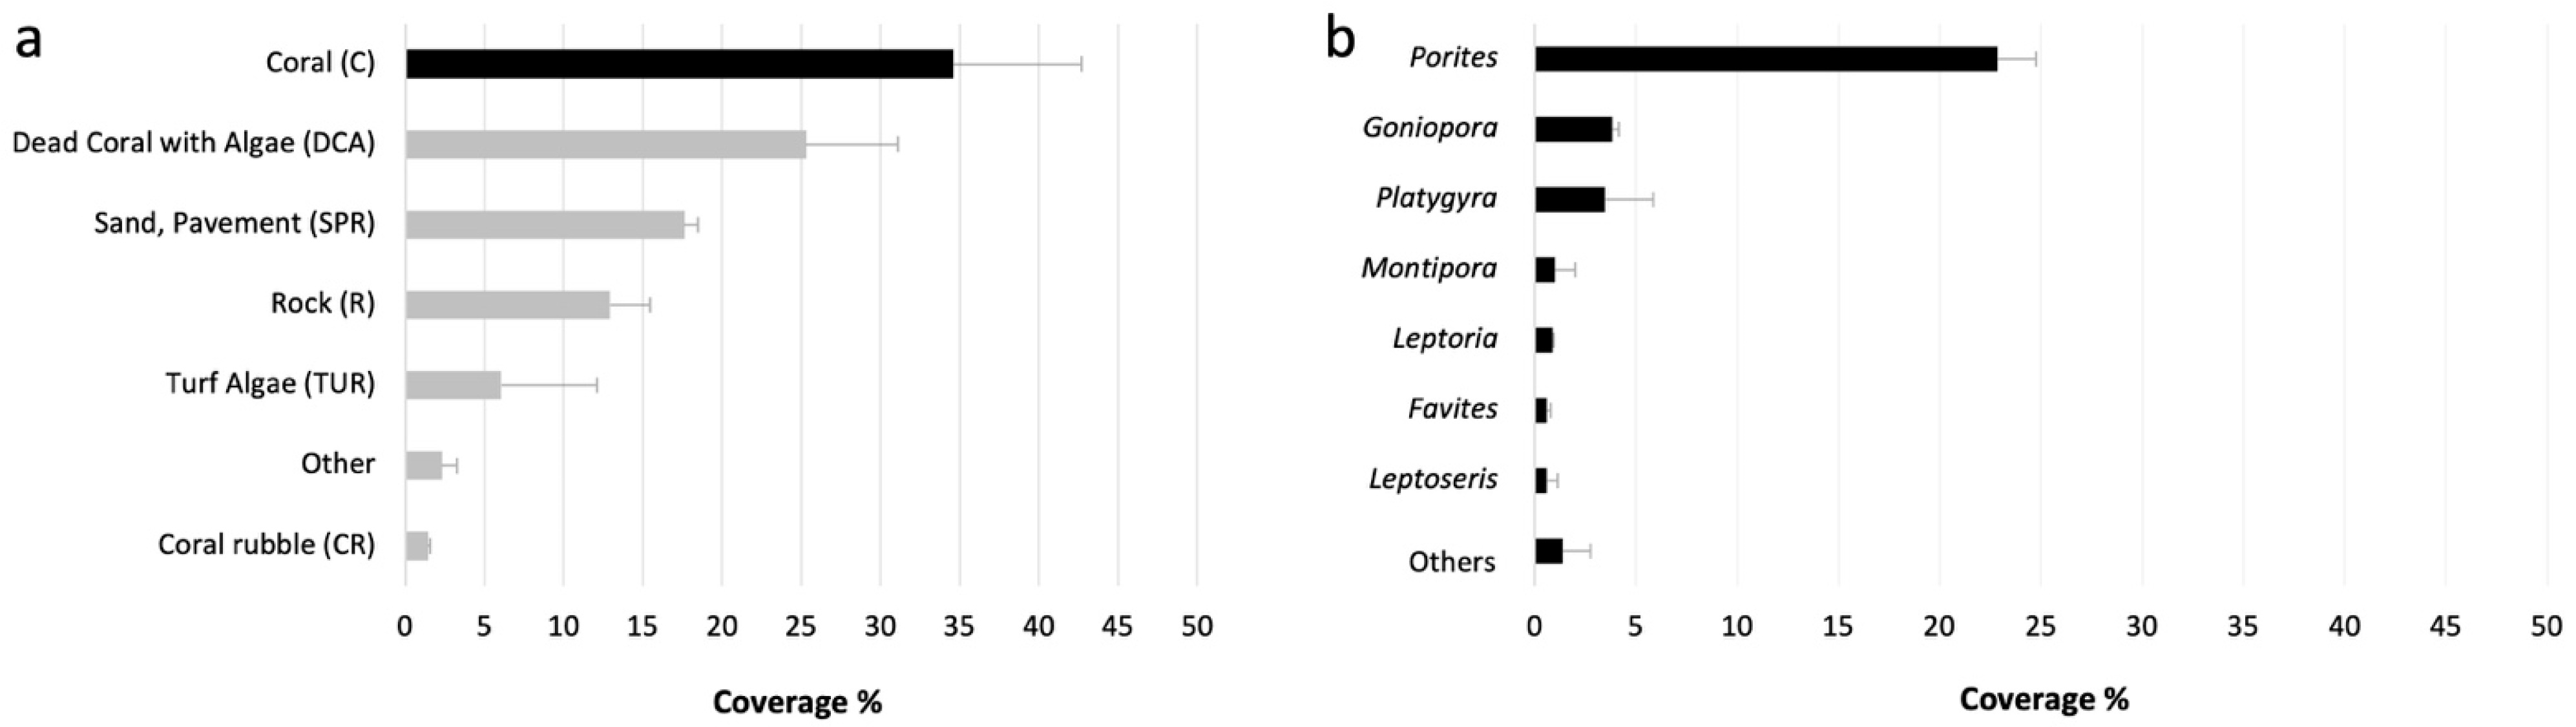
Photoquadrat analyses indicated that the benthic community at the study sites was dominated by live corals (34.6 ± 8.1%), followed by dead coral with algae (25.3 ± 5.8%), sand/pavement (17.6 ± 0.8%), rock (12.9 ± 2.5%), turf algae (6.0 ± 6.1%), other benthic components (2.3 ± 0.1%), and coral rubble (1.4 ± 0.1%) (Figure 4a). At the genus level, Porites was the most abundant coral taxon (22.8 ± 1.4%), followed by Goniopora (3.8 ± 0.3%), Platygyra (3.4 ± 2.4%), Montipora (0.9 ± 1.0%), Leptoria (0.9 ± 0.01%), Favites (0.6 ± 0.2%), and Leptoseris (0.6 ± 0.6%). Additional coral genera (Coeloseris, Astreopora, Psammocora, Mycedium, Acropora, Plesiastrea, Montastrea, Pachyseris, and Lobophyllia) were present at lower cover values and collectively accounted for 1.4 ± 1.4% of the benthic substrate (Figure 4b).

3.3. CoTS Population Structure and Coral Predation

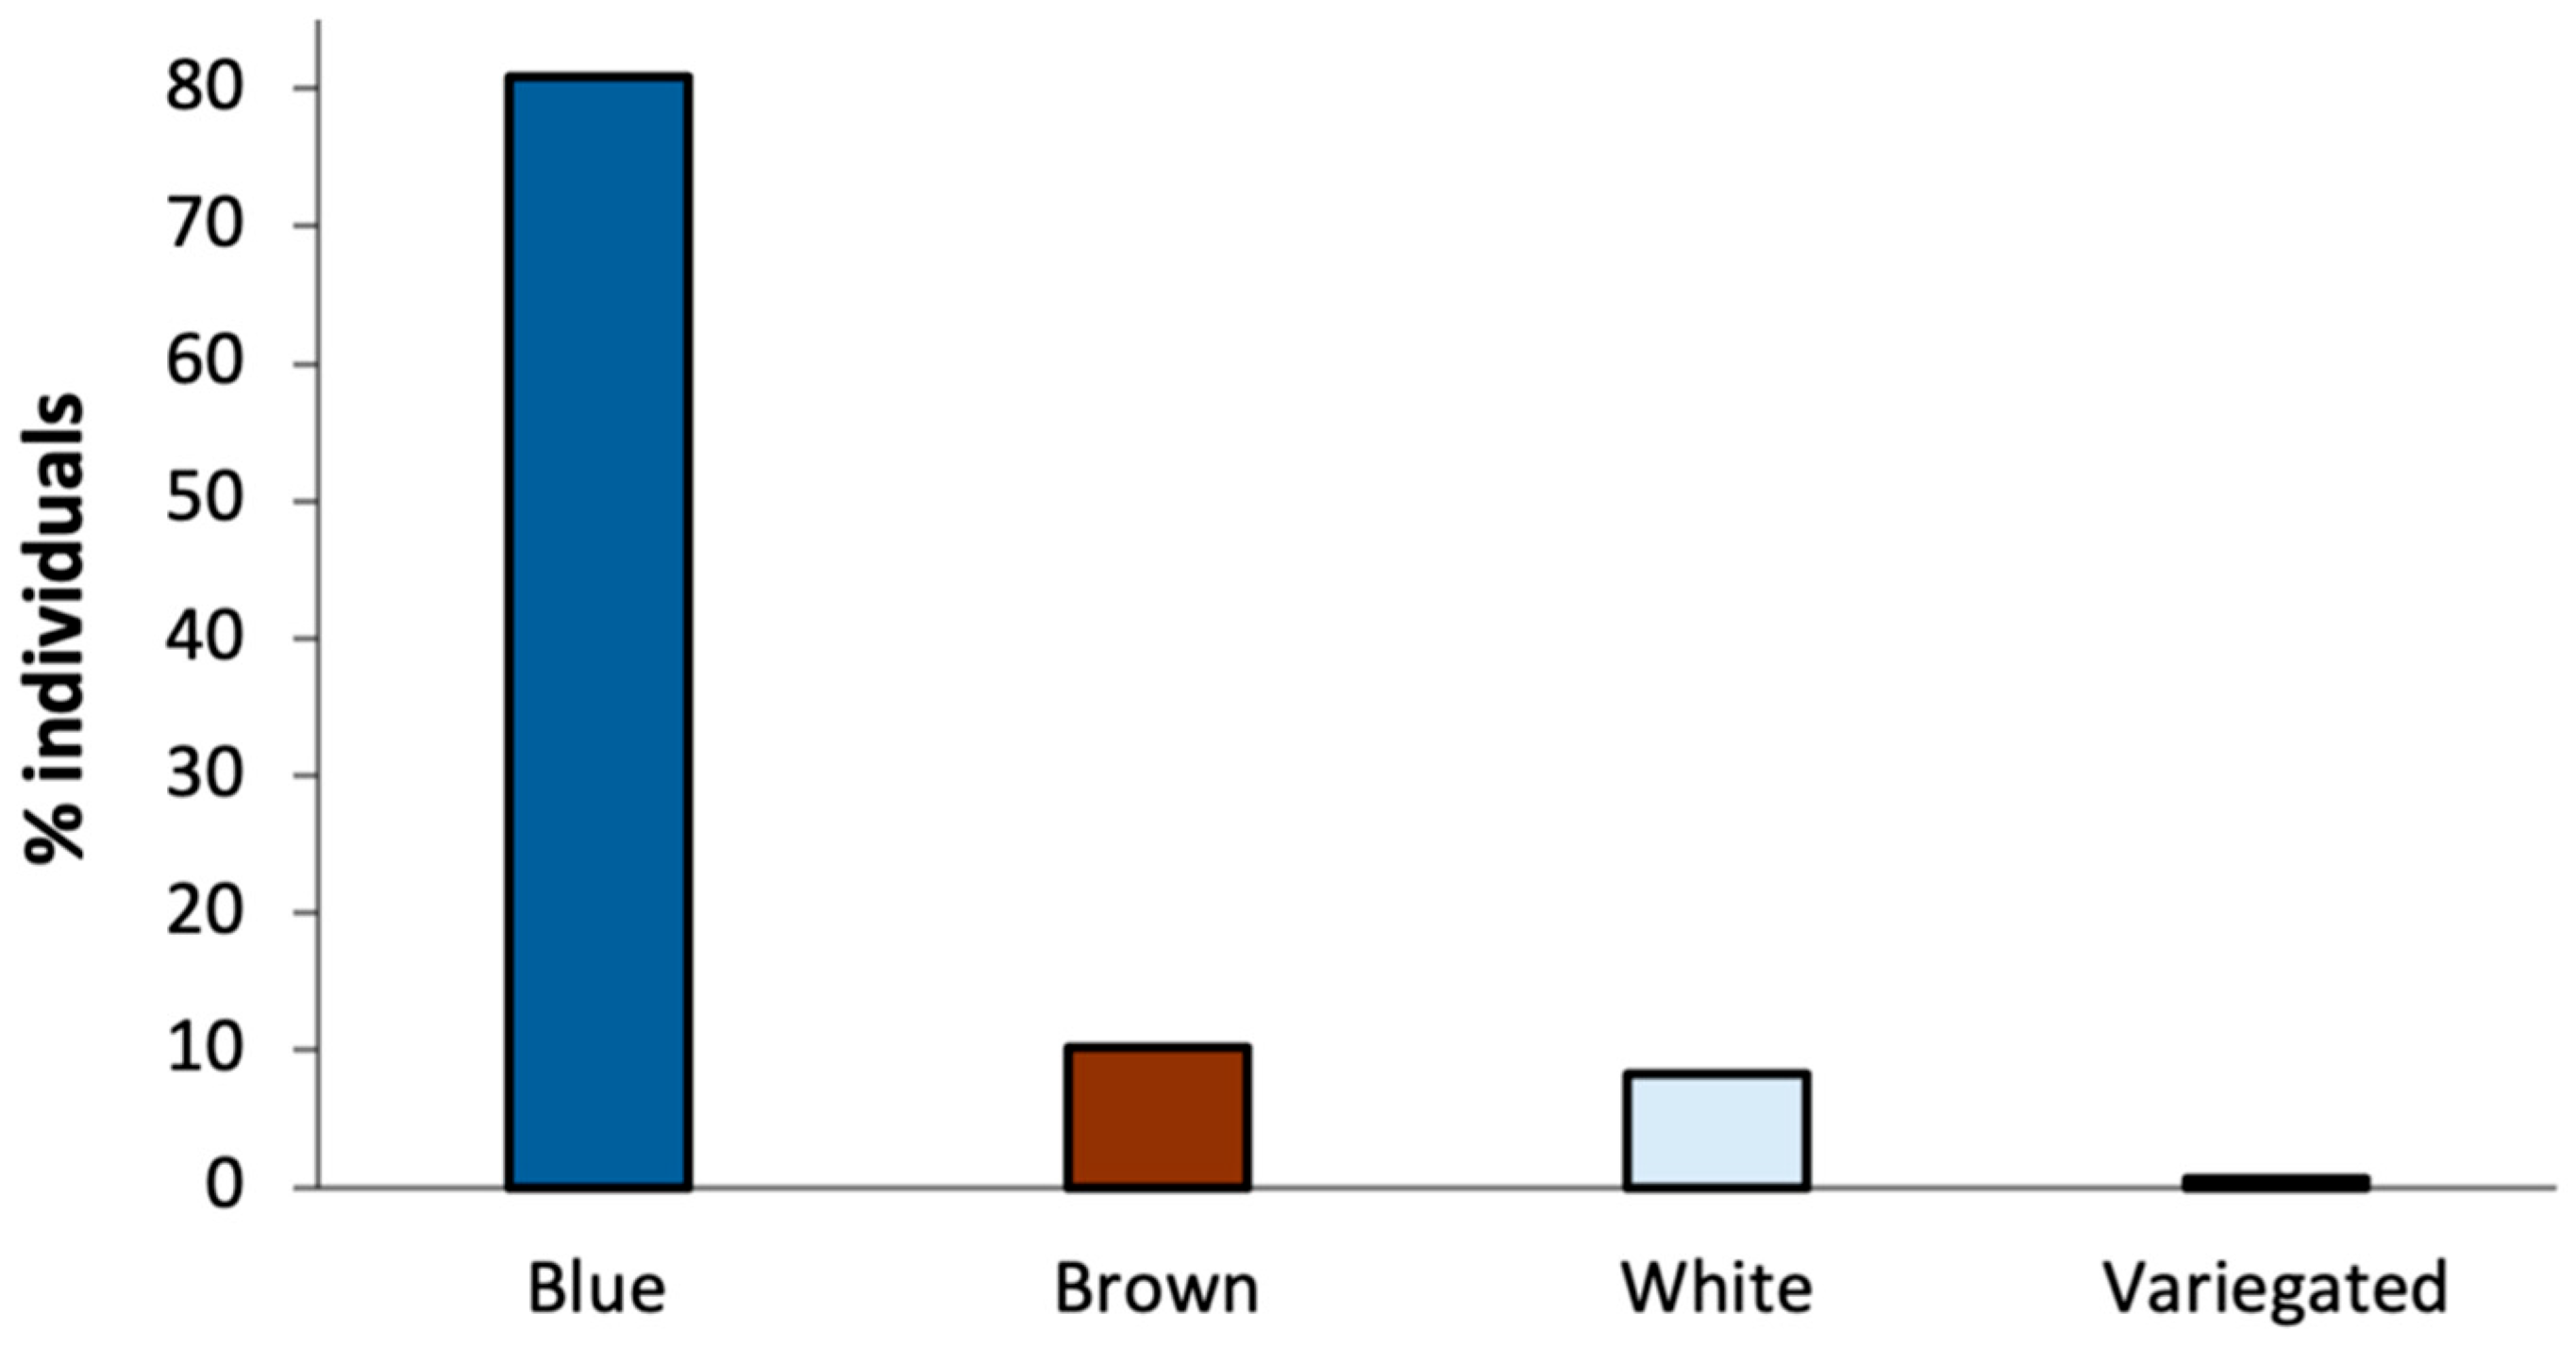
A total of 157 crown-of-thorns sea stars were recorded across the two study sites. Four colour morphotypes were identified: blue (n = 127), brown (n = 16), white (n = 13), and variegated (n = 1). The blue morphotype was the most abundant, accounting for 80.9% of all individuals, followed by the brown (10.2%), white (8.3%), and variegated (0.6%) morphotypes (Figure 5).
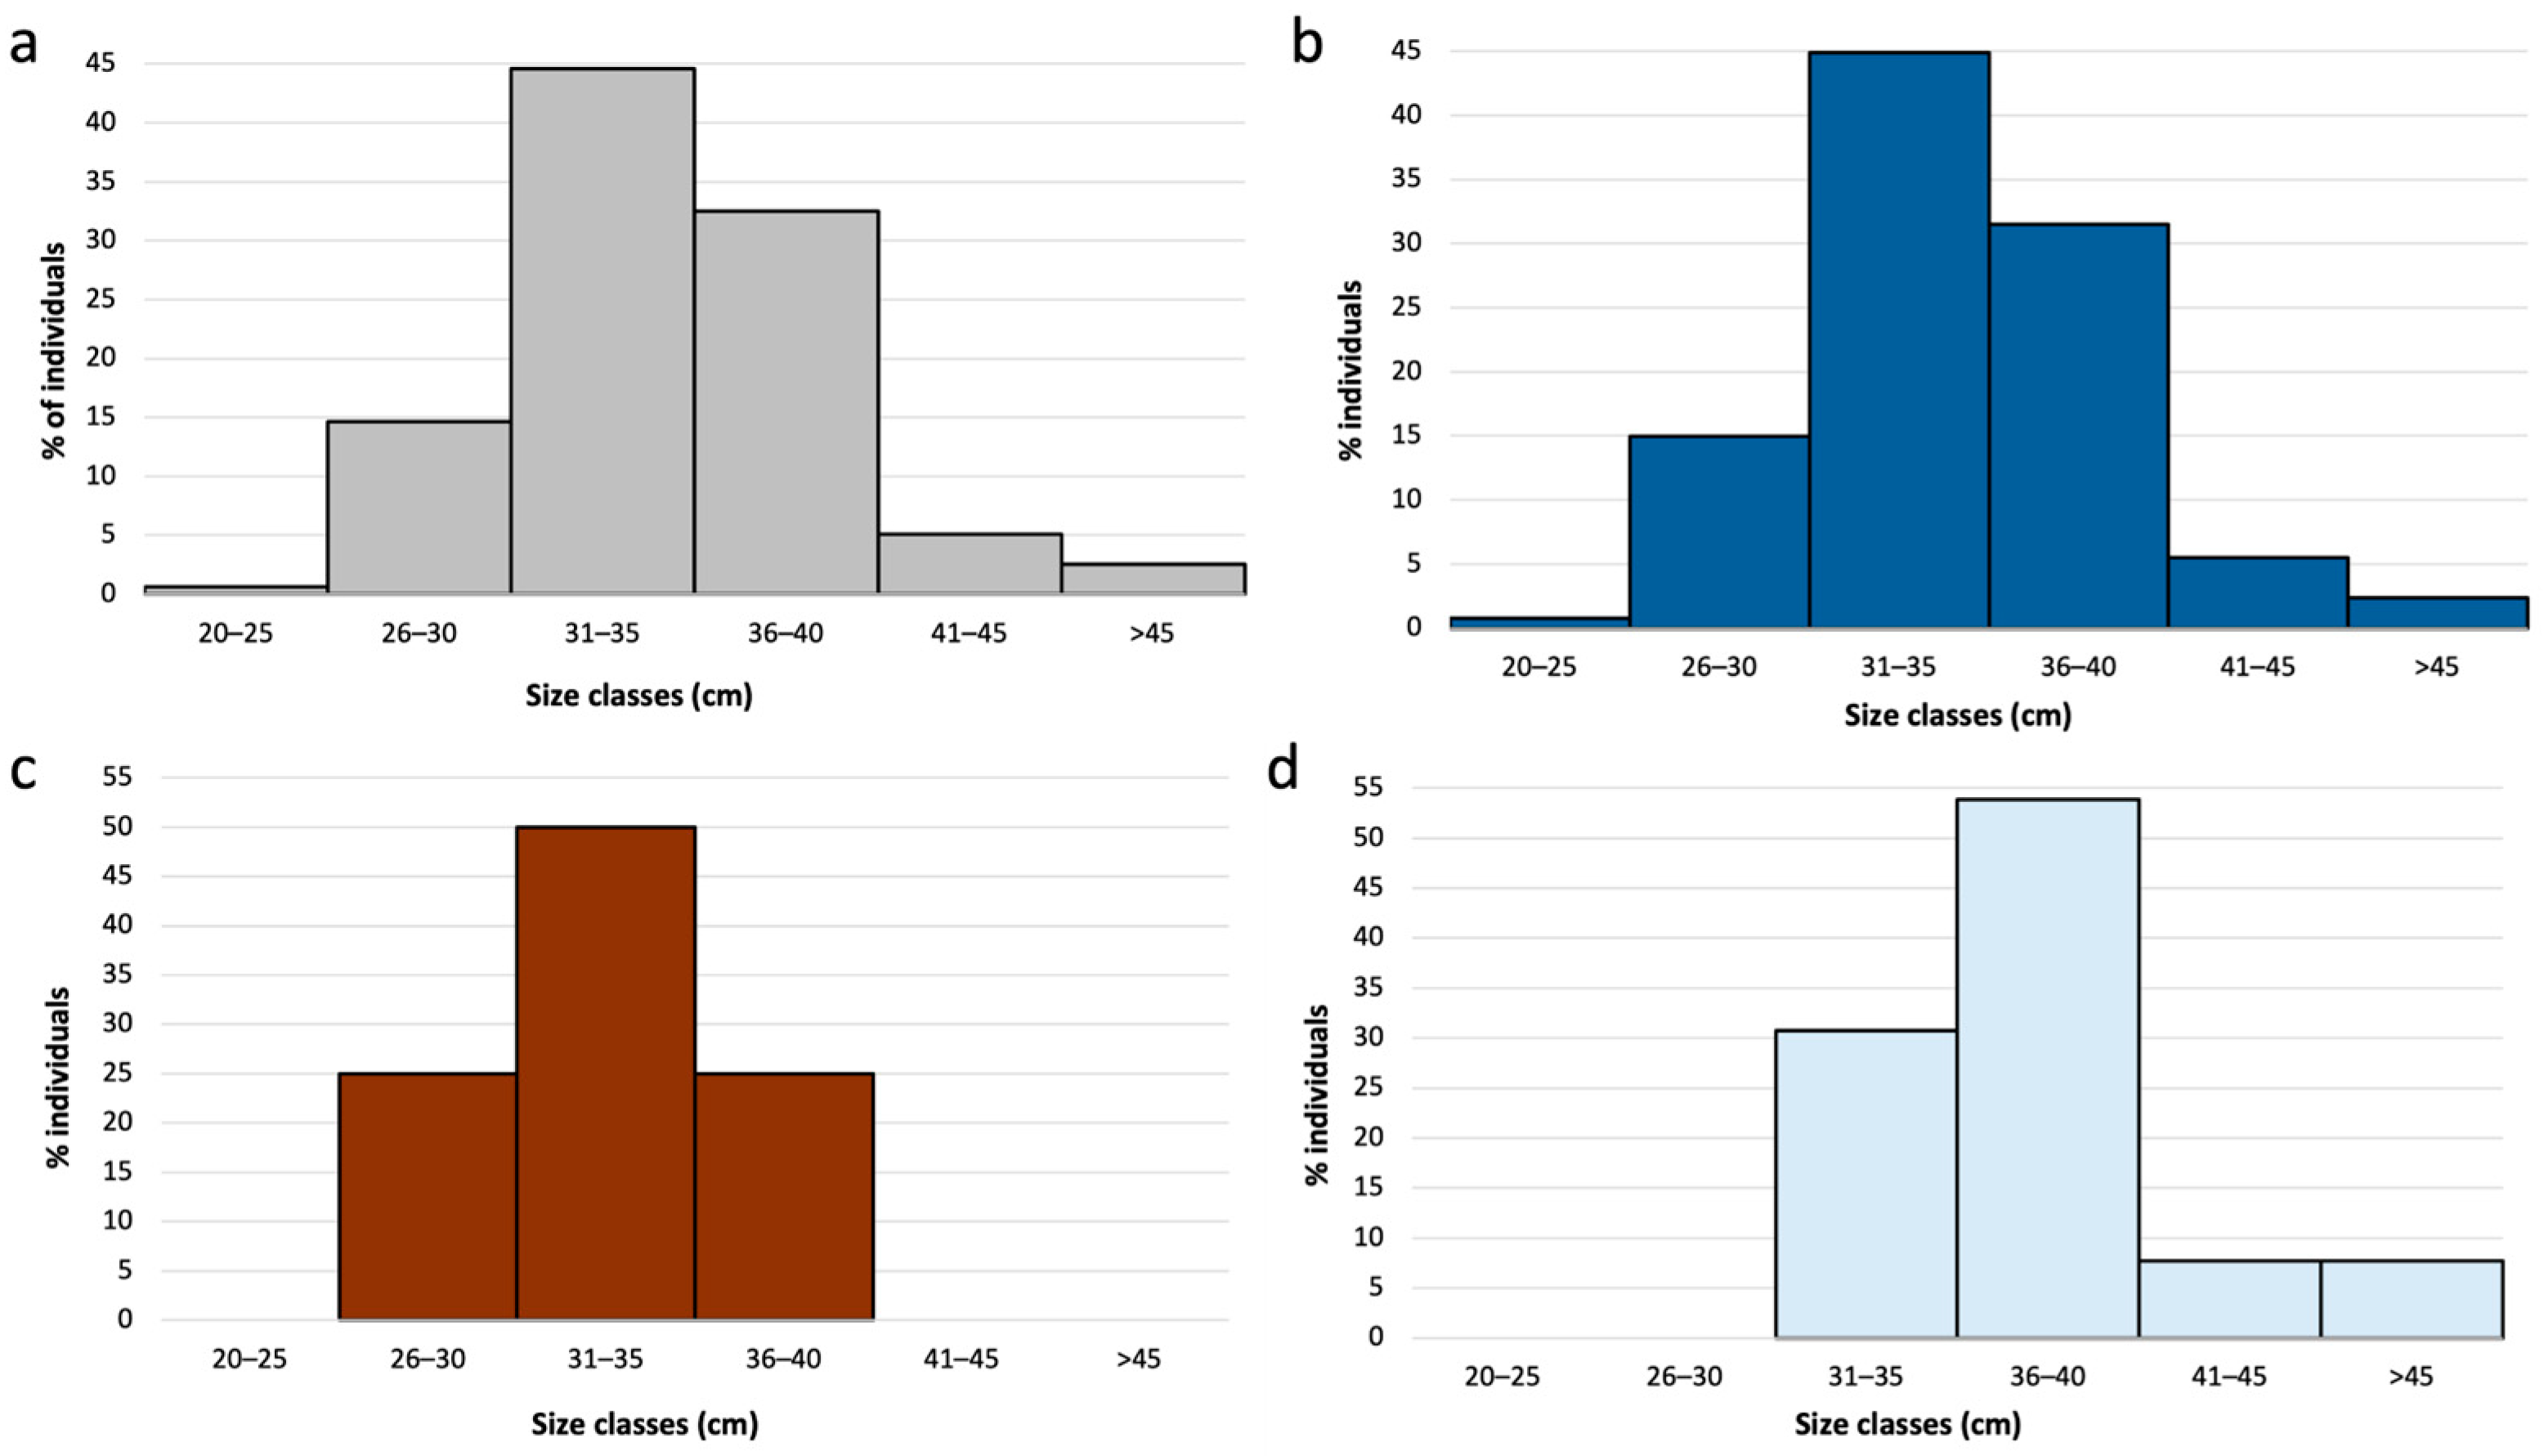
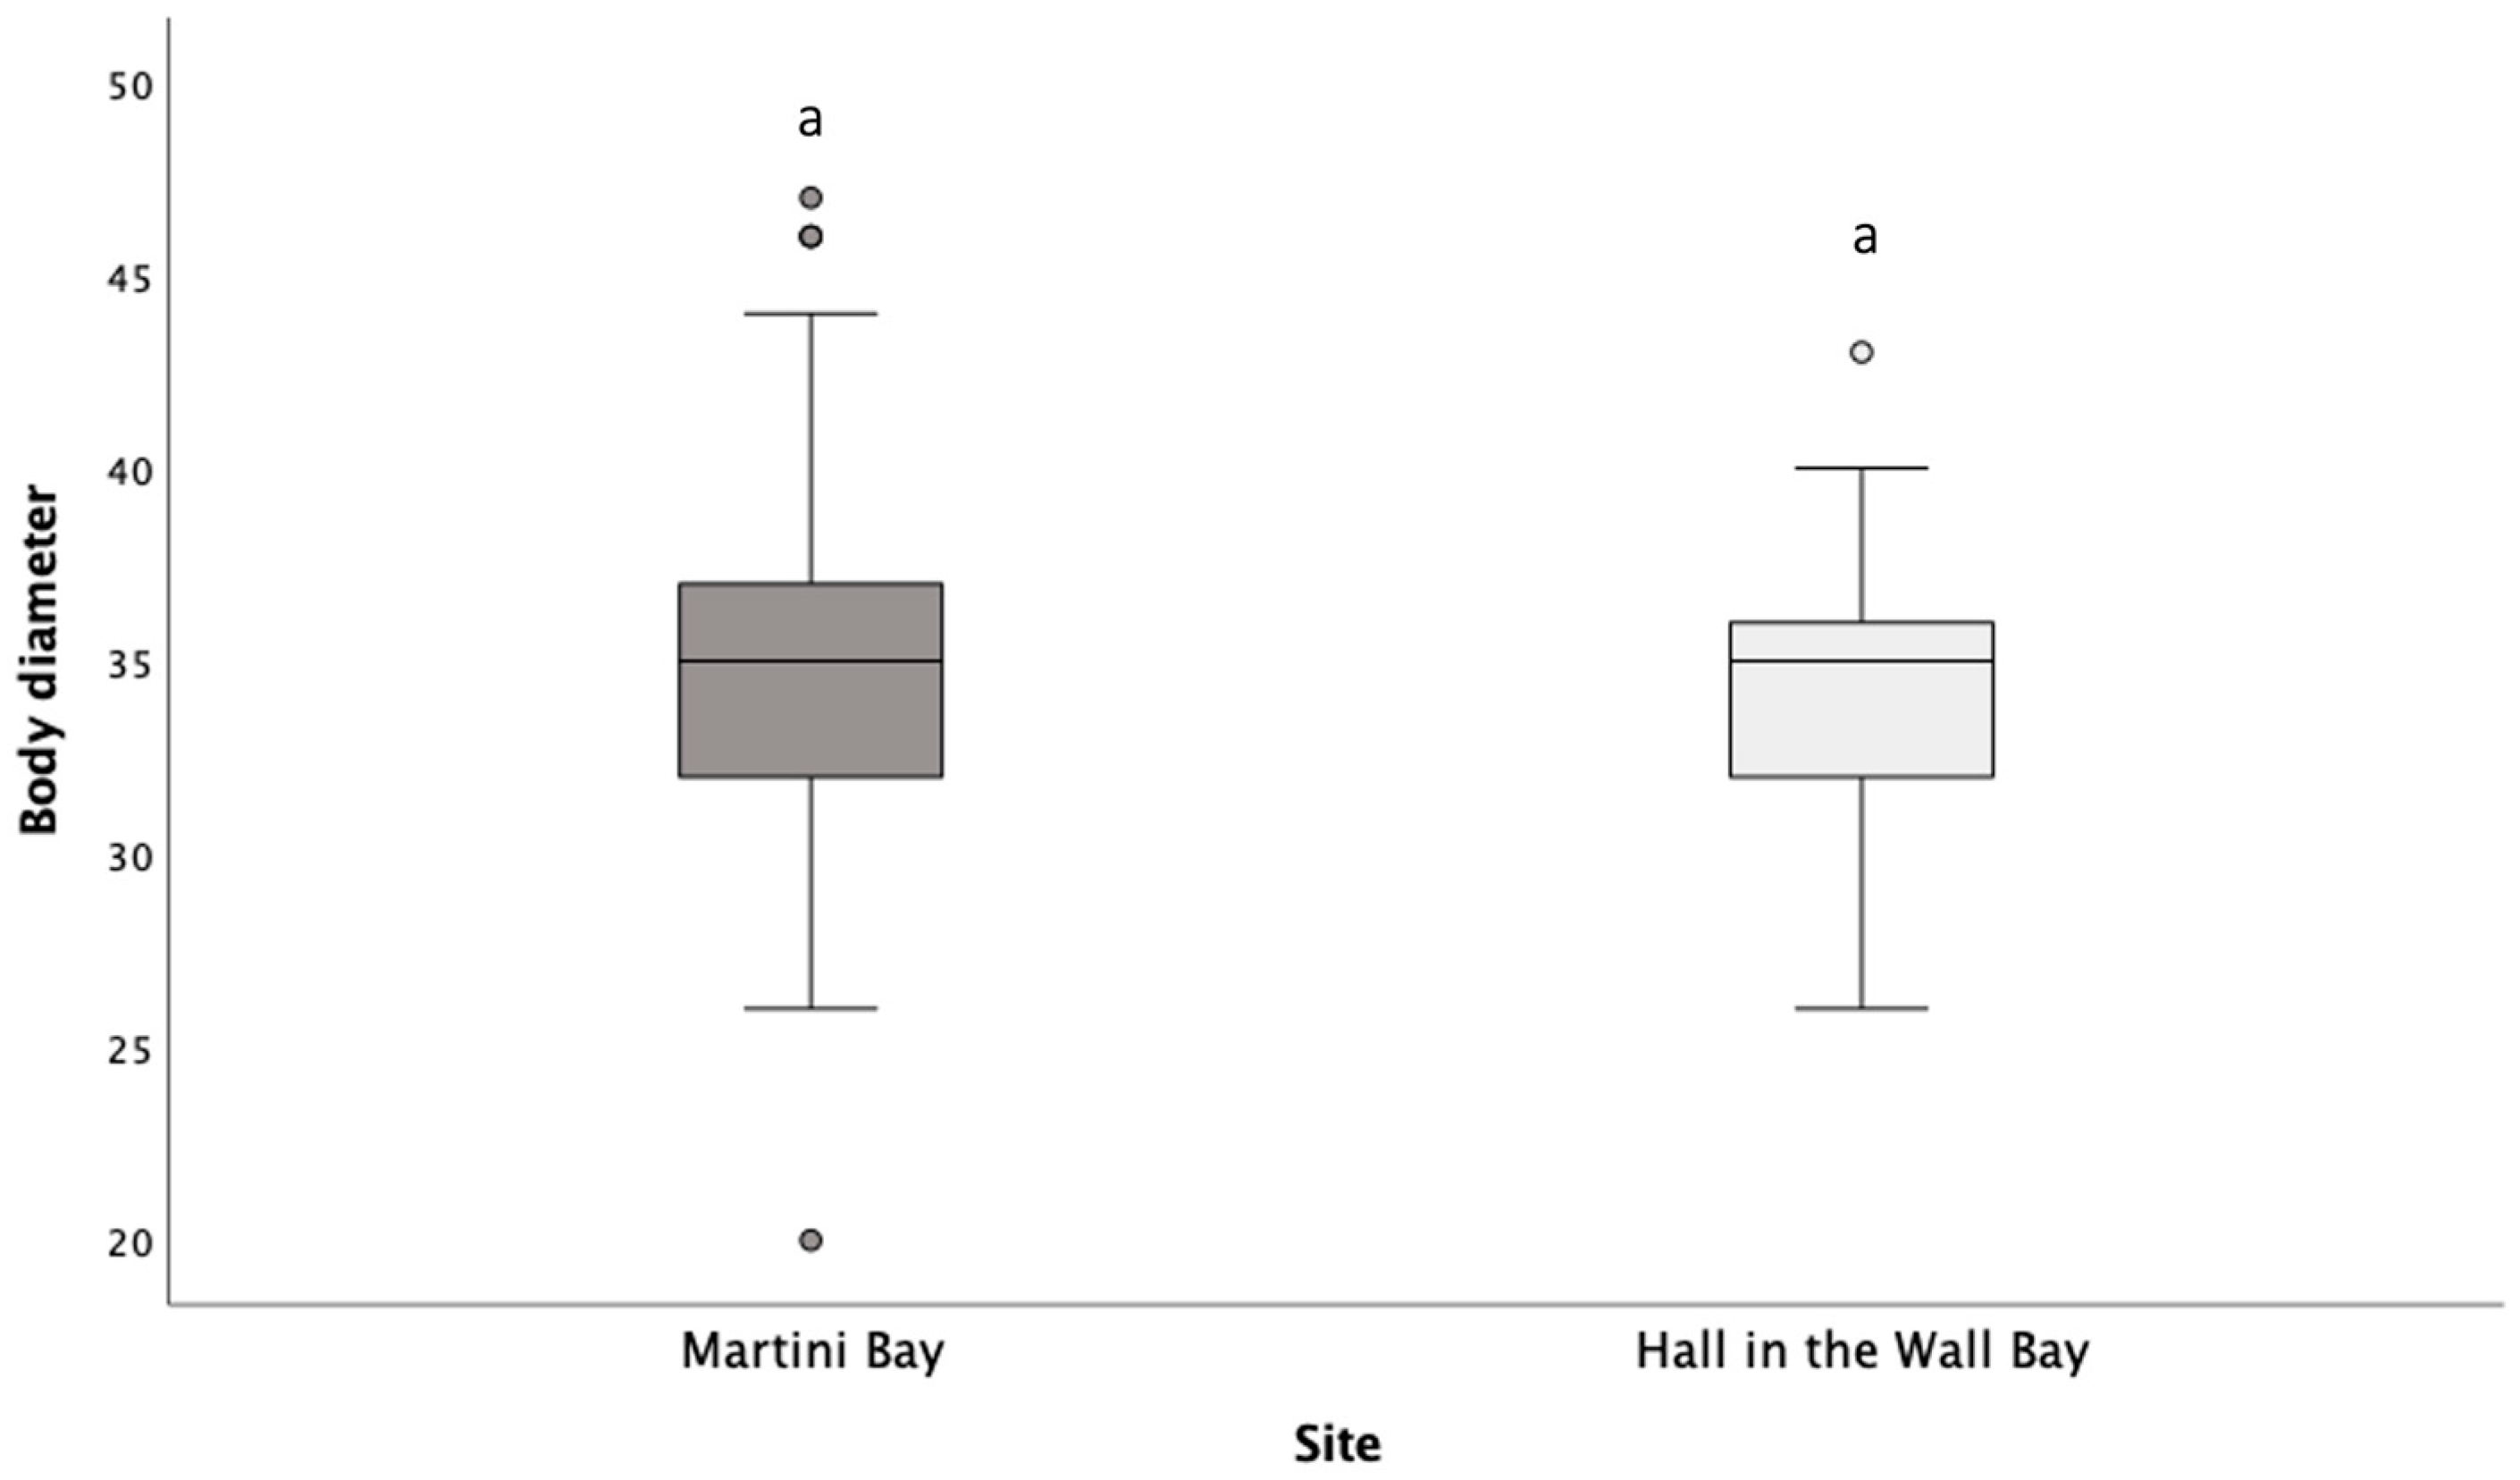
Measured body diameters ranged from 20 to 47 cm, with a mean size of 34.7 ± 4.19 cm. The 31–35 cm size class was the most represented (45%), followed by the 36–40 cm (32%) and 26–30 cm (15%) classes, while other size classes occurred at lower frequencies (Figure 6). Similar size-frequency patterns were observed for the blue and brown morphotypes, with both dominated by individuals in the 31–35 cm size class. In contrast, the white morphotype showed a peak in the 36–40 cm size class (54%), followed by the 31–35 cm class (31%), significantly different compared with the brown morphotype (Figure S1 in Supplementary File S2). Conversely, no significant differences in body diameter were detected between Martini Bay and Hole in the Wall Bay (Figure 7), supporting the pooling of the two sites for the main analyses.
The Shapiro–Wilk normality test indicated that the pooled population deviated from a normal size distribution (p = 0.005; df = 157), as did the blue morphotype (p = 0.009; df = 127). The brown and white morphotypes did not significantly deviate from normality (p = 0.620, df = 16; p = 0.313, df = 13, respectively).
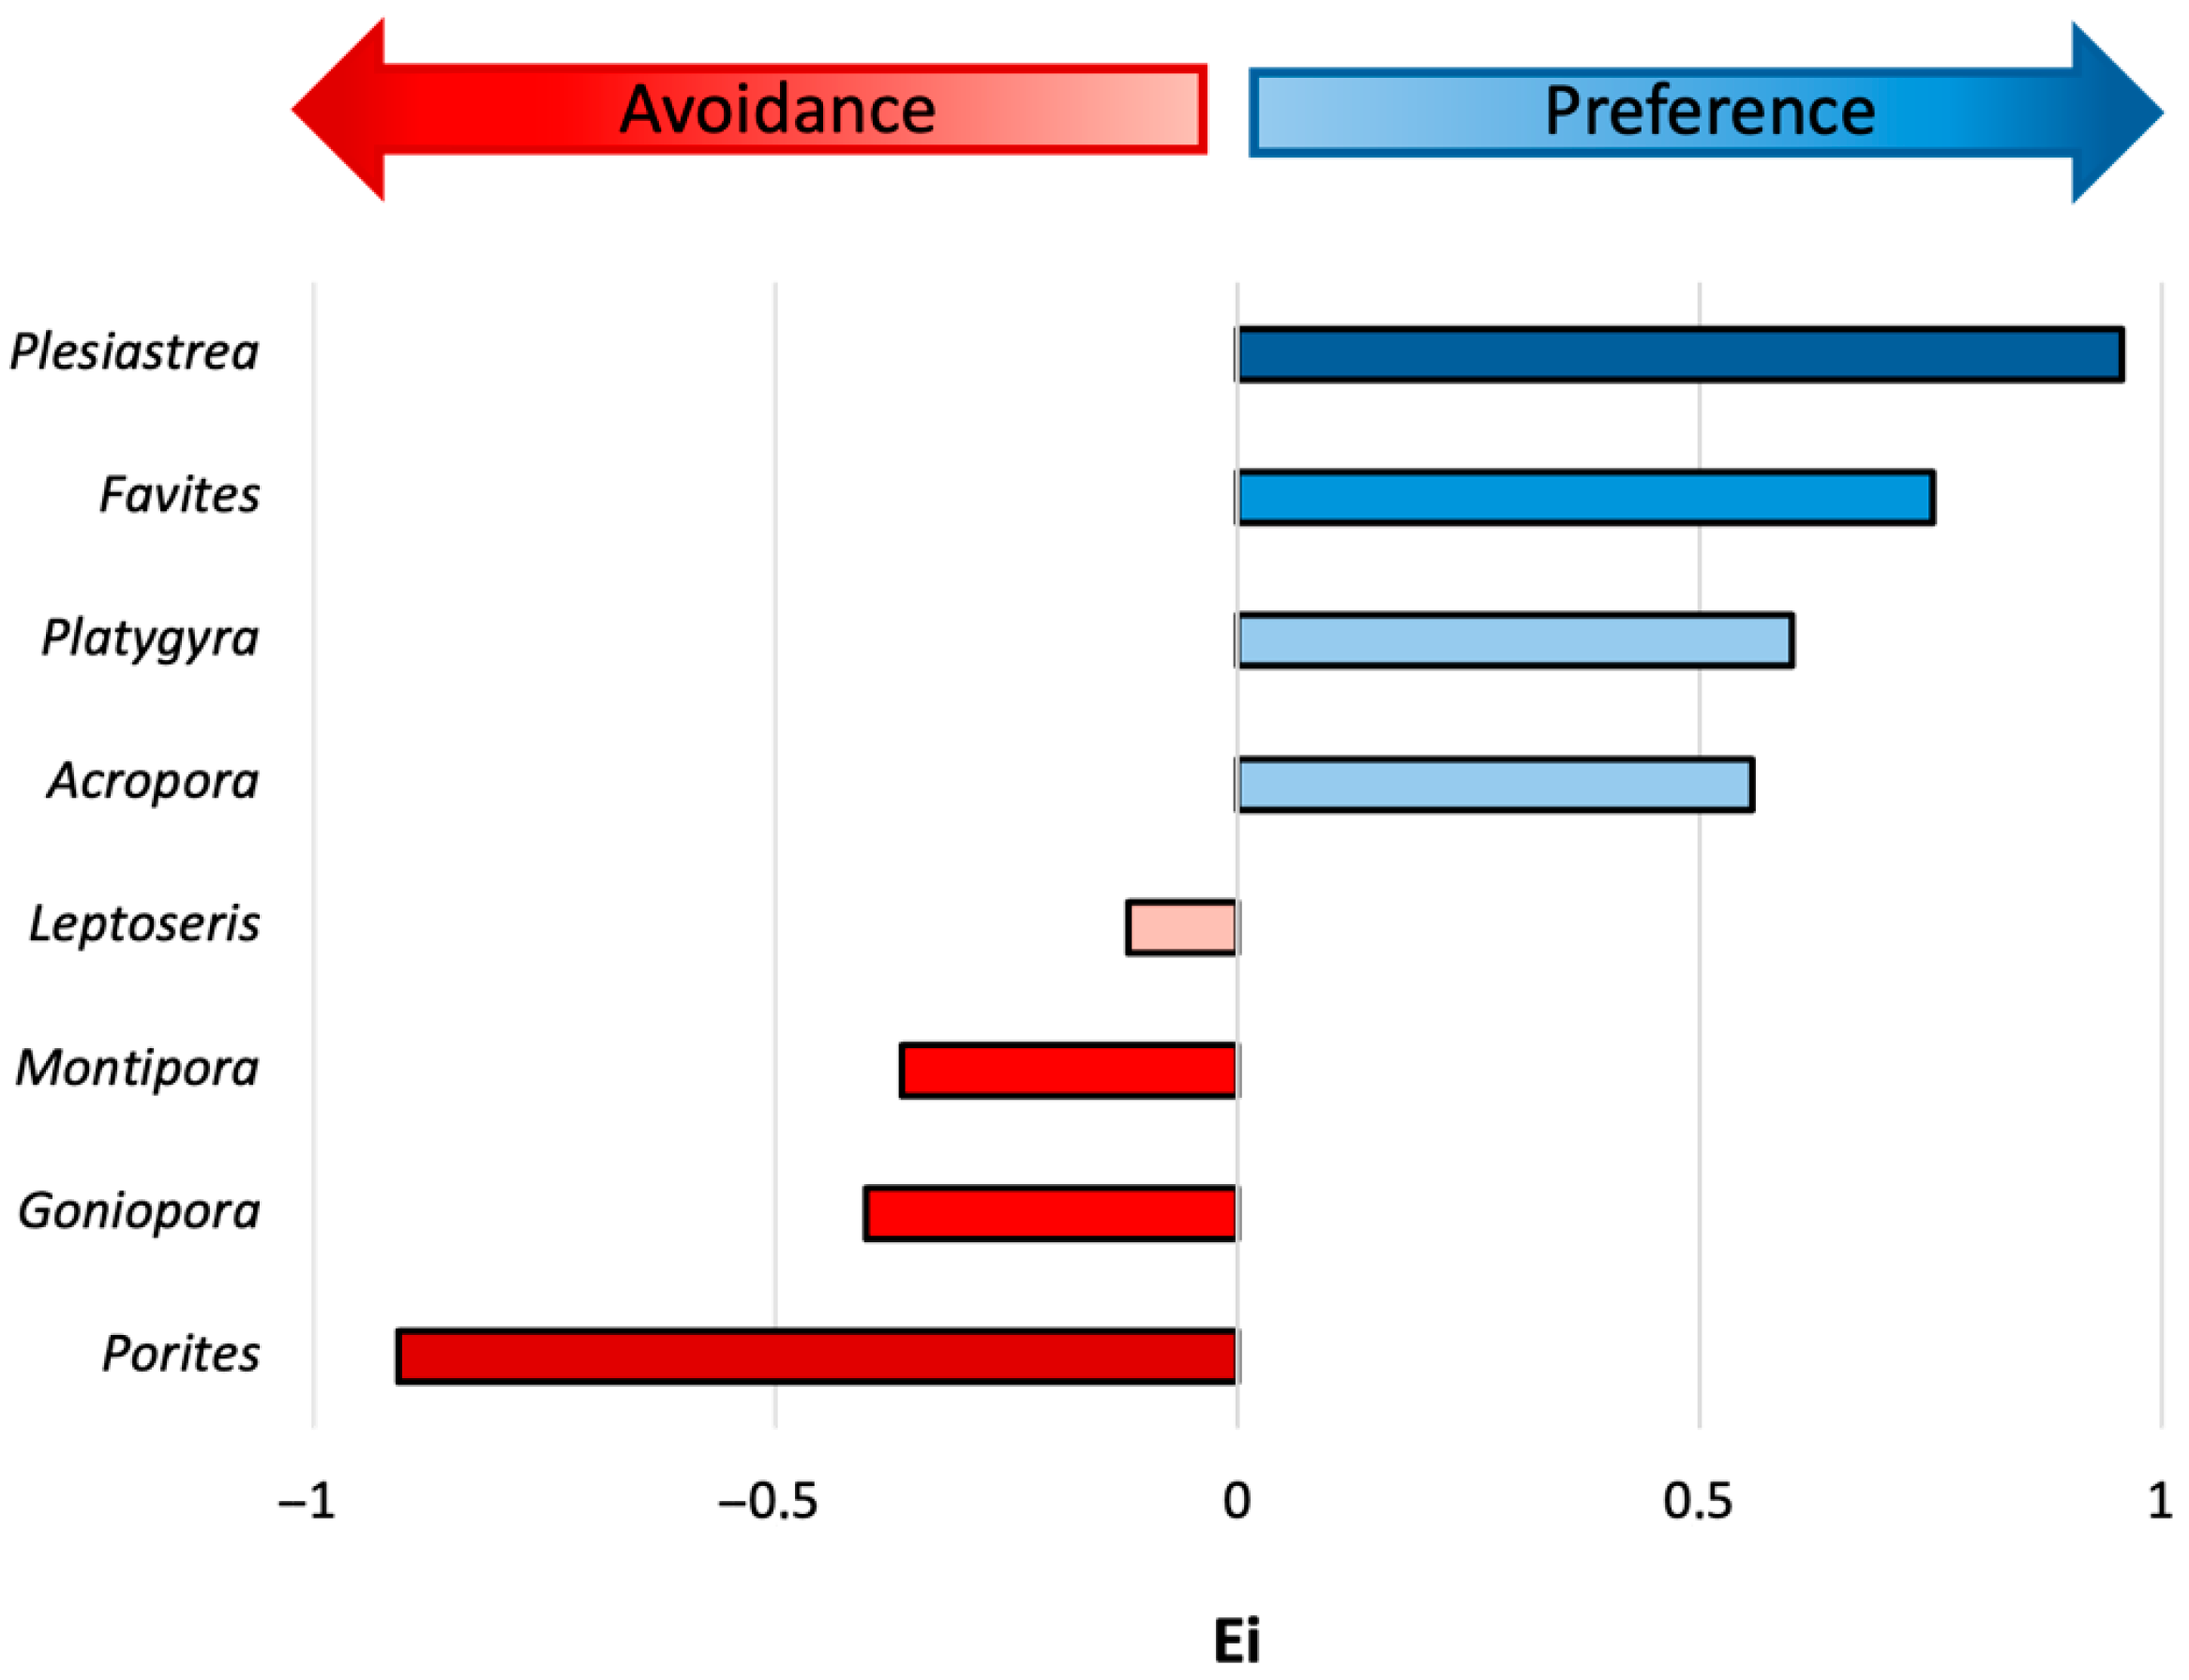
During surveys, 139 coral colonies were recorded as preyed upon by A. planci, either directly beneath feeding individuals or within a 2 m radius, showing clear feeding scars. Feeding preferences varied among coral genera, with Plesiastrea showing the highest selectivity value (Ei = 0.958), followed by Favites (Ei = 0.752), Platygyra (Ei = 0.600), and Acropora (Ei = 0.557). In contrast, Porites was the most strongly avoided genus (Ei = −0.908), followed by Goniopora (Ei = −0.402), Montipora (Ei = −0.363), and Leptoseris (Ei = −0.118) (Figure 8). Corresponding values of Chesson’s α, calculated to complement Ivlev’s electivity index, are provided in Table S1 (Supplementary File S2).

3.4. CoTS Removal and Evaluation of Culling Effectiveness

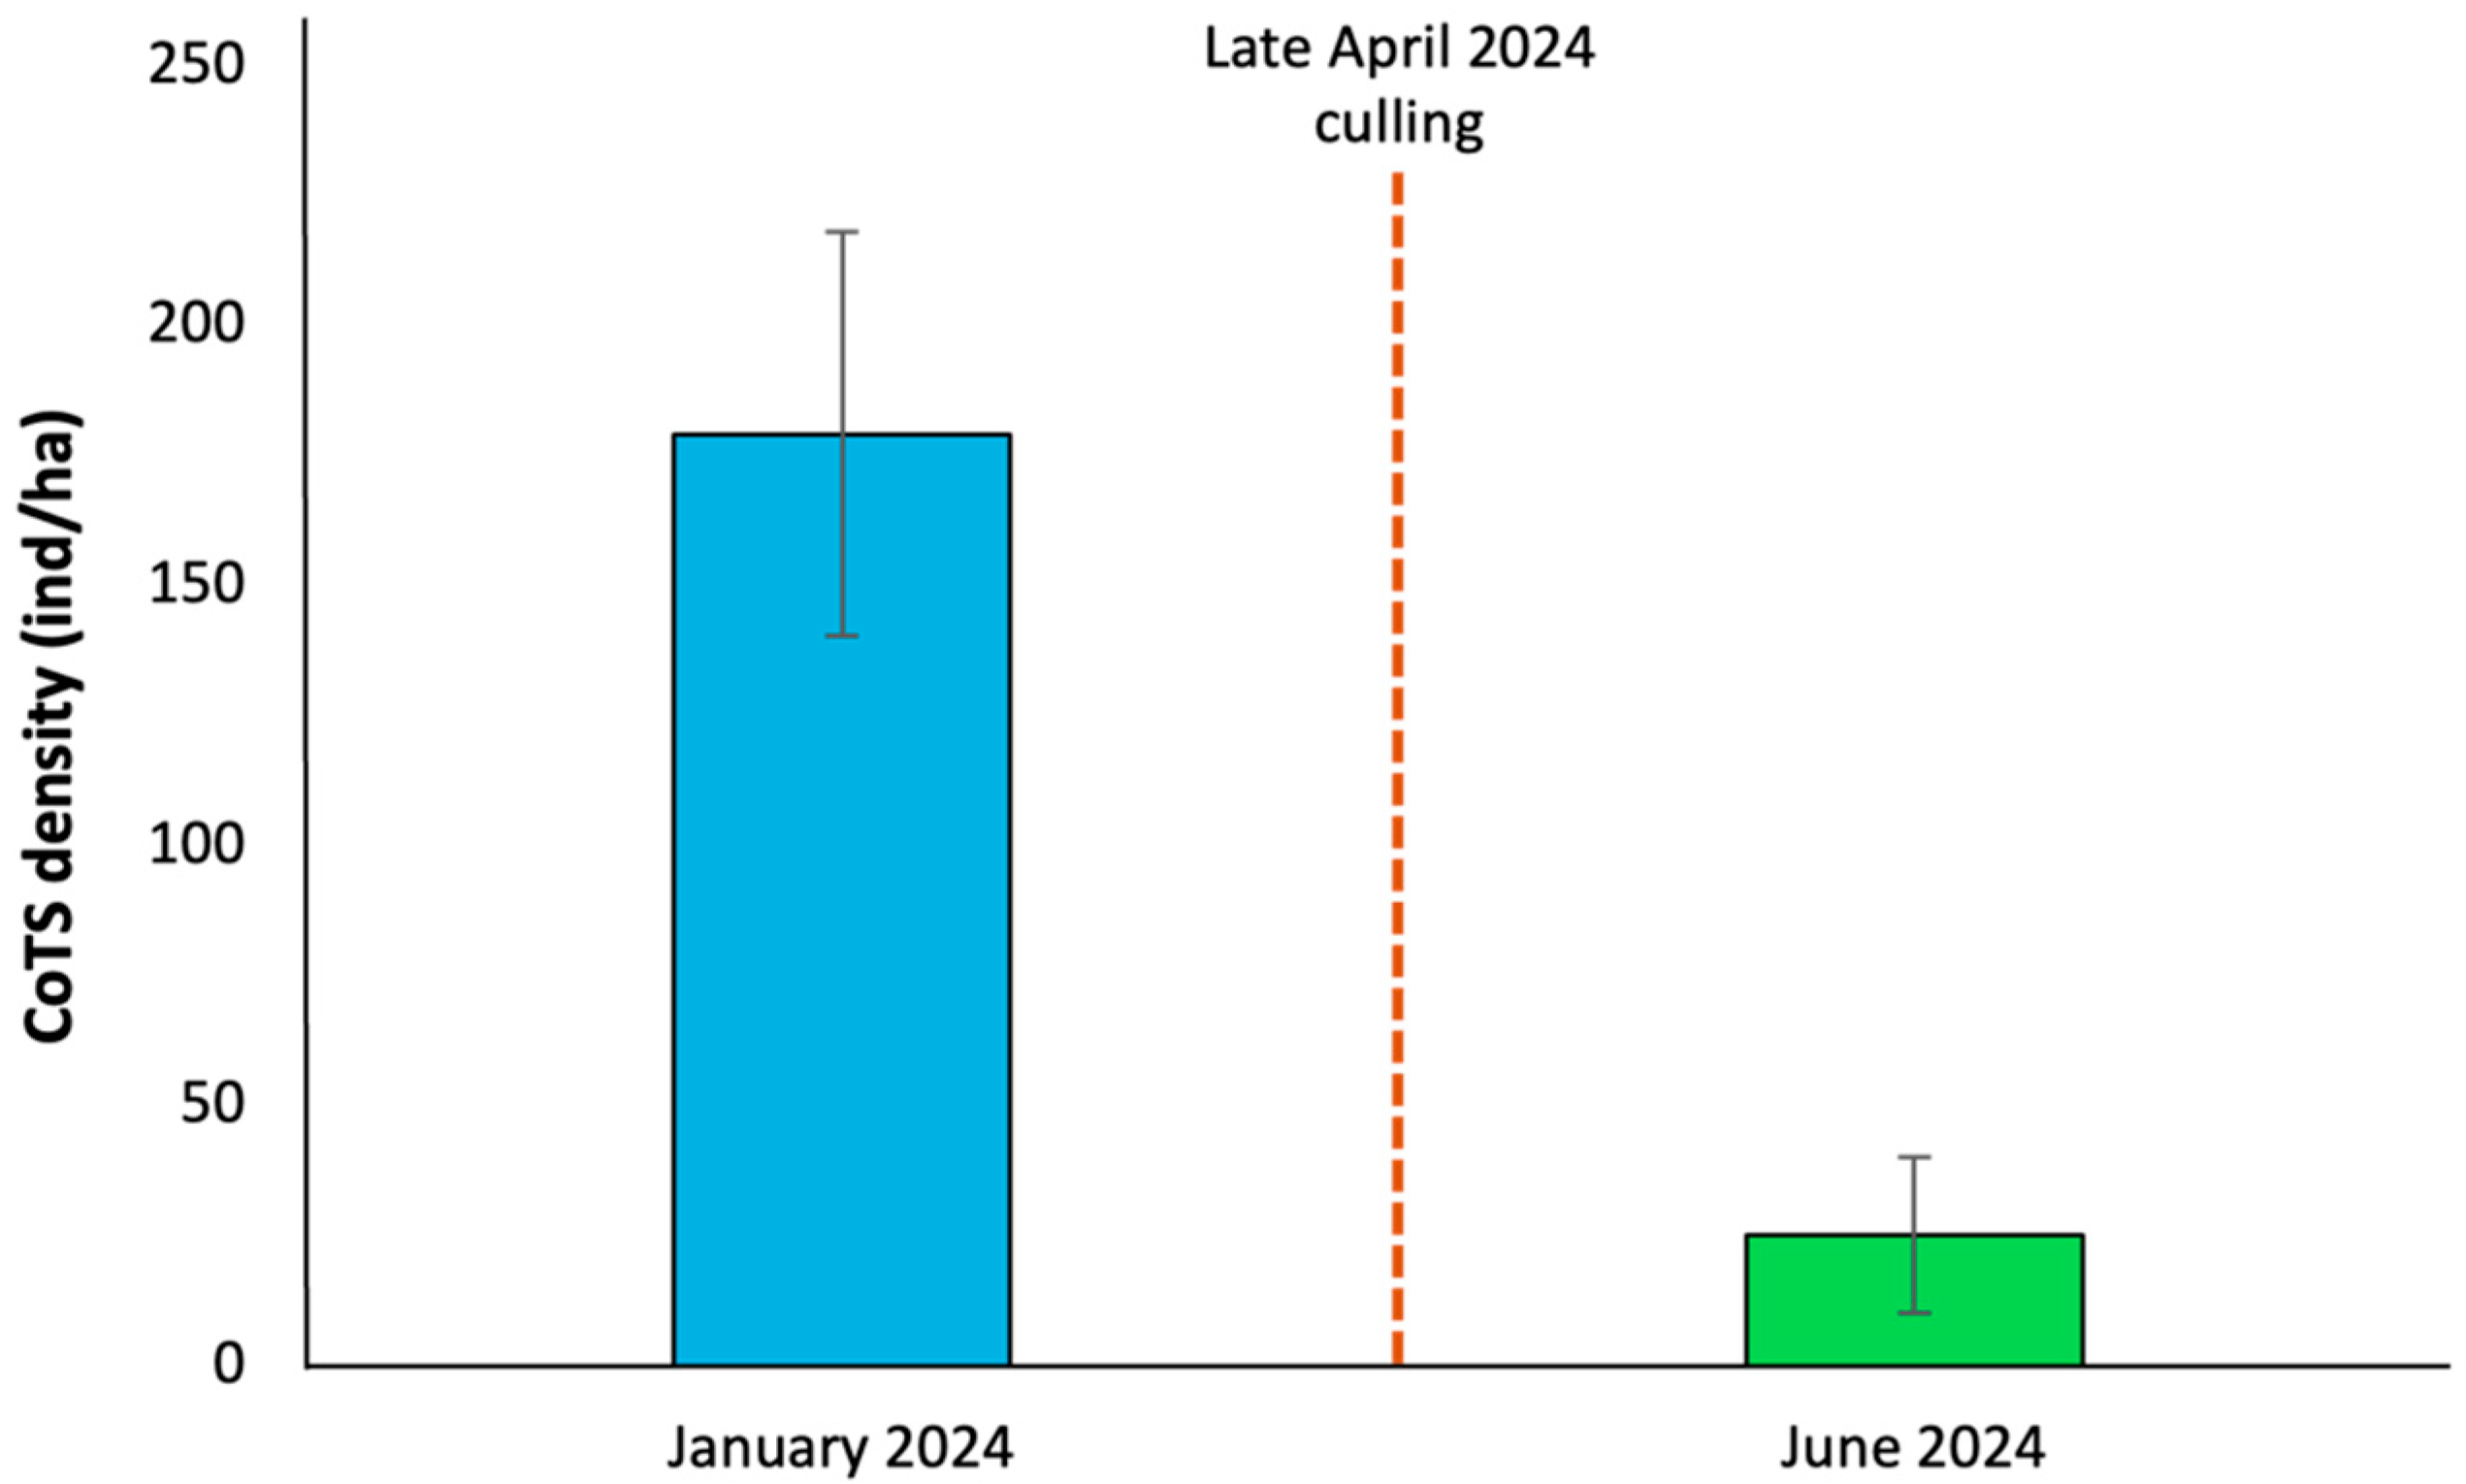
Acanthaster planci densities declined markedly following the culling intervention. During the outbreak peak in January 2024, population density was estimated at 179 ± 39 individuals ha−1. Following removal operations conducted in late April 2024, A. planci density decreased to 25 ± 15 individuals ha−1 by June 2024, corresponding to an overall reduction of approximately 86% (Figure 9). The reported reduction in CoTS density represents averaged values across the surveyed sites. Both locations showed a consistent decline in sea star abundance following culling, with a stronger decline observed at Hall in the Wall Bay.

4. Discussion

Crown-of-thorns sea stars (CoTS) are among the most important biotic stressors driving coral reef degradation through intense feeding activity and high reproductive output [5,6]. Despite their broad distribution across the Indo-Pacific, information on CoTS outbreaks in the United Arab Emirates and, more generally, in the Gulf of Oman remains limited [34]. In this context, the present study provides the first detailed genetic and ecological characterisation of a severe CoTS outbreak in this region.
Molecular analyses demonstrated that all sequenced individuals belonged to Acanthaster planci, confirming that the outbreak was driven by a single species rather than by the co-occurrence of multiple taxa. Phylogenetic reconstructions revealed that all the newly generated sequences clustered in two haplotypes placed within a well-supported Northern Indian Ocean clade, characterised by low genetic diversity. One haplotype was shared with samples from the United Arab Emirates, Oman, and the Maldives, while the second appeared to be currently detected only in the UAE. This pattern is consistent with previous studies reporting limited mitochondrial diversity in A. planci populations across the Indo-Pacific [5,6,30]. The presence of distinct colour morphotypes within a genetically homogeneous population supports the interpretation that external colouration is an unreliable indicator of species identity in Acanthaster species. This finding aligns with extensive evidence that colour variation largely reflects intraspecific morphological plasticity rather than taxonomic differentiation [26,27]. However, such polymorphism may reflect phenotypic variations or environmental acclimation, but dedicated genomic, physiological, and behavioural studies will be necessary to determine any biological implications. The geographic position of the Gulf of Oman at the interface between the Northern Indian Ocean (A. planci) and Southern Indian Ocean (A. mauritiensis) lineages warrants caution. The presence of shared haplotypes between nearby regions, such as the Maldives and Oman, suggests that the outbreak population may reflect an established population with regional connectivity. Similar patterns were also reported by Vogler et al. [29], indicating possible connectivity across the Western Indian Ocean.
Nevertheless, the occurrence of haplotypes currently detected only in the UAE may reflect local processes. Taken together, these factors are more consistent with a locally established population with some degree of connectivity with surrounding areas and undergoing rapid expansion. However, further genomic analyses and sampling efforts are required to disentangle the origin and population genetics of A. planci in the UAE.
CoTS densities recorded at the study sites exceeded commonly accepted outbreak thresholds (>15 individuals ha−1), confirming the exceptional magnitude of the event [13,48]. The mean density of 179 ± 39 individuals ha−1 reported in January 2024 by Seveso et al. [34] places this outbreak among the most severe documented in the region. Moreover, the greater number of individuals recorded during the present surveys than during the January assessment suggests that the population continued to expand before management intervention, thereby increasing the potential for coral loss.
Size-frequency analyses provided insights into the outbreak’s demographic structure. The dominance of large individuals, particularly within the 31–35 cm size class, indicates that the population was primarily composed of mature adults rather than newly recruited juveniles. The overall normal distribution of body sizes, as supported by Shapiro–Wilk tests for the pooled population and the dominant blue morphotype, is consistent with an established population structure. These characteristics are more typical of a secondary outbreak, driven by the rapid expansion of an existing population, rather than a primary outbreak dominated by recent recruitment pulses [5,8,49]. Non-normal size distributions observed for the total population and the blue morphotype may reflect underlying demographic structure or ongoing recruitment dynamics. In contrast, the brown and white morphotypes did not show significant deviations from normality. However, given the limited sample sizes for these morphotypes, such deviations should be interpreted cautiously. Low statistical power and sampling effects can strongly influence the results of normality tests, and additional data would be required to determine whether these patterns reflect biologically meaningful differences or methodological artefacts [50].
Analysis of feeding patterns revealed that adult A. planci individuals exhibited strong selectivity towards certain coral genera, despite the dominance of massive taxa in the benthic community. Plesiastrea, Favites, Platygyra, and Acropora coral genera were preferentially consumed, whereas Porites and Goniopora were consistently avoided. This pattern is broadly consistent with previous studies demonstrating a preference for structurally complex or energetically rewarding corals, particularly branching, foliose, or tabular forms [13,14,51,52]. Species of massive Porites are generally considered among the least favoured prey items for CoTS [49,53,54], and individuals feeding predominantly on these corals exhibit very limited growth rates [16]. On the other hand, CoTS has often shown strong feeding preferences for corals from the Acroporidae and Pocilloporidae families [16,51,55,56].
The mechanisms underlying the feeding selectivity of CoTS toward specific coral taxa remain poorly understood. Several explanations have been proposed, including variation in the nutritional value of different coral species [55,57], differences in tissue accessibility related to coral morphology (e.g., tabular versus branching forms), digestibility [55], and the presence of mutualistic symbionts that may deter predation [52,58,59,60]. Recently, coral defensive mechanisms involving nematocysts and venom and toxins production may also potentially play a role as a possible driver underlying CoTS feeding [61,62]. The preferential consumption of less abundant but more accessible or nutritionally favourable taxa highlights CoTS’s capacity to disproportionately affect coral diversity, even on reefs dominated by massive corals. Structurally complex colonies provide greater access to tissue and polyps and offer increased stability against hydrodynamic forces during feeding, making them particularly vulnerable to predation [52,55]. As preferred taxa become depleted, density-dependent predation may expand to include less-preferred massive corals, accelerating structural degradation and potentially driving shifts in benthic community composition [4,8,16,17,18].
The relatively high selectivity observed for Plesiastrea and Favites may reflect a combination of prey accessibility, energetic profitability, and local resource constraints rather than simple opportunistic consumption. Although CoTS are generally considered to consume branching, tabular, or structurally complex corals preferentially, feeding preferences are influenced by multiple interacting factors, including prey morphology, tissue accessibility, and nutritional value [14,51]. The positive selectivity values recorded for Plesiastrea (Ei = 0.958) and Favites (Ei = 0.752) indicate disproportionate predation relative to benthic composition. Massive or submassive colonies can provide broad and stable feeding surfaces that facilitate attachment and may increase feeding efficiency and tissue intake per feeding event [14,51]. Moreover, different tissue characteristics and nutritional quality may influence palatability [18,52]. During outbreak conditions and limited availability of preferred taxa, these characteristics may enhance a broadening of dietary preferences towards coral genera that are not usually preyed. This pattern is consistent with recent evidence showing that CoTS feeding behaviour can shift according to local prey availability, with reduced access to highly preferred corals leading to broader use of alternative taxa [13,51]. In such cases, repeated predation on locally vulnerable genera such as Plesiastrea and Favites may contribute not only to declines in coral cover but also to local depletion of these taxa and, if prolonged and unmanaged, possible extirpation from the affected reef sectors. Such flexibility may substantially amplify the ecological consequences of outbreaks by extending predation pressure beyond the most preferred coral genera [18,49,63]. Even when overall coral cover remains moderate, targeted predation on key structural or fast-growing genera can substantially reduce reef resilience and recovery potential. However, feeding selectivity was assessed using a pooled dataset, and potential variation across sites, seasons, or morphotype characteristics was not explicitly examined. Future studies incorporating stratified sampling designs will be essential to better resolve these dynamics and their ecological implications.
Given the predominance of large, actively feeding adults and evidence of selective predation on vulnerable coral taxa, targeted removal represented the most immediate management option to reduce local predation pressure. The substantial decline in CoTS density following culling, an 86% reduction from January to June 2024, demonstrates that active removal can be highly effective in rapidly lowering local population densities. These findings are consistent with previous studies showing that culling is the most efficient short-term strategy to mitigate coral loss during CoTS outbreaks [64,65,66]. However, the success of culling depends on sustained effort and follow-up monitoring [62]. Without continued intervention, residual individuals or recruits may allow populations to rebuild, undermining initial management gains. Furthermore, this intervention represents, to our knowledge, the first documented targeted CoTS culling in the UAE, providing a valuable regional baseline for future management actions.

5. Conclusions

Overall, this study provides the first integrated ecological and genetic assessment of a severe Acanthaster spp. outbreak in the Gulf of Oman. The results demonstrate that the outbreak was driven by a single species, Acanthaster planci, supporting the presence of intraspecific colour variation across the study area. Feeding analyses revealed clear selectivity towards specific coral genera, specifically Plesiastrea, Platygyra, and Acropora, characterised by structural complexity and energetically favourable, alongside evidence of dietary flexibility towards and potential expansion towards less-preferred massive corals, such as Favites. Furthermore, targeted culling operations proved effective in reducing local sea star densities over a short time frame, highlighting the potential of rapid management interventions in mitigating outbreak impacts. Sustained monitoring, long-term effects evaluation, and adaptive management will be essential to prevent future outbreaks and to support the long-term resilience of coral reefs in the region.

Supplementary Materials

The following supporting information can be downloaded at https://www.mdpi.com/article/10.3390/jmse14080750/s1. Supplementary File S1: Acanthaster spp. sequences retrieved from GenBank and BoLD used for the phylogenetic analyses. Supplementary File S2: Figure S1. Graph of the three colour morphotypes recorded in the study area. Table S1: Chesson’s alpha values used to calculate Ivlev’s Electivity Index (Ei).

Author Contributions

Conceptualization, E.C. and J.H.S.; methodology, D.M., E.M., D.S. and A.L.; validation, D.S., P.G. and J.H.S.; formal analysis, E.C.; investigation, E.M., J.H.S. and A.L.; resources, J.H.S. and P.G.; data curation, D.M., D.S. and E.M.; writing—original draft preparation, E.C.; writing—review and editing, E.M., D.S., D.M. and J.H.S.; visualization, E.M.; supervision, D.S., P.G. and J.H.S.; project administration, D.S., P.G. and J.H.S.; funding acquisition, P.G. All authors have read and agreed to the published version of the manuscript.

Funding

The project was funded under the National Recovery and Resilience Plan (NRRP), Mission 4 Component 2 Investment 1.4–Call for tender No. 3138 of 16 December 2021, rectified by Decree No. 3175 of 18 December 2021 of the Italian Ministry of University and Research funded by the European Union–NextGenerationEU. Award Number: Project code [CN_00000033], Concession Decree No. 1034 of 17 June 2022, adopted by the Italian Ministry of University and Research, CUP, [H43C22000530001] Project title “National Biodiversity Future Center–NBFC”.

Data Availability Statement

The original contributions presented in this study are included in the article/Supplementary Materials. Further inquiries can be directed to the corresponding author.

Acknowledgments

We are grateful to Barracuda Dive Center, Divers Down, and Dubai Voluntary Divers for their logistical and scientific support. We further acknowledge Vickie Langton, Chloe King, Felipe Morales, Tony Sidgwick, Rania Shawki Mostafa, Rajni Gupta, and Gordon Smith for their valuable assistance with field surveys and their photographic contributions. Finally, we sincerely thank the Sharjah Environment and Protected Areas Authority (EPAA) for granting permission to conduct this study in Sharjah waters.

Conflicts of Interest

The authors declare no conflicts of interest.

References

  1. Bellwood, D.R.; Hughes, T.P.; Folke, C.; Nyström, M. Confronting the Coral Reef Crisis. Nature 2004, 429, 827–833. [Google Scholar] [CrossRef] [PubMed]
  2. Hughes, T.P.; Anderson, K.D.; Connolly, S.R.; Heron, S.F.; Kerry, J.T.; Lough, J.M.; Baird, A.H.; Baum, J.K.; Berumen, M.L.; Bridge, T.C.; et al. Spatial and Temporal Patterns of Mass Bleaching of Corals in the Anthropocene. Science 2018, 359, 80–83. [Google Scholar] [CrossRef]
  3. Rice, M.M.; Ezzat, L.; Burkepile, D.E. Corallivory in the Anthropocene: Interactive Effects of Anthropogenic Stressors and Corallivory on Coral Reefs. Front. Mar. Sci. 2019, 5, 402984. [Google Scholar] [CrossRef]
  4. Pratchett, M.S. Changes in Coral Assemblages during an Outbreak of Acanthaster planci at Lizard Island, Northern Great Barrier Reef (1995–1999). Coral Reefs 2010, 29, 717–725. [Google Scholar] [CrossRef]
  5. Pratchett, M.S.; Caballes, C.F.; Wilmes, J.C.; Matthews, S.; Mellin, C.; Sweatman, H.P.A.; Nadler, L.E.; Brodie, J.; Thompson, C.A.; Hoey, J.; et al. Thirty Years of Research on Crown-of-Thorns Starfish (1986–2016): Scientific Advances and Emerging Opportunities. Divers 2017, 9, 41. [Google Scholar] [CrossRef]
  6. Uthicke, S.; Pratchett, M.S.; Bronstein, O.; Alvarado, J.J.; Wörheide, G. The Crown-of-Thorns Seastar Species Complex: Knowledge on the Biology and Ecology of Five Corallivorous Acanthaster species. Mar. Bio. 2024, 171, 32. [Google Scholar] [CrossRef]
  7. Leray, M.; Boehm, J.T.; Mills, S.C.; Meyer, C.P. Moorea BIOCODE Barcode Library as a Tool for Understanding Predator–Prey Interactions: Insights into the Diet of Common Predatory Coral Reef Fishes. Coral Reefs 2012, 31, 383–388. [Google Scholar] [CrossRef]
  8. Saponari, L.; Montalbetti, E.; Galli, P.; Strona, G.; Seveso, D.; Dehnert, I.; Montano, S. Monitoring and Assessing a 2-Year Outbreak of the Corallivorous Seastar Acanthaster planci in Ari Atoll, Republic of Maldives. Environ. Monit. Assess. 2018, 190, 344. [Google Scholar] [CrossRef] [PubMed]
  9. Fabricius, K.E. Factors Determining the Resilience of Coral Reefs to Eutrophication: A Review and Conceptual Model. In Coral Reefs: An Ecosystem in Transition; Springer: Dordrecht, The Netherlands, 2011; pp. 493–505. [Google Scholar] [CrossRef]
  10. Uthicke, S.; Logan, M.; Liddy, M.; Francis, D.; Hardy, N.; Lamare, M. Climate Change as an Unexpected Co-Factor Promoting Coral-Eating seastar (Acanthaster planci) Outbreaks. Sci. Rep. 2015, 5, 8402. [Google Scholar] [CrossRef]
  11. Birkeland, C. The Faustian Traits of the Crown-of-Thorns Starfish. Am. Sci. 1989, 77, 154–163. [Google Scholar]
  12. Lucas, J.S. Crown-of-Thorns Starfish. Curr. Biol. 2013, 23, R945–R946. [Google Scholar] [CrossRef]
  13. Miller, G.; Baillie, P.; Chaona, G.; Montalbetti, E.; Ramshaw, J.; Aschauer, D. The Morphological Dietary Preferences of an Outbreaking Population of Corallivorous Crown-of-Thorns Sea Stars (Acanthaster sp.) in the Gulf of Thailand. Environ. Monit. Assess. 2025, 197, 95. [Google Scholar] [CrossRef]
  14. De’ath, G.; Moran, P.J. Factors Affecting the Behaviour of Crown-of-Thorns Starfish (Acanthaster planci L.) on the Great Barrier Reef: Two Feeding Preferences. J. Exp. Mar. Biol. Ecol. 1998, 220, 107–126. [Google Scholar] [CrossRef]
  15. Baird, A.H.; Pratchett, M.S.; Hoey, A.S.; Herdiana, Y.; Campbell, S.J. Acanthaster planci Is a Major Cause of Coral Mortality in Indonesia. Coral Reefs 2013, 32, 803–812. [Google Scholar] [CrossRef]
  16. Keesing, J.K. Optimal Foraging Theory Explains Feeding Preferences in the Western Pacific Crown-of-Thorns Sea Star Acanthaster sp. Biol. Bull. 2021, 241, 303–329. [Google Scholar] [CrossRef]
  17. Keesing, J.K.; Thomson, D.P.; Haywood, M.D.E.; Babcock, R.C. Two Time Losers: Selective Feeding by Crown-of-Thorns Starfish on Corals Most Affected by Successive Coral-Bleaching Episodes on Western Australian Coral Reefs. Mar. Bio. 2019, 166, 72. [Google Scholar] [CrossRef]
  18. Foo, S.A.; Millican, H.R.; Byrne, M. Crown-of-Thorns Seastar (Acanthaster spp.) Feeding Ecology across Species and Regions. Sci. Total Environ. 2024, 930, 172691. [Google Scholar] [CrossRef]
  19. Porter, J.W. Predation by Acanthaster and Its Effect on Coral Species Diversity. Am. Nat. 1972, 106, 487–492. [Google Scholar] [CrossRef]
  20. Tokeshi, M.; Daud, J.R.P. Assessing Feeding Electivity in Acanthaster planci: A Null Model Analysis. Coral Reefs 2010, 30, 227–235. [Google Scholar] [CrossRef]
  21. Scott, C.M.; Mehrotra, R.; Hein, M.Y.; Moerland, M.S.; Hoeksema, B.W. Population Dynamics of Corallivores (Drupella and Acanthaster) on Coral Reefs of Koh Tao, a Diving Destination in the Gulf of Thailand. Raffles Bull. Zool. 2017, 65, 68–79. [Google Scholar]
  22. Fisher, W.K. New Starfishes from the Philippines. Proc. Biol. Soc. Wash. 1917, 30, 89–94. [Google Scholar]
  23. Woerheide, G.; Kaltenbacher, E.; Cowan, Z.L.; Haszprunar, G. A New Species of Crown-of-Thorns Sea Star, Acanthaster benziei sp. nov. (Valvatida: Acanthasteridae), from the Red Sea. Zootaxa 2022, 5209, 379–393. [Google Scholar]
  24. Loriol, P. de Premier Supplément à l’Echinologie Helvétique; Verlag nicht ermittelbar: Freiburg, Germany, 1885. [Google Scholar]
  25. Linnaeus, C. Systema Naturae per Regna Tria Naturae: Secundum Classes, Ordines, Genera, Species, Cum Characteribus, Differentiis, Synonymis, Locis; Impensis Direct; Laurentii Salvii: Stockholm, Sweden, 1758. [Google Scholar]
  26. Birkeland, C.; Lucas, J. Acanthaster planci: Major Management Problem of Coral Reefs; CRC Press: Boca Raton, FL, USA, 1990. [Google Scholar]
  27. Haszprunar, G.; Vogler, C.; Wörheide, G. Persistent Gaps of Knowledge for Naming and Distinguishing Multiple Species of Crown-of-Thorns-Seastar in the Acanthaster planci Species Complex. Diversity 2017, 9, 22. [Google Scholar] [CrossRef]
  28. Vogler, C.; Benzie, J.; Lessios, H.; Barber, P.; Wörheide, G. A Threat to Coral Reefs Multiplied? Four Species of Crown-of-Thorns Starfish. Biol. Lett. 2008, 4, 696–699. [Google Scholar] [CrossRef]
  29. Vogler, C.; Benzie, J.; Barber, P.H.; Erdmann, M.V.; Ambariyanto; Sheppard, C.; Tenggardjaja, K.; Gérard, K.; Wörheide, G. Phylogeography of the Crown-of-Thorns Starfish in the Indian Ocean. PLoS ONE 2012, 7, e43499. [Google Scholar] [CrossRef]
  30. Haszprunar, G.; Spies, M. An Integrative Approach to the Taxonomy of the Crown-of-Thorns Starfish Species Group (Asteroidea: Acanthaster): A Review of Names and Comparison to Recent Molecular Data. Zootaxa 2014, 3841, 271–284. [Google Scholar] [CrossRef]
  31. Glynn, P. Monsoonal Upwelling and Episodic Acanthaster Predation as Probable Controls of Coral Reef Distribution and Community Structure in Oman, Indian Ocean. Atoll Res. Bull. 1993, 379, 1–66. [Google Scholar] [CrossRef]
  32. Mendonca, V.M. Persistent and expanding population outbreaks of the corallivorous starfish Acanthaster planci in the northwestern Indian Ocean: Are they really a consequence of unsustainable starfish predator removal through overfishing in coral reefs, or a response to a changing environment? Zool. Stud. 2010, 49, 108–123. [Google Scholar]
  33. Gower, H.; Hadj-Hammou, J.; Burt, J.A. The evolution of coral reef monitoring in eastern Arabia: Trends, gaps, and opportunities for the ROPME Sea Area. Front. Mar. Sci. 2025, 12, 1578377. [Google Scholar] [CrossRef]
  34. Seveso, D.; Stahl, J.H.; Landes, A. An Outbreak of Acanthaster spp. in the Gulf of Oman (United Arab Emirates). Mar. Biodiv. 2024, 54, 62. [Google Scholar] [CrossRef]
  35. Burt, J.A.; Coles, S.; van Lavieren, H.; Taylor, O.; Looker, E.; Samimi-Namin, K. Oman’s Coral Reefs: A Unique Ecosystem Challenged by Natural and Man-Related Stresses and in Need of Conservation. Mar. Pollut. Bull. 2016, 105, 498–506. [Google Scholar] [CrossRef]
  36. Arndt, A.; Marquez, C.; Lambert, P.; Smith, M.J. Molecular Phylogeny of Eastern Pacific Sea Cucumbers (Echinodermata: Holothuroidea) Based on Mitochondrial DNA Sequence. Mol. Phylogenet. Evol. 1996, 6, 425–437. [Google Scholar] [CrossRef]
  37. Katoh, K.; Standley, D.M. MAFFT: Iterative Refinement and Additional Methods. Mult. Seq. Alignment Methods 2013, 1079, 131–146. [Google Scholar] [CrossRef]
  38. Villesen, P. FaBox: An Online Toolbox for Fasta Sequences. Mol. Ecol. Notes 2007, 7, 965–968. [Google Scholar] [CrossRef]
  39. Stamatakis, A. RAxML Version 8: A Tool for Phylogenetic Analysis and Post-Analysis of Large Phylogenies. Bioinformatics 2014, 30, 1312–1313. [Google Scholar] [CrossRef]
  40. Darriba, D.; Posada, D.; Kozlov, A.M.; Stamatakis, A.; Morel, B.; Flouri, T. ModelTest-NG: A New and Scalable Tool for the Selection of DNA and Protein Evolutionary Models. Mol. Biol. Evol. 2020, 37, 291–294. [Google Scholar] [CrossRef] [PubMed]
  41. Leigh, J.; Bryant, D. POPART: Full-Feature Software for Haplotype Network Construction. Ecol. Evol. 2015, 6, 1110–1116. [Google Scholar] [CrossRef]
  42. Veron, J.E.N. Corals of the World. 2000. Available online: https://www.coralsoftheworld.org/page/home/?version=0.01 (accessed on 23 March 2026).
  43. Montalbetti, E.; Saponari, L.; Montano, S.; Maggioni, D.; Dehnert, I.; Galli, P.; Seveso, D. New Insights into the Ecology and Corallivory of Culcita sp. (Echinodermata: Asteroidea) in the Republic of Maldives. Hydrobiologia 2019, 827, 353–365. [Google Scholar] [CrossRef]
  44. Lechowicz, M.J. The Sampling Characteristics of Electivity Indices. Oecologia 1982, 52, 22–30. [Google Scholar] [CrossRef]
  45. Montalbetti, E.; Fallati, L.; Casartelli, M.; Maggioni, D.; Montano, S.; Galli, P.; Seveso, D. Reef Complexity Influences Distribution and Habitat Choice of the Corallivorous Seastar Culcita schmideliana in the Maldives. Coral Reefs 2022, 41, 253–264. [Google Scholar] [CrossRef]
  46. Chesson, J. Measuring Preference in Selective Predation. Ecology 1978, 59, 211–215. [Google Scholar] [CrossRef]
  47. Vanderploeg, H.A.; Scavia, D. Calculation and Use of Selectivity Coefficients of Feeding: Zooplankton Grazing. Ecol. Modell. 1979, 7, 135–149. [Google Scholar] [CrossRef]
  48. Green Fins Reef-World Launches Green Fins Crown-of-Thorns Sea Star Cleanup Guidelines—Green Fins. Available online: https://greenfins.net/news/green-fins-crown-of-thorns-sea-star-cleanup-guidelines/ (accessed on 9 January 2026).
  49. Millican, H.R.; Byrne, M.; Keesing, J.; Foo, S.A. Feeding Biology of Crown-of-Thorns Seastars across Sites Differing in Acropora Availability. Mar. Environ. Res. 2024, 200, 106655. [Google Scholar] [CrossRef] [PubMed]
  50. Ghasemi, A.; Zahediasl, S. Normality Tests for Statistical Analysis: A Guide for Non-Statisticians. Int. J. Endocrinol. Metab. 2012, 10, 486. [Google Scholar] [CrossRef]
  51. Chandler, J.F.; Burn, D.; Figueira, W.F.; Doll, P.C.; Johandes, A.; Piccaluga, A.; Pratchett, M.S. Daily Variation in the Feeding Activity of Pacific Crown-of-Thorns Starfish (Acanthaster cf solaris). Biology 2025, 14, 1001. [Google Scholar] [CrossRef]
  52. Pratchett, M.S. Influence of Coral Symbionts on Feeding Preferences of Crown-of-Thorns Starfish Acanthaster planci in the Western Pacific. Mar. Ecol. Prog. Ser. 2001, 214, 111–119. [Google Scholar] [CrossRef]
  53. Kenyon, J.; Aeby, G. Localized Outbreak and Feeding Preferences of the Crown-of-Thorns Seastar Acanthaster Planci (Echinodermata, Asteroidea) on Reefs off Oahu, Hawaii. Bull. Mar. Sci. 2009, 84, 199. [Google Scholar]
  54. Pratchett, M.S. Feeding Preferences of Acanthaster planci (Echinodermata: Asteroidea) under Controlled Conditions of Food Availability. Pac. Sci. 2007, 61, 113–120. [Google Scholar] [CrossRef]
  55. Keesing, R.M. Theories of Culture Revisited. Canberra Antropol. 1990, 13, 46–60. [Google Scholar] [CrossRef]
  56. Ling, S.D.; Cowan, Z.L.; Boada, J.; Flukes, E.B.; Pratchett, M.S. Homing behaviour by destructive crown-of-thorns starfish is triggered by local availability of coral prey. Proc. R. Soc. B 2020, 287, 20201341. [Google Scholar] [CrossRef] [PubMed]
  57. Ormond, R.F.G.; Hanscomb, N.J.; Beach, D.H. Food selection and learning in the crown-of-thorns starfish, Acanthaster planci (L). Mar. Freshw. Behav. Physiol. 1976, 4, 93–105. [Google Scholar] [CrossRef]
  58. Glynn, P.W. Defense by symbiotic crustacea of host corals elicited by chemical cues from predator. Oecologia 1980, 47, 287–290. [Google Scholar] [CrossRef]
  59. Rouzé, H.; Lecellier, G.; Mills, S.C.; Planes, S.; Berteaux-Lecellier, V.; Stewart, H. Juvenile Trapezia spp. crabs can increase juvenile host coral survival by protection from predation. Mar. Ecol. Prog. Ser. 2014, 515, 151–159. [Google Scholar] [CrossRef]
  60. Montano, S.; Fattorini, S.; Parravicini, V.; Berumen, M.L.; Galli, P.; Maggioni, D.; Arrigoni, R.; Seveso, D.; Strona, G. Corals hosting symbiotic hydrozoans are less susceptible to predation and disease. Proc. R. Soc. B 2017, 284, 20172405. [Google Scholar] [CrossRef]
  61. Gorman, L.M.; Byrne, M.; Beldade, R.; Adjeroud, M.; Dumas, P.; Mills, S.C. The Use of New Biologically Based Technological Development in the Management of Crown-of-Thorns Sea Stars. Coral Reefs World 2025, 21, 123–151. [Google Scholar] [CrossRef]
  62. Deaker, D.J.; Mos, B.; Lawson, C.; Dworjanyn, S.A.; Budden, C.; Byrne, M. Coral defences. Mar. Ecol. Prog. Ser. 2021, 665, 115–125. [Google Scholar] [CrossRef]
  63. Levering, L.T.; Doll, P.C.; Garing, M.R.; Tebbett, S.B.; Pratchett, M.S. Changes in Feeding Behavior of Pacific Crown-of-Thorns Starfish (Acanthaster cf. solaris) Following Mass Coral Bleaching in the Northern Great Barrier Reef, Australia. Coral Reefs 2026, 1–10. [Google Scholar] [CrossRef]
  64. Pratchett, M.S.; Schenk, T.J.; Baine, M.; Syms, C.; Baird, A.H. Selective Coral Mortality Associated with Outbreaks of Acanthaster planci L. in Bootless Bay, Papua New Guinea. Mar. Environ. Res. 2009, 67, 230–236. [Google Scholar] [CrossRef]
  65. Kayal, M.; Vercelloni, J.; Lison de Loma, T.; Bosserelle, P.; Chancerelle, Y.; Geoffroy, S.; Stievenart, C.; Michonneau, F.; Penin, L.; Planes, S.; et al. Predator Crown-of-Thorns Starfish (Acanthaster planci) Outbreak, Mass Mortality of Corals, and Cascading Effects on Reef Fish and Benthic Communities. PLoS ONE 2012, 7, e47363. [Google Scholar] [CrossRef]
  66. Hock, K.; Wolff, N.H.; Condie, S.A.; Anthony, K.R.N.; Mumby, P.J. Connectivity Networks Reveal the Risks of Crown-of-Thorns Starfish Outbreaks on the Great Barrier Reef. J. Appl. Ecol. 2014, 51, 1188–1196. [Google Scholar] [CrossRef]
Figure 1. Map of the study area showing the two investigated sites, Martini Bay and Hole in the Wall Bay, off the coast of Khor Fakkan (UAE).
Jmse 14 00750 g001
Figure 2. Different morphotypes of CoTS feeding on corals detected at both study areas. The colour label, a brief description, and a picture are provided for each one of them.
Jmse 14 00750 g002
Figure 3. Phylogenetic hypothesis of Acanthaster species and geographic structure of A. planci. (a) Maximum likelihood phylogenetic hypothesis including all available COI Acanthaster sequences. For each species, the number of sequences and the geographical range are indicated. For A. planci, the six haplotypes, with the number of sequences, are also indicated, with the two haplotypes from the United Arab Emirates highlighted in grey. Numbers at nodes represent bootstrap values. (b) Median-joining haplotype network of A. planci sequences. The size of circles is proportional to the number of sequences having that specific haplotype, perpendicular lines represent the number of substitutions between adjacent haplotypes, and colours refer to geographic provenience, as indicated in the legend.
Jmse 14 00750 g003
Figure 4. Coverage (%) of the benthic categories (a) and coral genera (b) in the study area. Coral genera showing a coverage < 0.5% were included in the category “Others” (represented by 9 coral genera). Data are represented as the mean ± SEM.
Jmse 14 00750 g004
Figure 5. Different color morphotypes of A. planci detected during the survey. Data are presented as a percentage of individuals divided into different morphotypes.
Jmse 14 00750 g005
Figure 6. (a) Histogram showing the variation in body sizes (cm) of A. planci individuals at the study site (n = 157). (b) Histogram showing the variation in body sizes (cm) of A. planci of the blue morphotype (n = 127). (c) Histogram showing the variation in body sizes (cm) of A. planci of the brown morphotype (n = 16). (d) Histogram showing the variation in body sizes (cm) of A. planci of the white morphotype (n = 13).
Jmse 14 00750 g006
Figure 7. Body diameter (cm) of A. planci individuals recorded at the two study sites, Martini Bay and Hole in the Wall Bay. No significant differences in body diameter were detected between sites.
Jmse 14 00750 g007
Figure 8. Feeding preference towards varying coral genera. Graph representing the Van der Ploeg and Scavia selectivity index, where Ei of 1 refers to exclusive preference and −1 refers to exclusive avoidance.
Jmse 14 00750 g008
Figure 9. Density of outbreak before and after culling operations. A reduction of 86% of individuals in the two investigated sites.
Jmse 14 00750 g009
Disclaimer/Publisher’s Note: The statements, opinions and data contained in all publications are solely those of the individual author(s) and contributor(s) and not of MDPI and/or the editor(s). MDPI and/or the editor(s) disclaim responsibility for any injury to people or property resulting from any ideas, methods, instructions or products referred to in the content.