Article

Design and Flight Test of an Air-Launched Medical Aid Delivery Uncrewed Aerial Vehicle

Department of Aerospace Engineering, Embry-Riddle Aeronautical University, Prescott, AZ 86301, USA
*
Author to whom correspondence should be addressed.
Aerospace 2025, 12(11), 977; https://doi.org/10.3390/aerospace12110977
Submission received: 13 September 2025 / Revised: 28 October 2025 / Accepted: 28 October 2025 / Published: 30 October 2025
(This article belongs to the Special Issue Aircraft Design (SI-7/2025))

Abstract

As technology advances, small unmanned aerial vehicles (UAVs) are being engineered for increasingly versatile missions. The Multiple Environment Deployable Aerial Item Delivery (MEDAID) team, composed of 16 senior undergraduate aerospace engineering students, developed the XM-24 Orca as part of a capstone design project. This single-use UAV is designed to deliver medical supplies to soldiers in contested or remote environments. Capable of being ground or air-launched, the Orca incorporates spring-loaded swinging wings to meet a compact 610 mm stowed width requirement, a defining challenge in this project, allowing integration with existing drone platforms. The design effort was driven by key requirements: the ability to carry two 2.3 kg medical aid canisters, achieve a range of at least 370 km, sustain endurance for at least 4 h, and execute a dash speed of 51.4 m/s. This unique combination of mission requirements including airborne launch and wing deployment, extended range, and payload delivery necessitated an innovative design previously undocumented in the literature. The design was developed through rigorous computational analysis, refined through wind tunnel testing, and validated through a series of ground-based and flight tests. This paper documents unique design challenges and innovative solutions that offer guidance for future development efforts.

Graphical Abstract

1. Introduction

The MEDAID senior aerospace engineering design team was approached by a large UAV manufacturer with a comprehensive list of requirements for an air-launched medical aid UAV. Driving requirements included a 610 mm stowed width, 370 km range, 4 h endurance, and the internal storage and deployment of two 2.3 kg canisters. Sixteen students, working in subteams over a 9-month period, addressed requirements that influenced subject areas including aerodynamics, stability and control, systems, manufacturing, structures, and propulsion. Each subteam was assigned a subset of requirements to address for the preliminary aircraft design.
MEDAID followed a conventional aircraft design process, guided by the industry sponsor. First, the team analyzed “competitor” aircraft with similar missions and specifications. After determining no existing aircraft could meet the proposed requirements, the team created 32 design concepts with key design features such as payload deployment, propulsion integration, and compact storage. These 32 concepts were reduced to three options, with baseline dimensions derived from the competitor aircraft using parameters such as payload fraction, wing loading, and aspect ratio. The three design concepts were modeled and assessed with a weighted matrix that addressed the designs’ ability to meet key requirements. This analysis highlighted flaws in each design, such as the risk of flutter in the first concept’s (Figure 1, left) single-pivot wing while stowed, the high complexity and large size of the second concept’s (Figure 1, center) wing deployment, and the reduced structural integrity of the third concept’s (Figure 1, right) air-launch mounting due to its top-mounted wings. To address these flaws, MEDAID created a new design with the simplified deployment method of the third concept, but with the wings mounted below the fuselage and folded backwards in two halves. Detailed design, manufacturing, and testing work, including geometry iterations, was performed on this initial design.
MEDAID’s detailed design work involved using a series of software tools and methods that progressively increased in fidelity. A flowchart with representative models and the tools used is presented in Figure 1.
An aircraft sizing code was used to refine the baseline geometry to meet performance requirements. Using the updated geometry, MEDAID selected an airfoil and determined control surface sizing. A detailed computer-aided design (CAD) model was created and used for structural and aerodynamic analyses. Aircraft subsystems were tested in conjunction with wind tunnel testing, and minor design improvements were identified and implemented. Finally, a flight test article (FTA) was assembled and tested to verify that the aircraft met all requirements.
The flight test article and commercial article shared the same geometry except for two important differences. Fixed landing gear was added to the FTA to facilitate a series of flight tests. Electric propulsion was chosen for the FTA due to budgetary constraints not present for the commercial aircraft. Requirements that could not be experimentally verified due to the FTA configuration were verified analytically. The following paper describes the design, manufacturing, and testing process of the aircraft in further detail, including the verification of requirements associated with the aircraft’s mission.

2. Background

Unmanned aerial vehicles (UAVs) have transformed modern warfare by offering aerial reconnaissance and weapons delivery for a relatively low cost. Smaller UAVs include aircraft designed to fit into small spaces and aircraft intended for air deployment. Examples of air deployed vehicles date back to World War II, including the German radio-controlled Fritz X bomb and Hs 293 A-1 missile. Both the Fritz X and Hs 293 were developed as anti-ship munitions that were deployed from separate aircraft and guided towards their targets using radio controllers, precursors to modern air dropped precision munitions [1,2]. An additional example of air-dropping aircraft can be traced back to the Cold War-era Lockheed D-21 “Tagboard” program. The D-21 demonstrated one of the earliest reusable air-launched reconnaissance drones, pioneering concepts in high-speed deployment and recovery [3]. However, most historical air-launched systems either relied on large, purpose-built carrier aircraft or were expendable munitions rather than reusable UAVs.
Despite growing interest in unmanned systems, the development of compact air-launched UAVs is under-represented when compared to more conventional deployment methods. A notable folded UAV program is Japan’s Fuji Tayouto Cogata Mujinki (TACOM) evaluation program, initiated in 1995 by Fuji Heavy Industries and the Technical Research and Development Institute. Designed as a multirole unmanned platform, the TACOM featured foldable delta wings, autonomous flight capabilities, and was designed to be carried and dropped from the F-4EJ Phantom. The program was completed in 2001 and deemed a success for the research of air-launched UAVs [4]. Although TACOM and similar efforts proved that collapsible and air-launched UAVs are feasible, most modern designs remain small-scale and mission limited. Research is lacking on medium-scale (Group 2–3) UAVs that are deployable from standard aircraft stores, leaving key design questions unanswered [5].
As alluded to previously, one of the most significant challenges in designing air-launched UAVs is integrating a wing stowage system that meets the spatial constraints of the host aircraft while preserving aerodynamic performance during flight. Recently, Raytheon has worked to address these concerns with the Coyote tube-launched UAV. This aircraft, designed for intelligence and reconnaissance, incorporates small folding wings that deploy immediately after release. With a maximum wingspan of 1.5 m but a storage width of only 127 mm, the Coyote demonstrates the effectiveness of compact folding wing designs in small, lightweight platforms with low wing loadings. Due to its size, however, the Coyote is restricted to a maximum range of 130 km, an endurance of 1 h, and cannot drop heavy payloads [6].
While air-launched UAV technology has demonstrated feasibility through historical programs like the D-21 and modern systems like the Raytheon Coyote, research remains limited in the development of medium-scale UAVs capable of carrying payloads for specialized missions while meeting space constraints to be deployed from existing aircraft. A recent study on orthogonal biaxial folding wings has provided insights into deployment modes, required torque for actuation, and aerodynamic performance for small UAVs [7]. However, these analyses primarily address small or laboratory-scale systems and do not consider the challenges of larger mission-oriented UAVs with payload, range, endurance, and structural integration requirements. Similarly, aircraft such as the AeroVironment Switchblade, Launch UAV’s Flying Fish, Zipline P1, Boeing-Insitu ScanEagle, Northrop Grumman Bat, General Atomics Sparrowhawk, and Lockheed Martin Stalker offer some combination of air-deployment, efficient folding, high range and endurance, high payload capacity, and accurate payload deployment, but none combines all five characteristics [8,9,10,11,12,13,14].
The research presented in this paper addresses these underexplored concepts by developing a UAV that integrates deployment from a standard 14.0 in (356 mm) ejector rack, a 610 mm folded-width envelope with a mechanical swing-wing system, Group 2–3 payload capacity, range and endurance requirements, and a reliable payload delivery system. This combination of competing requirements presented a number of packaging challenges relating to its maximum width. To remain stable through all phases of flight, the aircraft needed to mount and stow its wings, store and deploy its payload, interface with an ejector rack, and carry 4 h worth of fuel all near its center of gravity (CG) while fitting within a 610 mm wide space. These packaging challenges become more difficult with the inclusion of support structures, cabling, and access hatches. This work provides an innovative solution to the packaging problem by advancing knowledge in wing deployment mechanisms for Group 2–3 UAVs and providing insights into the integration of a payload deployment system. This report establishes new findings and success for air-launched UAVs requiring sizeable payload delivery, advancing the state of the art in UAV development technology.

3. Concept of Operations

The concept of operations (ConOps) outlines the XM-24 Orca’s design requirements, a sample mission profile, and an overview of risk analysis. Objectives are defined to meet system requirements and mitigate risks.

3.1. Design Requirements

MEDAID’s 62 system requirements were created or derived from one or more of the following: project requirements, technical requirements, and design constraints. Project requirements were given directly to the team at the beginning of the project from the industry sponsor. Technical requirements were created at the beginning of the project based on stakeholder perspectives such as safety, regulations, societal, and business impacts. Five technical requirements were created to provide a competitive advantage when compared to similar aircraft. These requirements were revisited and improved through risk assessments, where the initial requirements needed further specification or new requirements were needed to mitigate risk. Finally, design constraints were discovered as the team researched the air-launched portion of the mission. All requirements were categorized as either Operational (OP), Safety (SA), Flight Performance (FP), Aerodynamics, Stability and Control (AS), or Structures (ST) and are listed in Appendix A.
Several Operational requirements drove the design of the XM-24. These driving requirements included a maximum weight of 55.0 lbs (24.9 kg), two 2.3 kg payloads, and air deployment constraints including a 610 mm maximum storage width. The 55.0 lbs (24.9 kg) weight limit, based on the Federal Aviation Administration’s (FAA) classification of a small UAV, required weight reductions following every design cycle [15]. The requirement to internally store and deploy two 2.3 kg, 254 mm by 102 mm diameter canisters also influenced the weight and structural design of the aircraft. The most impactful requirements were the air deployment specifications. The mission requires under-wing deployment from a carrier aircraft necessitating a 610 mm storage width limitation. To interface with the carrier aircraft, the XM-24 needed compatibility with standard 14.0 in. (356 mm) lugs.
Flight Performance, Aerodynamics, and Stability and Control requirements drove the XM-24’s range, endurance, dash speed, altitude, and handling characteristics. The aircraft was required to achieve a minimum range of 370 km, endurance of 4 h, dash speed of 51.4 m/s, and operational altitude of 3700 m Mean Sea Level (MSL). These parameters guided propulsion and aerodynamic configuration. The need to satisfy the nine static stability criteria and maintain full control of yaw, pitch, and roll drove the wing and tail designs.

3.2. ConOps and Mission Performance

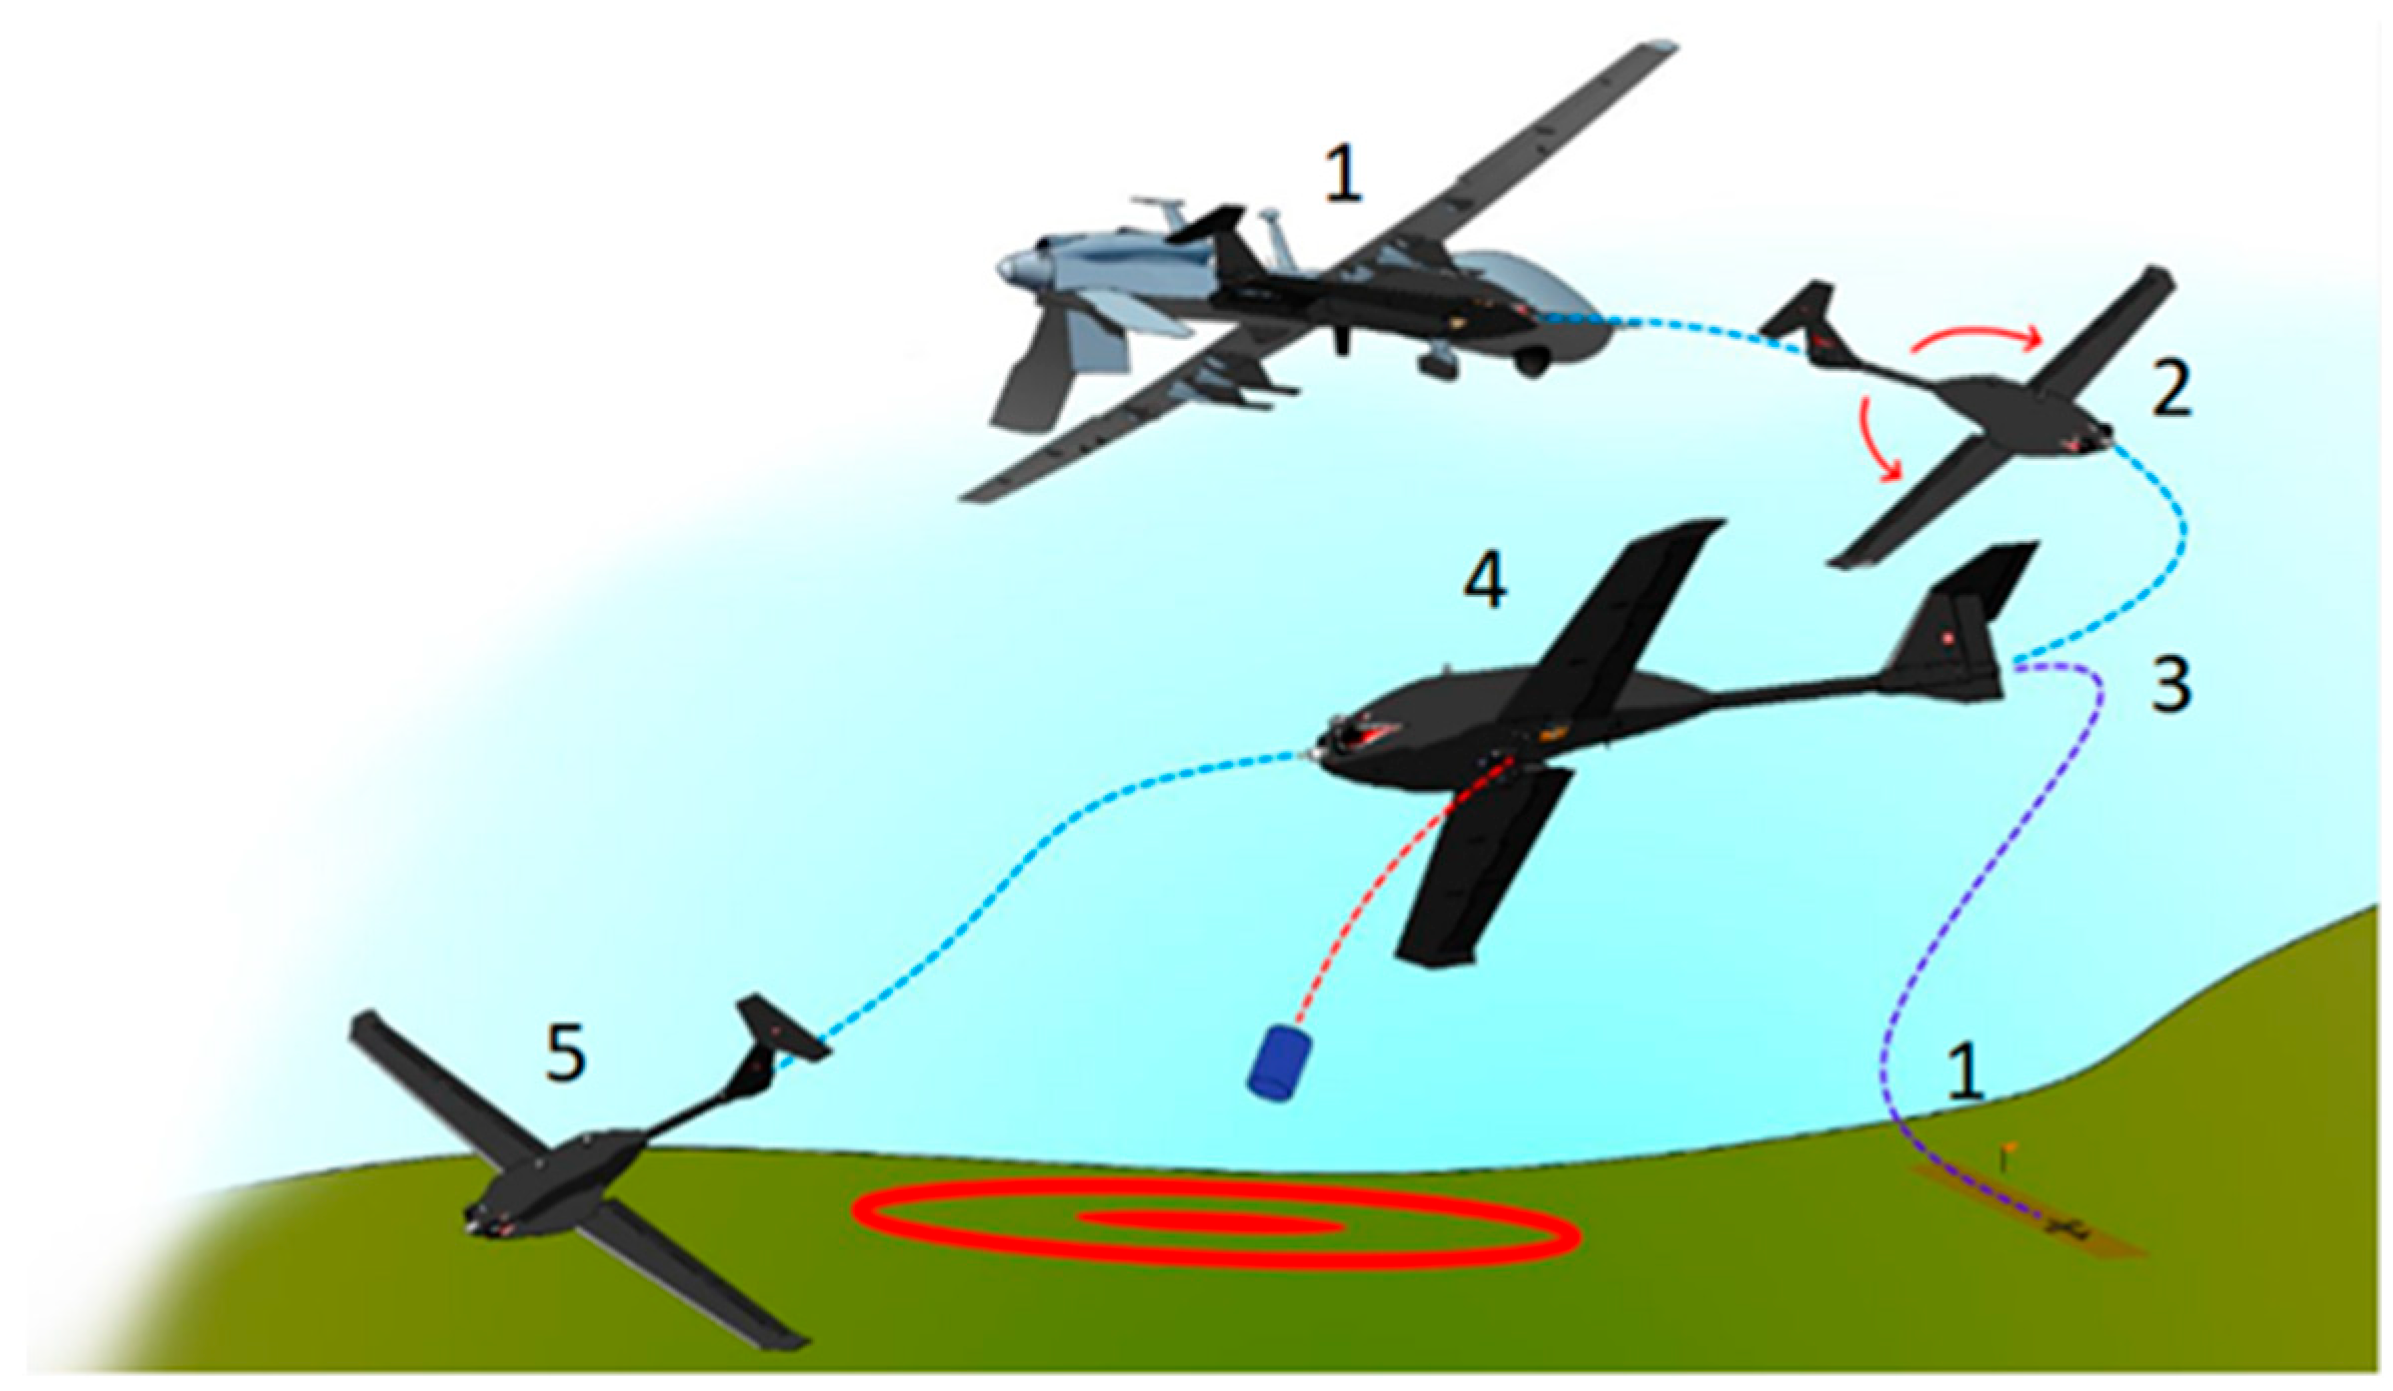
MEDAID’s concept of operations for the XM-24 Orca includes deployment from either the air or the ground, wing deployment (if applicable), cruise, payload deployment, and landing. Air deployment is achieved by dropping from a carrier aircraft as seen in Figure 2.
Figure 2 shows the five-step ConOps. For air deployment (step one), the aircraft’s wings begin in the folded configuration. After disconnecting from the carrier aircraft, the wings swing forward (step two), lock into place, and the aircraft proceeds with the mission (step three). For ground deployment (step one), the wings begin fully extended. Takeoff is achieved using either temporary or integrated landing gear depending on mission configuration. After the aircraft has been deployed, it follows waypoints to the designated drop zones (step three). Arriving at the payload deployment location (step four), the aircraft releases the payload and if necessary, continues following waypoints to the next deployment location. After all payloads have been deployed, the aircraft navigates towards its landing destination, completing its mission using integrated landing gear or belly landing (step five). The landing gear is simple to install as an optional configuration. If installed, the aircraft is reusable. Without gear, the aircraft is assumed to be one-time use.
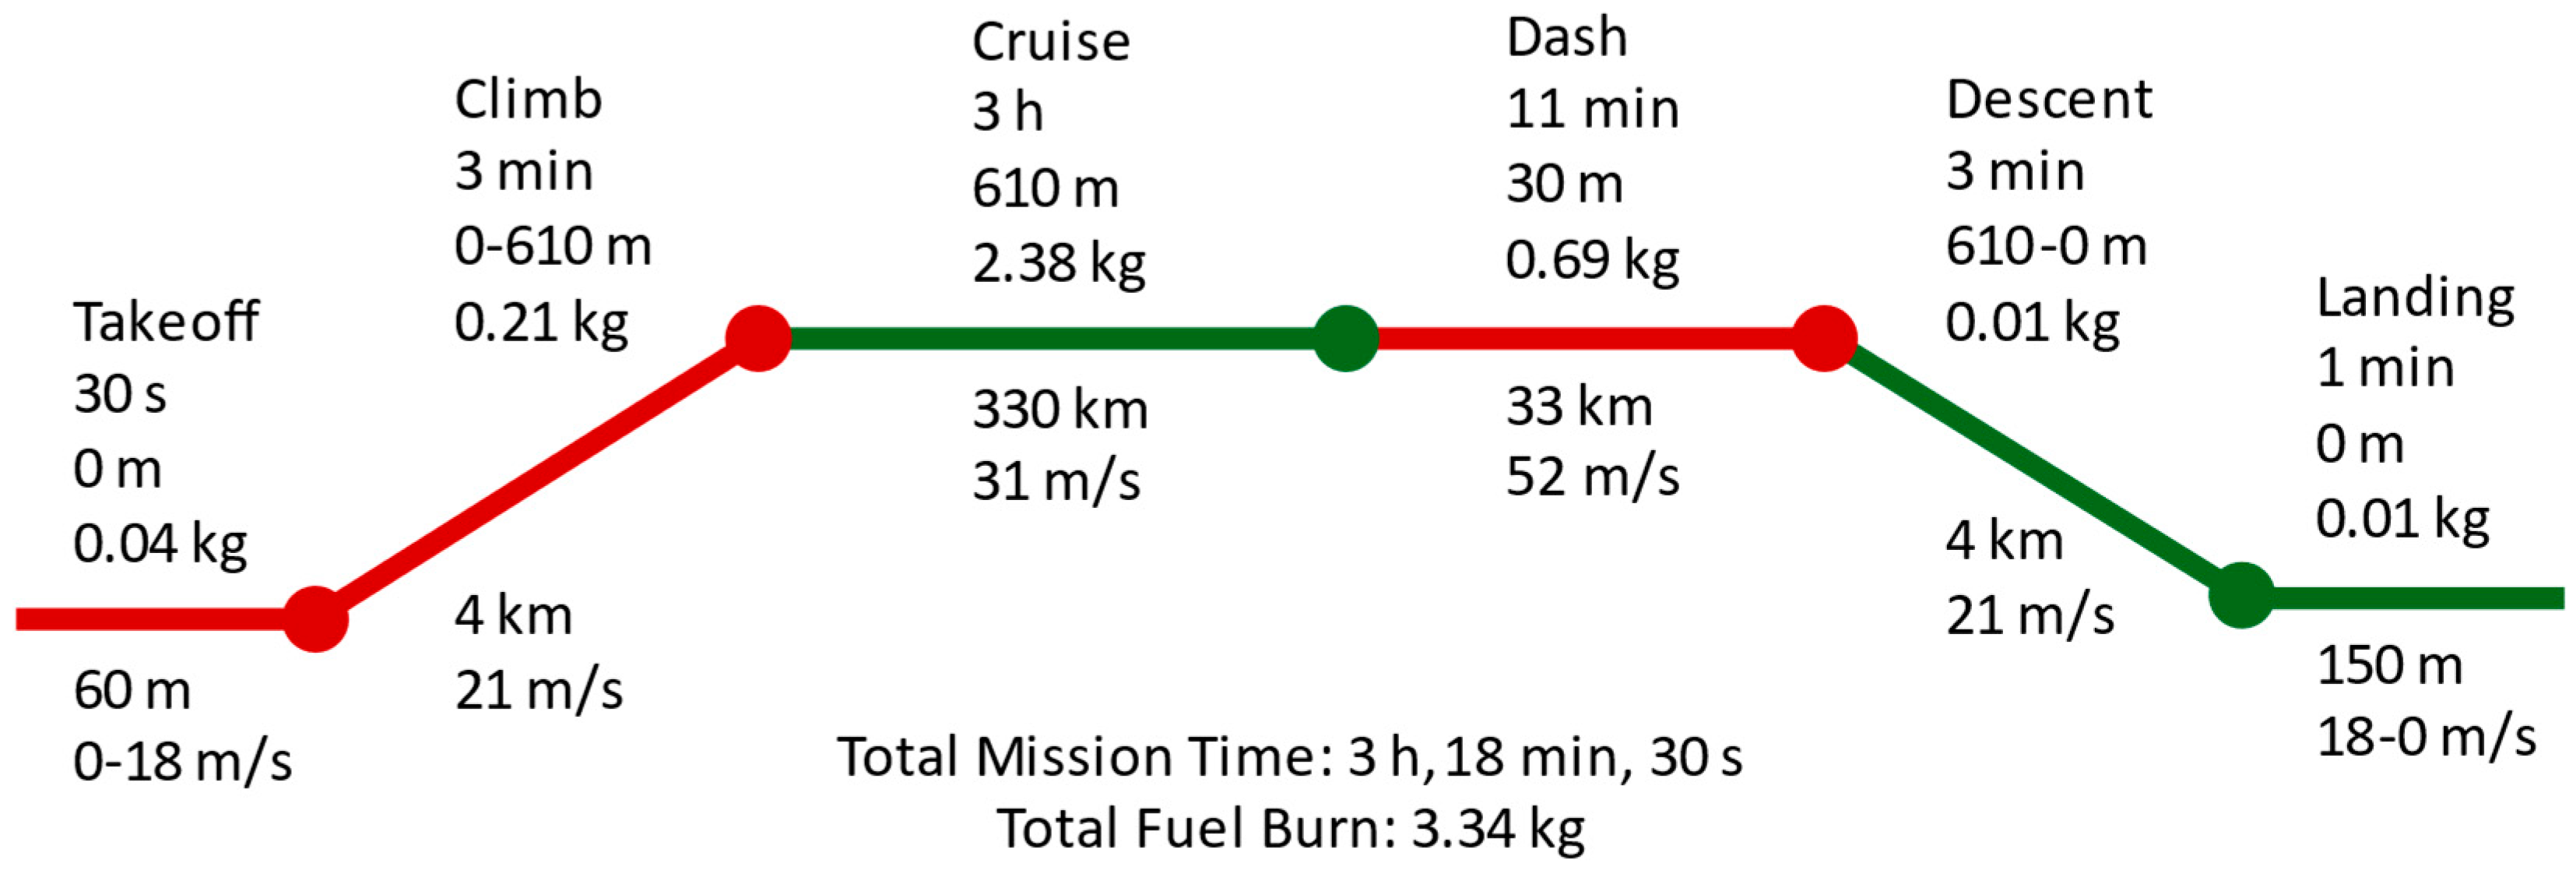
Sufficient fuel storage is critical to the mission of the aircraft. A fuel burn and altitude profile of the aircraft during a typical mission is shown in Figure 3.
Figure 3 represents a standard ground-launched mission profile for the aircraft. The aircraft in this sample mission performs a brief full-throttle takeoff and then a maximum rate climb to 1500 m MSL. These two stages of the mission are expected to take approximately 3.5 min. In that time, the aircraft will accelerate and maintain speed for a maximum climb rate (Vy) of approximately 21 m/s. Here, the aircraft will burn approximately 0.2 kg of fuel. Once at cruising altitude, the aircraft will maintain a steady 31 m/s cruise for about 3 h. This phase will burn approximately 2.4 kg of fuel, and the aircraft will transit approximately 330 km, depending on wind conditions. After this phase, the aircraft will transition into a dash of 52 m/s and will descend to treetop level or similar low flight. This flight phase corresponds to an approach to a drop zone in contested territory. This phase is predicted to last 11 min, covering roughly the last 33 km to the drop zone while burning 0.7 kg of fuel. Once the aircraft has reached the drop zone and deployed its payload, it will reduce throttle to idle and prepare for landing. The aircraft will then approach the landing zone at 18 m/s and touch down on its belly or landing gear. The descent and landing are expected to take approximately 4 min and burn 0.02 kg of fuel. Over the course of the mission, the aircraft will cover about 370 km, remain in the air for 3.3 h, and burn a total of 3.3 kg of fuel.

3.3. Risks

The risk analysis process was derived from the Society of Automotive Engineers (SAE) standard ARP4761A, “Guidelines and Methods for Conducting the Safety Assessment Process on Civil Airborne Systems and Equipment” [16]. This standard includes the method of quantifying risk level and prioritization, which was adapted to create the following risk analysis process:
  • Identify risks associated with high-level aircraft systems;
  • Identify the function affected by each risk;
  • Determine the likelihood of risk occurrence;
  • Determine the impact of risk occurrence;
  • Determine risk priority;
  • Mitigate high- and medium-priority risks.
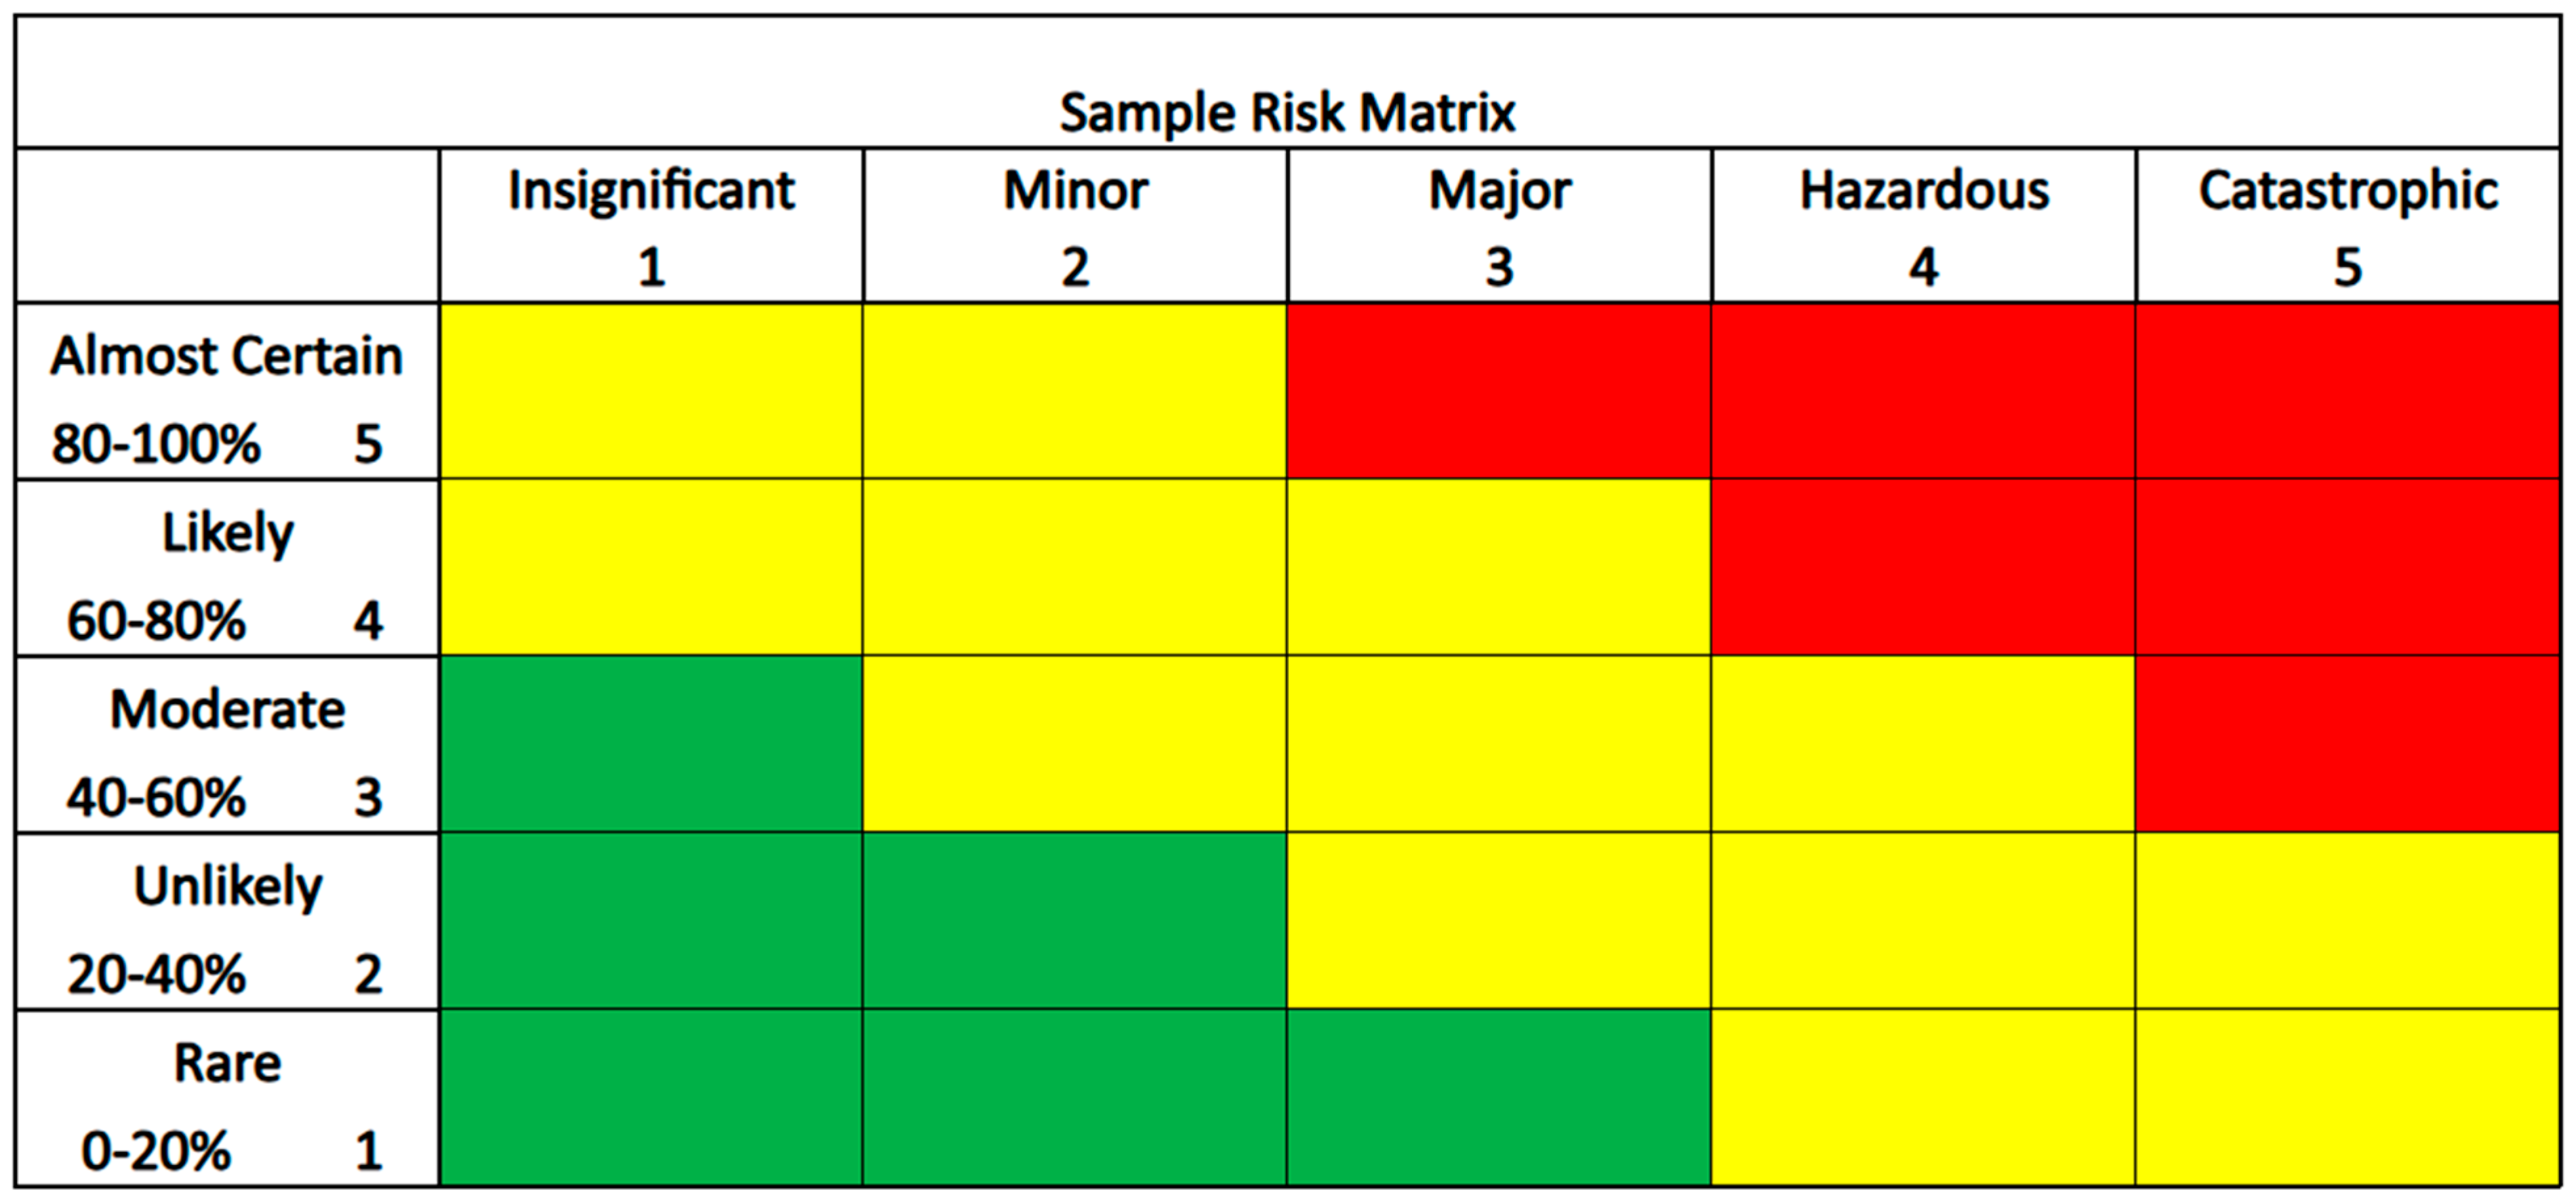
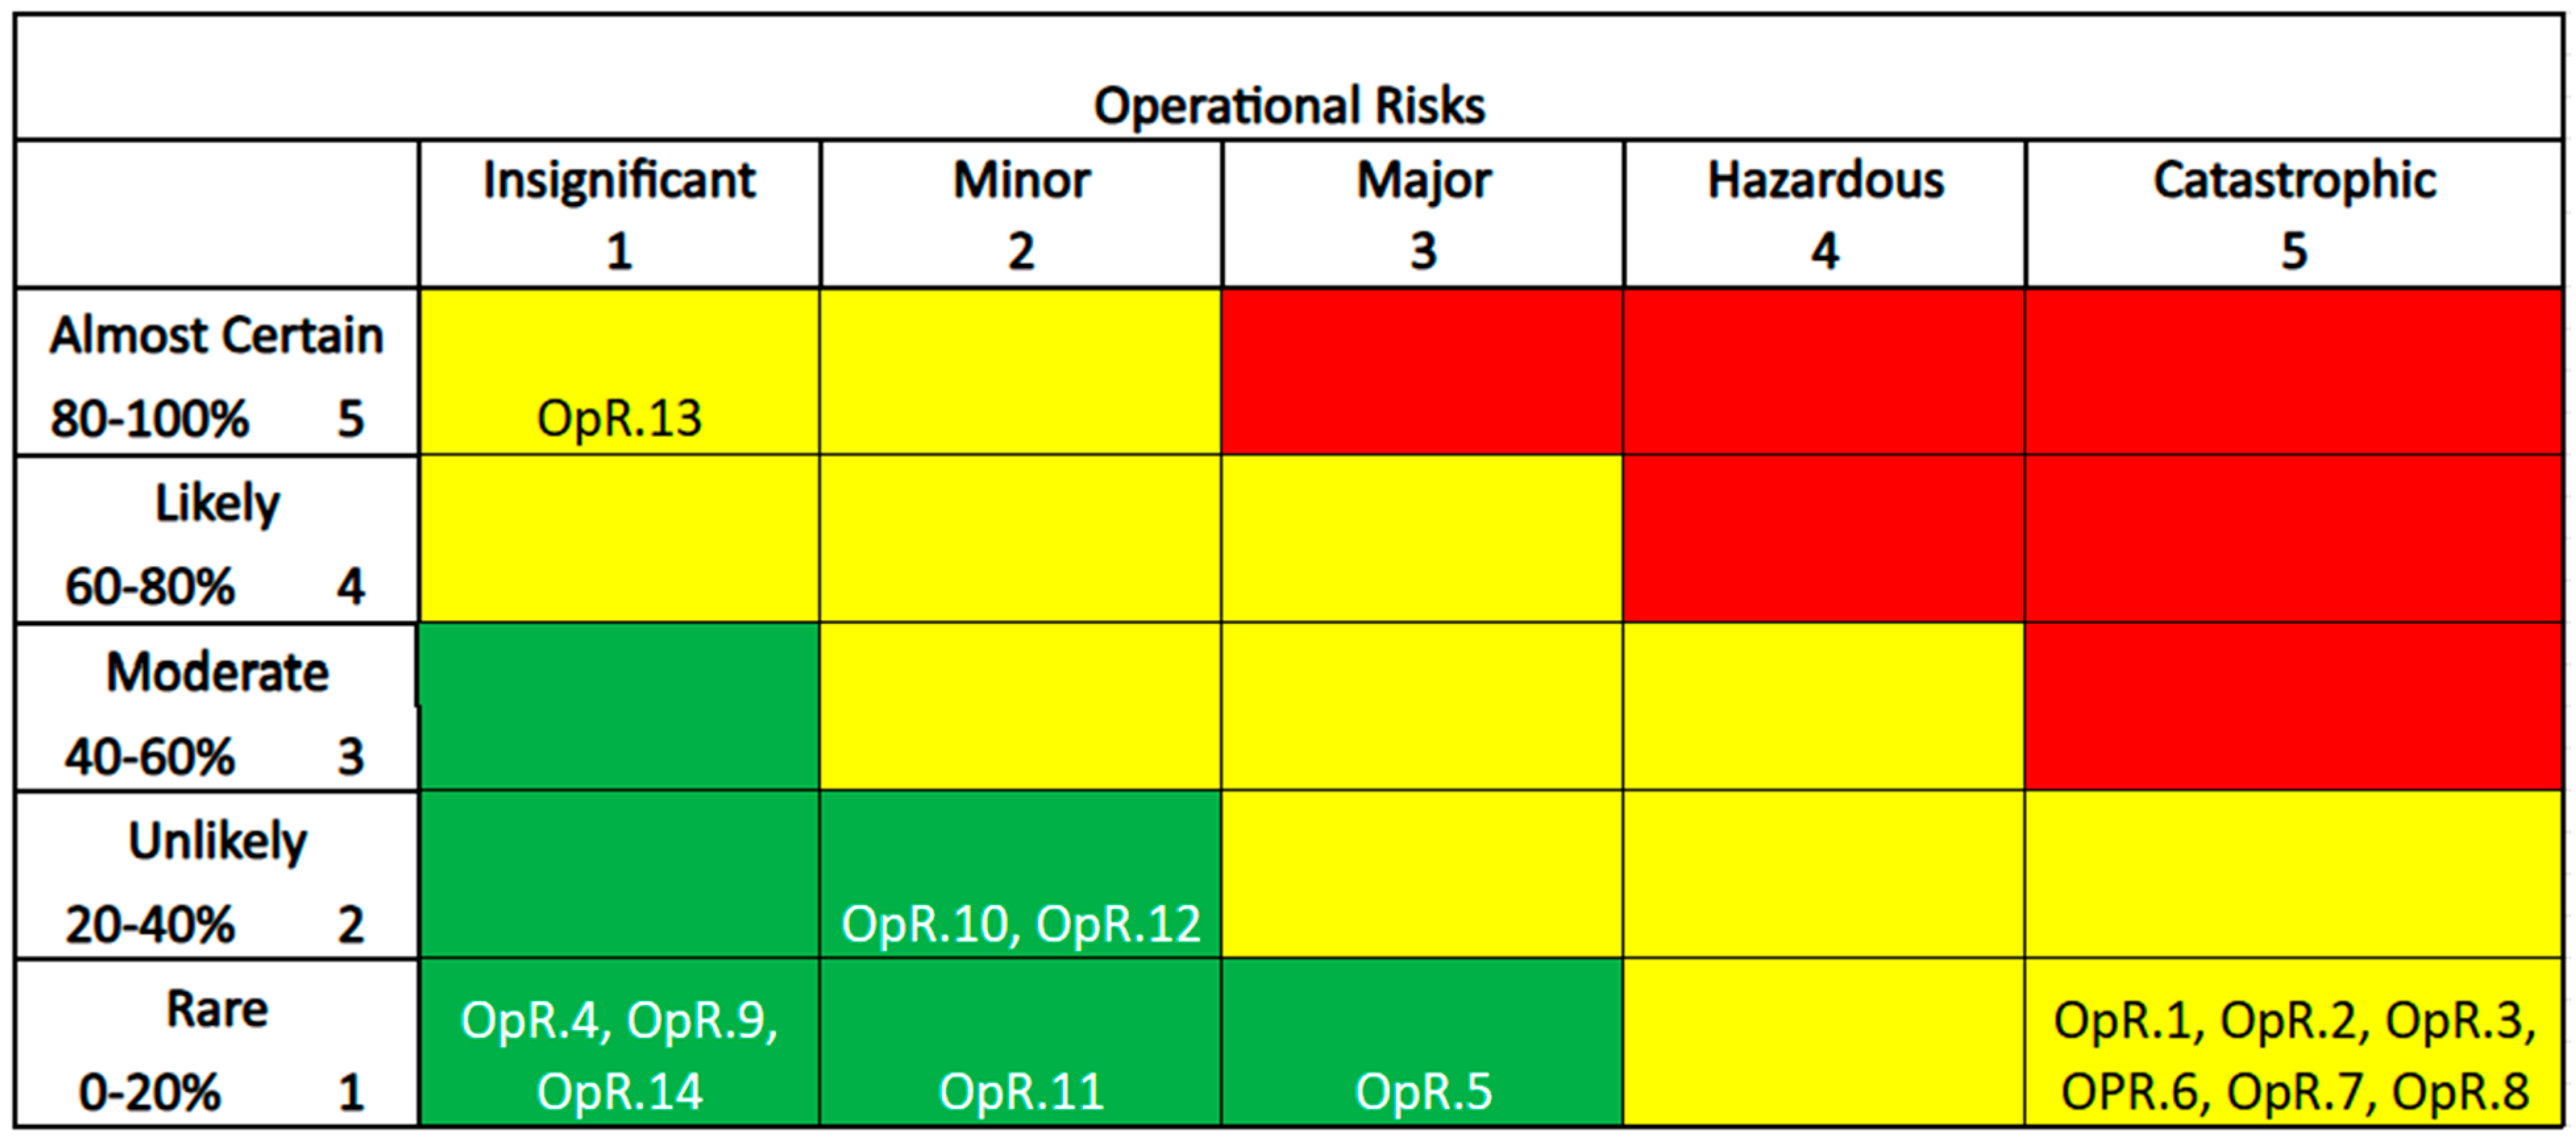
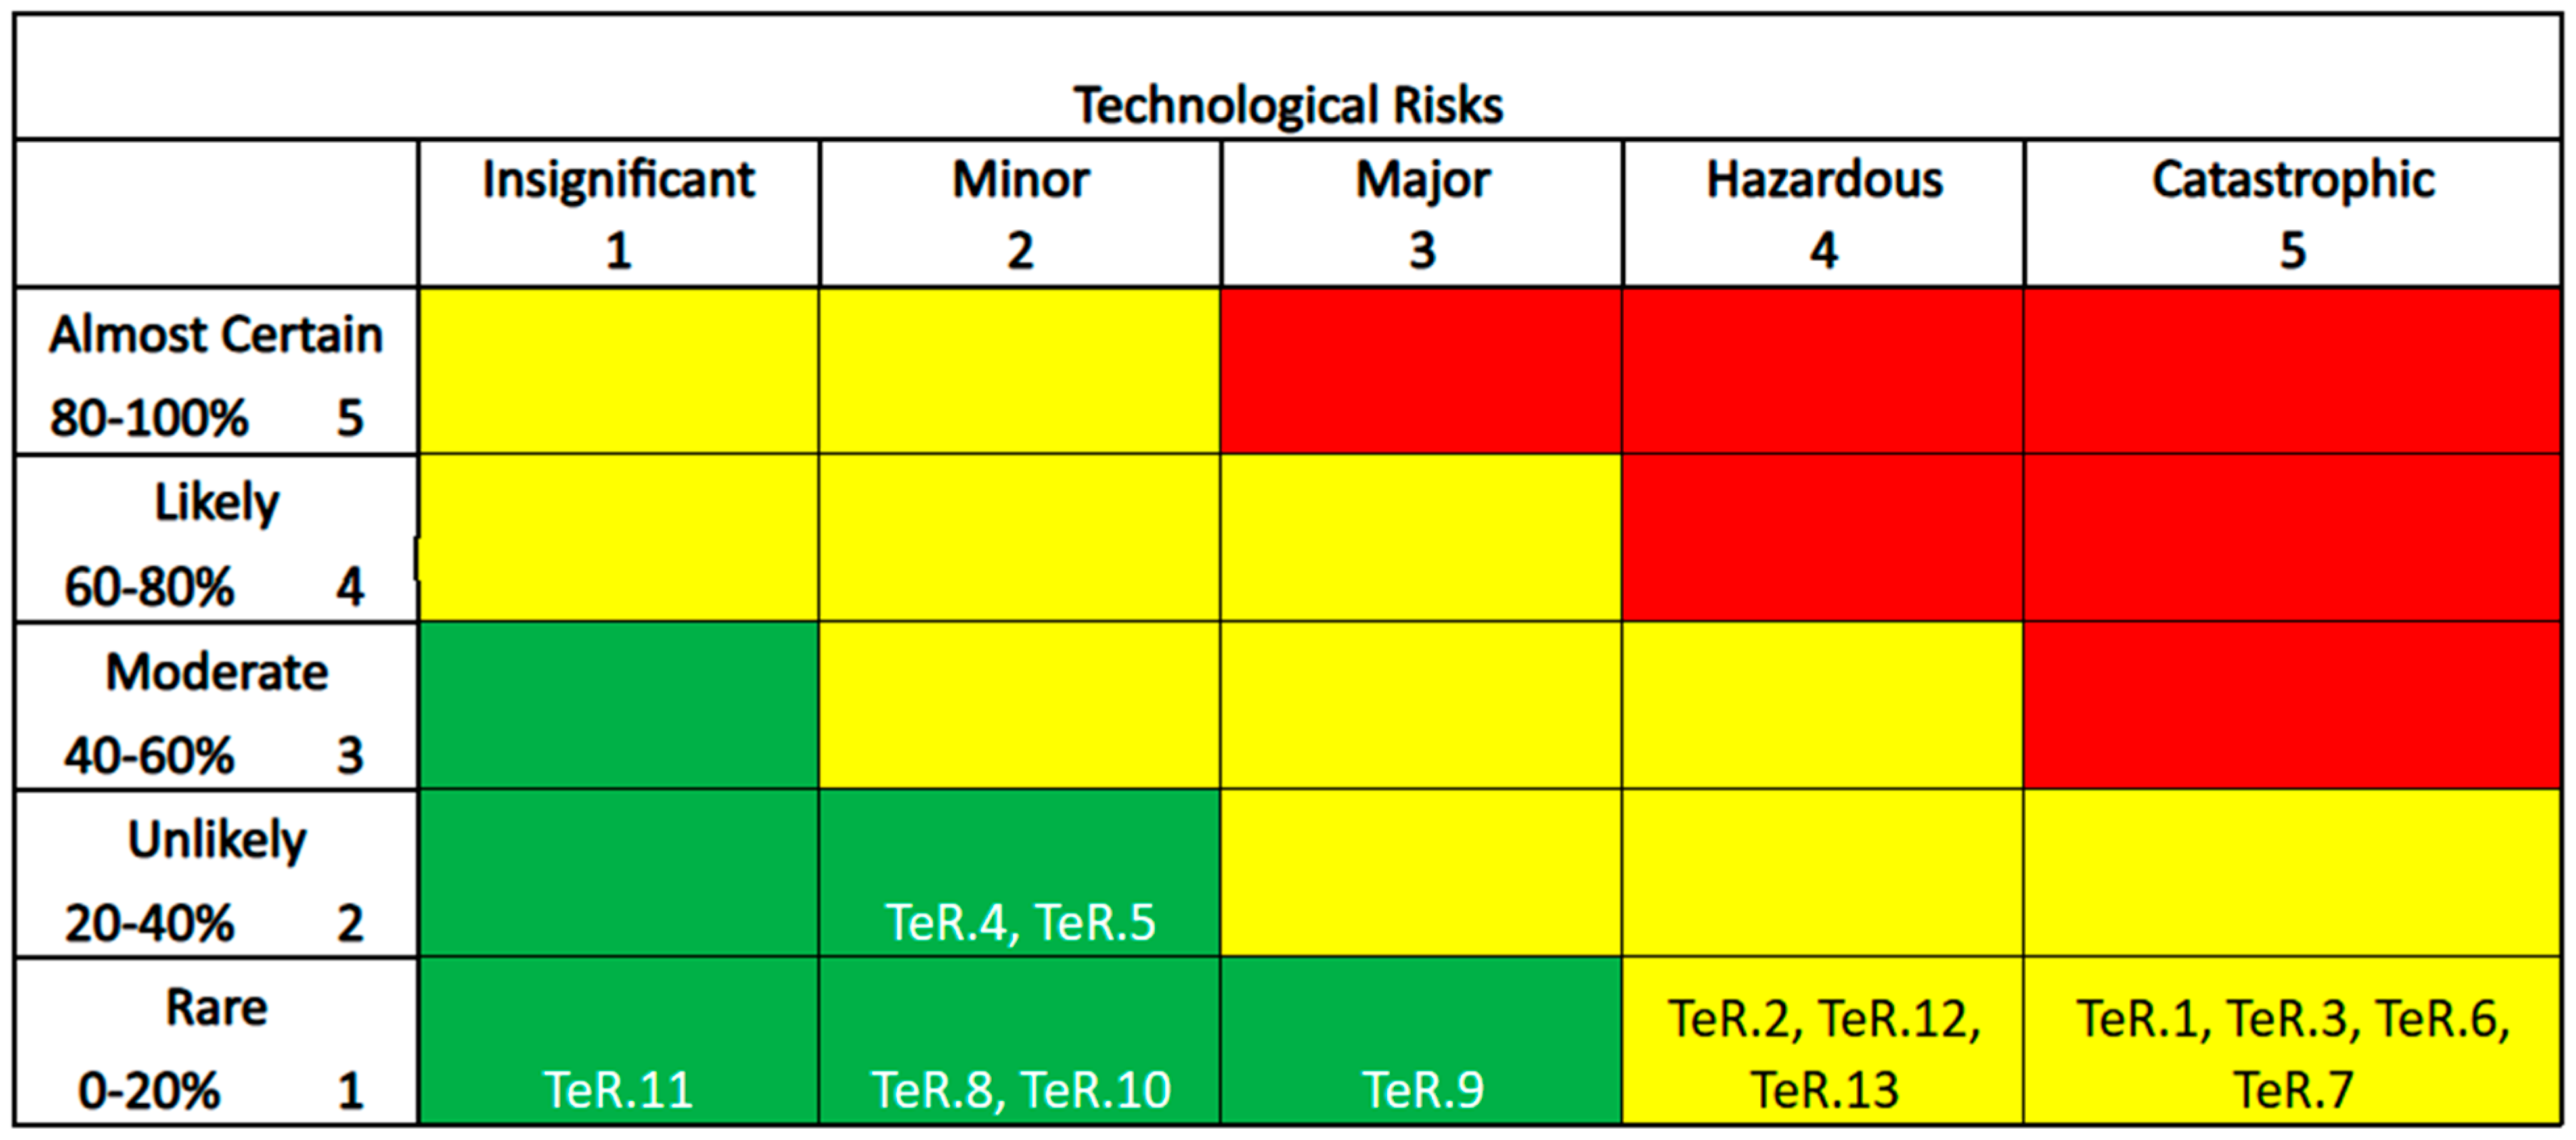
This process was applied to risks using the guidelines for likelihood and impact as shown in the sample risk matrices in Appendix B. Risks were then decomposed into two categories: operational risks and technical risks. As the design of the aircraft progressed, the risk likelihood was assessed through testing.
Two high-priority technical risks influenced the design of the aircraft: wing deployment failure and payload deployment failure. These risks occurred more than 80% of the time during subsystem testing. The high probability demanded further design iteration focusing on both systems. These risks remained high-priority until ground and flight testing proved that the designs had a low risk of failure. Both risks were reduced to medium priority due to their low probability but high potential impact on mission success. Further mitigation involves thorough pre-flight and post-flight inspections of the wing and payload deployment subsystems to ensure continued mission readiness and airworthiness.

4. Design and Analysis

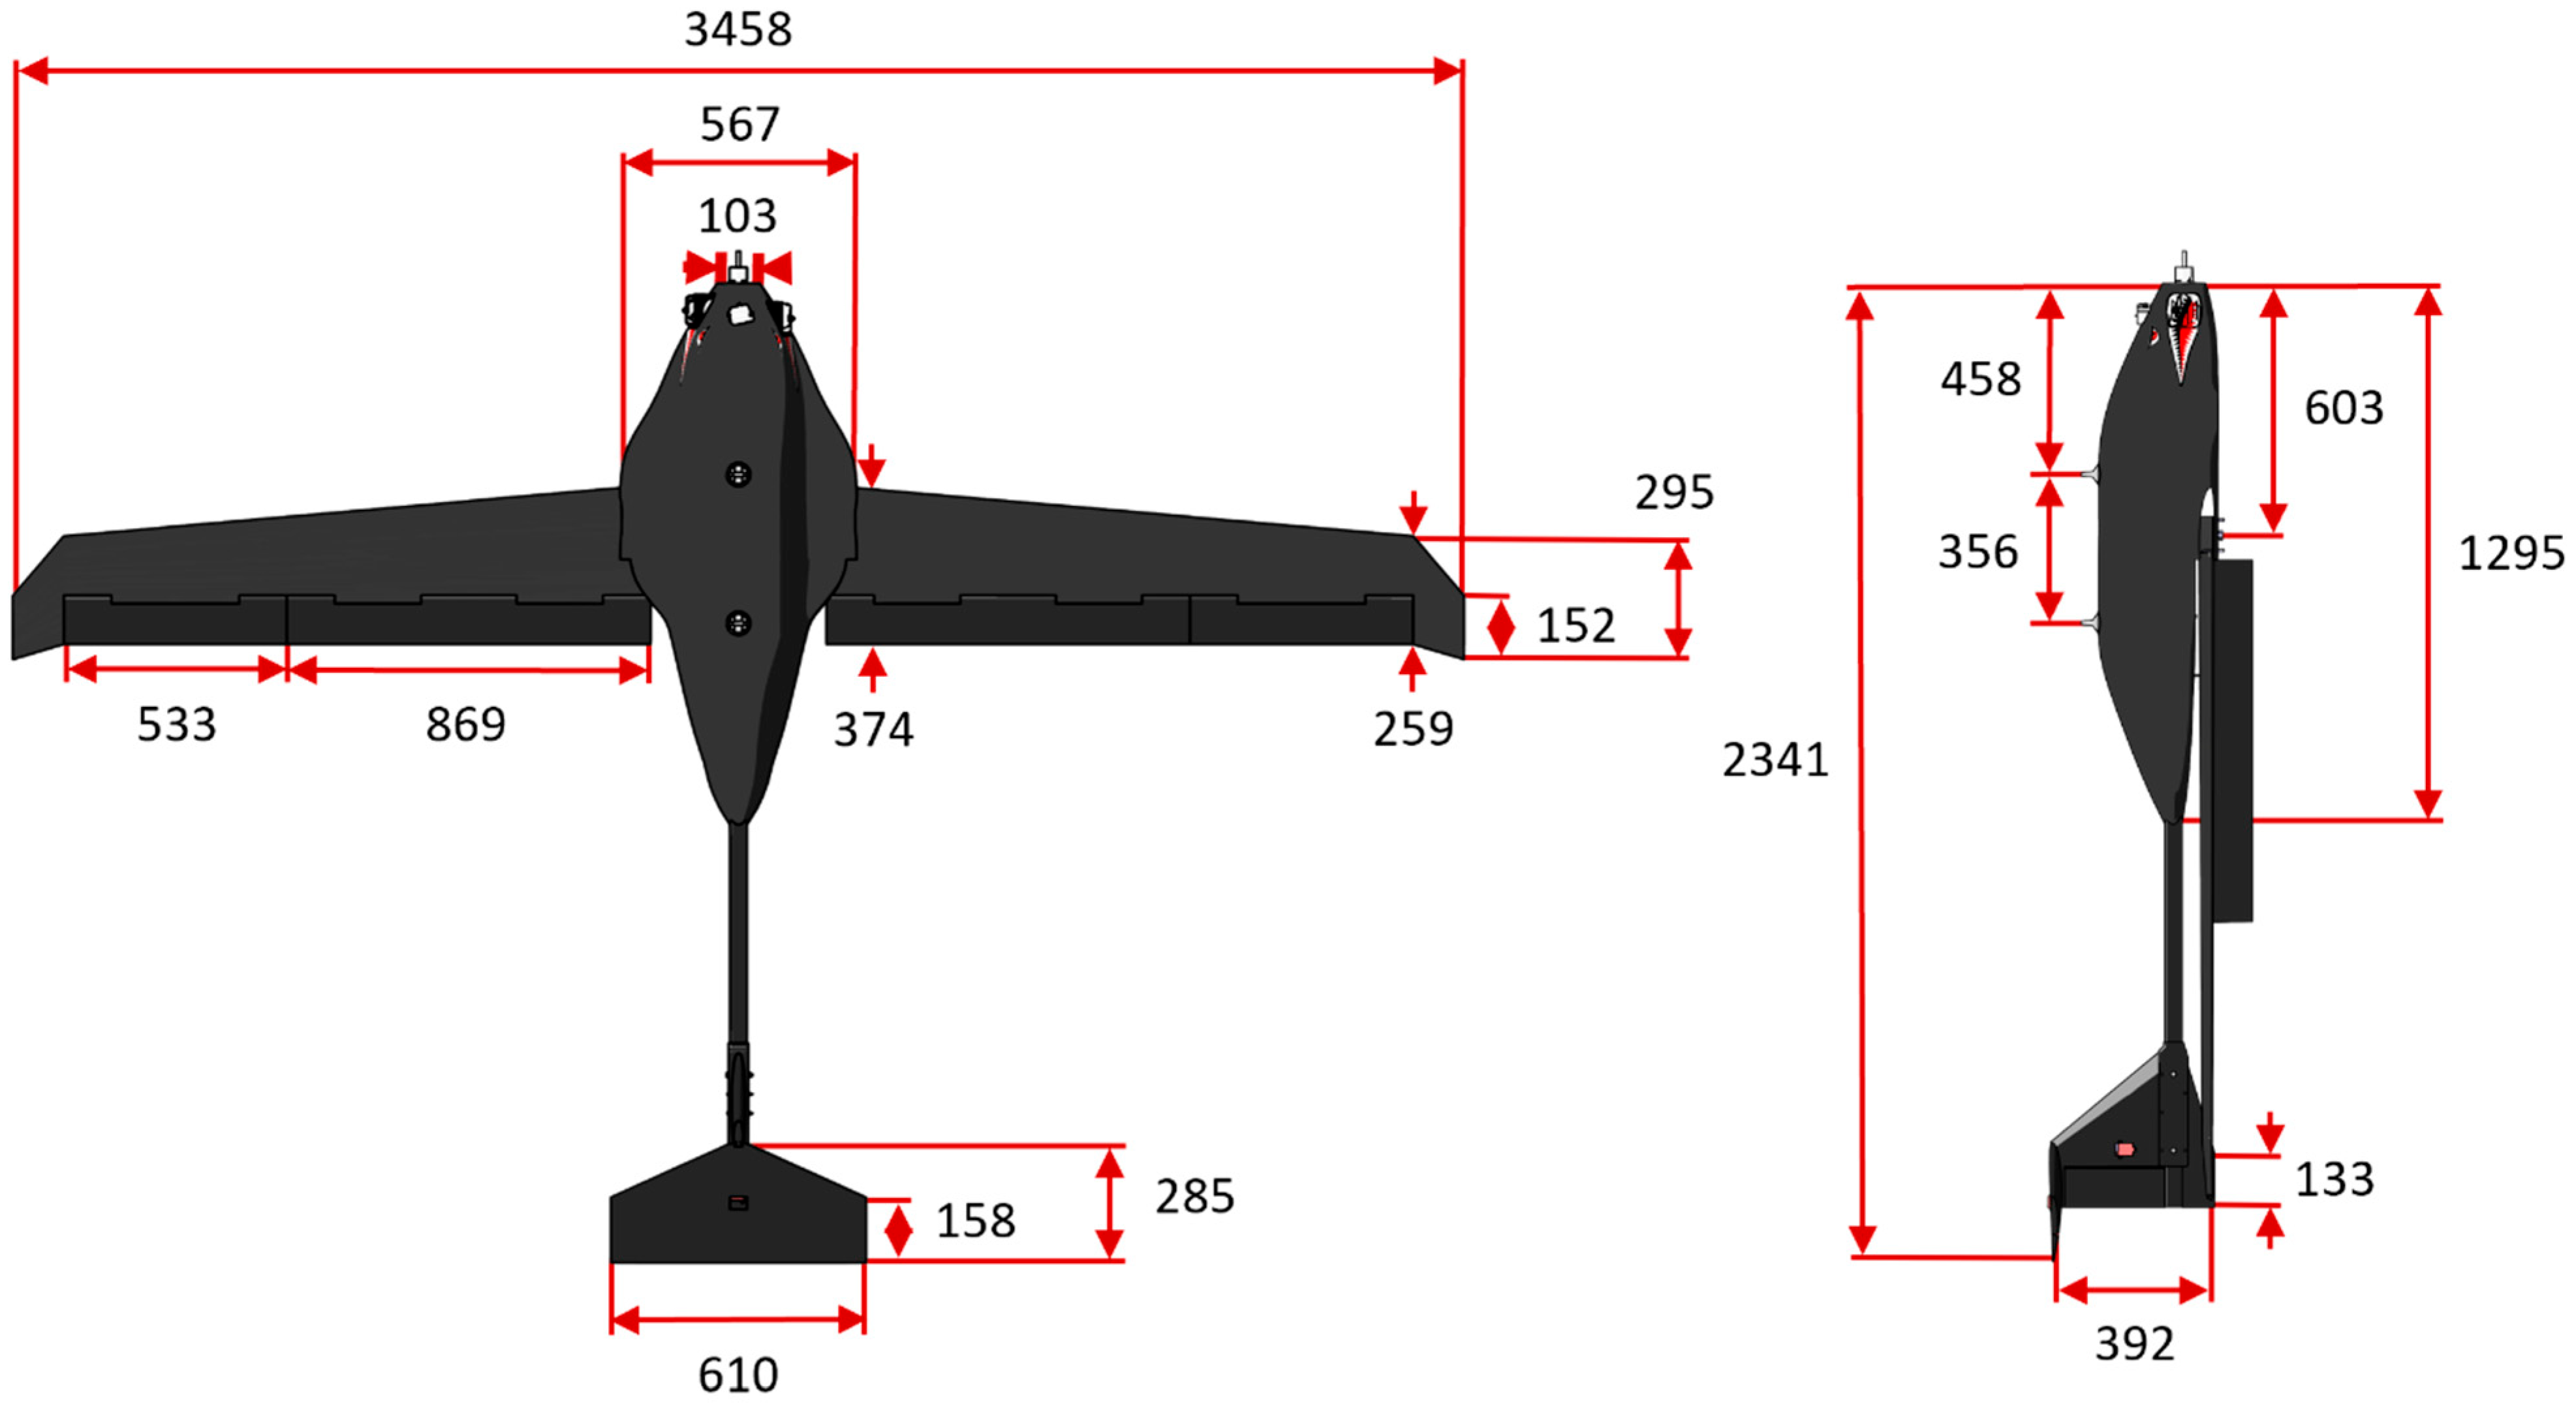
To develop a cohesive aircraft design capable of satisfying customer and design requirements, software and mathematical simulations were utilized to test aerodynamic, stability, control, propulsive, and structural performance. A set of scripts based on classic aircraft conceptual design methods were developed and used for aircraft sizing. The design was then refined iteratively using higher fidelity analysis. Finally, the design was manufactured, incorporating new refinements as problems were discovered. The final design can be seen in Figure 4, where the only major external change between the final and baseline designs is the position of the horizontal tail.

4.1. Aerodynamics

The aircraft needed 4 h of endurance, 370 km of range, a dash speed of at least 51.4 m/s, and a minimum service ceiling of 3700 m MSL. The storage width and structural limitations were the primary constraints on the aerodynamic design, since they limited the chord length and wingspan, respectively.
Three analysis methods were used to aid design decisions. XFLR5 was used first to rapidly evaluate the behaviors of candidate airfoils and select an airfoil that best met design requirements [17]. The high cruise speed requirement (relative to wing loading) would normally dictate a low-camber airfoil. However, wing folding and storage requirements restricted wing mounting orientation to zero angle of incidence relative to the fuselage. In turn, to minimize drag during cruise, the wing needed moderate camber to generate lift while retaining a horizontal fuselage. Thus, the Selig 7075 airfoil was chosen for its adequate lift and low-drag performance near 0° angle of attack (α).
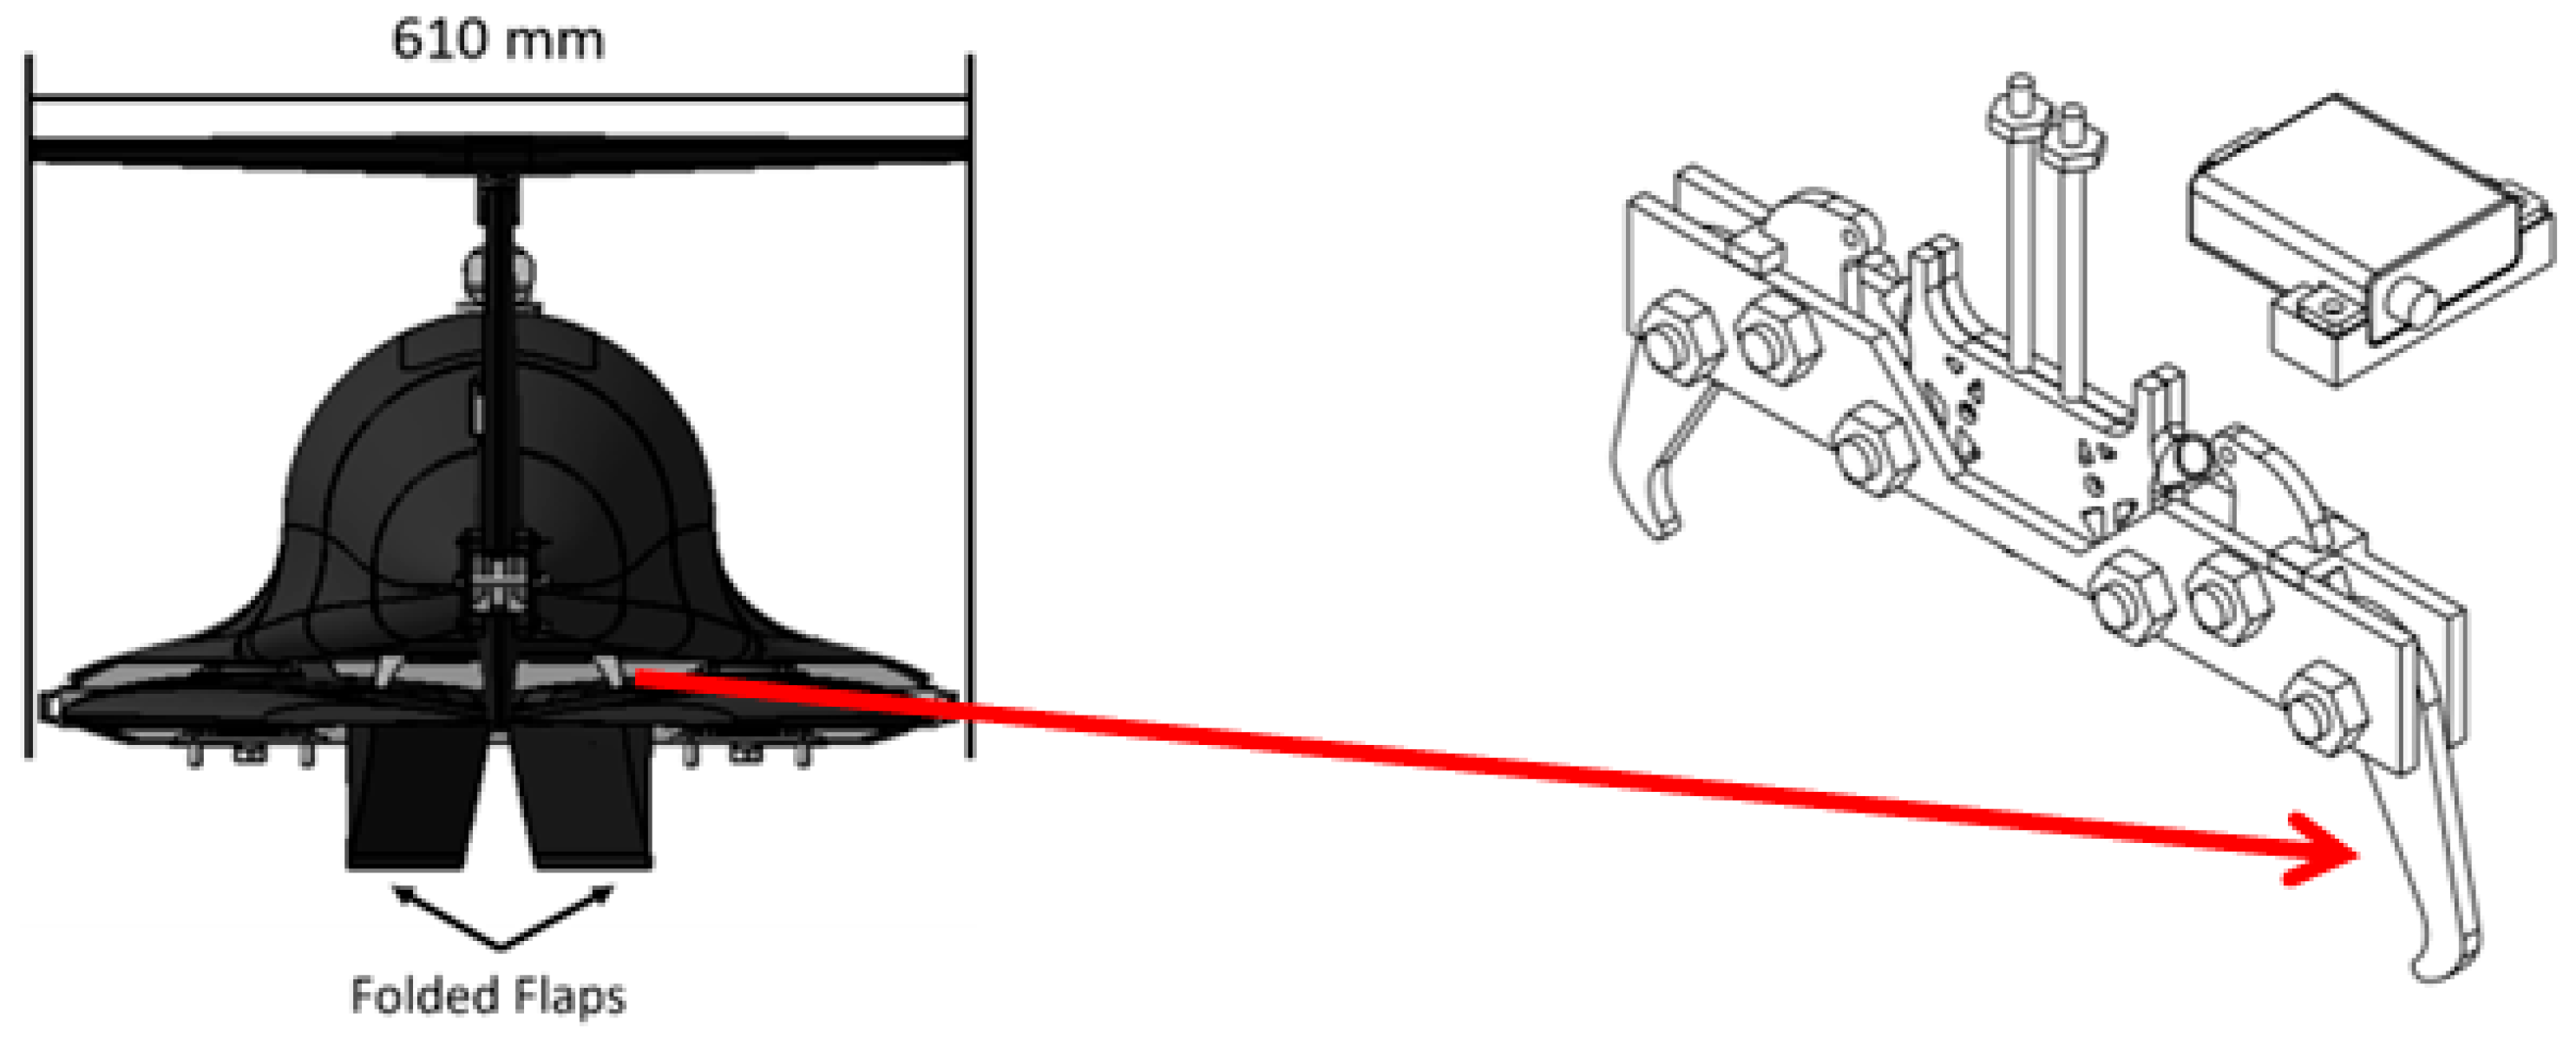
Once the Selig 7075 airfoil was chosen, a lifting line code [18] was used to select a wing taper ratio that maximized span efficiency. Hoerner’s drag methods [19] were then used to predict the drag of the whole aircraft. A driving requirement for the wing shape was the limited stow width of 610 mm. This necessitated a folding wing design. With wings folded and stowed side-by-side, the maximum wing chord length was 305 mm. To achieve sufficient wing area for low-speed flight, a large wingspan (b = 3.46 m) was needed, supplemented by 90° folding flaps to increase the chord length beyond 305 mm, yielding an aspect ratio of 13. For more information on wing area limitations, refer to Section 4.5. Wing sizing is summarized in Table 1.
Table 1 lists key design features of the XM-24’s wings. One parameter of note is the high aspect ratio, since aircraft that fly at a cruise coefficient of lift (CL) of 0.4 typically have a lower AR. However, to preserve wing area, a larger wingspan was required due to the limitation on chord length from the stowage requirement. The resulting wing shape led to an efficiency factor (e) of 0.88. Typically, an e value of 0.9 or higher is desired, but gaps in the fuselage for wing stowage reduced span efficiency.
Using the wing dimensions in Table 1 and basic sizing of the fuselage, Hoerner’s method was used to estimate airplane drag during cruise, as shown in Table 2.
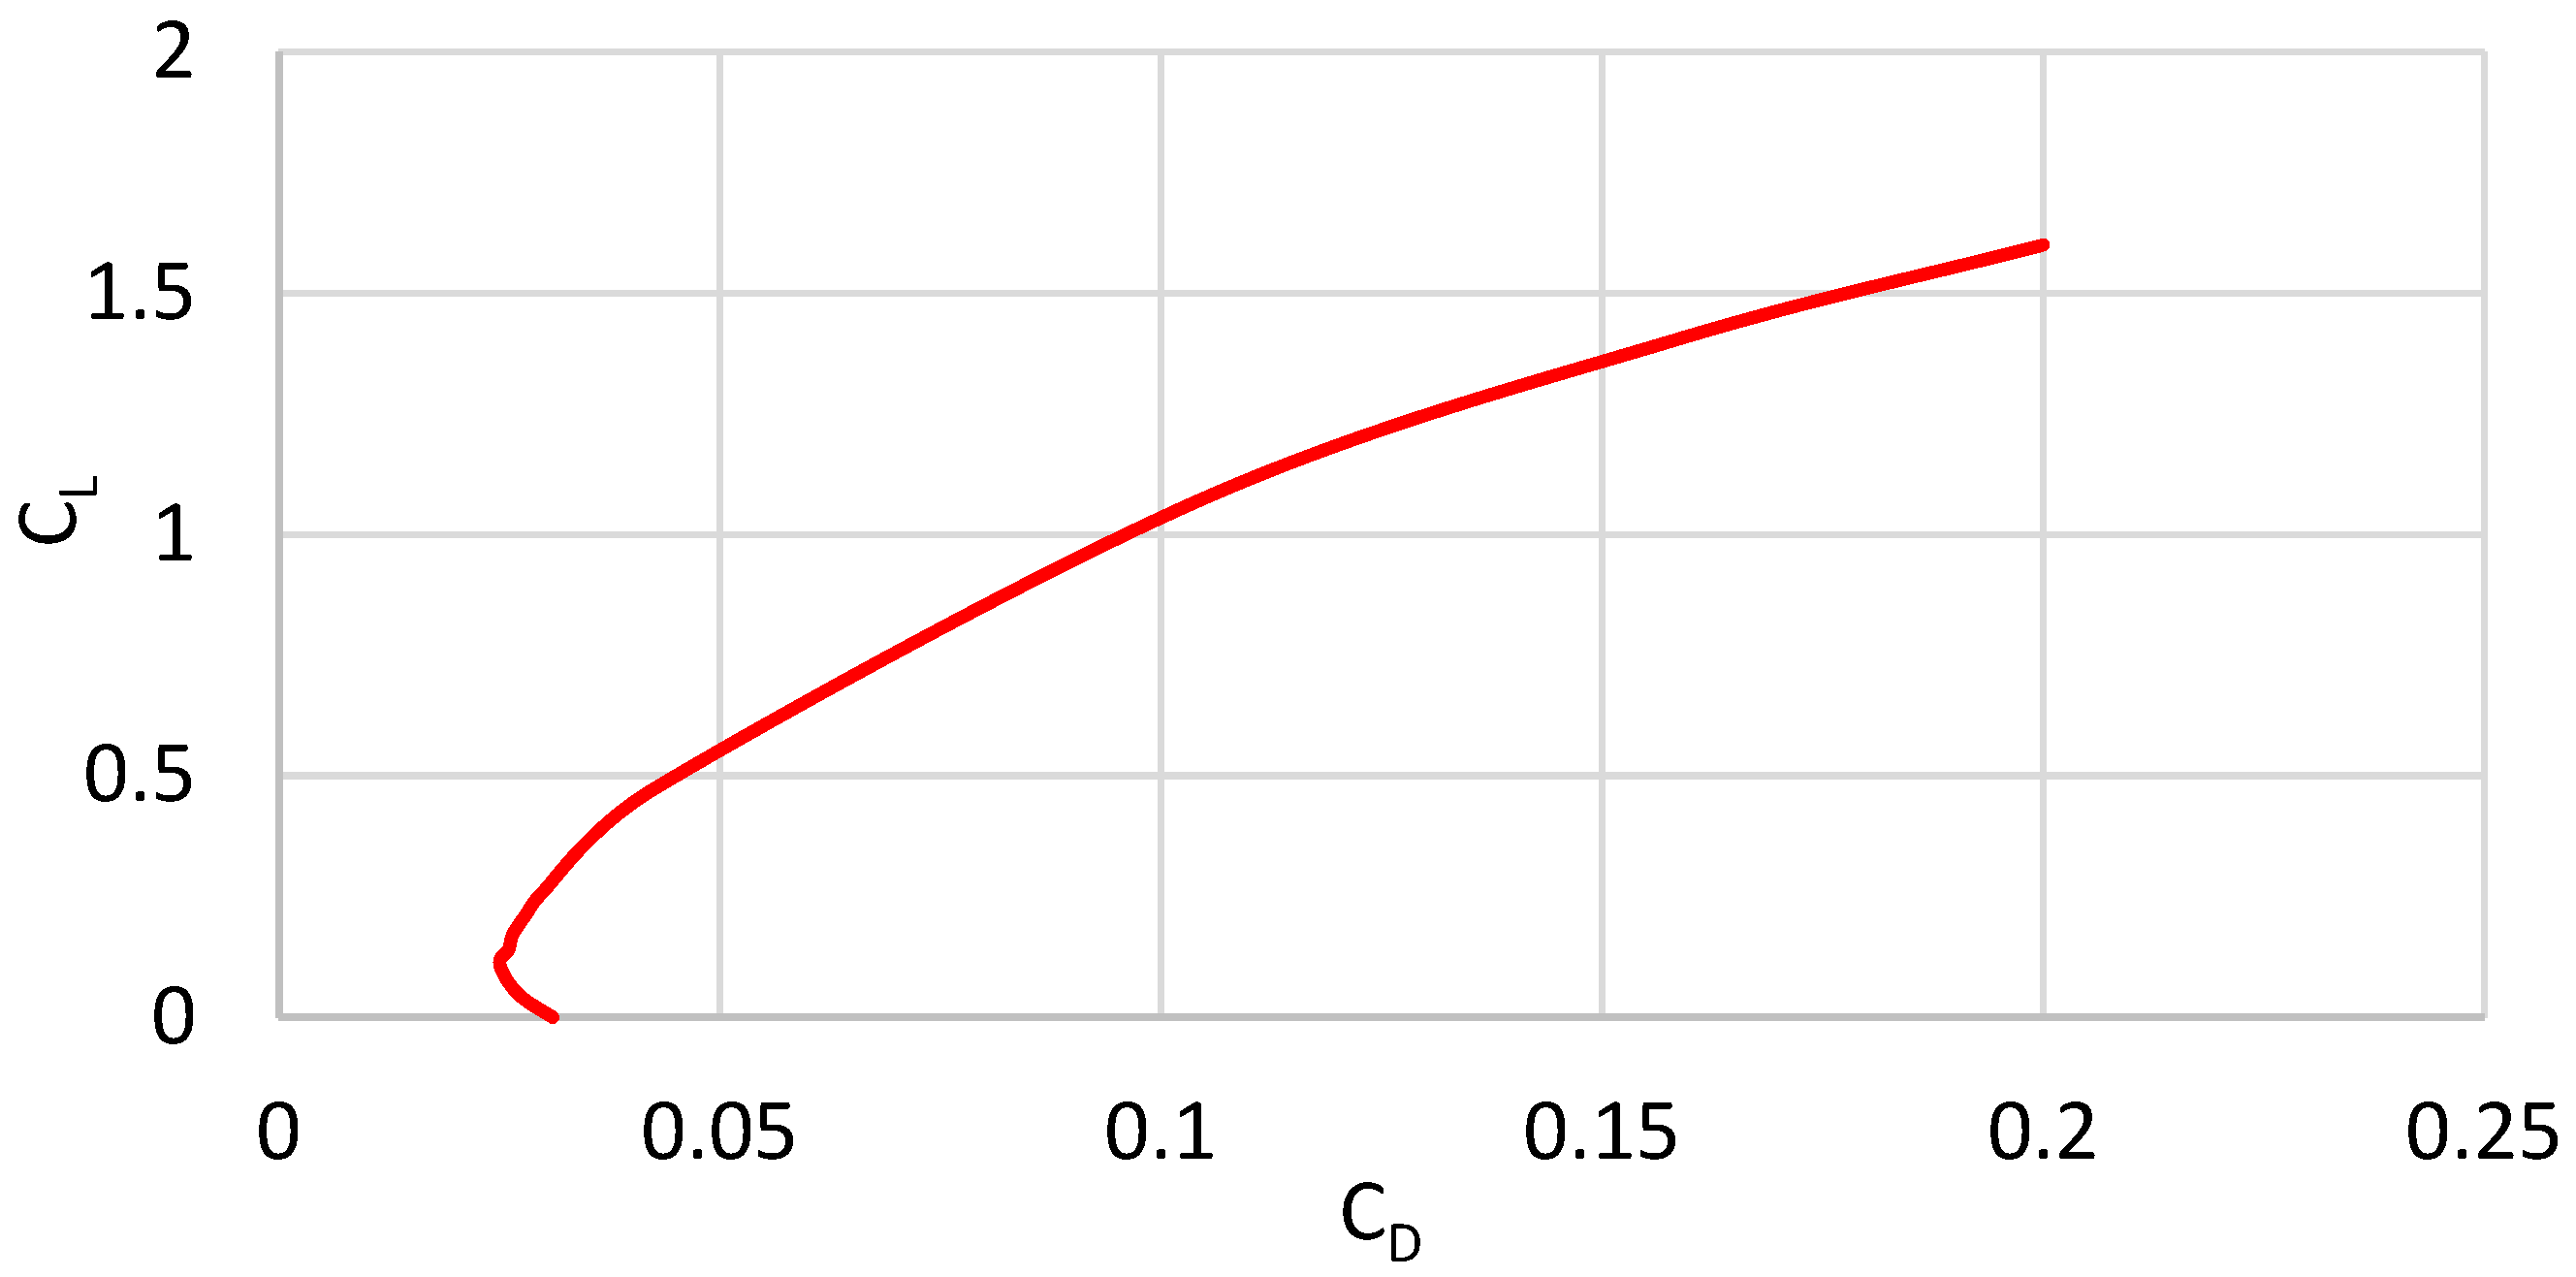
Table 2 shows drag by source and aircraft component, where total drag of each column is bolded at the bottom. The coefficient of drag (CD) of 0.0429 corresponds to approximately 17.3 N of drag at the cruise condition. This code was then used to produce a drag polar by iteratively calculating drag for a range of lift coefficients as shown in Figure 5.
Ground take-off conditions (clean configuration at 0 m of altitude) were also analyzed to understand low-speed aerodynamic performance. At sea level, the airfoil was predicted to generate a maximum CL of 1.5 and the aircraft was predicted to generate 11.9 N of drag. The flaps were originally intended only to aid in wing stowage, so flap performance was not analyzed. However, the flaps are servo controlled and can be used to improve the aircraft’s low speed performance.

4.2. Stability and Control

The tail of the UAV must provide static and dynamic stability in roll, pitch, and yaw. The sizing of the tail depended on several factors including the dimensions of the main wing as seen in Table 1, the distances between the CG and the aerodynamic centers, and the maximum storage width of 610 mm. The positioning of the tail was influenced by aerodynamic interference from upstream aircraft components including the wings and fuselage. The tail surfaces include a horizonal stabilizer, vertical stabilizer, and ventral fin, which were sized using volume coefficient calculations [20,21]. The horizontal stabilizer stabilizes the pitch of the UAV, while the vertical stabilizer and ventral fin stabilize the roll and yaw of the UAV. The ventral fin was added to increase roll and yaw stability without making the vertical stabilizer taller.
An analysis code was developed to optimize the size and taper ratios of all the empennage surfaces. The code iterates though many different empennage combinations to find optimal design sizing and tapers while being constrained by design requirements such as a maximum horizontal tail width of 610 mm. The empennage sizing was defined by volume coefficients [20,21] and aspect ratios were chosen to minimize drag. This code is further discussed in Section 4.5.
After finding initial sizes with the analysis code, the tail design was refined to the dimensions listed in Table 3.
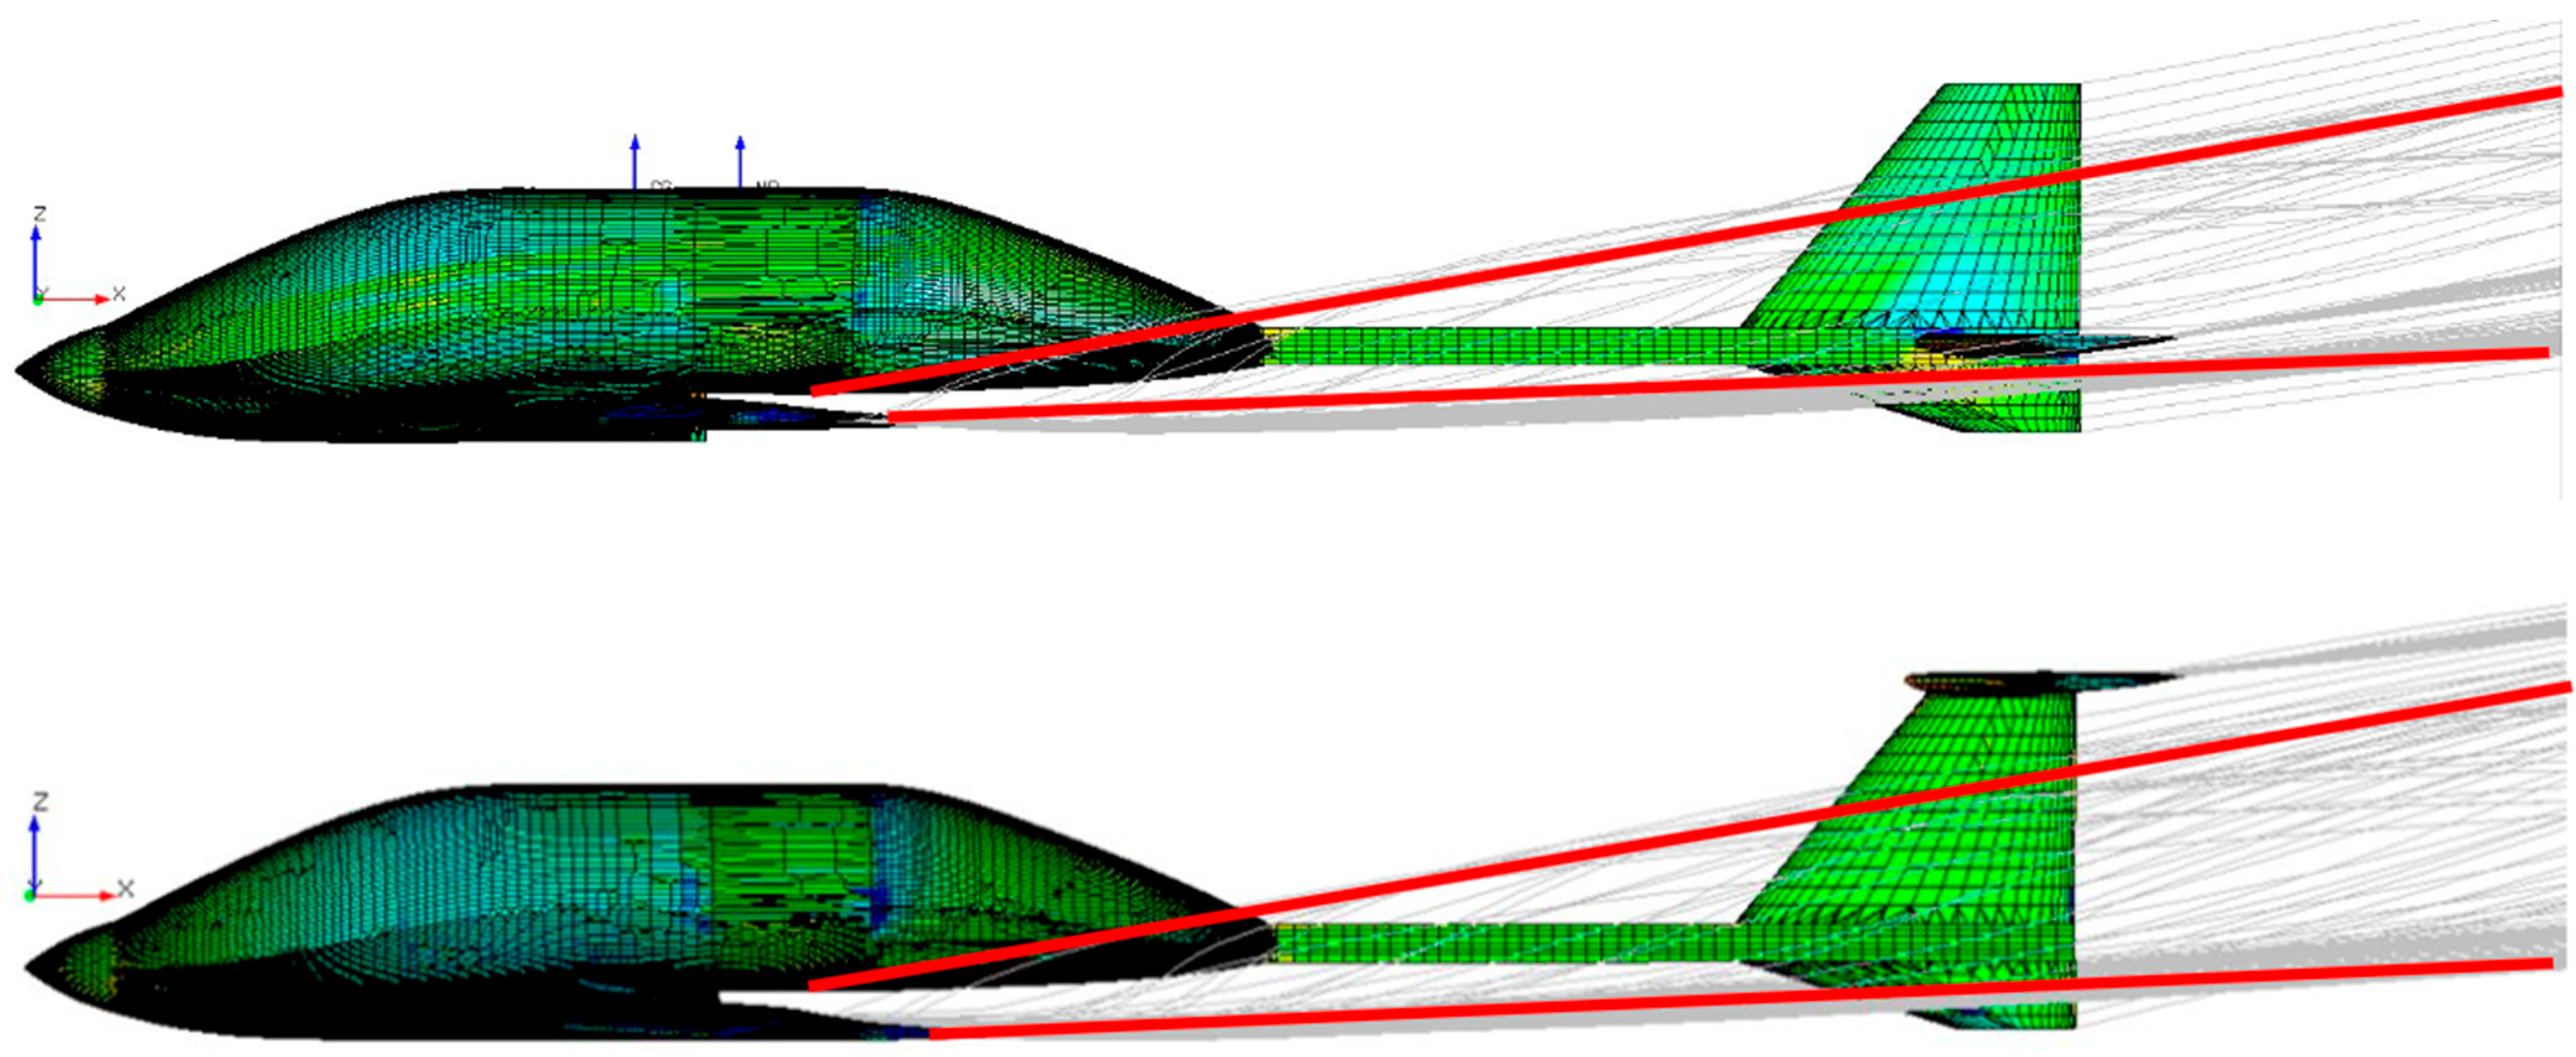
The dimensions listed in Table 3 along with a fuselage and main wing were tested in XFLR5, FlightStream [22], and a subsonic wind tunnel. Dynamic stability estimates were performed in XFLR5. Using XFLR5’s lifting line theory, vortex lattice method, and 3D panel method, the aircraft was determined to be dynamically stable in phugoid mode, Dutch roll mode, short period pitch mode, and roll mode, but not in spiral mode. FlightStream provided flow visualization and static stability data. The results of these tests revealed an interaction between the wing and tail that caused poor pitch stability. Specifically, a gap between the wing root and fuselage created a vortex that impinged on the tail (Figure 6). This gap in the wing root is essential for allowing payload deployment and wing folding, both of which are necessary for mission success and fulfilling requirements. As a result, the conventional horizontal stabilizer was changed to a T-tail configuration, but all tail surface areas remained the same. This change increased the tail’s effective range of α by evading the trailing vortex. Figure 6 compares the flow visualization over the conventional tail (top) with the T-tail (bottom). Based on the streamlines outlined in red, it is clear that the T-tail configuration moves the horizontal stabilizer above the vortices created by the main wing.
The control surfaces consist of an elevator to control pitch, along with a rudder and aileron to control yaw and roll, respectively. These control surfaces were sized as a percentage of the corresponding wing surface, with values in the mid-to-upper end of the acceptable range to mitigate any manufacturing errors. The sizing of these surfaces is listed in Table 4.
Notice in Table 4 that the manufactured rudder is significantly smaller than design, caused by errors made during the manufacturing process. Despite this error, the manufactured control surface sizes were all within the acceptable range and yielded full controllability.

4.3. Propulsion

The propulsion system’s design was primarily influenced by requirements for maximum speed, range, endurance, and ceiling. The system had to be capable of 4 h of endurance, 370 km of range, a dash speed of at least 51.4 m/s, and a minimum service ceiling of 3700 m MSL. During conceptual design, an optimally sized propulsion system was defined. This optimal solution was then mapped onto commercially available propellers and power systems. After receiving the components, a series of tests and refinements were performed to verify the initial analyses and ensure the system met performance targets.
Several computational tools were developed to support system design and analysis. First was a trend analysis generated from the online tool eCalc [23]. Three independent variables—propeller diameter, blade pitch, and number of blades—were plotted against three dependent variables: maximum power draw, power draw at a 31.4 m/s cruise, and predicted maximum speed. In Figure 7, the maximum speed is shown as a function of propeller diameter.
Trend analysis graphs such as Figure 7 show that the optimal propeller is a 2-blade with a 610 mm diameter and maximum pitch, as these parameters achieve the highest maximum speed and power. The propeller diameter is limited to 610 mm in this analysis due to the storage requirements specified by the sponsor. This solution was cross-referenced with commercially available propellers to select a propeller.
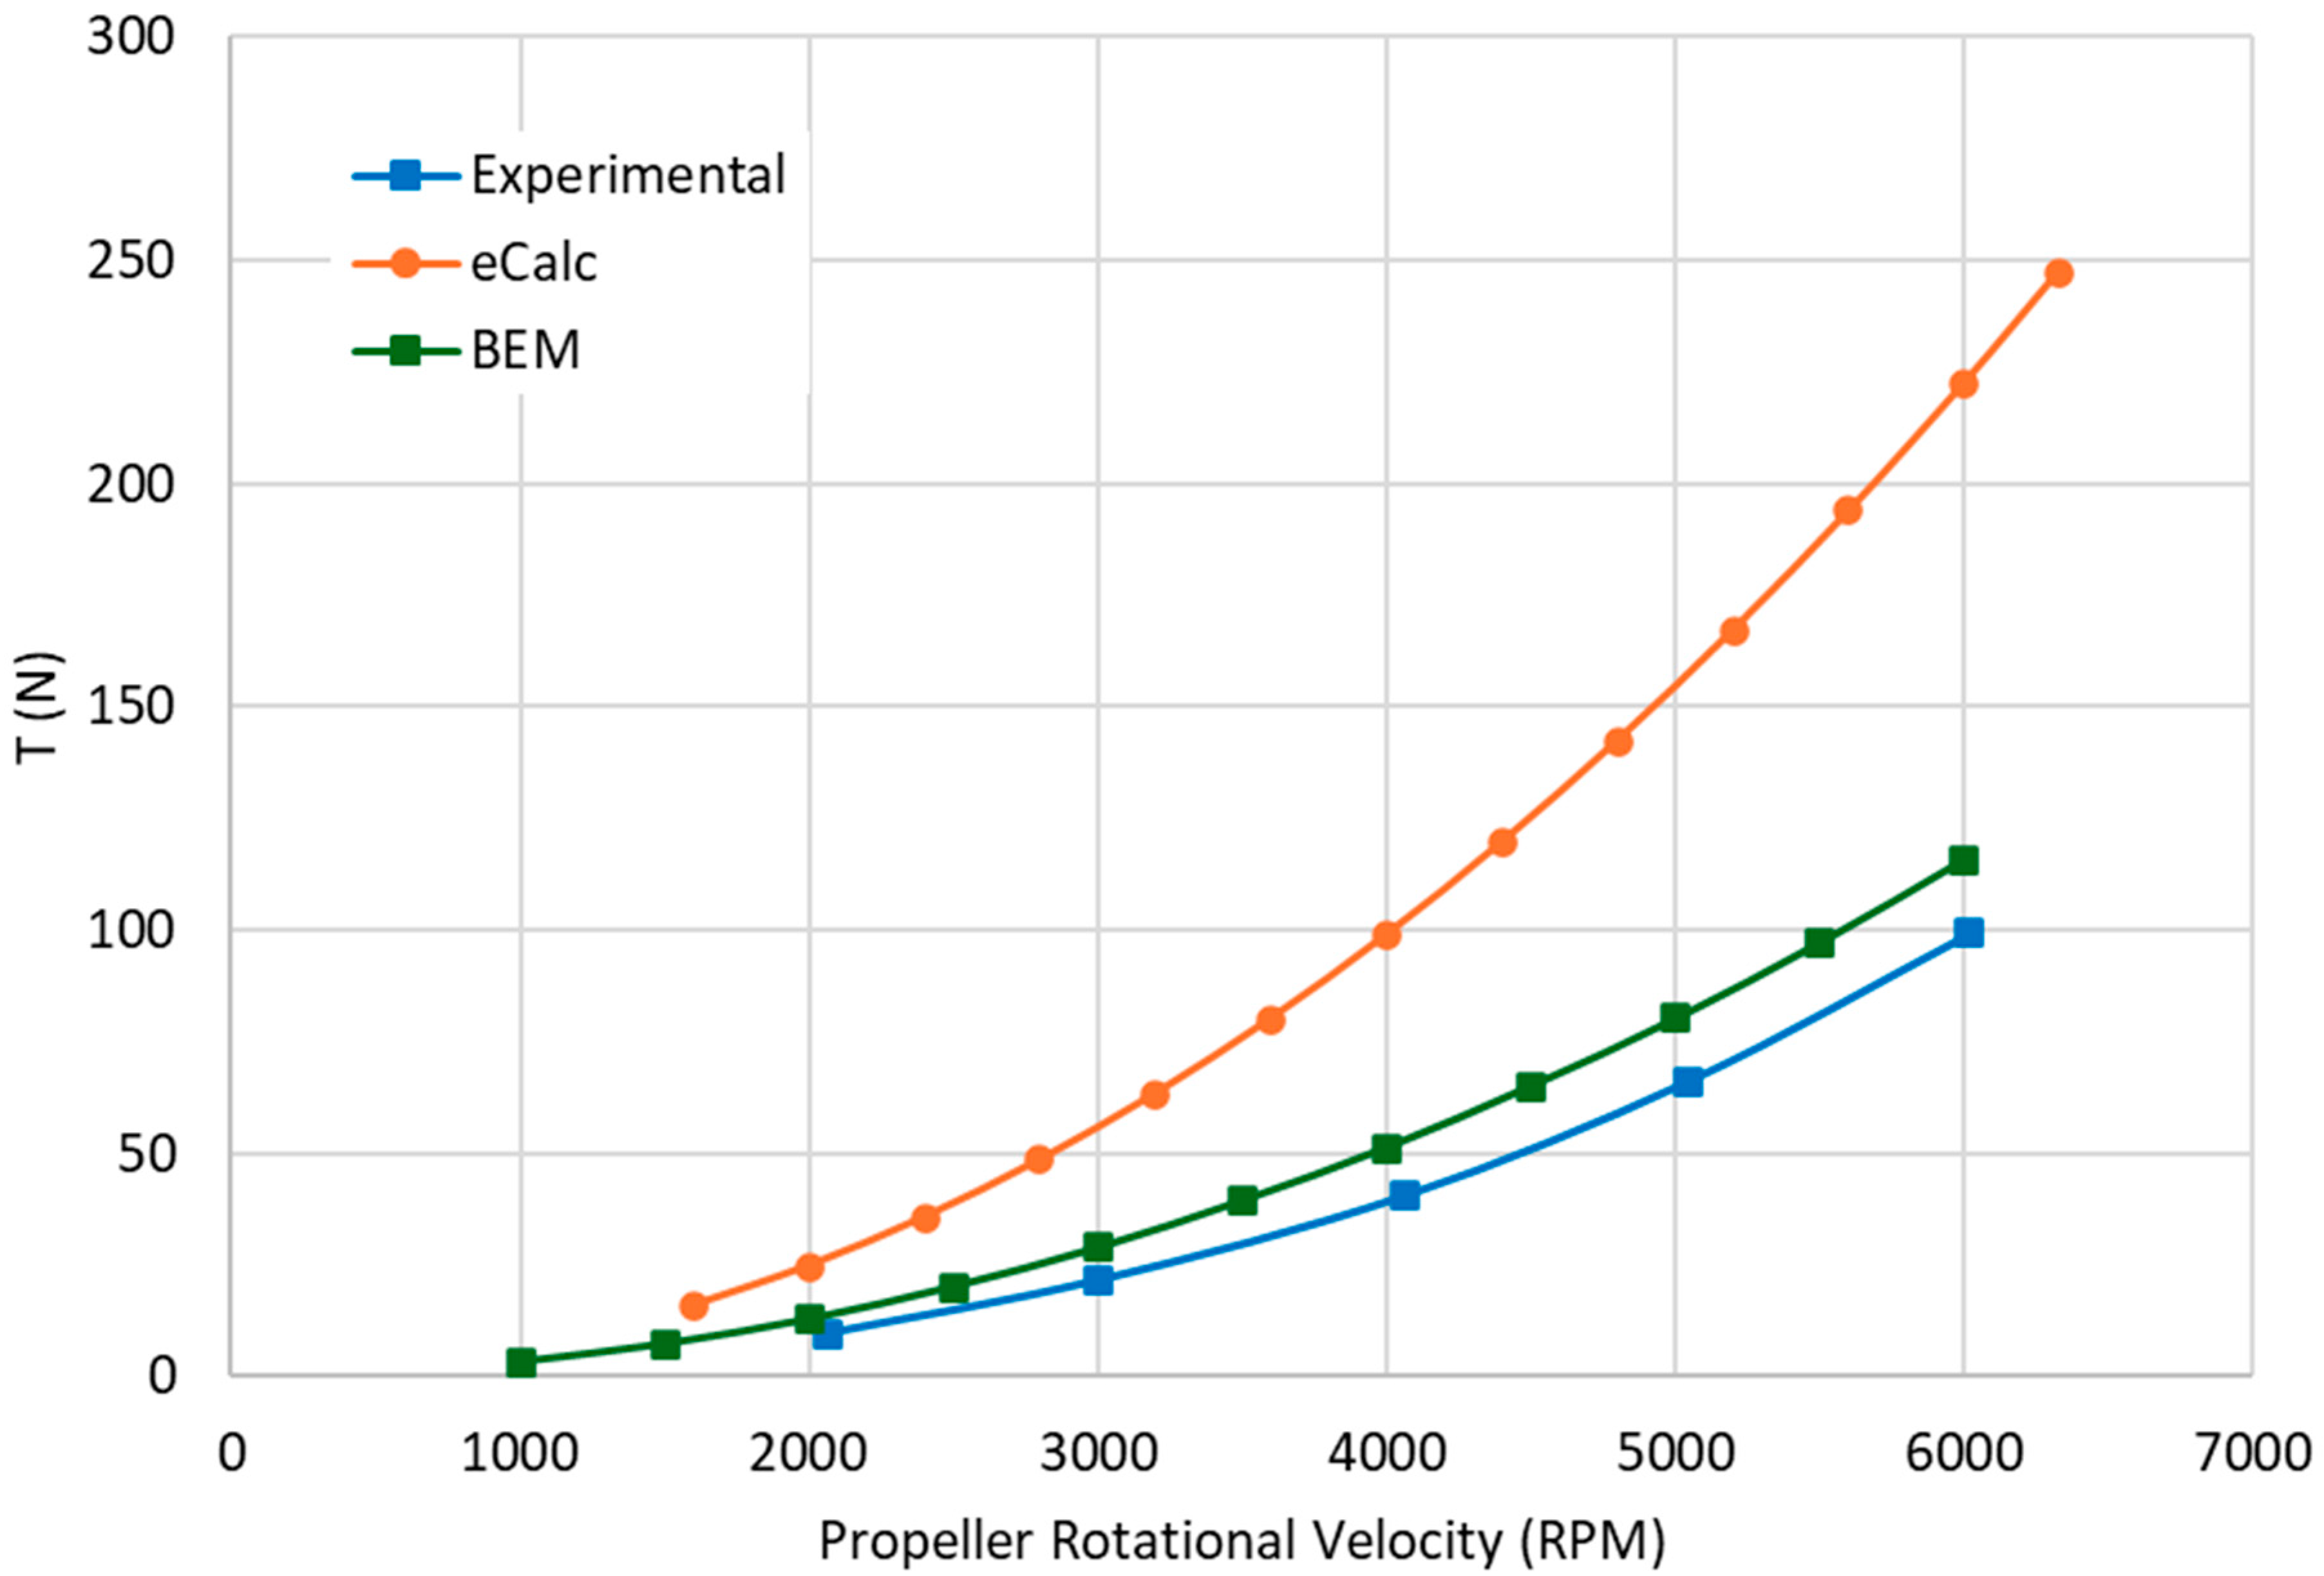
To validate these graphs, a blade element analysis code was developed using the blade element and momentum (BEM) method. This code was used extensively in later stages of the analysis and testing and proved more accurate than eCalc at predicting blade stall and true thrust (T) performance. An example of the blade element code’s improved accuracy can be seen in Figure 8.
Figure 8 shows the thrust produced by the propeller as a function of the motor RPM. eCalc tends to significantly overestimate the thrust generated by the propeller in regimes where the blade element code more accurately predicts the loss of thrust due to blade stall at higher RPM.
The next step in the design process was sizing the engine and motor for the aircraft. eCalc’s database of electric motors was used to identify a motor with sufficient power to drive the selected propeller at the required RPM. Once power requirements were established, a gasoline engine and electric motor were selected to meet propulsion targets.
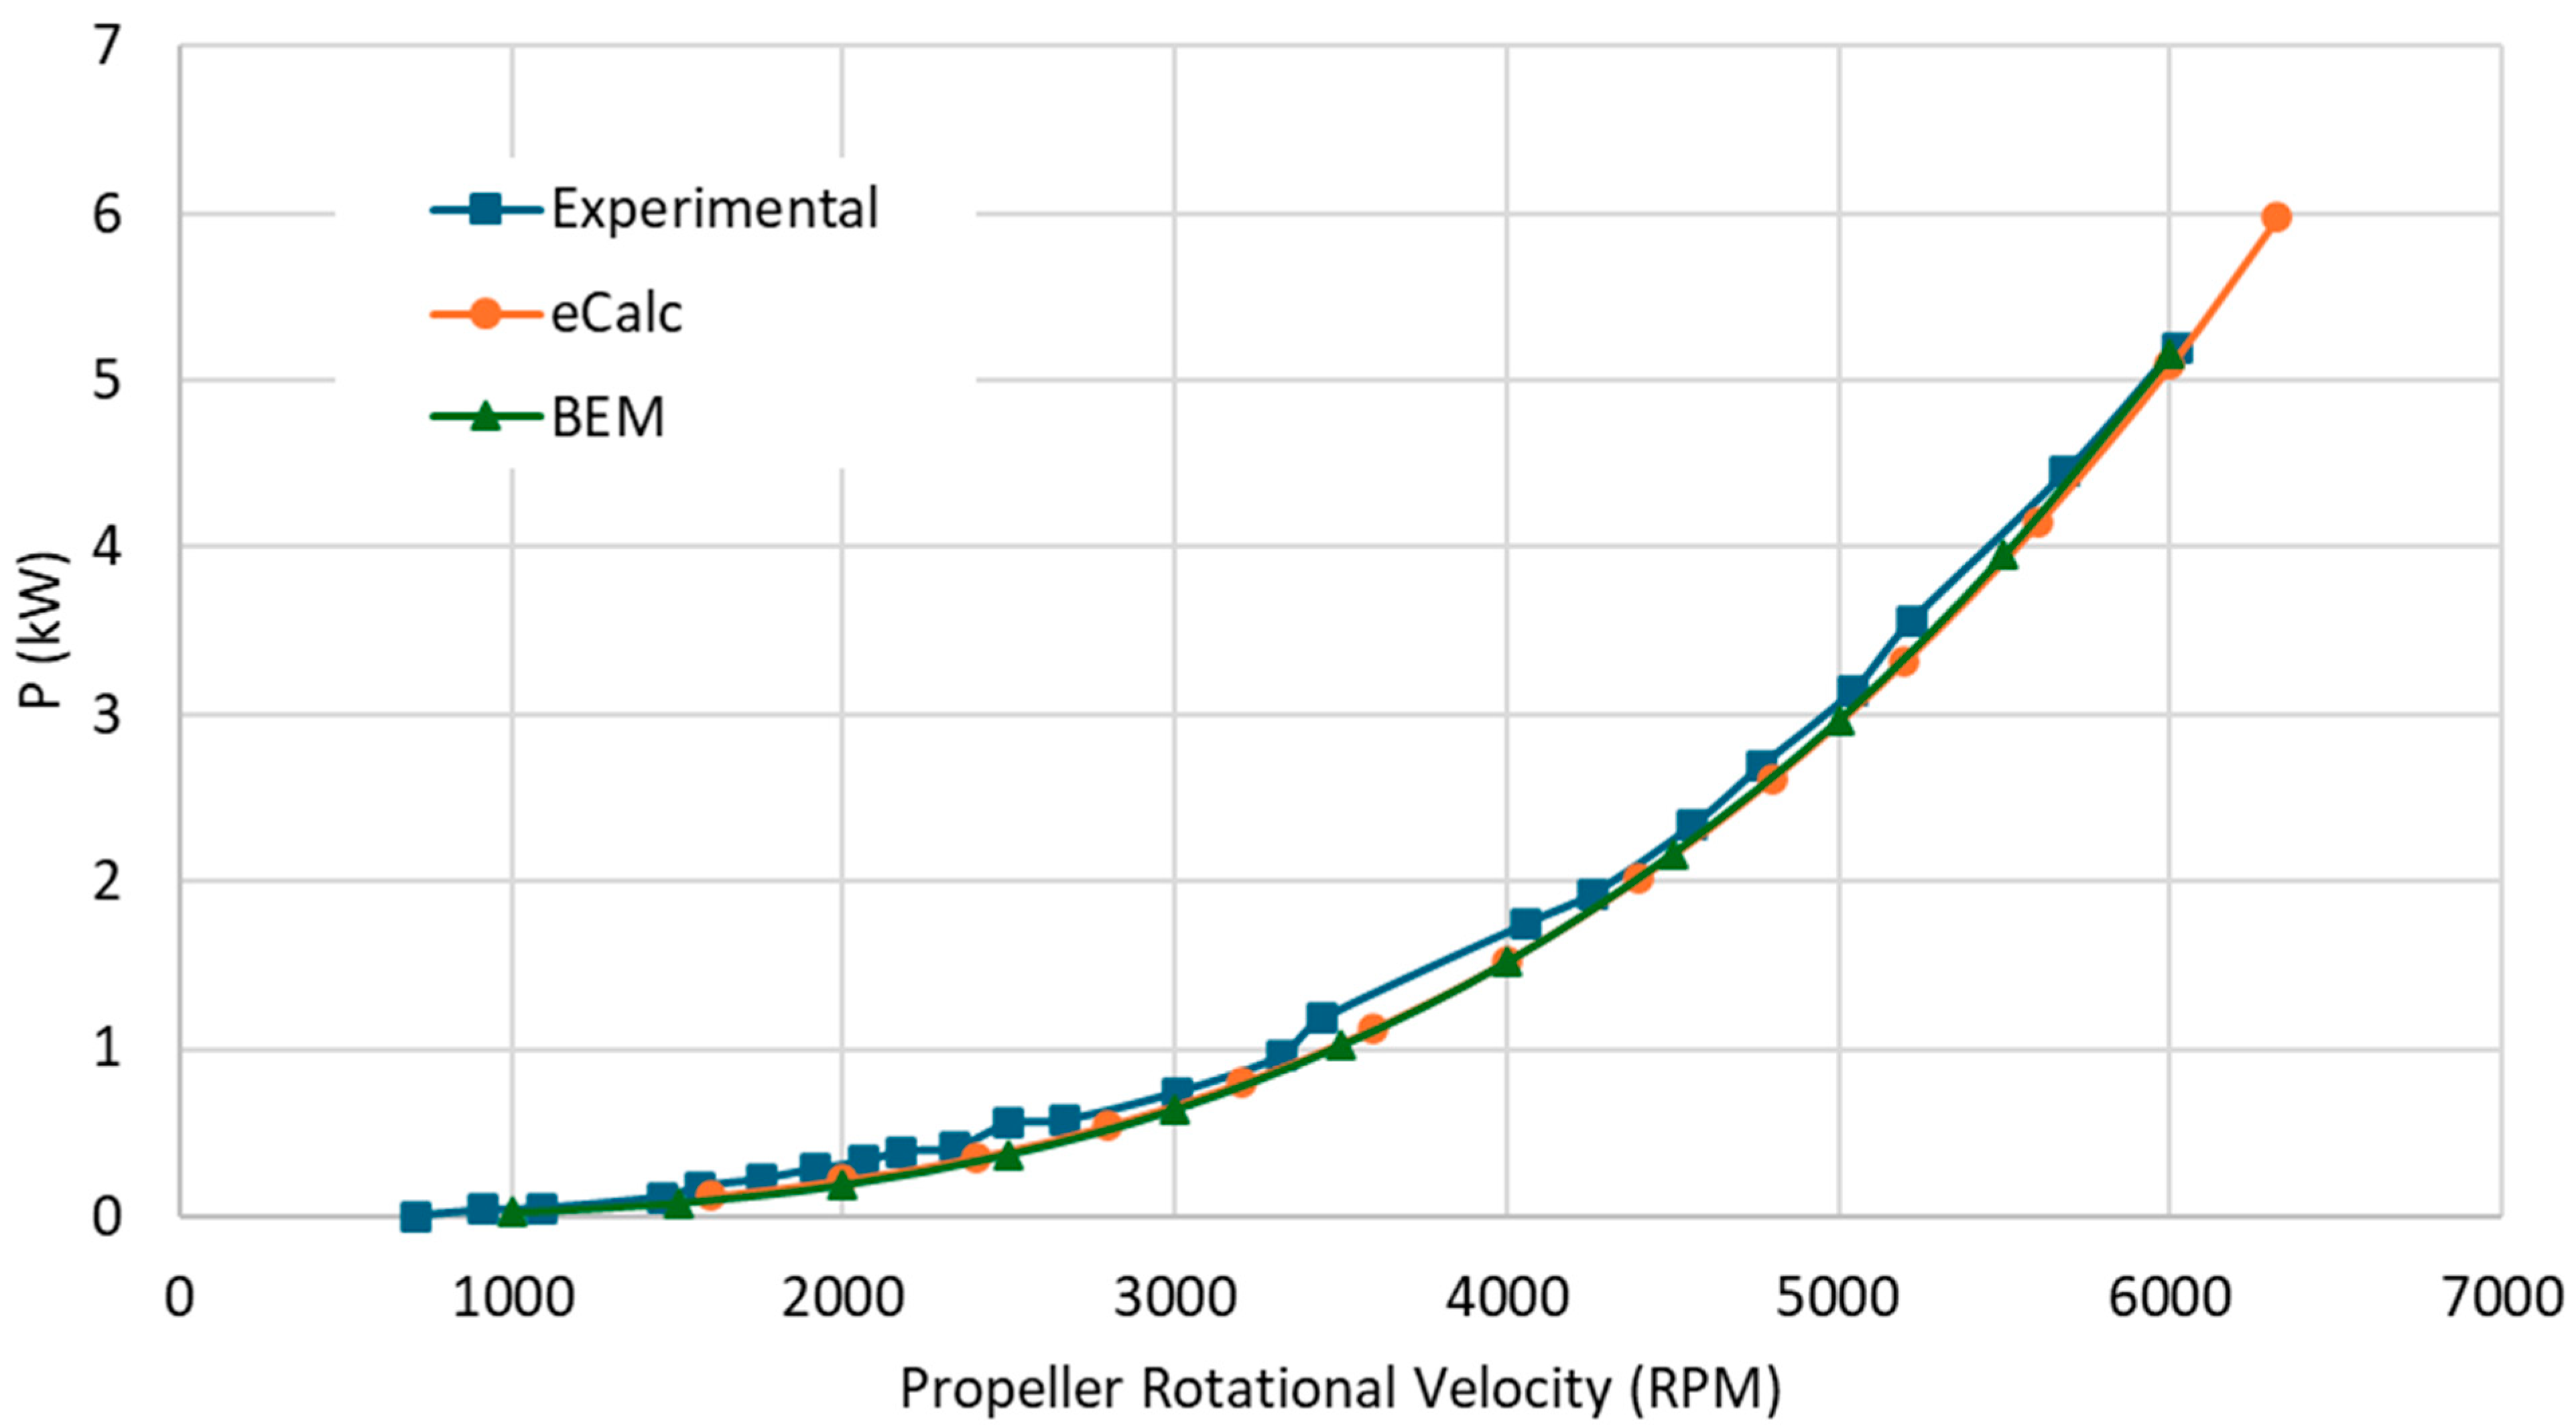
A series of static tests measured the thrust, RPM, voltage, and current of the electric propulsion system. These tests validated the performance of the system as well as the veracity of the computational models used in the analysis process, as illustrated in Figure 9.
Figure 9 plots the power (P) delivered by the motor versus the RPM of the motor. This graph shows an excellent correlation between eCalc, blade element, and experimental results. The agreement between all analysis methods increases confidence in the powerplant selection.
The commercially available powerplant selection for the flight test article includes a Spektrum Avian 8085 motor, a Spektrum Avian 200 A electronic speed controller (ESC), a 12S-HV battery system, and a Falcon 22x22 propeller. The commercial article requires a Desert Aircraft 120 CC gasoline engine with electronic fuel ignition (EFI) conversion, approximately 3.4 kg of fuel, and a Zinger 22x32 propeller.

4.4. Structures

The aerodynamics, stability and control, and required propulsion of the aircraft were all dependent on its weight and balance, which was constrained by the FAA’s 55.0 lbs (24.9 kg) maximum allowable weight for a small UAV [15]. Additionally, the weight and balance is dependent on the aircraft’s structure, which must be sturdy enough to safely support all flight-related tasks while fitting within the 610 mm storage width.
Before a detailed model of the aircraft could be developed, the mass and CG position of the aircraft were estimated using material densities and calculated volumes. An analysis program was developed that took inputs such as wingspan, airfoil, and skin material, calculated component masses, and determined a CG position. The analysis program was refined and validated on multiple existing aircraft as shown in Table 5.
The five aircraft in Table 5 define a range of masses above and below the FAA’s restriction of 24.9 kg, where the second column displays the actual mass of each aircraft. The aircraft dimensions were input into the estimation program, resulting in the calculated masses shown in the third column. The variation in error, particularly the larger errors seen with Launch UAV and ScanEagle, primarily results from differences in aircraft material composition and internal avionics that do not completely match the characteristics assumed in the program. However, the average percent error from these tests is 2.6%, corresponding to a difference of only 0.6 kg for an aircraft mass of 24.9 kg. This low error provided high confidence in the mass estimation, so the code was implemented into a larger performance estimation program discussed in Section 4.5.
The masses and CG positions of the aircraft were tracked throughout the design process, resulting in the final component group masses shown in Table 6.
Most of the mass in Table 6 came from the wings, payload, and propulsion, where the total fuel or battery mass is included under the propulsion system and the total payload mass is included under payload deployment. The commercial model had a maximum takeoff weight in kilograms of 22.59 kg and a CG positioned 607 mm aft of the nose. With wings stowed, this CG moved back to 686 mm aft of the nose. The FTA had a maximum takeoff weight in kilograms of 23.40 kg with a CG of 566 mm aft of the nose. The FTA was heavier than the commercial model due to the addition of landing gear, as well as the addition of wing reinforcements following a spar failure during testing. The fuselage structure of the FTA was significantly lighter than the commercial article since the lugs were made from PLA plastic rather than the intended machined metal to reduce manufacturing time and cost.
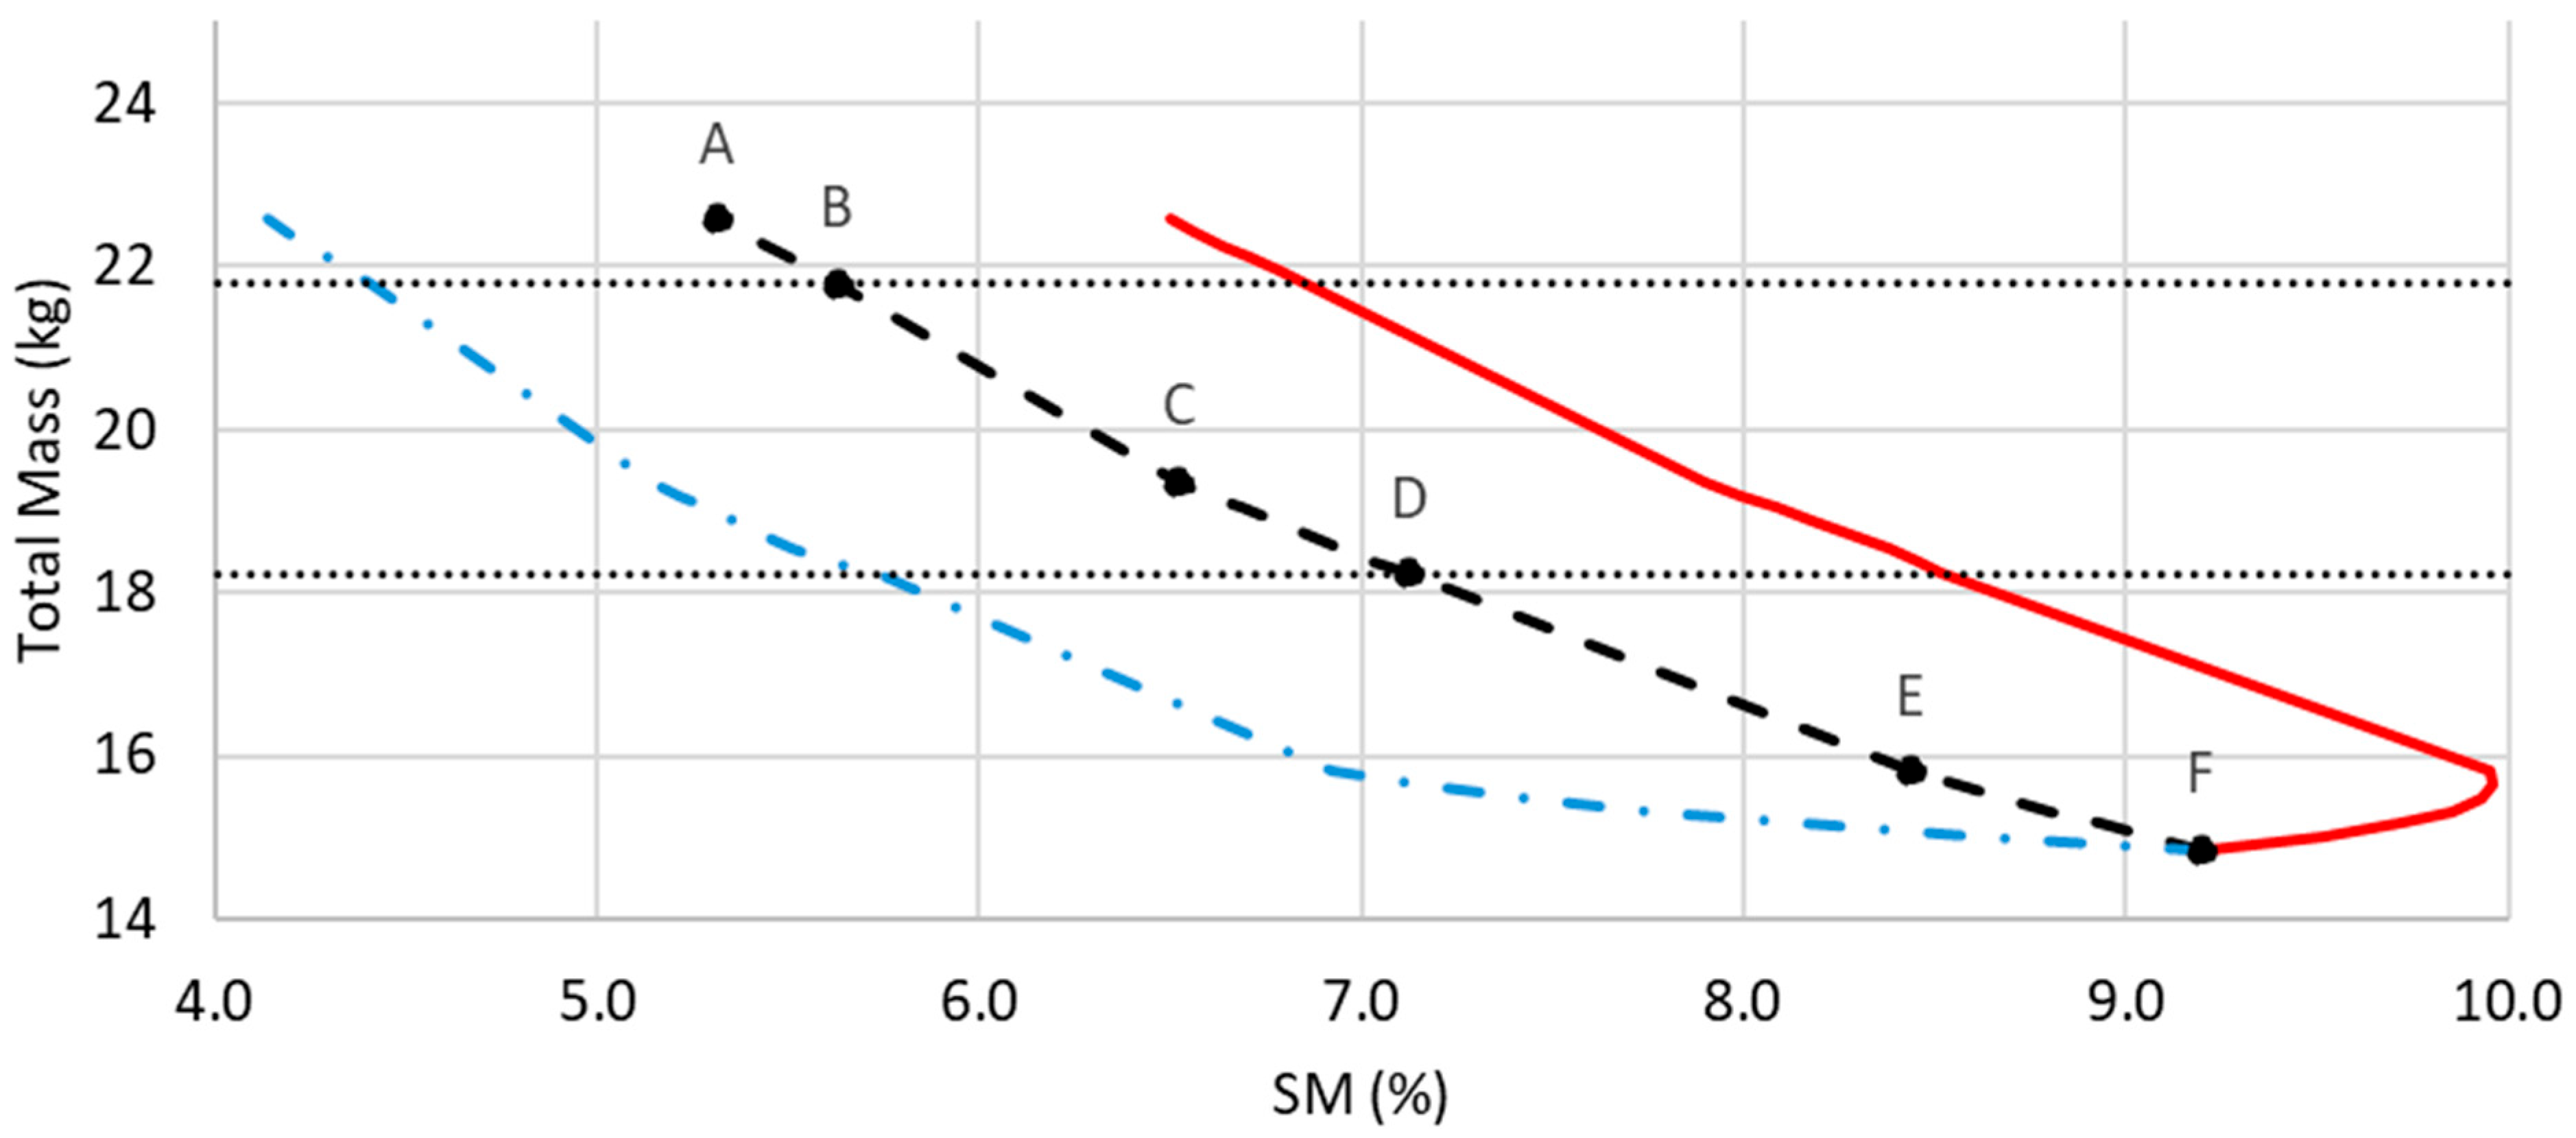
The CG positions of the aircraft were predicted for the entire range of flight conditions, ranging from stowage on the host aircraft to the final empty mass. In these conditions, the number of payload canisters, the fuel level, and the aircraft attitude were varied to account for CG movement due to wing deployment, payload drop, fuel burn, and fuel slosh. The aircraft mass was plotted versus static margin (SM) following wing deployment for this range of conditions in a CG excursion diagram shown in Figure 10.
In Figure 10, the horizontal dotted lines represent the time when each of the two canisters were released, with the top line representing the release of the first canister. The central dashed black line represents the average SM as the aircraft mass changes, where point A is the aircraft SM at maximum takeoff weight in kilograms and point F is the aircraft SM at its empty mass. Points B and D (dotted lines) show the SM of the aircraft before each canister is deployed, and points C and E represent the SM of the aircraft immediately following release. The aircraft’s SM envelope is shown by the red (solid) and blue (dash-dot) lines, where the maximum red SM case occurs at a pitch angle of 20° nose down, and the minimum blue case occurs at pitch angle of 20° nose up. The envelope is caused by fuel slosh based on the maximum expected angles of attack, so the envelope converges to point F once no fuel remains. It is important to note, however, that the envelope extremes are slightly exaggerated due to the simplifying assumption that the fuel tanks have no lid and do not hinder slosh vertically. The SMs were calculated with respect to the neutral point located 625 mm aft of the nose. As shown, the SM generally increases, or the CG moves farther forward, as the canisters are dropped and the fuel is burned down. Most of the envelope is within the acceptable range of 5% to 25% for stability and control, with the exception of the nose up extreme near maximum mass.
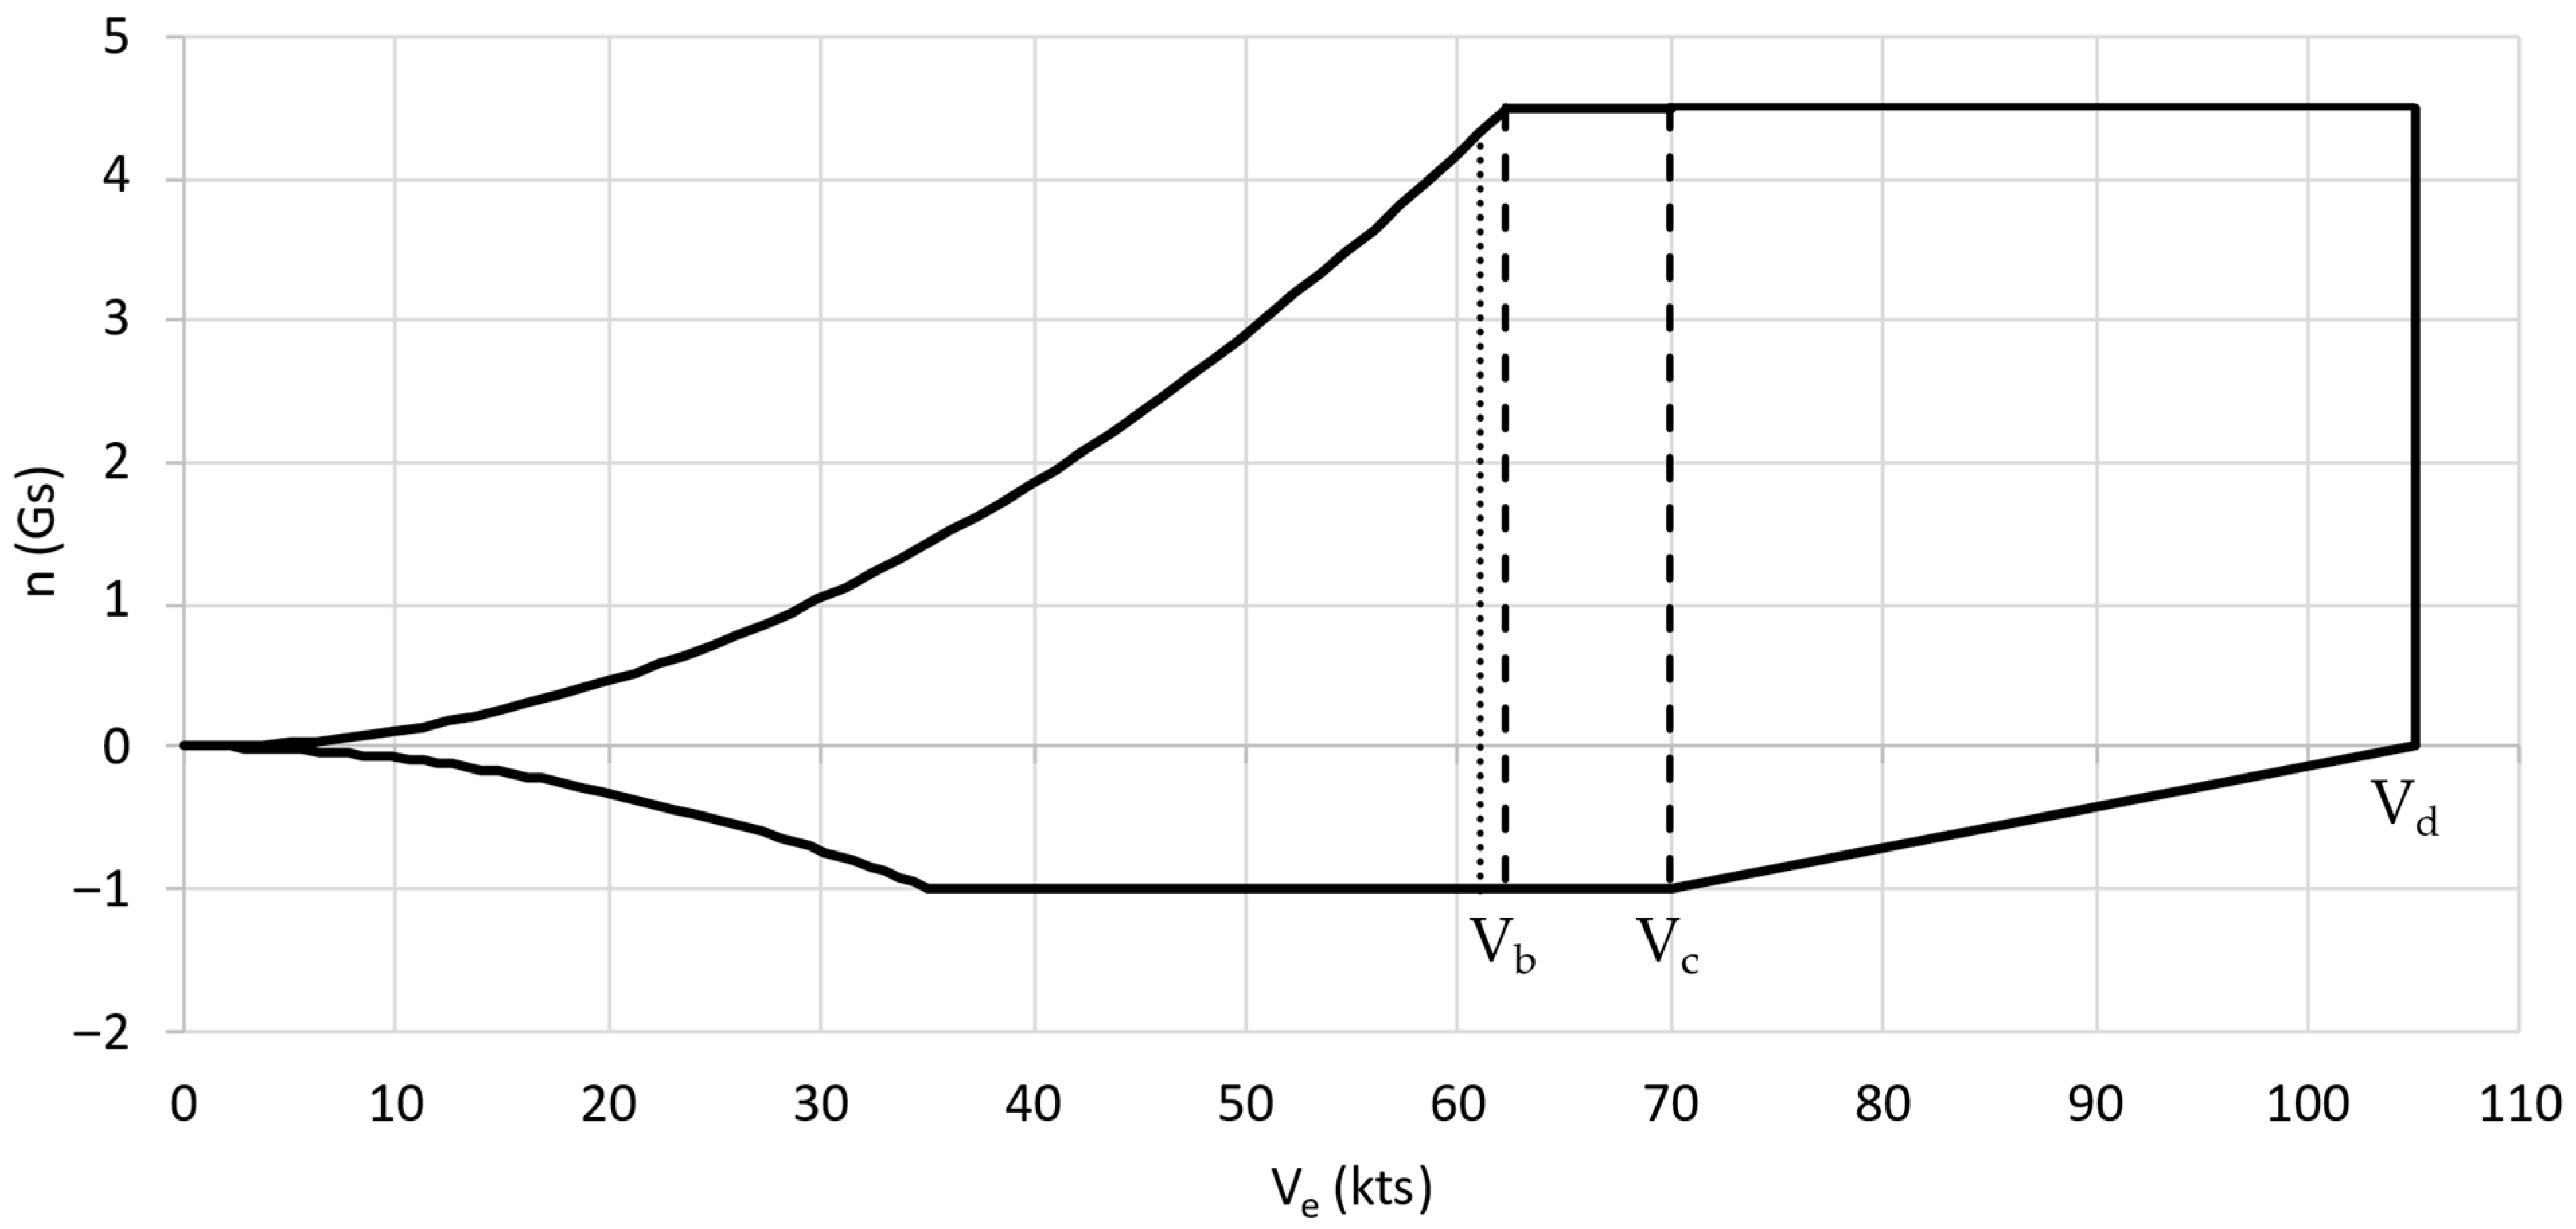
The maximum takeoff weight of the aircraft was then used to generate a structural loading flight envelope. This V-n diagram, created using the equations outlined in 14 CFR Part 23 Subpart C [24] and 14 CFR Part 25 Subpart C [25], is shown in Figure 11.
Figure 11 shows the aircraft flight envelope enclosed by the load factor in Gs and the equivalent air speed in knots. The vertical dashed line labeled Vb represents a gust maneuver speed of 62.2 kts (32.0 m/s), Vc represents the CFR design cruise speed of 70.0 kts (36.0 m/s), and Vd represents the CFR design dive speed of 105.0 kts (54.0 m/s). The vertical dotted line represents the actual design cruise speed of 61.0 kts (31.4 m/s). While a manned aircraft should not have a cruise speed below its maneuver speed for safety, a small UAV can fly at lower speeds in favor of improved aerodynamic performance. The gust lines were not included in this diagram, as the higher wing loading of the aircraft meant the gust lines did not change any of the limit load factors. The positive limit load factor is 4.50 Gs and the negative limit load factor is −1.00 Gs. Applying the standard 1.5 factor of safety (FOS) to these limits resulted in ultimate load factors of 6.75 Gs and −1.50 Gs. These ultimate load factors were then used to design the structure of the wings, wing mounting assemblies, and fuselage bulkheads. In addition to the V-n diagram, the 1.5 FOS was applied to a maximum elevator loading of 315 N and a maximum rudder loading of 176 N to characterize the structure of the tail boom. These loads were calculated at the aircraft’s dive speed of 54.0 m/s assuming 35° deflection in the elevator and 40° deflection in the rudder.
The maximum load factors were applied to structural models constructed in CATIA V5 [26] and ANSYS Workbench [27] to verify that designs would meet the structural requirements. These requirements, as outlined by NATO Standard AEP-83, include an FOS of 2.0 for the wing bearings, an FOS of 4.45 for the control surface hinges, an FOS of 2.5 for all wing stowage mechanisms, and an FOS of 1.5 for all other structural components [28]. The two most critical structures of the aircraft, including the wing pivot bearings and the wing structure, are shown in Figure 12.
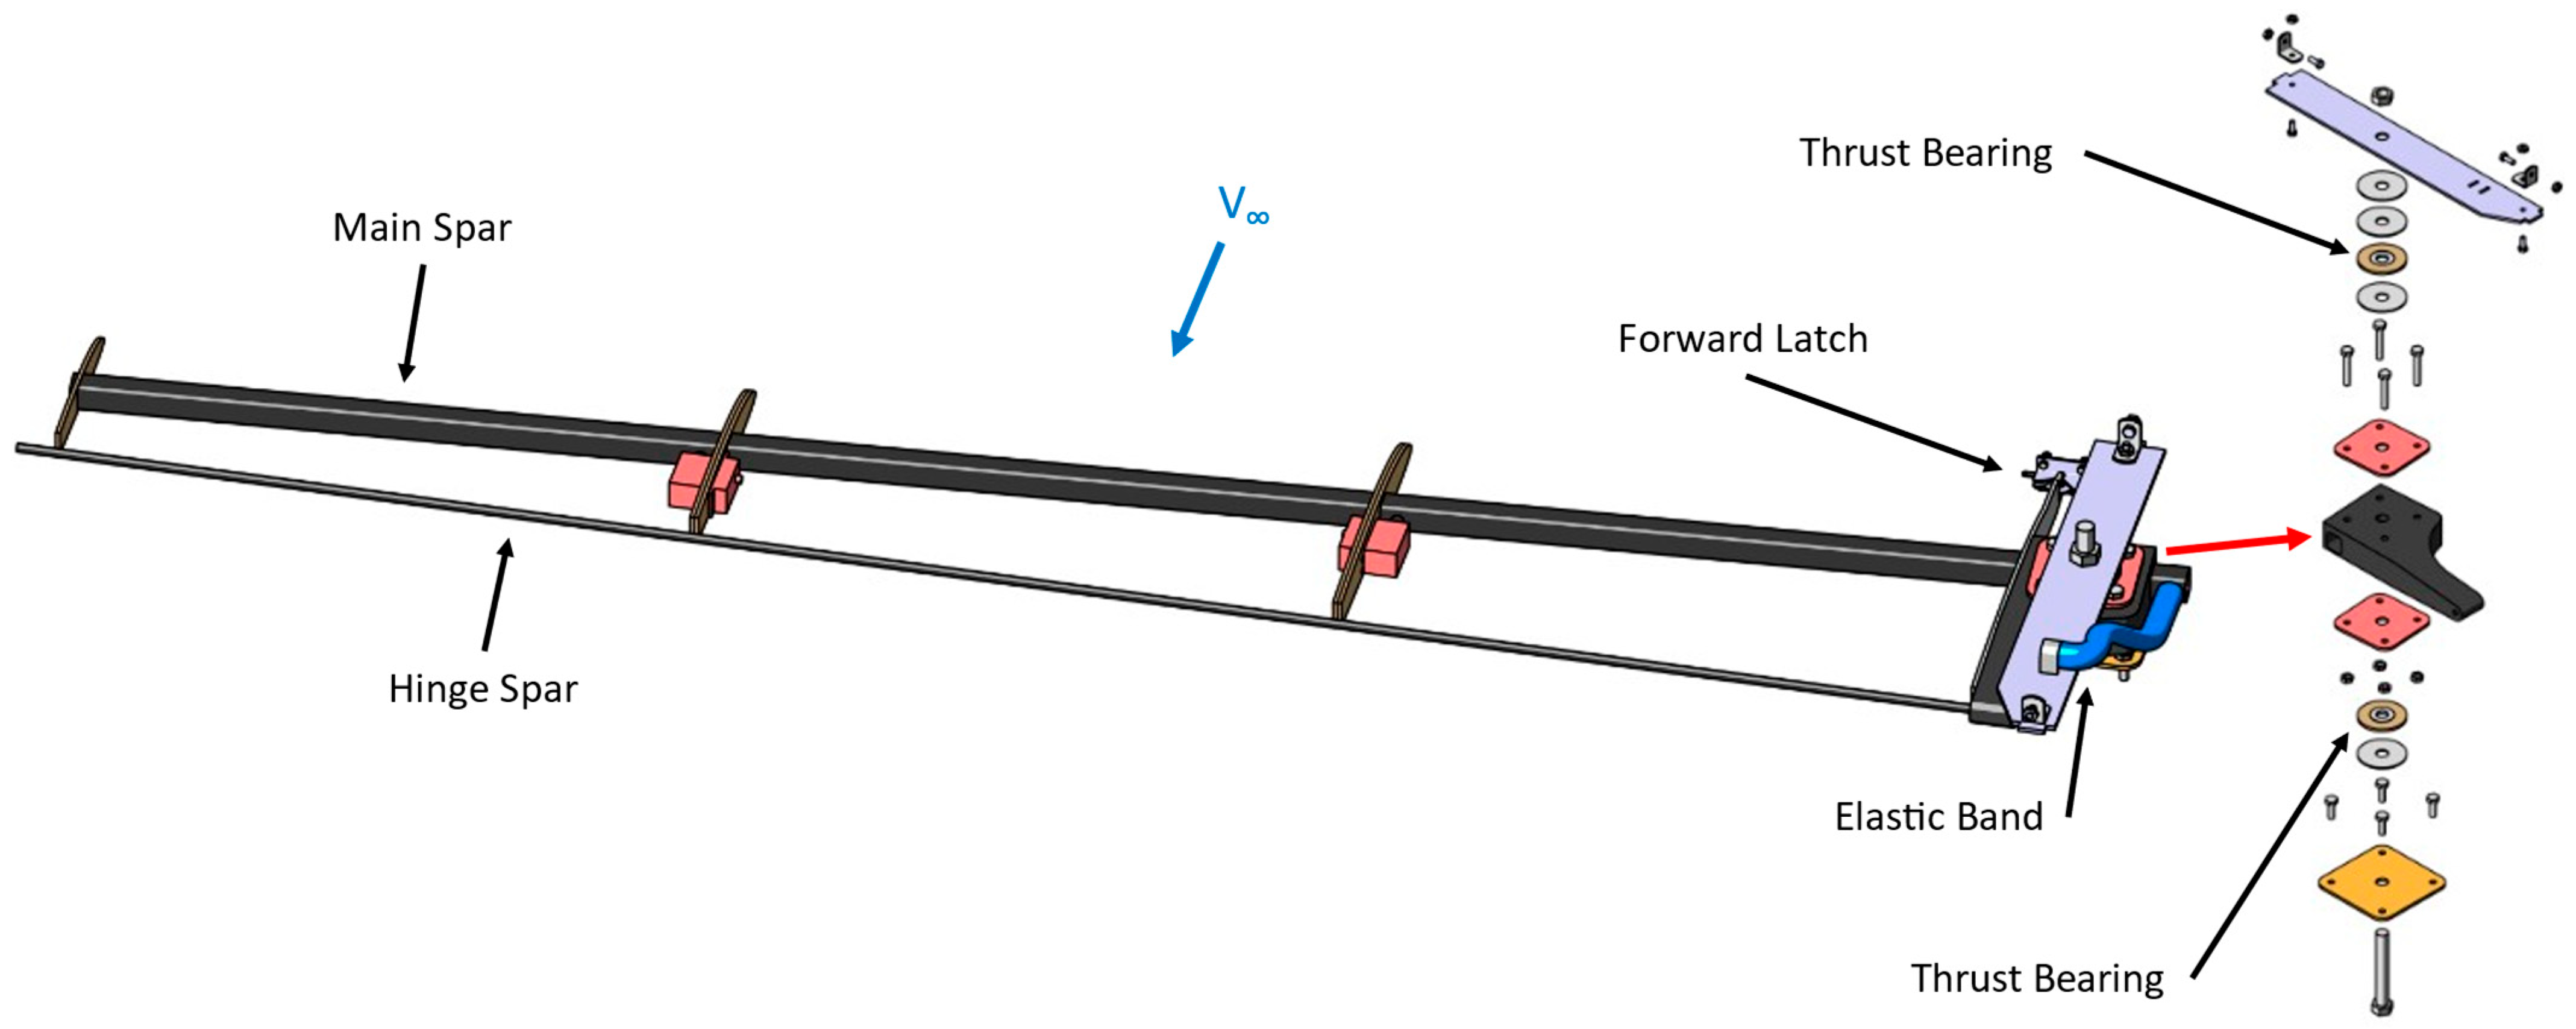
In Figure 12, the skeleton of the wing structure is shown on the left with an expansion of the bearing assembly on the right. The two wings each pivot around one half-inch (12.7 mm) bolt using oil-embedded thrust bearings to deploy the wings in flight. The main spars, hinge spars, and wing skins are connected directly to the bearing assembly and are assumed to carry all aerodynamic loads on the wing. As described previously, the wing bearings needed an FOS of at least 2.0, the control hinges needed an FOS of 4.45, and the rest of the wing structure needed an FOS of 1.5 on top of the limit loading from the V-n diagram. Through iterative testing in ANSYS Workbench and corroborative hand calculations using structural equilibrium and energy methods, the bearings were designed with an actual margin of safety (MOS) of 1.1, the wings were designed with an actual MOS of 0.1 in the main spar, and the hinge spars were designed with an actual MOS of 0.9. Each of these were limited by compressive failure due to bending stress. In addition to these critical systems, the tail boom had an MOS of 0.3, limited by a maximum allowable deflection of 5° rather than by failure, the fuselage bulkheads had an MOS of 1.9 limited by tear out due to bearing stress, and the forward wing latches had an MOS of 0.3 limited by tensile failure due to bending stress. These MOS values were optimized to be marginally above zero while incorporating NATO’s structural requirements and favoring spar and bearing components that were commercially available to reduce manufacturing complexity and cost.

4.5. Performance Predictions

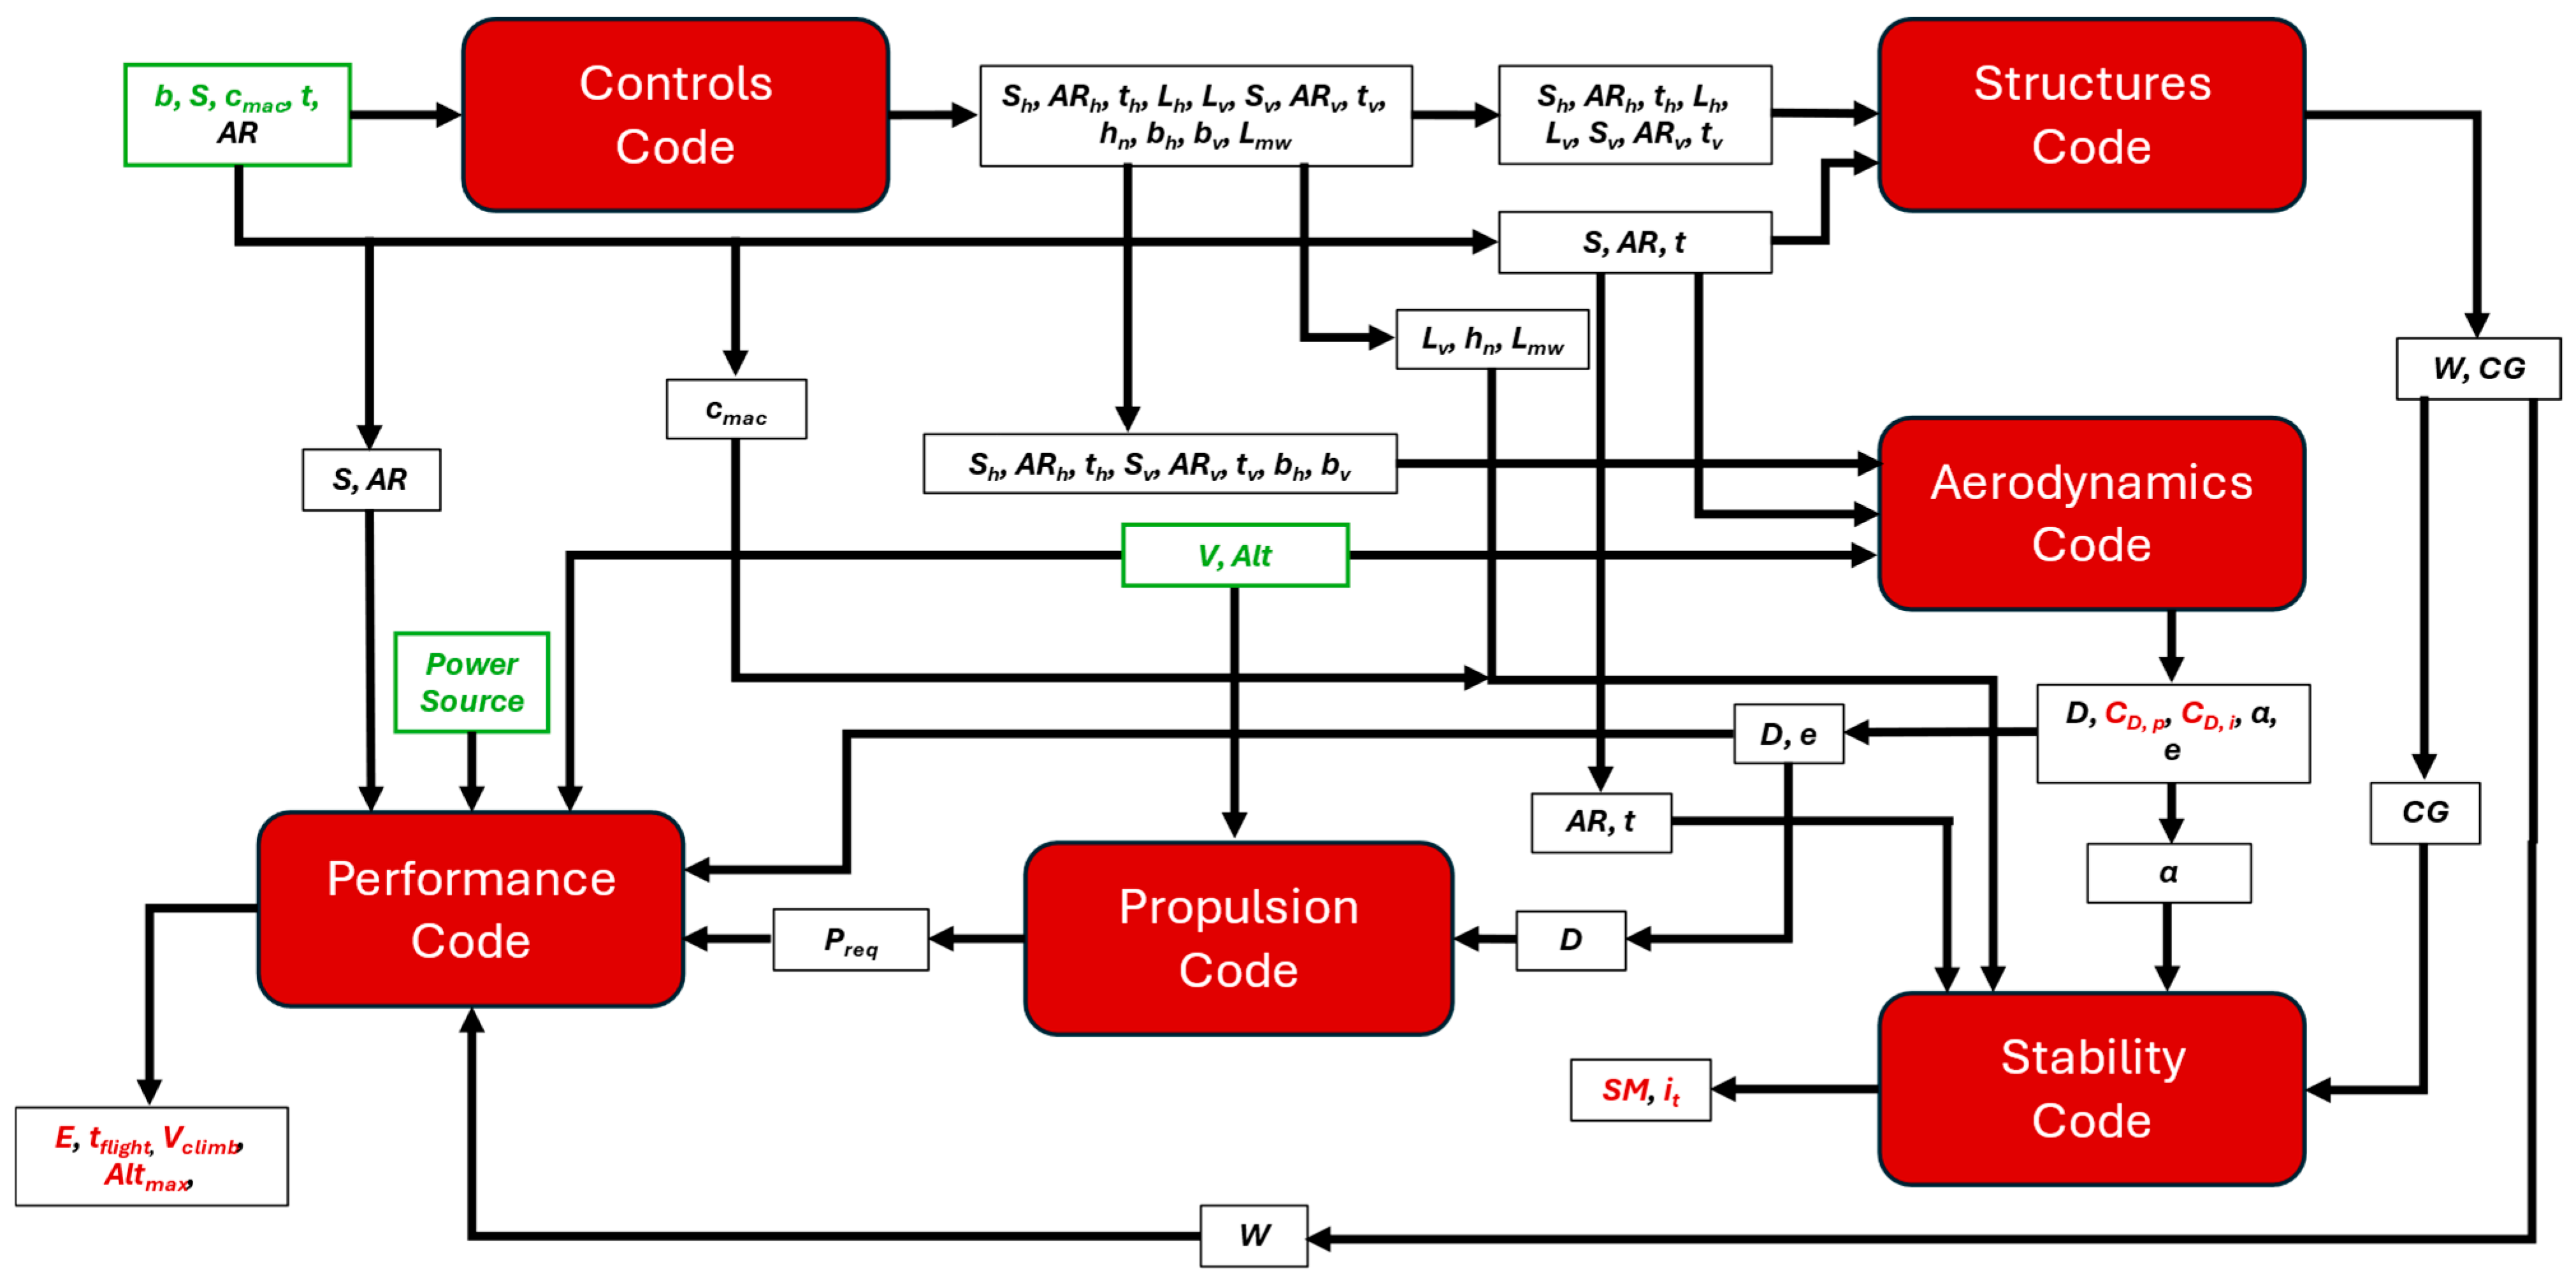
Each design team created code that served as building blocks in a rapid-iteration aircraft sizing and performance prediction tool. The code blocks in Figure 13 represent separate scripts that predict performance with low fidelity based on established methods, such as drag predictions using Hoerner’s methods and weight estimations from summing predicted subcomponent densities and volumes. The preceding subsections describe each of the models used in further detail. The organization and structure of the design tool, including the inputs and outputs, is shown in Figure 13.
The aircraft sizing tool takes seven inputs and returns 27 outputs. The boxes in green show the inputs: four aircraft dimensions, two flight condition parameters, and a powerplant choice. All red values are outputs not used elsewhere in the code, and the black values are outputs from one function that become inputs to another function.
The performance code was validated by comparing script outputs to specifications of existing aircraft with similar powerplants and missions. This comparison is shown in Table 7. Validation of individual analysis subroutines are discussed in the corresponding previous sections.
Endurance comparisons yielded less than 5% error in all aircraft tested. Range data had higher errors, although the Bat had no available specification. The range disagreement is likely a result of the calculation being derived from endurance data, leading to compounding errors. As a result, the Stalker had the highest error of all aircraft. This aircraft uses a propane-electric powerplant, which means that losses in the hybrid system may have contributed to performance overestimation by the code. Considering these factors, the performance prediction is sufficiently accurate for use in aircraft sizing.
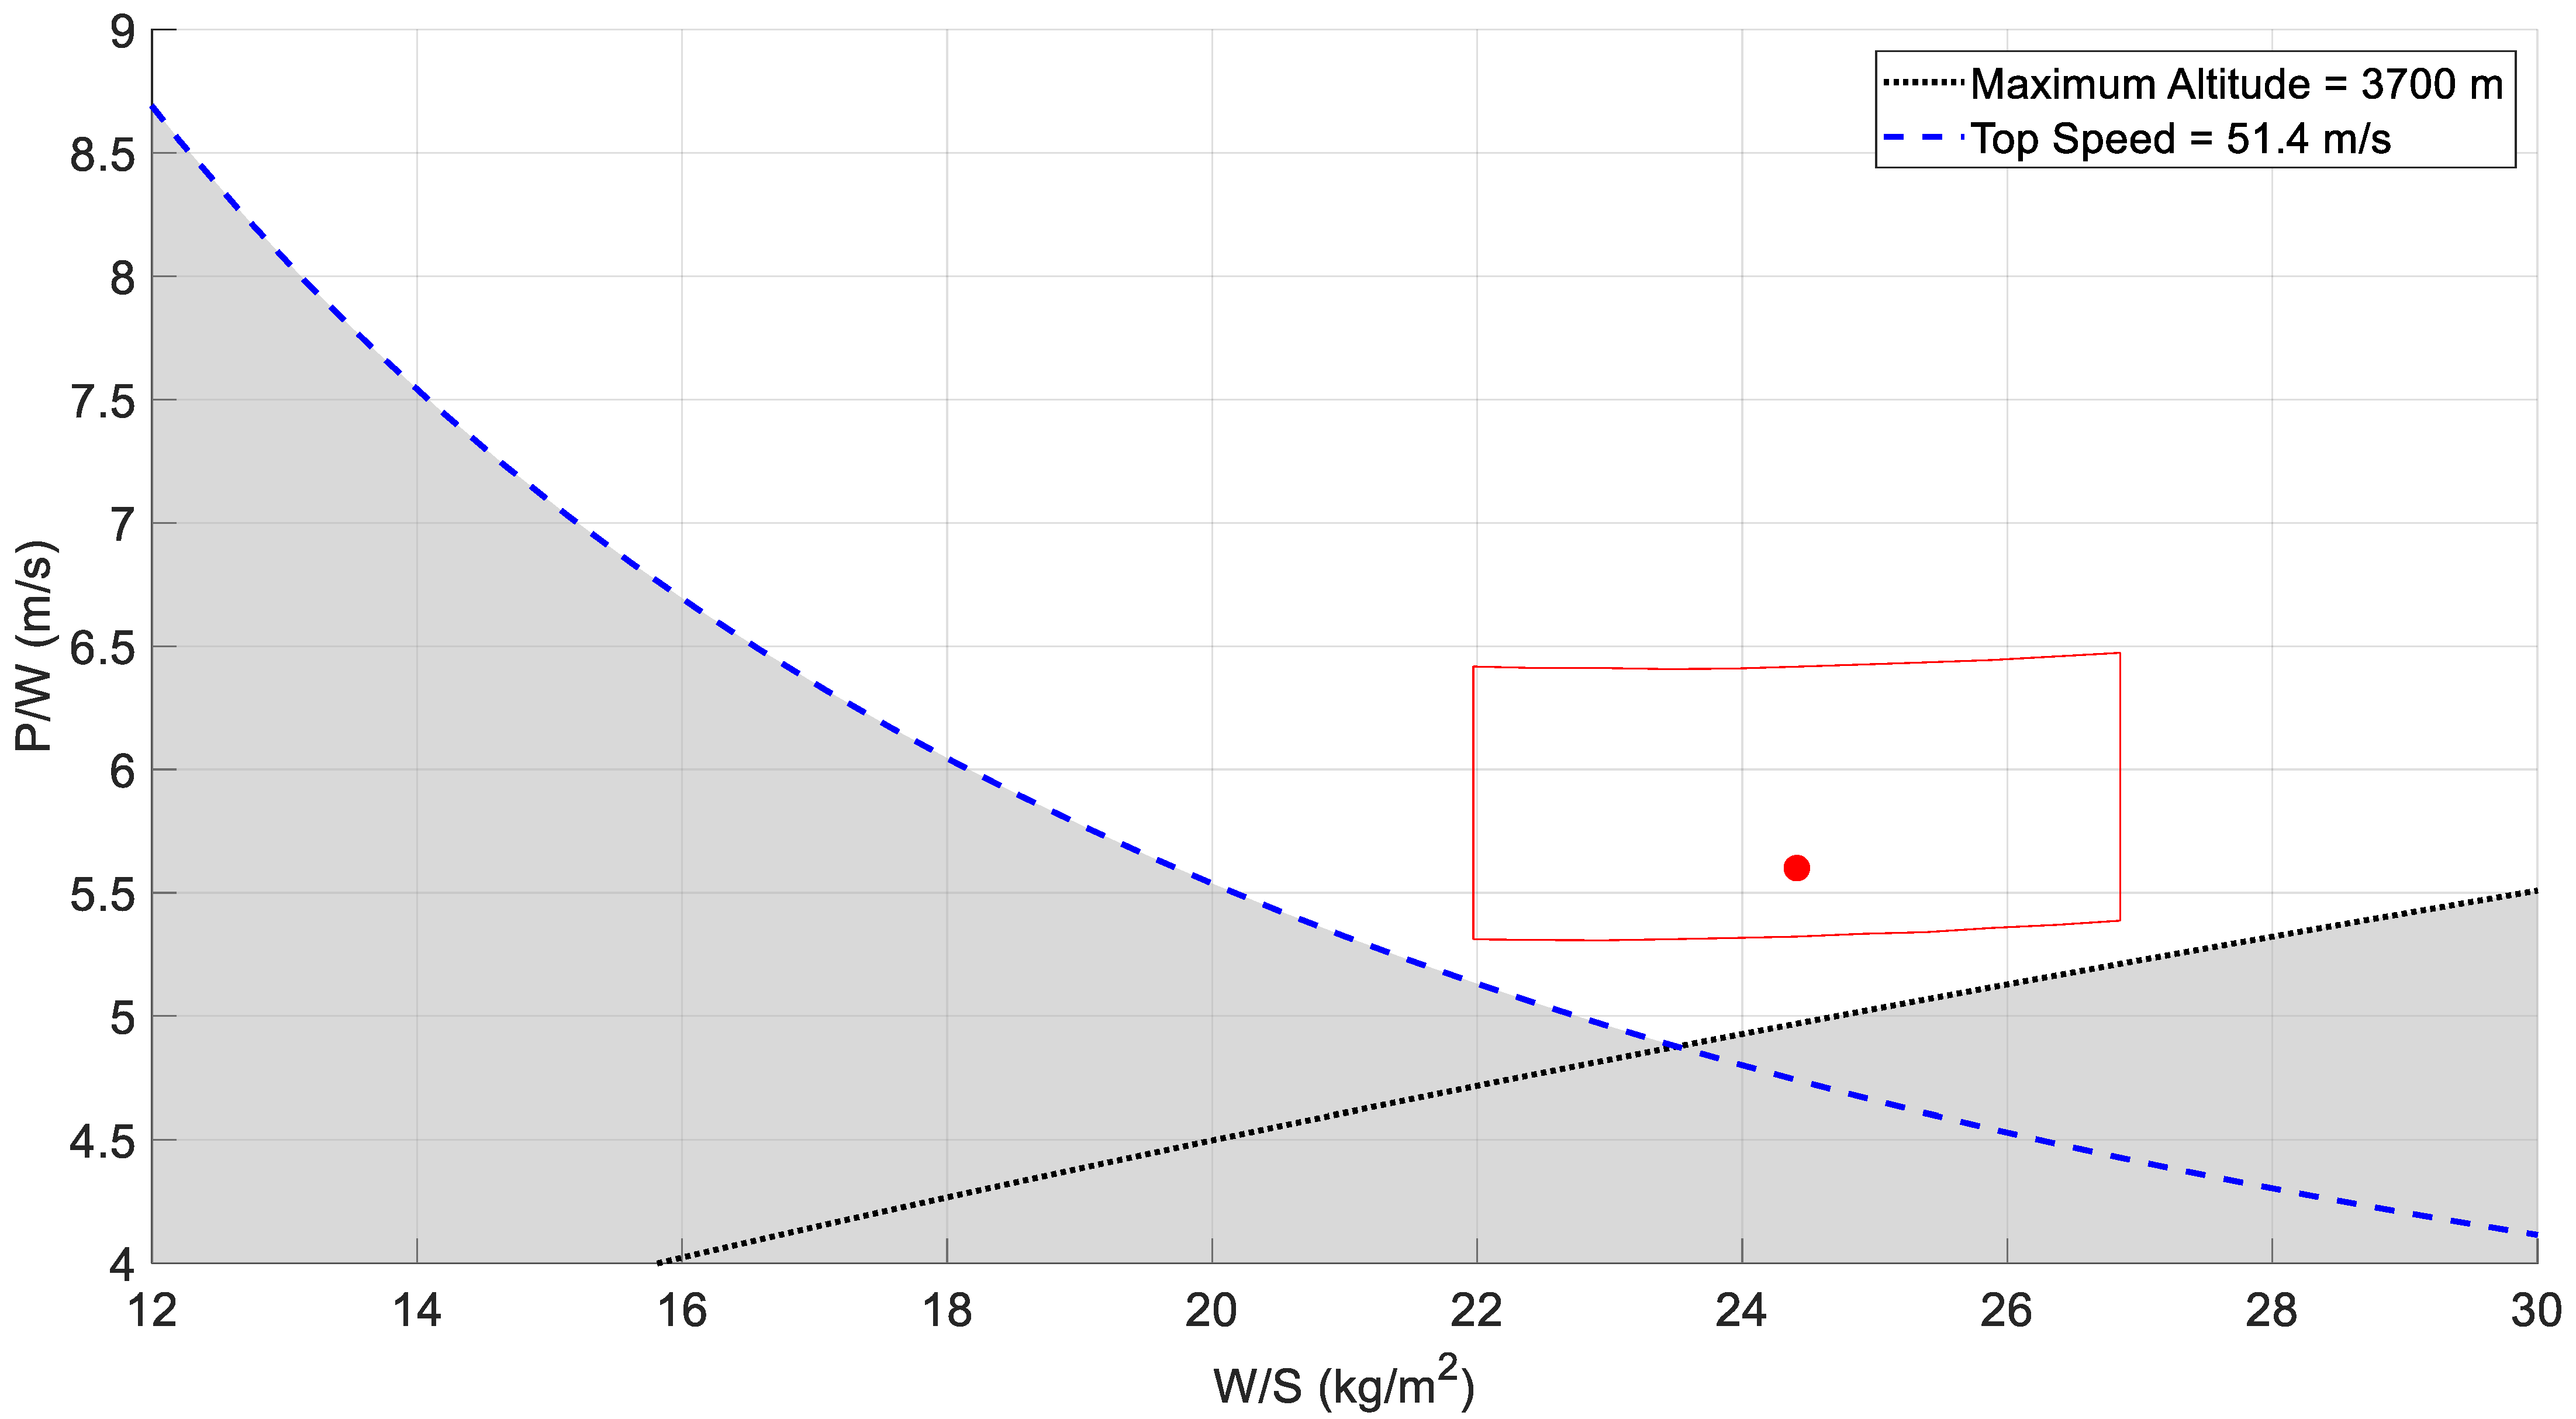
By varying code inputs, two carpet plots were generated to size the wing, select a powerplant, and determine a cruise speed. Design space plots were constructed assuming a power-producing engine. The first of these plots is the power-to-weight ratio versus wing loading shown in Figure 14.
Two constraint lines are plotted: one for the top speed requirement of 51.4 m/s and one for the maximum altitude requirement of 3700 m. All areas above both constraint lines represent the feasible design space. The shaded area represents infeasible design space. The maximum altitude constraint shows that higher wing loadings require more power. The maximum speed constraint shows that power required decreases as wing loading increases. A wing loading of 24.4 kg/m2 at a 22.7 kg predicted mass yields a 0.93 m2 wing area. A sensitivity analysis, plotted in red, was conducted to ensure that the aircraft would meet requirements in the presence of manufacturing and performance uncertainties. The bounds represent variation in constant-wing area mass of ±2.27 kg and a minus 10% to plus 5% change in power required due to drag variations. This drag power uncertainty is used because the aerodynamics code includes a conservative prediction of fuselage wetted area and parasitic drag. The red point represents a design mass of 22.7 kg. The space enclosed by the red lines in Figure 14 represents possible performance variations in the production aircraft as a result of design stage uncertainties.
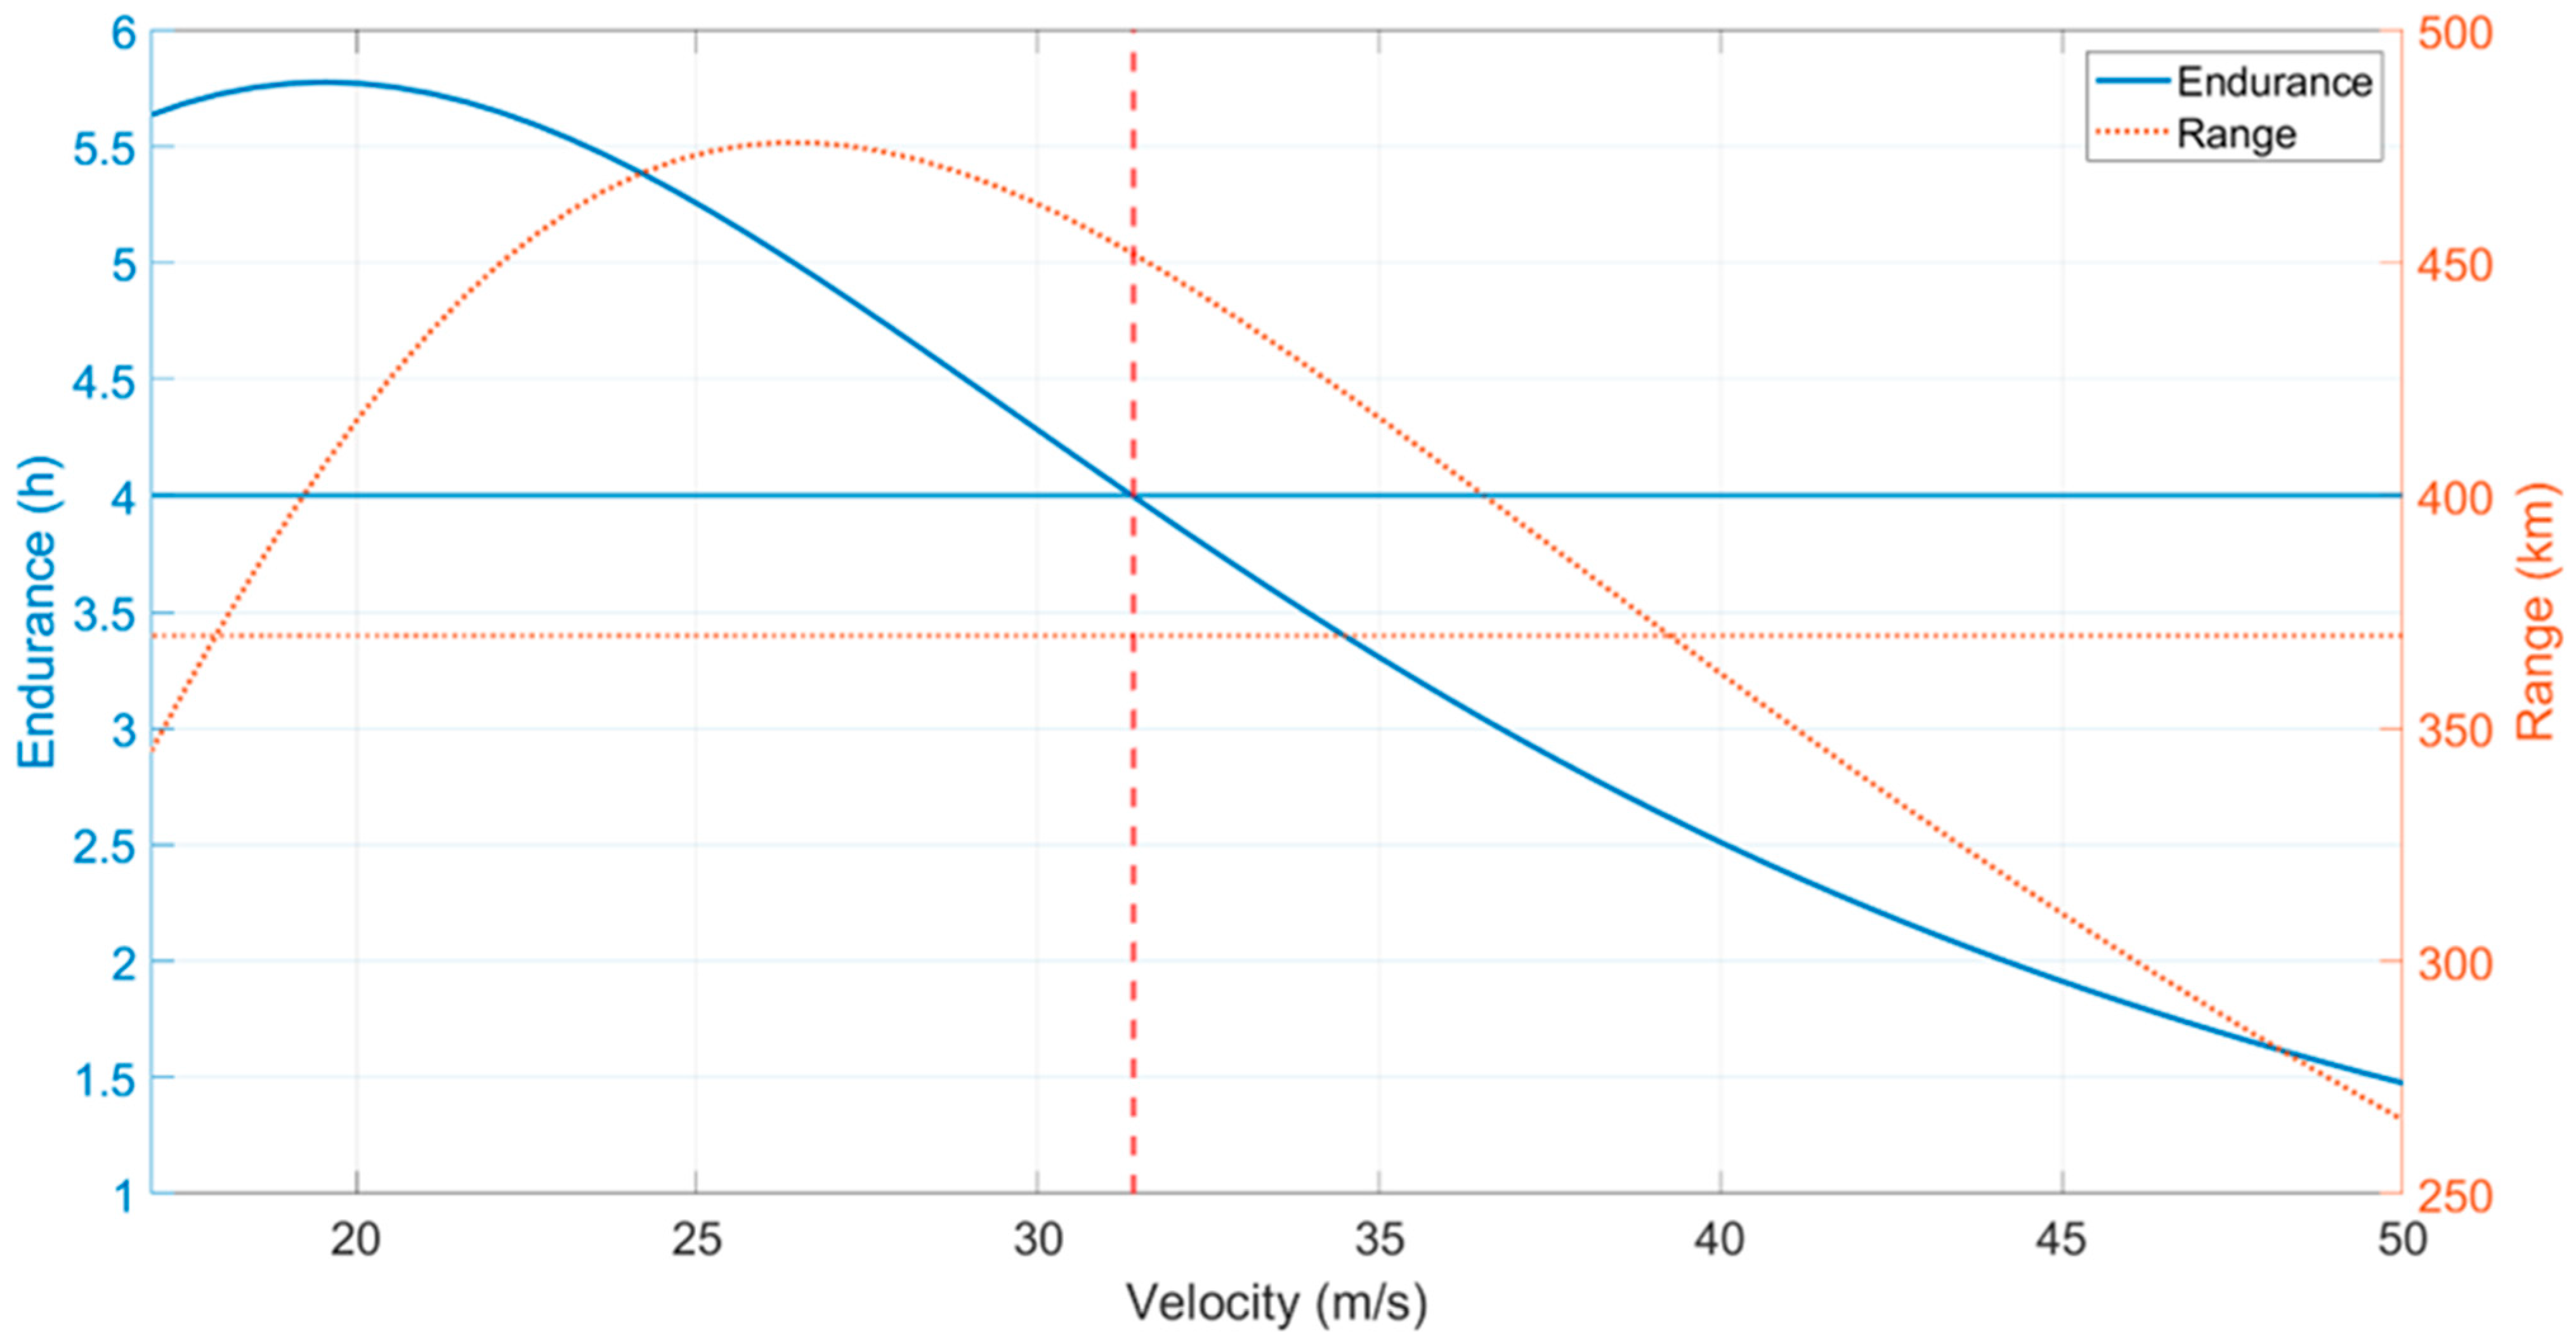
With the power and wing area defined in Figure 14, aircraft performance was analyzed to ensure range and endurance requirements were met. Figure 15 shows range and endurance plotted with respect to cruise velocity.
The endurance is plotted in a blue solid line on the left-hand axis, and the range is plotted in orange dots on the right-hand axis. The corresponding horizontal lines represent the objective requirement constraints, which are 4 h of endurance and 370 km of range. The vertical line represents a velocity of 31.4 m/s, which is the fastest cruise speed at which the aircraft can fulfill range and endurance requirements simultaneously. The mission of rapid deployment of medical aid informs the choice of a high cruise velocity. Figure 15 also illustrates that the mission profile can be adjusted to achieve a maximum endurance of 5.8 h or a maximum range of 475 km at takeoff weight. Figure 15 validates the choice of a 0.93 m2 wing area by illustrating simultaneous achievement of range and endurance requirements while allowing a mission planner to trade range or endurance for speed.

4.6. Manufacturing Highlights

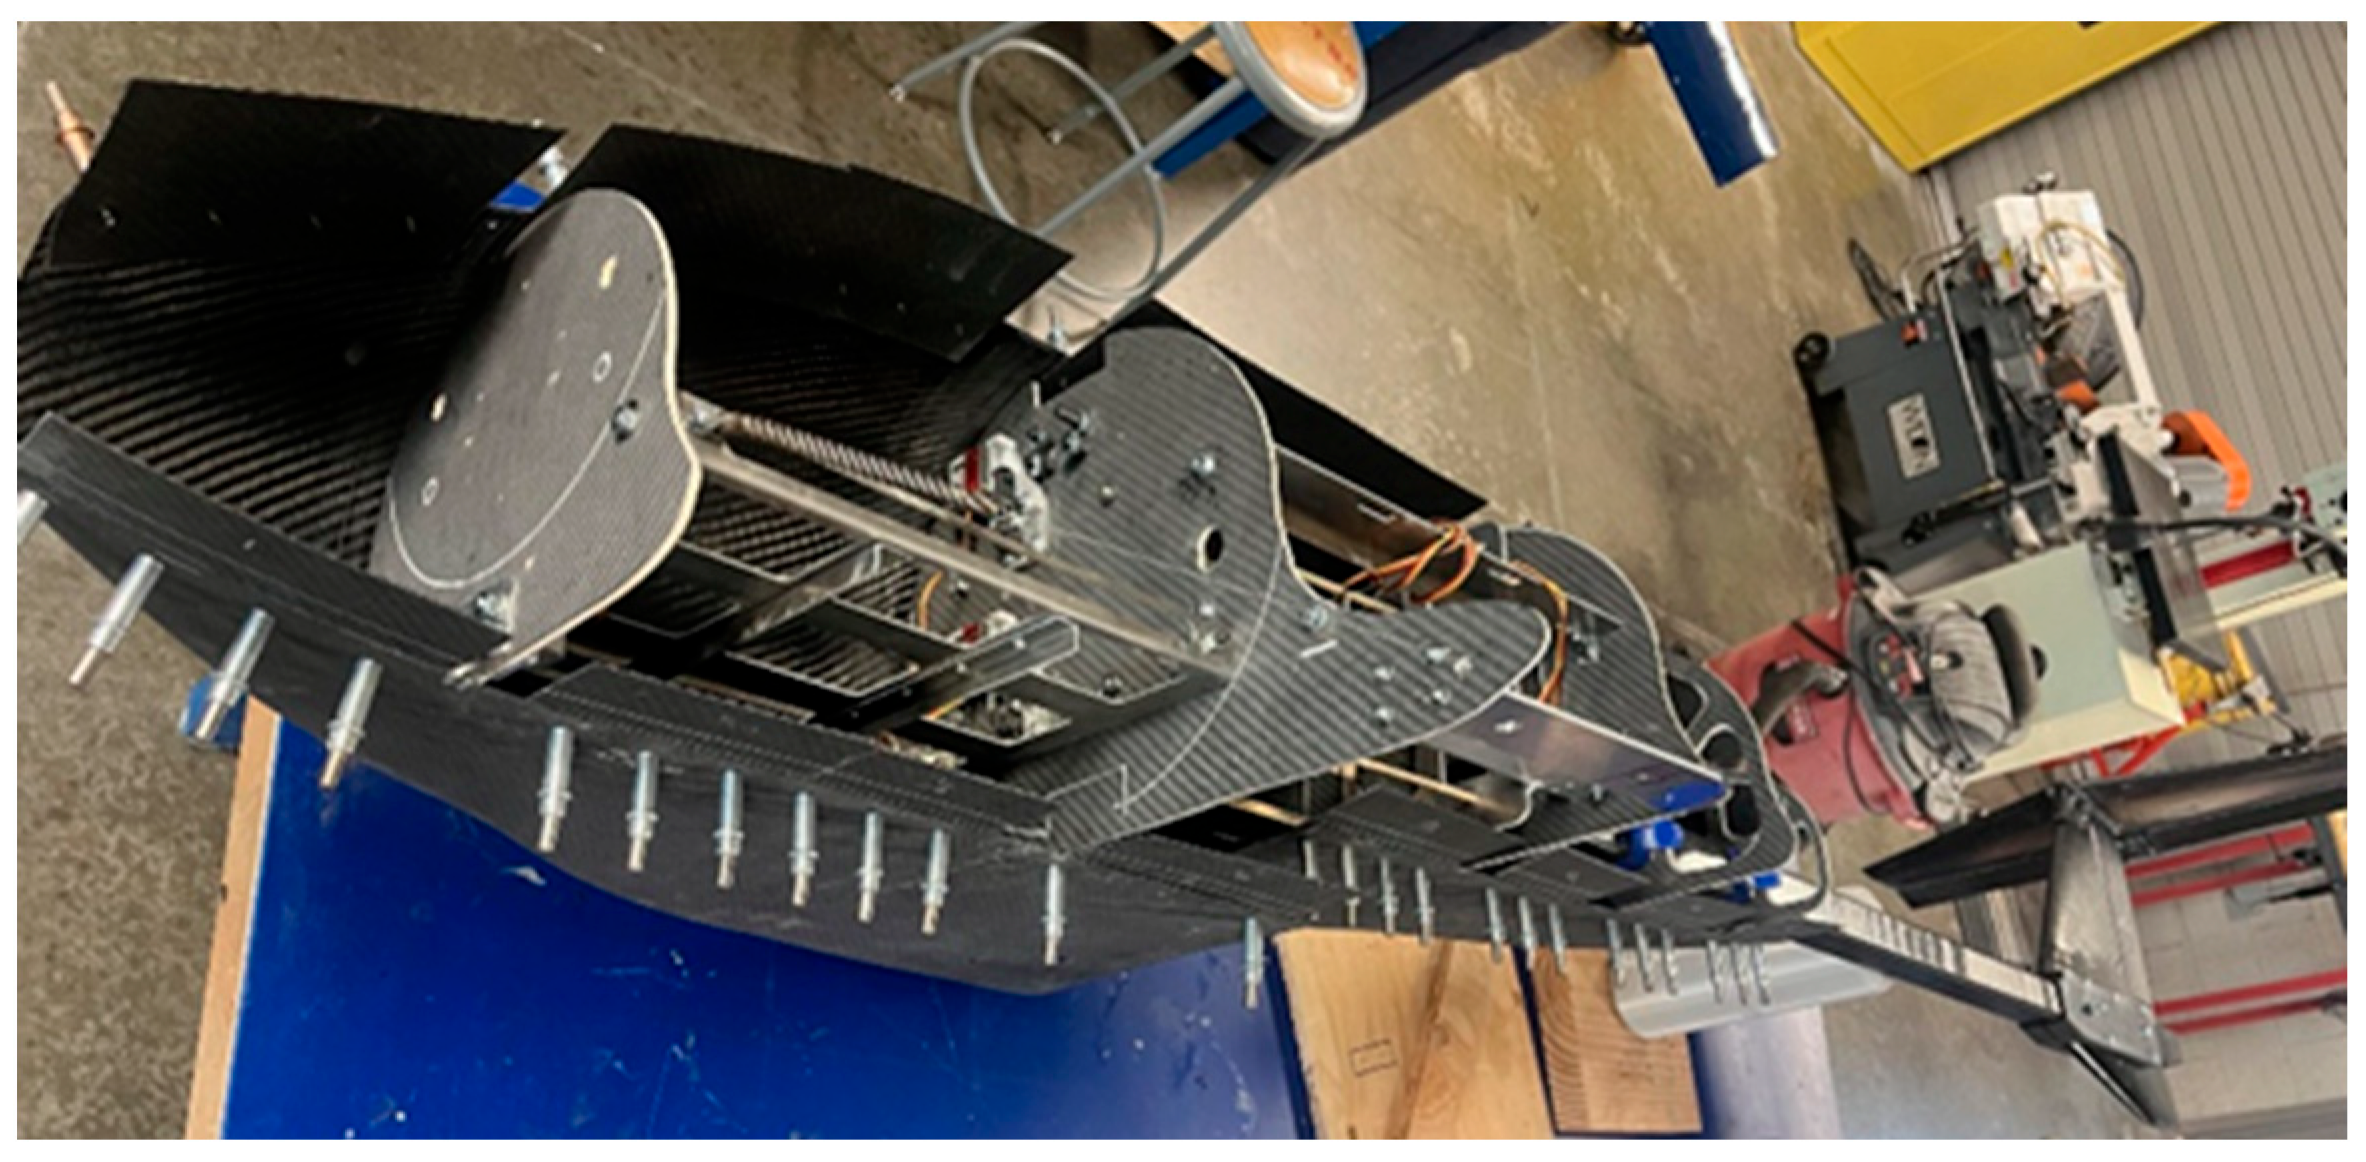
The internal aircraft structure of the flight test article was designed to minimize manufacturing and assembly complexity. Five bulkheads supported the internals and connected them to the aircraft skin. The bulkheads were originally designed as pine wood but were changed to a balsa-core carbon fiber laminate that allowed them to be smaller, stiffer, and lighter. This change was made during the manufacturing process to reduce the weight of the bulkheads by 40%. The bulkheads are joined with the tail boom, L-brackets, and aluminum plates to form an easily assembled structure independent of the skin (seen in Figure 16).
Figure 16 provides a schematic view of all major internal components. One of the largest components is the avionics tray, which internally joined the firewall to the next bulkhead while supporting the avionics. This tray is bent aluminum stiffened with two aluminum L-channels and can be seen in Figure 17B.
The center bulkheads are spaced 14.0 in. (356 mm) apart to support the lugs and their mounts, shown in Figure 17A. The section between these bulkheads included the payload deployment system, the upper plates for the wing folding bearings, and the fuel tanks. To maximize volume, the fuel tanks for the commercial article would match the internal curve of the skin (Figure 17C). However, these tanks were replaced with battery trays for the FTA. All of these components were aluminum, including the payload deployment system shown in Figure 18.
The payload deployment framework uses plates to align the payloads and carbon rods to support the base of each canister. Pins are extended via servo motor to support each canister above the carbon rod or retracted to allow the payload to fall free of the aircraft. The minimalistic structure and few moving parts make this design reliable and easy to assemble.
The external structure consists of the fuselage skin, tail, wings, and lugs. The lugs shown in Figure 17A were a threaded military standard design [29], recreated using a 3D-printed component. Despite their PLA plastic construction, the lugs were tested and determined to be capable of supporting the aircraft with an MOS of 1. For the commercial article, the lugs will follow military specifications.
The wings for this aircraft are unique, as they have a piano-hinge style cut for the ailerons and flaps. A 6.35 mm carbon rod serves as both the hinge and an additional spar for the trailing edge of the wing (see Figure 12). This system allowed the flaps to fold at a 90° angle, which was required for the wings to fit within the minimum space requirement. A sear-based mechanism was used to hold the wings in the aft position. The flaps and the wing retention assembly are depicted in Figure 19.
The retention assembly is connected to the tail boom with two bolts. The hooks extending to the wings are held in position by the sears, which are spring-loaded to rest in the locked position. The sears are connected to the servo with braided line that is run through the central block of the assembly. This connection allows the sears to be released manually while loading the wings, or remotely in flight.
The choice to sweep the wings and retain them next to each other held multiple benefits. Coplanar wings improve roll stability, since the wings maintain a proportional dihedral even when flexing. The form factor of the aircraft is also low when compared to an alternative such as stacked wings, as coplanar wings occupy less of the internal space needed for fuel and payload storage. Most importantly, the payload of this aircraft can drop between the wings, which would be prevented by the centrally located hinges of a stacked wing. Finally, the folding flaps also allowed for a greater chord at the root of the wing when deployed, reducing the required wingspan. The ailerons did not need to fold 90° as they achieved sufficient clearance with the standard maximum downward deflection. An alternate view of the wings and ailerons can be seen in Figure 20, which has the flaps hidden for clarity.
The folded flaps and deflected ailerons introduce a risk during the deployment phase, as the rapid movement of these surfaces could induce instability. To mitigate this risk, pitch authority was a major priority when designing the aircraft. The T-tail configuration was selected to reduce the effects of airflow disruption by the fuselage over the tail at high angles of attack, ensuring that the aircraft has sufficient pitch and yaw authority at all attitudes. The T-tail was supported by a 41.275 mm carbon fiber square tube to maintain rigidity while reducing complexity and weight.
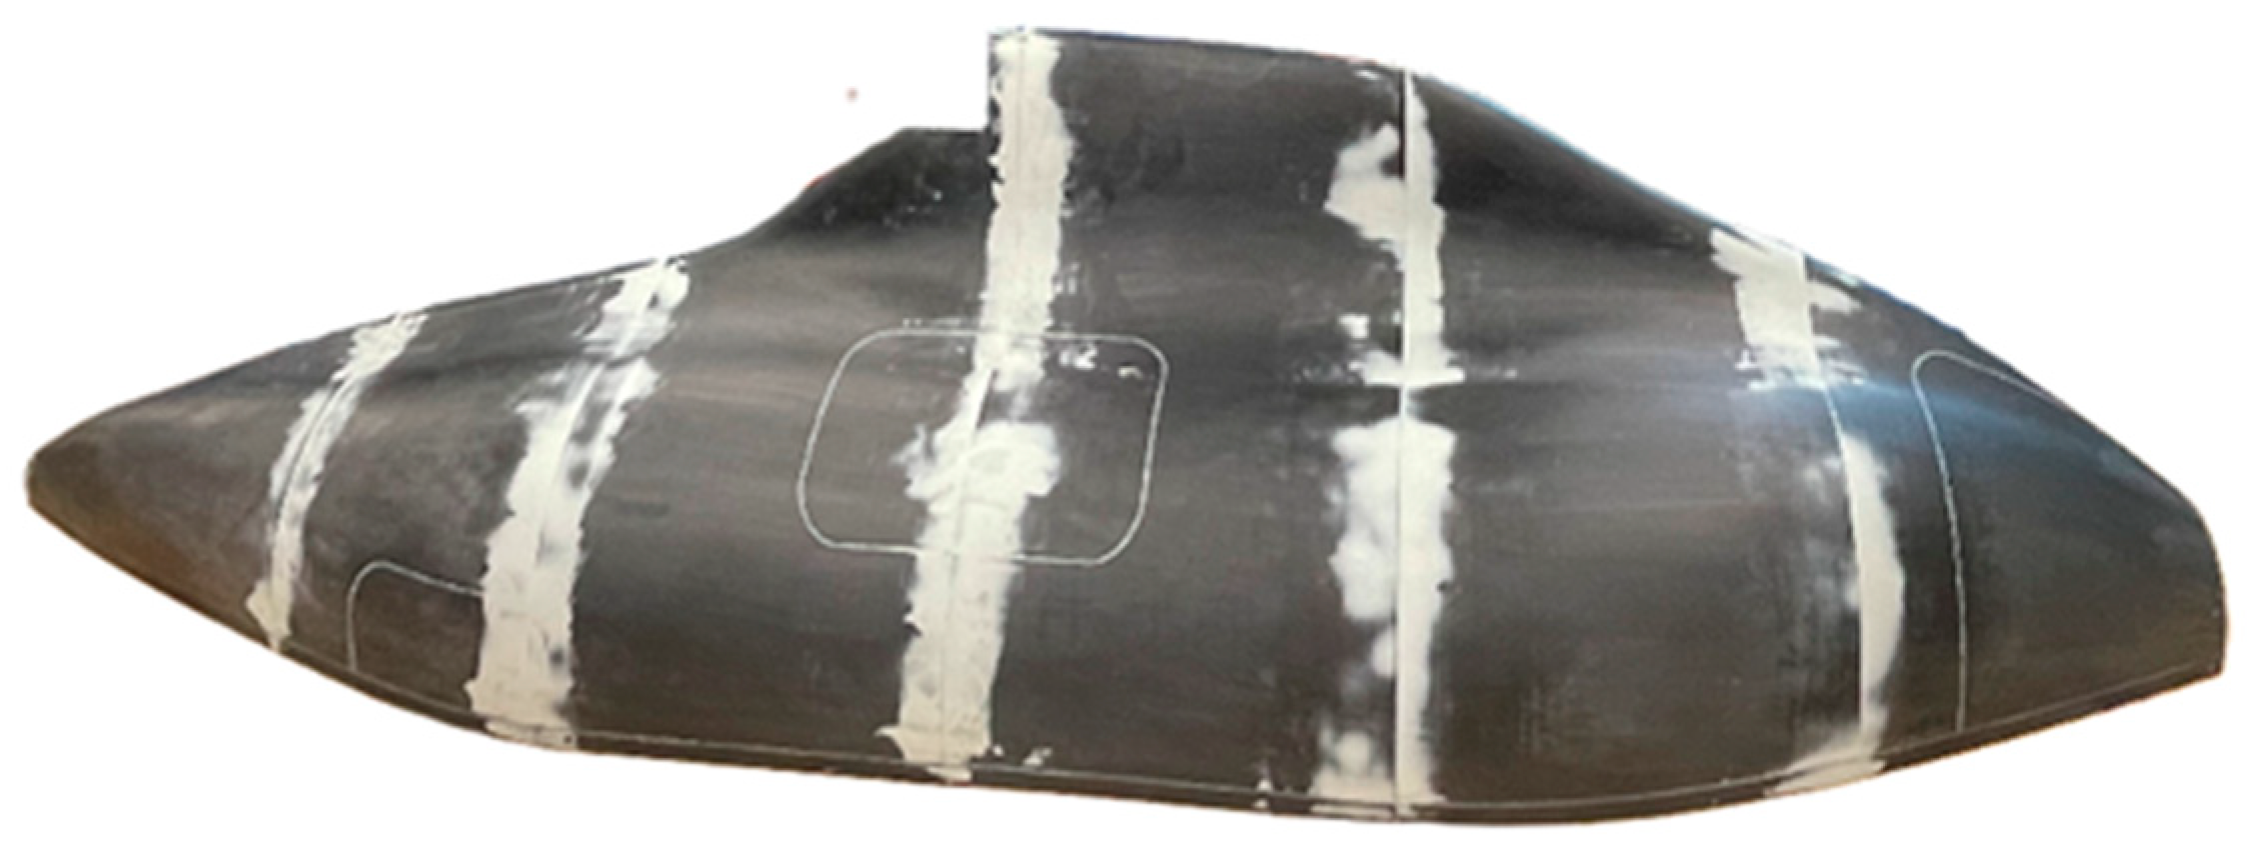
The fuselage is an unconventional shape because the wing folding system required the fuselage to encase a horizontal distance of nearly 610 mm. The fuselage was flanged to a width of 610 mm at the base but narrowed above to reduce the weight and frontal area. While the fuselage shape could have been simpler, the continuous mold line allowed for the entire fuselage to be constructed in two halves with less drag from joints and fasteners. Most aircraft require elaborate jigs and other measurement checks to ensure parts are placed properly. However, this fuselage was manufactured in halves using two positive 3D-printed molds so that the internal structure lay in the correct position and orientation (Figure 21).
Splitting the aircraft in this way allowed the cured skin to cleanly release from the mold. More importantly, the split skins allowed the internal structure to be assembled independently and sandwiched between the two halves, as shown in Figure 22. The simple wing folding mechanism (see Figure 12) could also be manufactured separately from the skin and was installed prior to joining the halves.
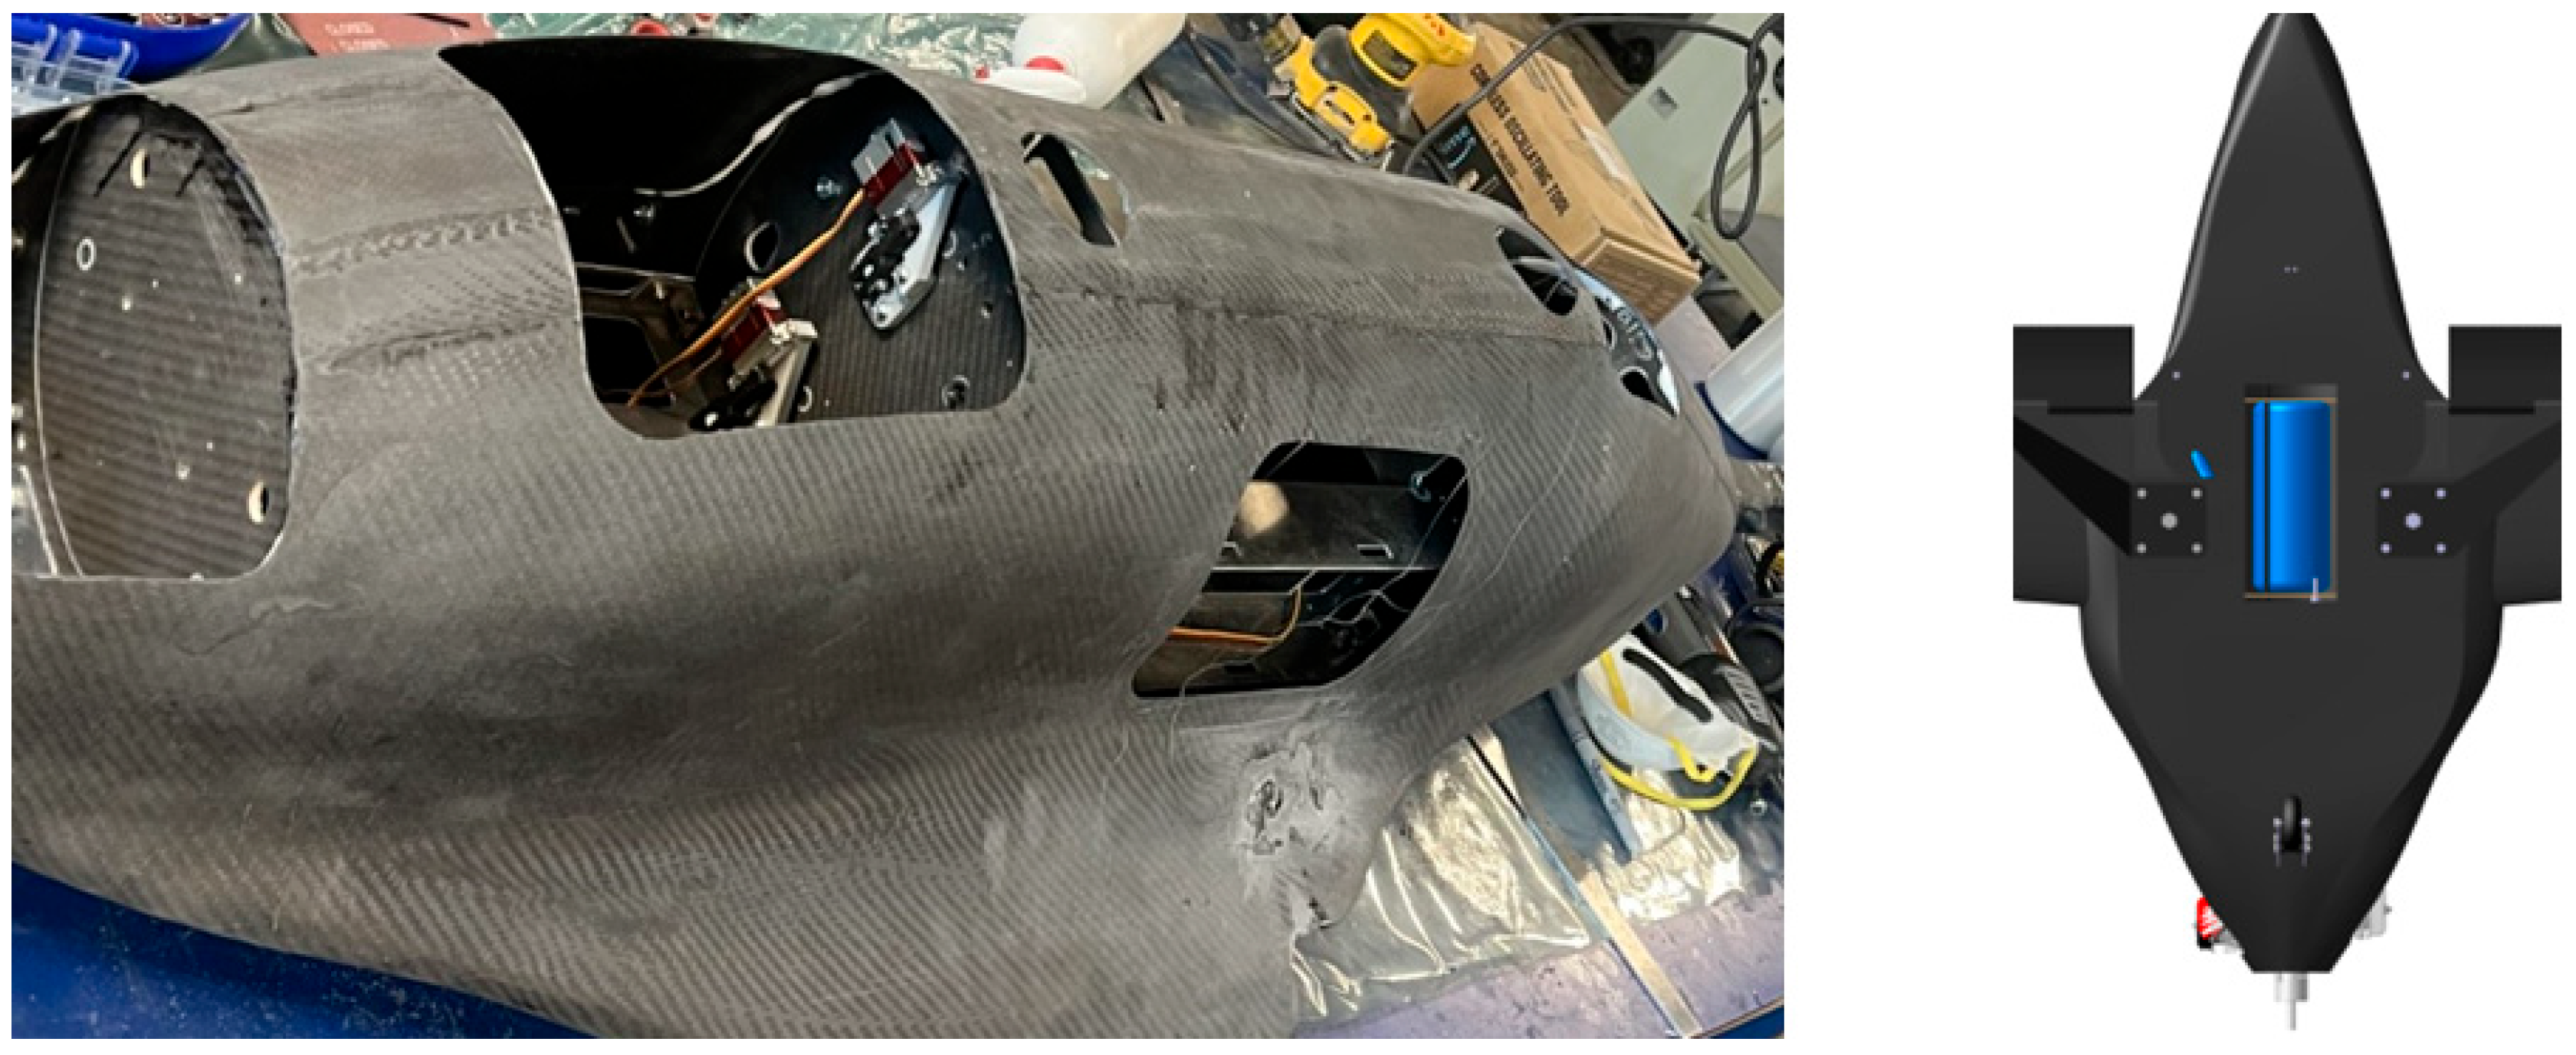
With this manufacturing method, the internal structure could easily be placed into the correct position for quick assembly. To complete the assembly of the aircraft, the internal structure was attached to both halves using a quick-curing glass bead and chopped cotton resin mix. Cleco fasteners held the two halves of the fuselage together while the resin cured, then the seam was covered with three carbon fiber strips. Following this step, the avionics were installed through access hatches cut into the skin, shown in Figure 23.
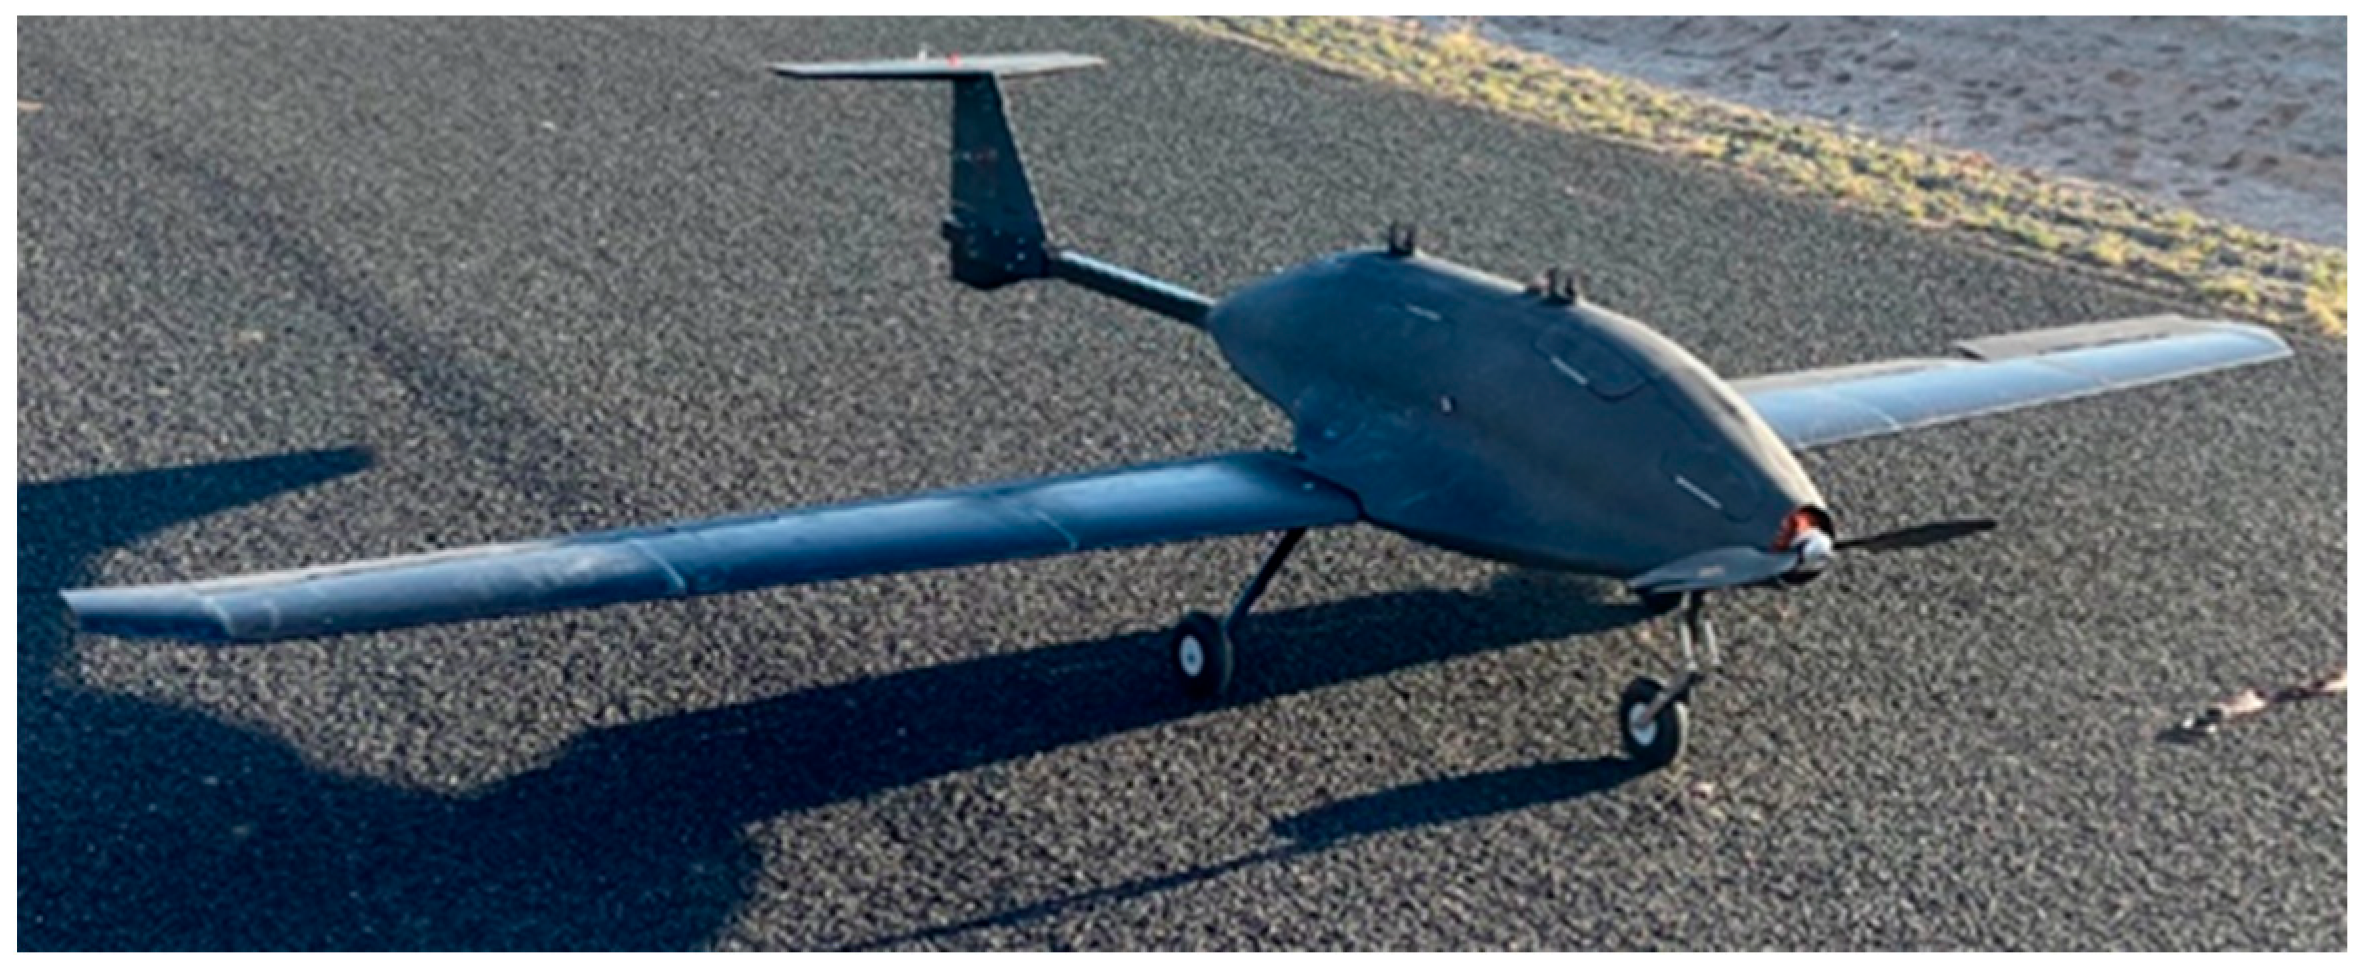
The access hatches provided access to all bulkheads, trays, and wire routings necessary for the installation of all electrical components. To maintain accessibility without compromising aerodynamics, the hatches opened with piano hinges and were screwed shut using nut plates. Finally, the wings and landing gear could be installed through the wing-fold opening underneath, resulting in the flight-ready FTA seen in Figure 24.
While the FTA was initially unloaded, the canisters can be loaded by pushing them upward into the same ventral opening they fall through during deployment.

5. Testing

To validate requirements, mitigate risks, and refine the design, a series of tests were performed. The aircraft was divided into subsystems to simplify initial manufacturing, and these subsystems tested wing deployment, payload deployment, propulsion performance, and preliminary aerodynamics. The results of these tests influenced design changes that were then retested using a small-scale wind tunnel model and the full-scale flight test article.

5.1. Subsystem Testing

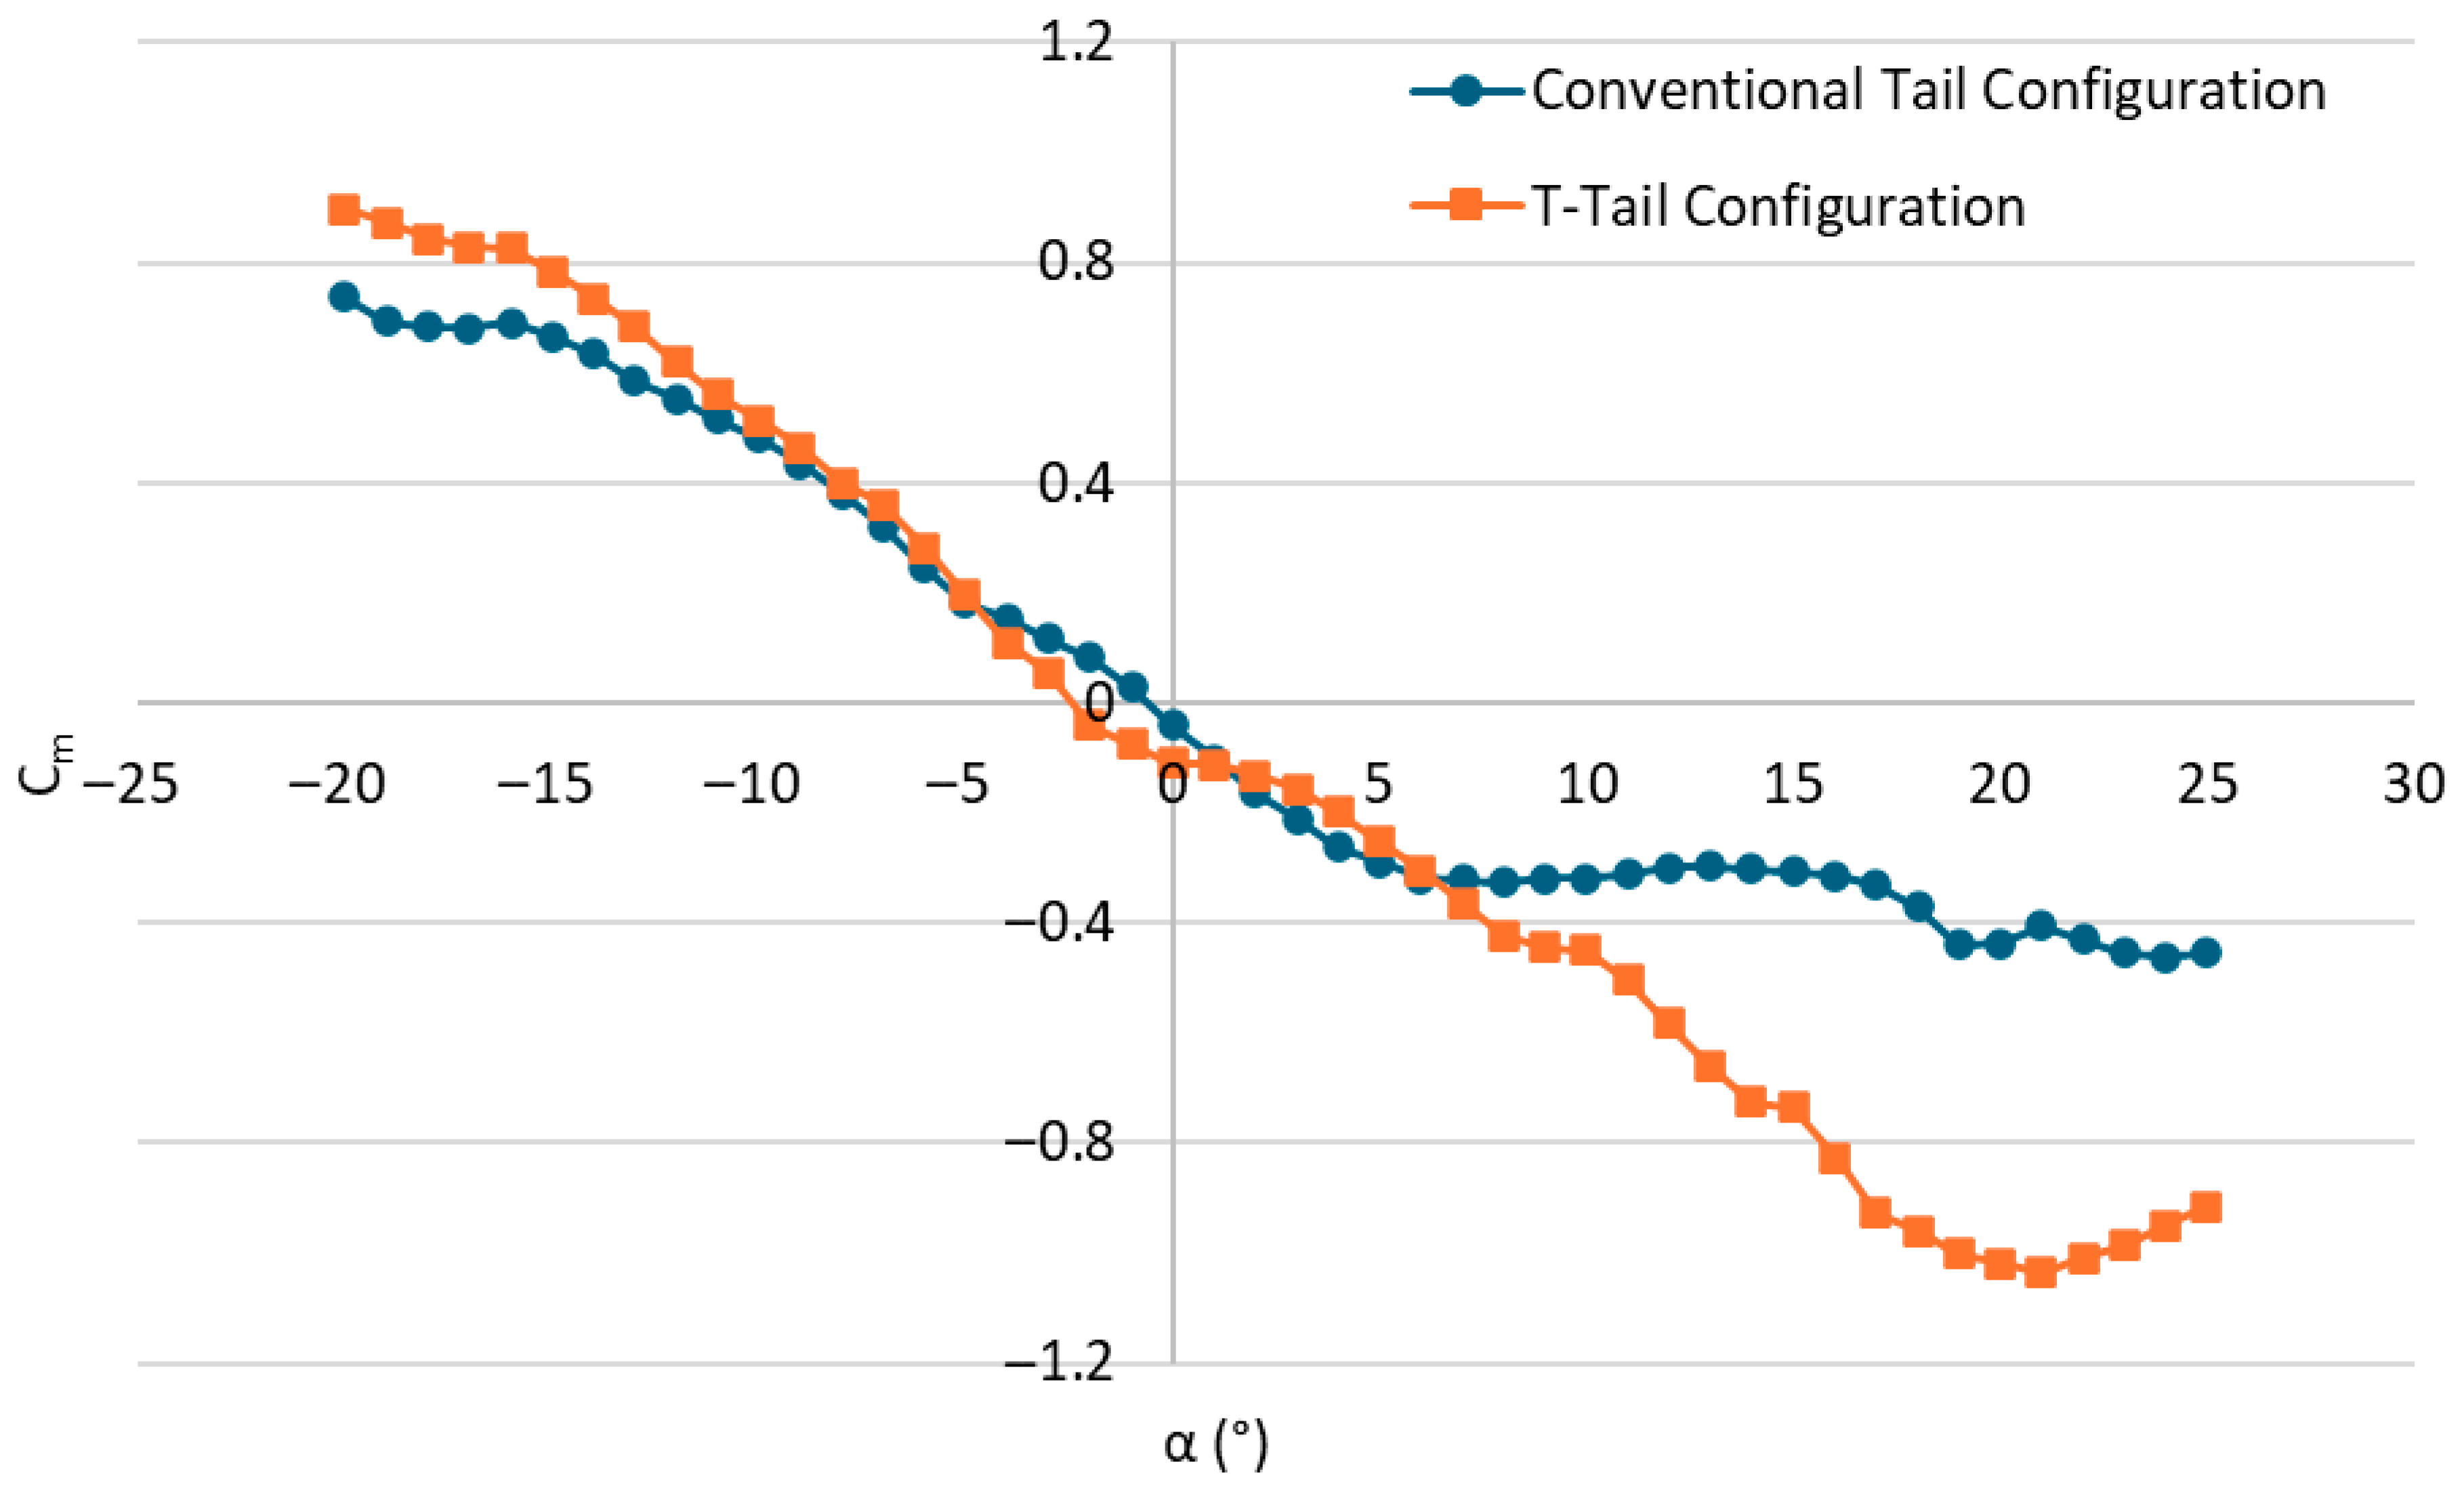
A highlight of subsystem testing was a FlightStream simulation that resulted in a change to the tail design. FlightStream is a CFD software that uses a surface-vorticity solver integrated with a boundary layer model and flow separation solver. The purpose of FlightStream testing was to evaluate the aircraft’s static and dynamic stability, and results were later validated through wind tunnel testing. For FlightStream to output accurate data, the aerodynamic center and the static margin of the aircraft were defined. To locate the aerodynamic center in FlightStream, a trial-and-error method was used until the pitching moment coefficient stayed relatively constant for a small α range between −2° and 2°. Then, a 15% static margin was defined in FlightStream to set up the simulation reference frame. One key finding of the FlightStream simulation was the pitching moment (Cm) behavior of the airplane, as shown in Figure 25.
In Figure 25, the pitching moment coefficient stays relatively constant for α between 5° and 15°, representing a loss of pitch stability for a conventional tail configuration. FlightStream flow visualization showed that this loss of stability was due to vortices impinging on the tail. The discontinuity in the main wing from the folding functionality generates vortices at the wing roots. To solve this problem, the horizontal stabilizer was relocated to the top of the vertical stabilizer. This T-tail configuration effectively moved the horizontal stabilizer out of the wake of the main wing and improved the aircraft’s pitch stability.
In addition to FlightStream testing, initial payload deployment and wing deployment concepts were tested. Complexity in the initial payload deployment subsystem led to a failure rate of 36.6% out of 30 tests, prompting a complete redesign to a simpler system used in the flight test and commercial models. Initial wing deployment testing showed a 0% failure rate out of 12 tests when storing, deploying, and securing the wing in a static environment. However, the wing model prematurely deployed every time when tested in a dynamic environment due to a lack of rigidity in the test model. Based on this wing subsystem testing, the wing pivots were redesigned to incorporate thrust bearings rather than ball bearings, the retention sears were modified, and further testing was conducted using the carbon fiber wing of the flight test article.

5.2. Wind Tunnel Testing

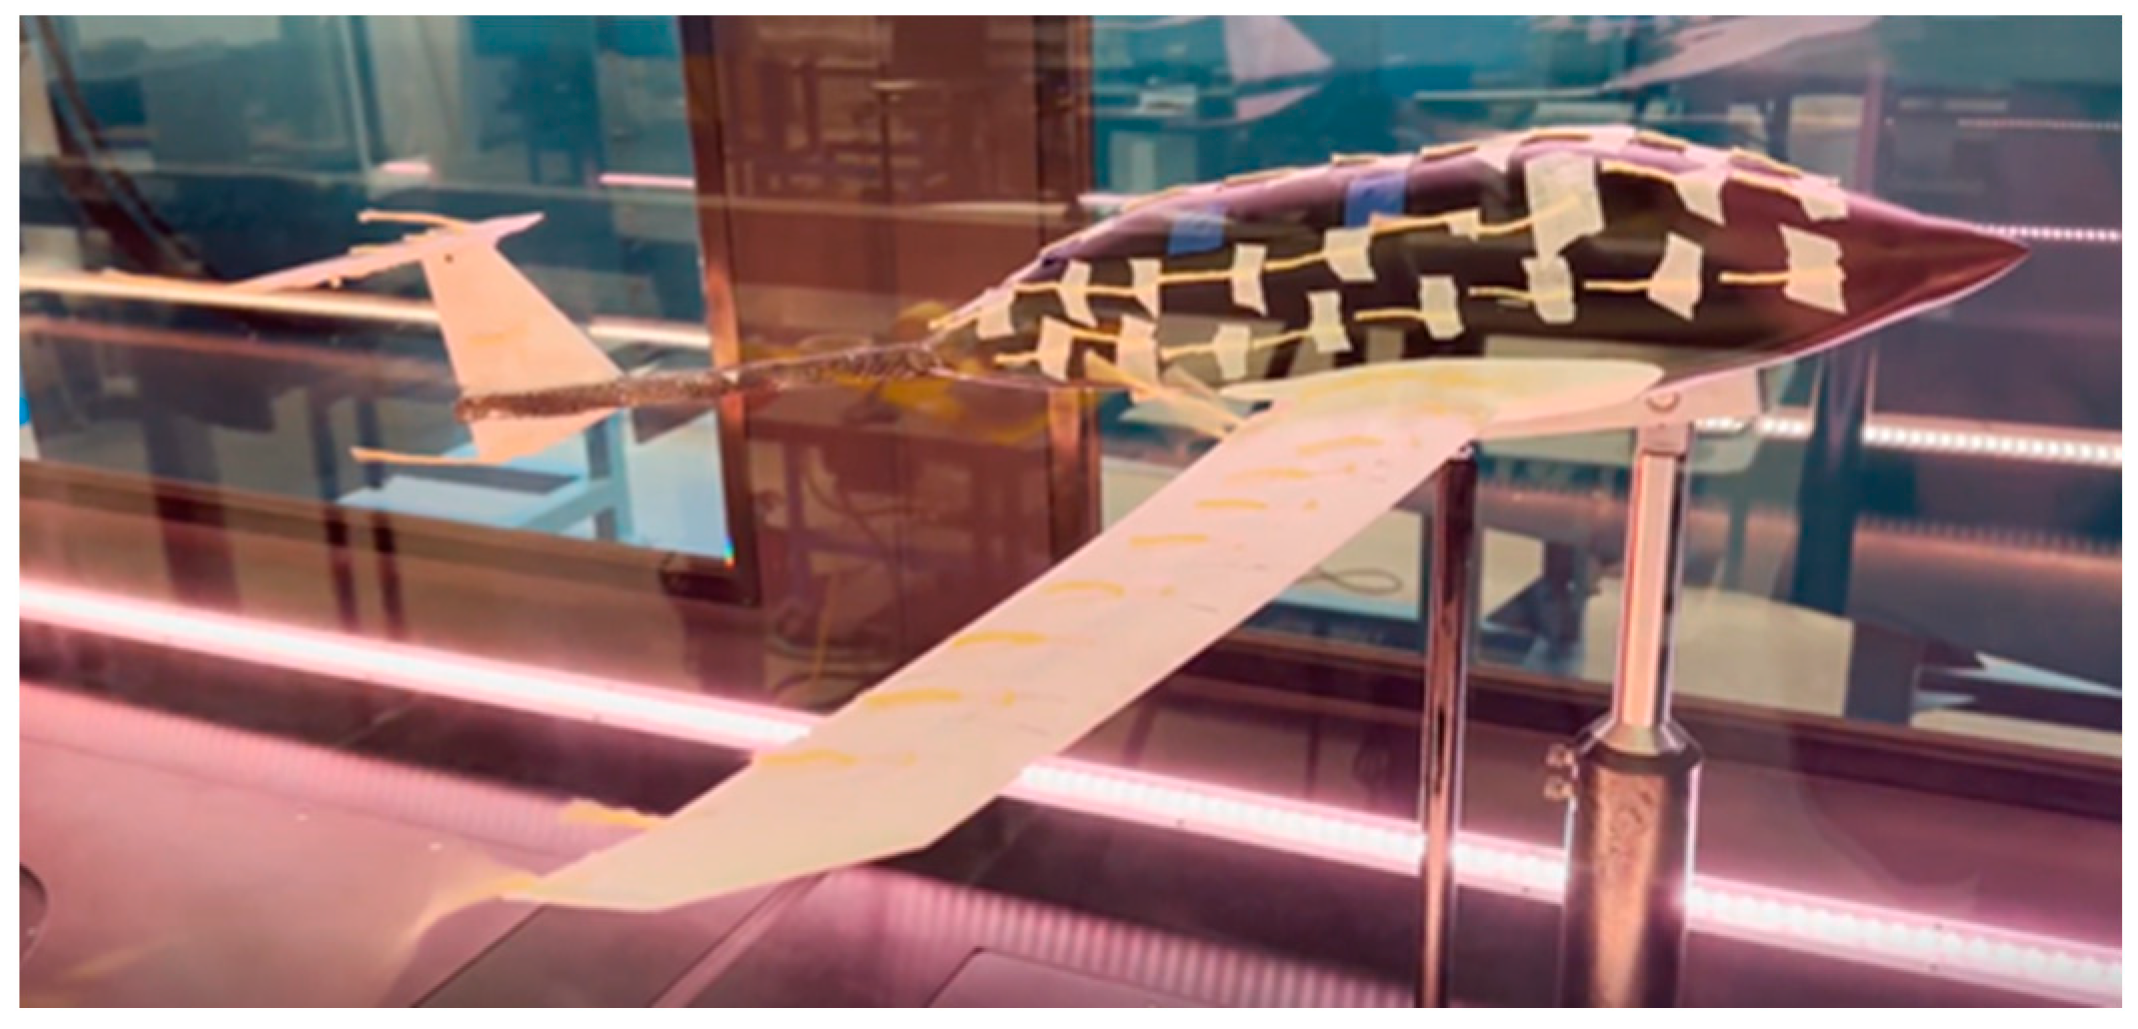
Wind tunnel testing was conducted to mature and validate the design while verifying the accuracy of the FlightStream computational analyses. The available wind tunnel facility is limited to 50 m/s and a Reynolds number (Re) of approximately 350,000, which is lower than the flight Re anticipated for cruise. Although the Re of the wind tunnel is less than the Re for cruise, it remains sufficient to extract the trends of the moment plots and extrapolate the coefficients of drag for comparison. The test article was a rapid prototype model printed in PLA plastic, stiffened internally with carbon fiber spars, and stiffened externally with fiberglass and carbon fiber lay-ups. The model was balanced on the correct CG position using lead shot.
Testing included an angle of attack (α) sweep, a sideslip (β) sweep, and a surface flow visualization test. The α sweep was conducted at Re values of 225,000, 170,000, and 122,000. The β sweep was conducted at a Re of 225,000 and the surface flow visualization occurred at an Re of 183,000. Model strength limited maximum Re to 225,000. Model strength also restricted α range at higher Re. Flow visualization was completed at 183,000 Re to reach a higher Re while still giving a wider α range than the limited range at 225,000. The data from these tests were then used to validate the previous design changes and computational results. The drag coefficient was estimated from the α sweep results using a drag coefficient extrapolation method [30]. Following extrapolation, the resulting CD values at the cruise CL of 0.4 are shown in Table 8 and compared to validate performance predictions.
As shown in Table 8, the aircraft sizing and performance prediction code yields the highest predicted drag. The wind tunnel model yields 10% lower drag. This is expected because the wind tunnel model lacks minor sources of drag such as control surface gap drag, propeller-induced drag, and trim drag. FlightStream’s drag prediction is significantly lower because it lacks additional sources of drag such as surface roughness and other manufacturing imperfections. A comparison of the sizing code and wind tunnel model lends support to the sizing code’s range and endurance predictions.
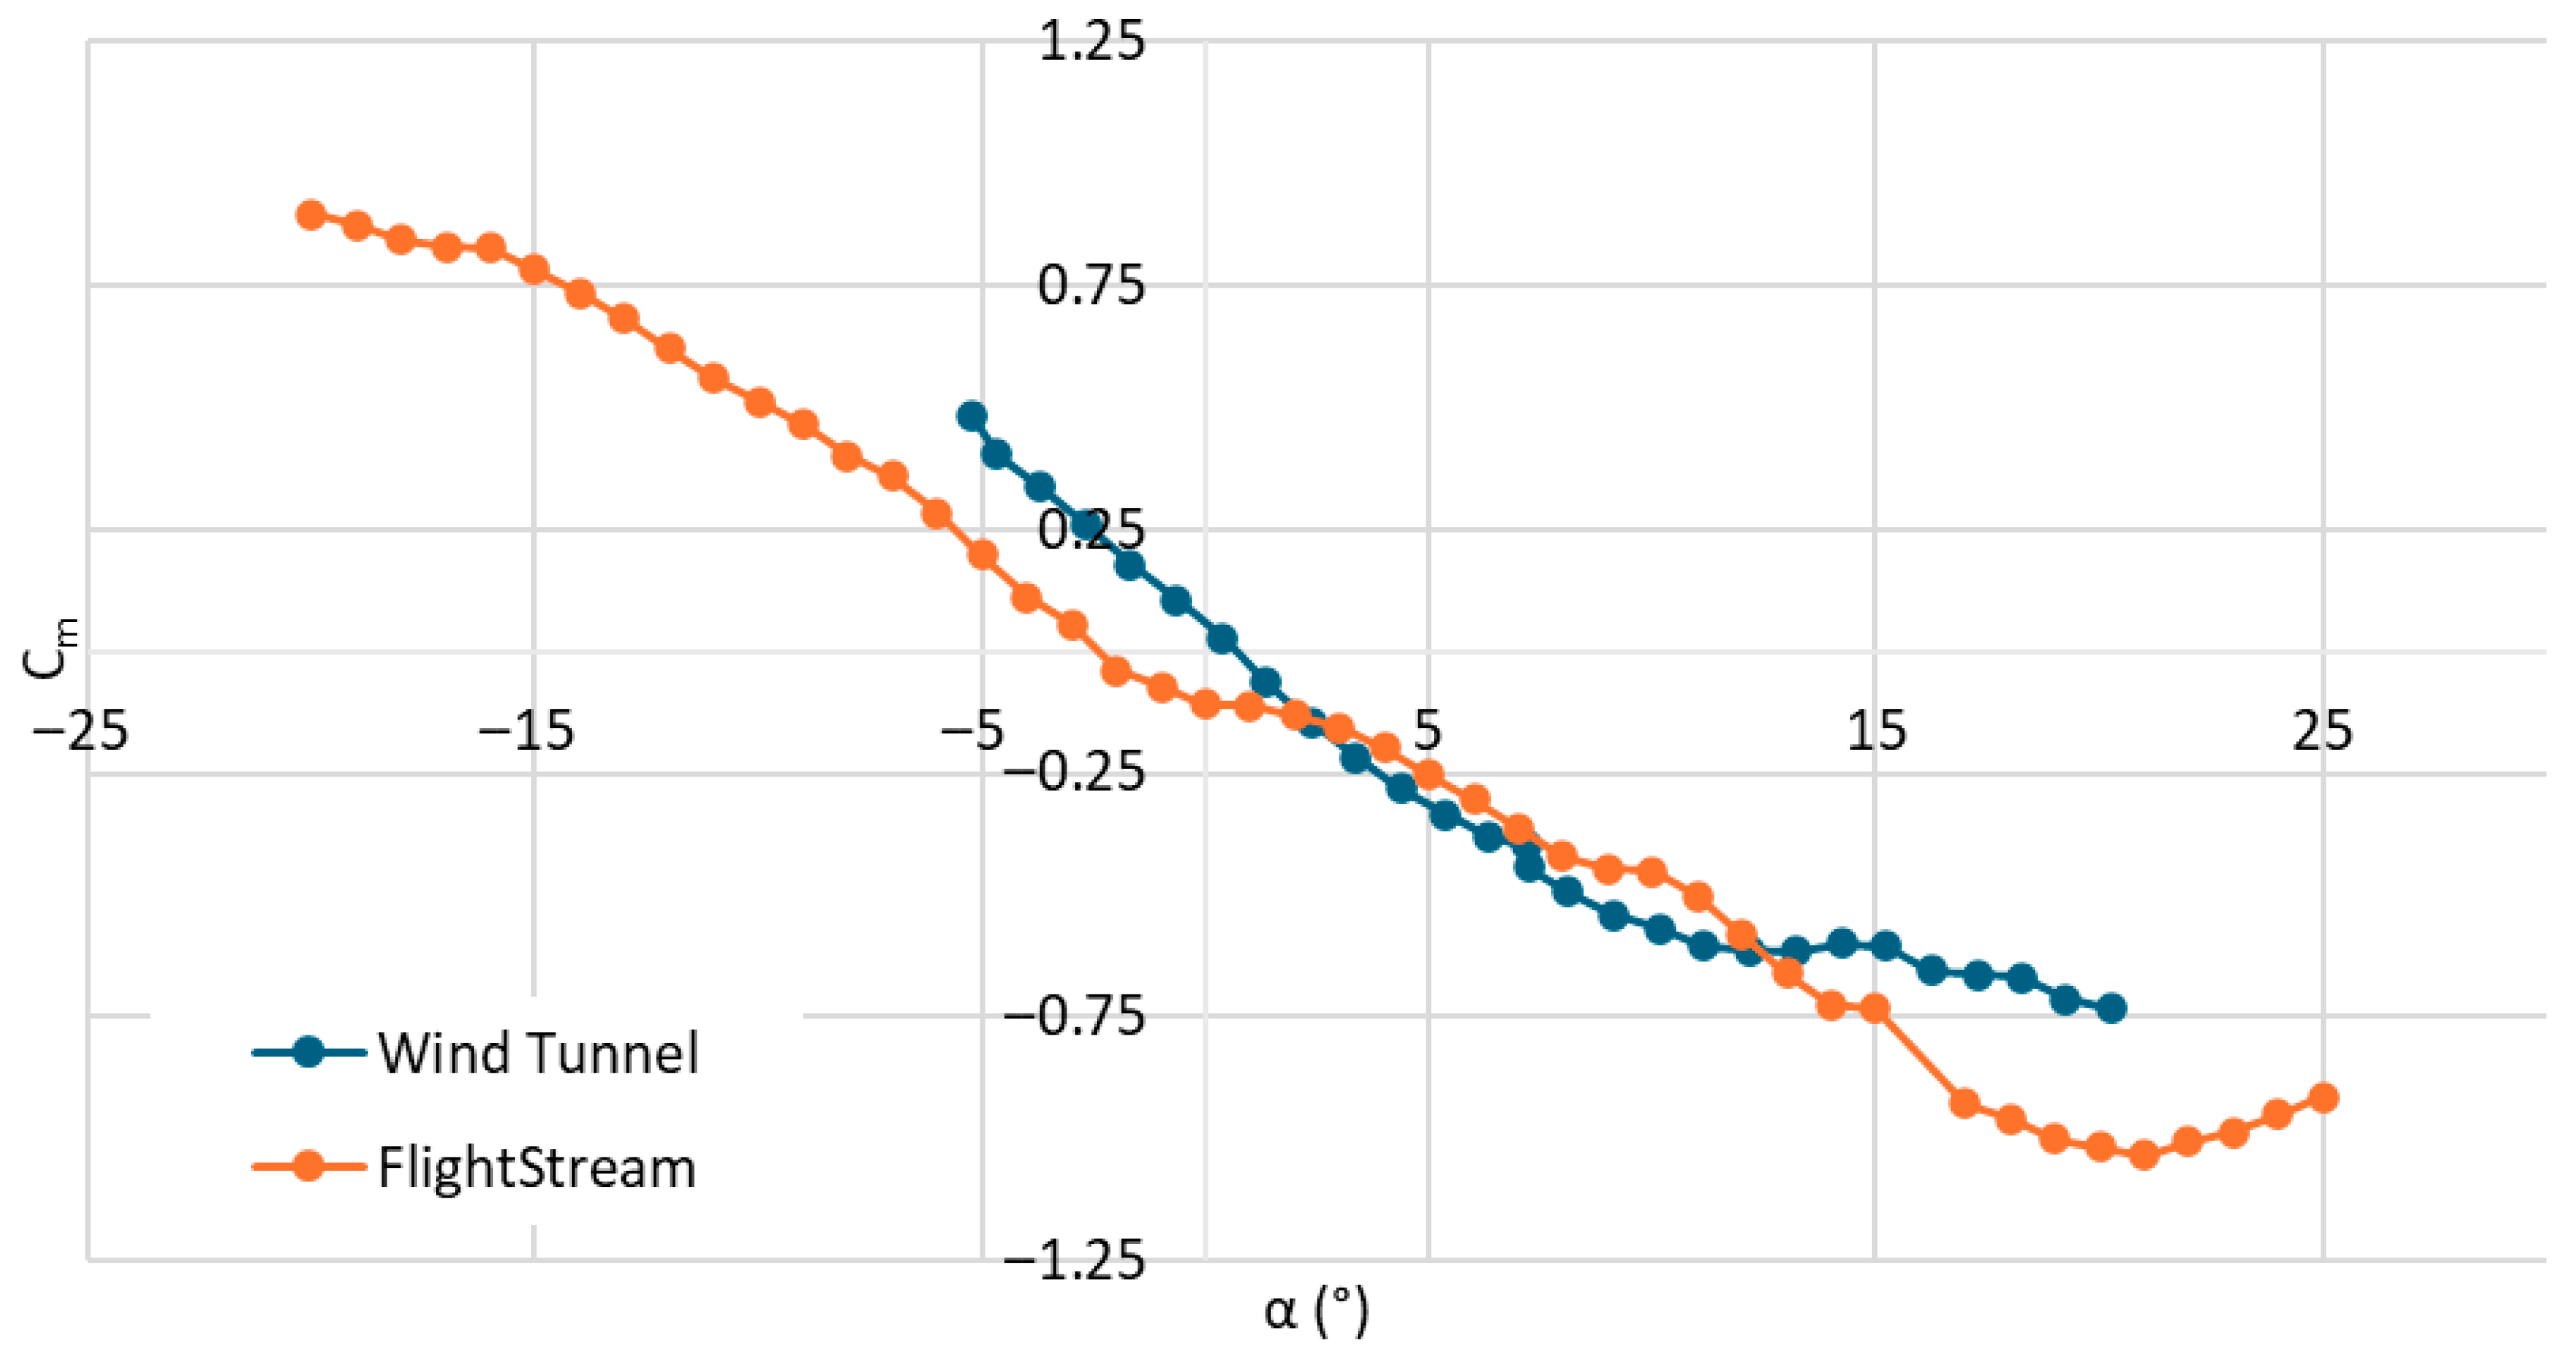
FlightStream simulations suggested that switching from a conventional horizontal stabilizer to a T-tail significantly improved pitch stability. These results were experimentally tested in the wind tunnel. A comparison of experimental and computational results is shown in Figure 26.
As shown in Figure 26, wind tunnel data validates FlightStream analysis and confirms that the modified tail produces a stable pitching moment at angles of attack up to 12°. This represents a significant improvement over the conventional tail.
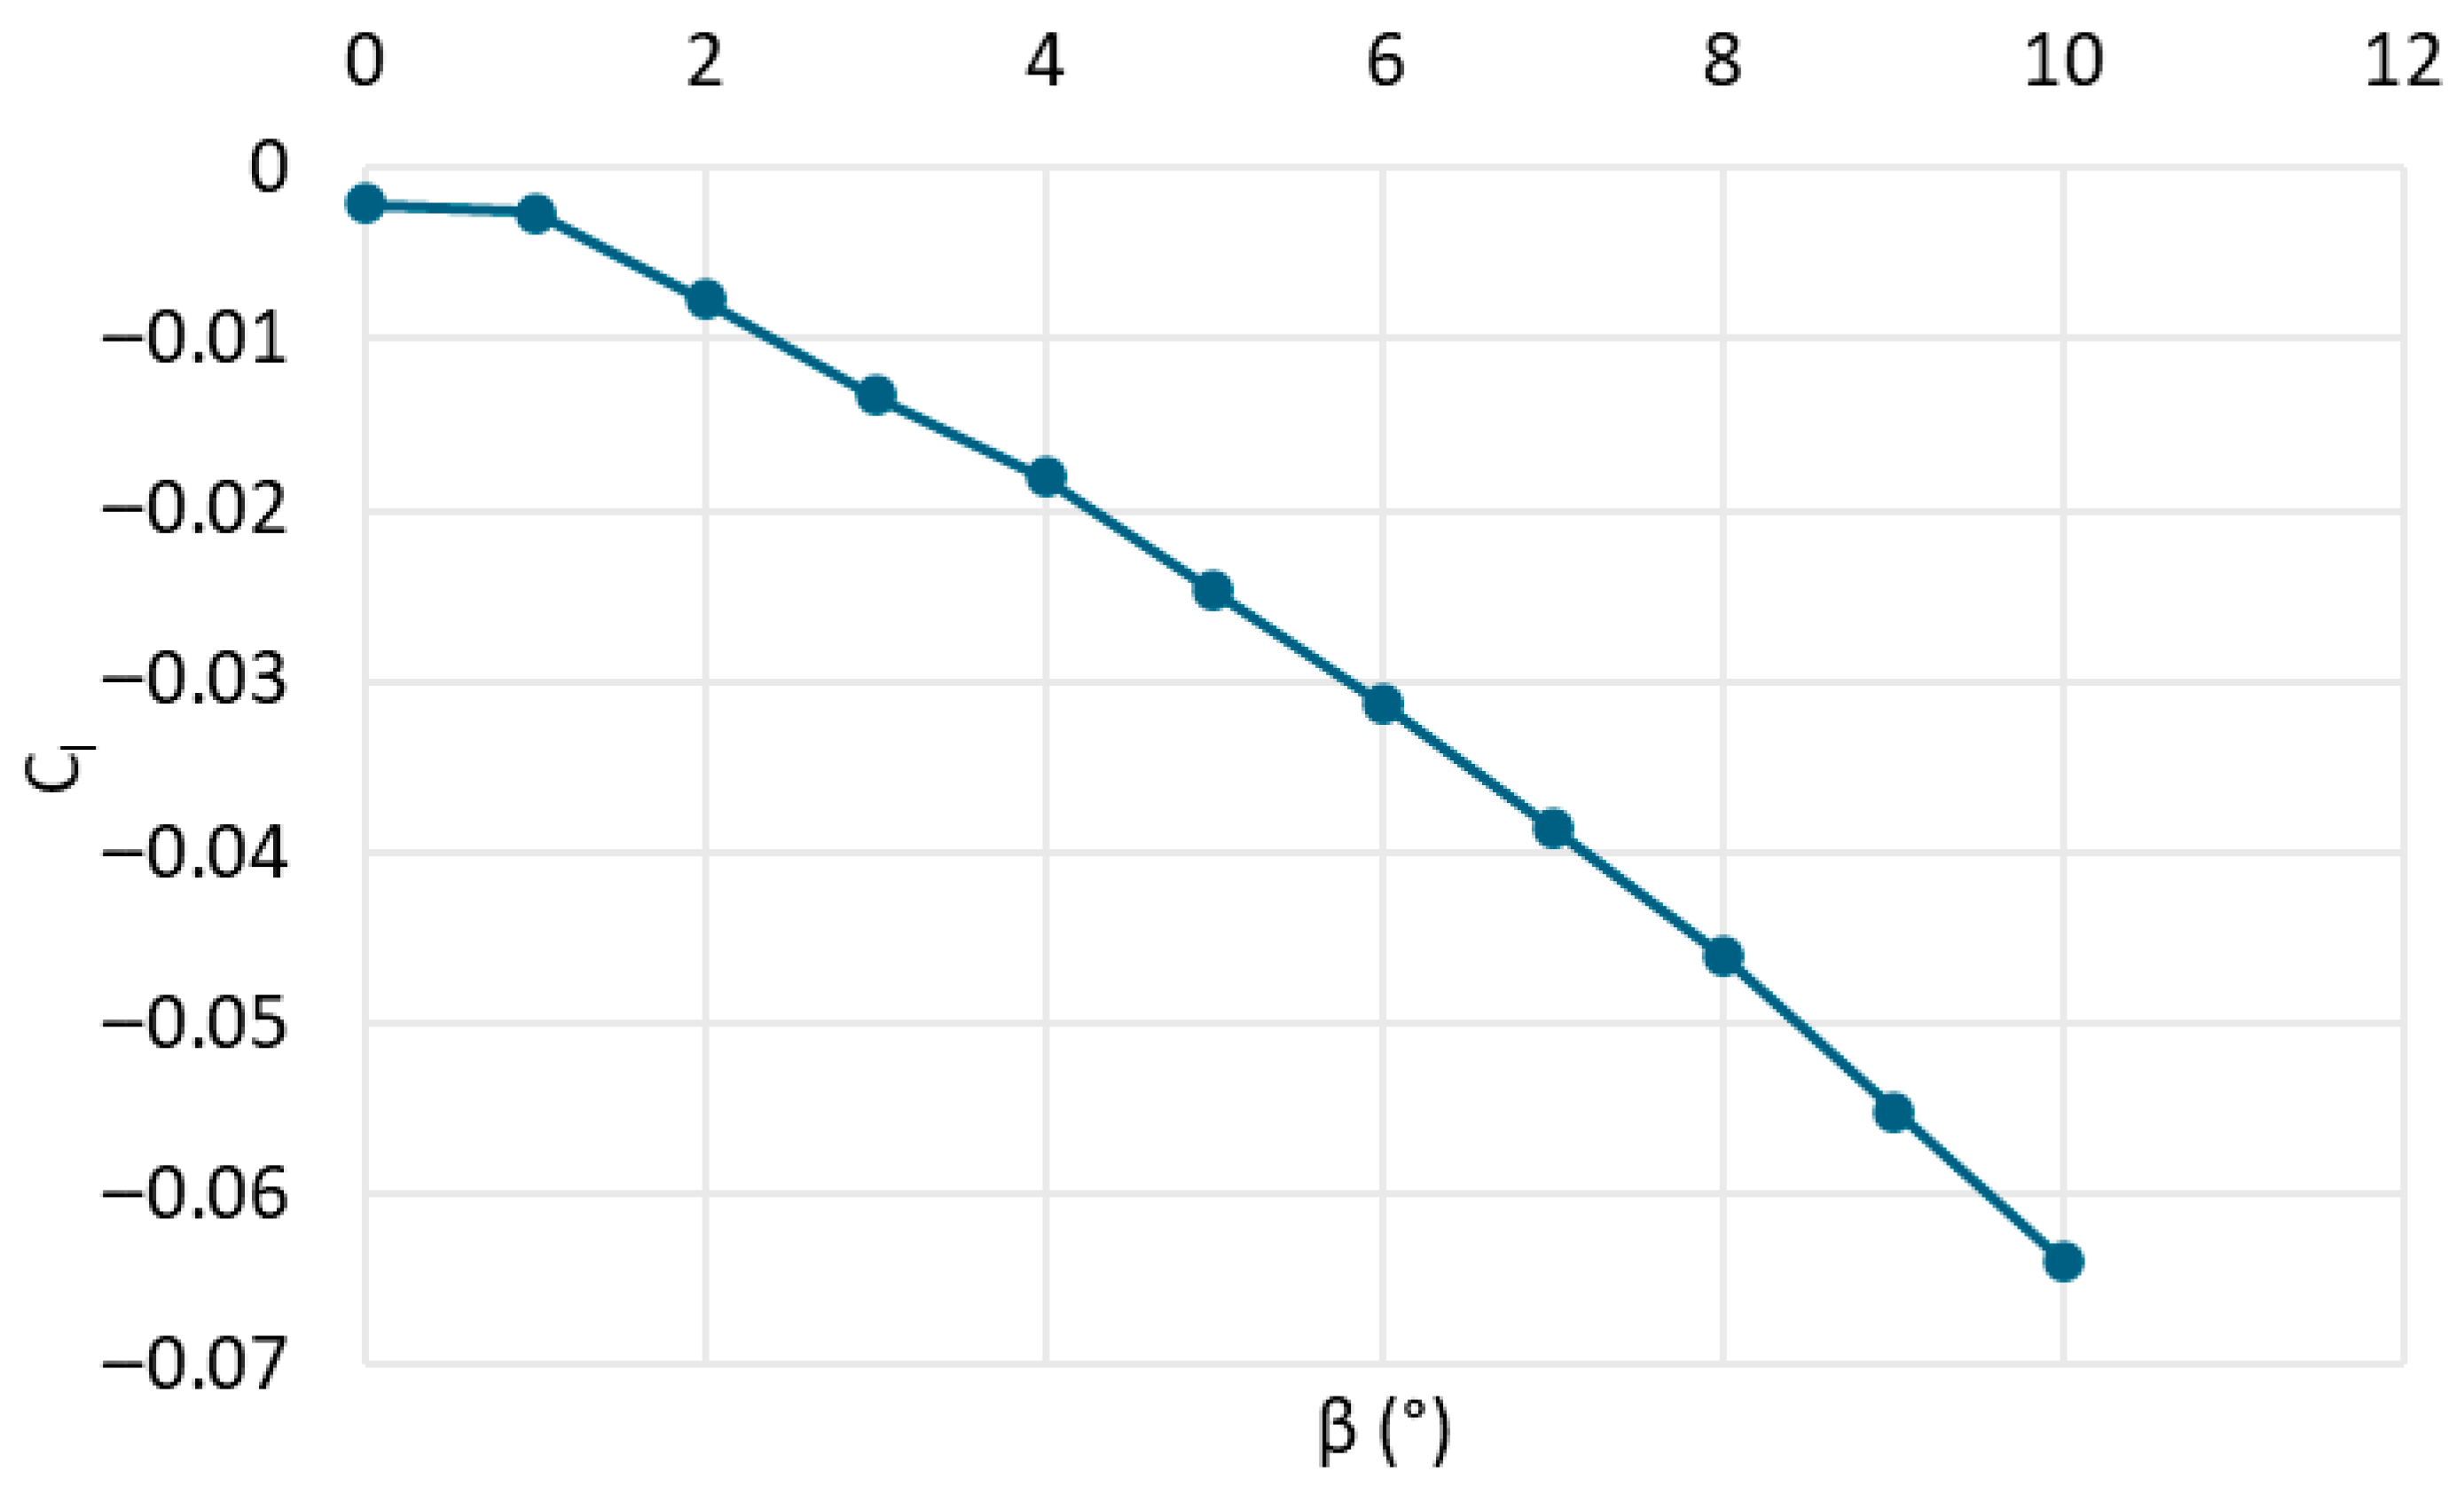
Early analysis of the conventional tail configuration suggested neutral stability in roll. Wind tunnel testing was used to evaluate roll stability of the updated T-tail, as shown in Figure 27.
As illustrated in Figure 27, a secondary benefit of the horizontal tail relocation was increased roll stability. Wind tunnel testing of the T-tail configuration showed a negative roll moment coefficient (Cl) per degree of β, which implies positive roll stability.
Surface flow visualization testing was implemented with 13 mm yarn tufts arranged on a 13 mm grid. Areas of interest included the top surface of the horizontal tail, the aft section of the fuselage, and the wing root gap, as seen in Figure 28.
The surface flow visualization revealed that the vortex at the wing root gap is weak at α = 14° and dissipates before interacting with the tail. Tufts on the aft surface of the fuselage and the upper surface of the horizontal tail remained fully aligned with the local flow and flush to the surface, confirming that flow remained attached in these regions even near stall.

5.3. Aircraft Flight Testing

MEDAID identified that 17 of the 62 requirements and 3 of the 16 medium- and high-priority risks were verifiable only with a flight demonstrator. Building and testing a flight demonstrator also proves the design’s feasibility and manufacturability and allows easy identification of design deficiencies that can be addressed in future design iterations.
MEDAID built and flew a full-scale electric flight demonstrator to conduct four ground tests and four flight tests. The maiden flight, priority one tests, and priority two tests were conducted on the morning of 10 April 2025, at the Sun Valley Flyers RC Field. On the morning of 15 April 2025, MEDAID repeated the priority one tests and completed the priority three tests at the Chino Valley Flyers RC Field. Ground test objectives are outlined in Table 9 and flight test objectives are outlined in Table 10.
The demonstrator successfully completed all ground payload deployment objectives and drop-test objectives in accordance with the verified requirements. The wings successfully folded for a maximum aircraft width of 610 mm, did not prematurely deploy even in a dynamic environment, and deployed in an average 1.2 s once the sear was released. While wing static loading did meet FAA limit load requirements of 3.8 Gs and −1.0 Gs, the wing failed before being loaded to the objective positive limit load of 4.5 Gs as mentioned in Section 4.4. MEDAID repaired the flight test article by inserting an aluminum channel into the existing spar, reapplied a single layer carbon fiber layup around the wing root, and added substantial load-bearing structure to the fuselage, which enabled MEDAID to conduct flight testing. Following repairs and modifications, MEDAID verified the FAA ultimate load requirements of 5.7 Gs and −1.5 Gs, verified the objective limit loads of the repaired wings, bulkheads, and tail, but did not test up to the objective positive ultimate loads as mentioned in Section 4.4 to preserve the FTA for further flight testing.
To meet the objectives listed in Table 10, inflight data was collected using a Spektrum AR20400T onboard receiver and Spektrum Avian 200 A ESC. The receiver utilized an integrated barometer, accelerometer, and GPS module to record barometric pressure, aircraft position, acceleration along six axes, and commanded servo positions. Simultaneously, power draw and motor RPM were logged by the ESC. The data collected from both modules was available to the pilot live and recorded with an SD card in the onboard receiver. In combination with atmospheric conditions recorded prior to each test, the saved data allowed MEDAID to derive further information such as altitude, attitude, ground speed, vertical speed, and G-loading. Using this information, all flight test objectives were completed and associated requirements verified.

6. Conclusions

MEDAID’s XM-24 Orca demonstrates an innovative approach to air-launched UAV design, addressing gaps in current industry capabilities. This section presents the project’s key technical contributions in addressing two critical design challenges: achieving compact airdrop packaging within a 610 mm width constraint using a swing-wing mechanism and integrating payload deployment capabilities. The unique design features include spring-loaded wing deployment systems with sear retention mechanisms, a T-tail configuration for vortex wake mitigation, composite spar integration with piano-style hinges for extreme control surface deflection, and internal payload sequencing systems. These findings provide actionable insights for developing compact and deployable aircraft systems.

6.1. Unique Challenges and Features

MEDAID’s project presented a unique set of challenges and design considerations that were shaped directly by requirements. The distinct features of MEDAID’s product, ranging from swinging wings to a unique fuselage shape, emerged as tailored solutions to meet these demands.
The first set of requirements that influenced the design and presented unique challenges was related to air deployment. Lugs spaced 14.0 in. (356 mm) apart were added to the top of the fuselage to interface with an MA-4 ejector rack, enabling airdrop capabilities. To meet the project’s width requirement, a swing-wing design was implemented, with the wings stored parallel to the body. The wings were spring-loaded and released by a sear retention mechanism. To have a chord length longer than 305 mm, the wings needed full-length control surfaces that could deflect 90° to be stored side by side. This problem was solved by incorporating piano-style hinges rotating about a composite spar to allow for extreme control surface deflections. A challenge introduced by this design was the inboard gap between the wings and fuselage, which generated vortices that interfered with the flow over the tail. This issue was resolved by implementing a T-tail configuration. The last unique design feature associated with wing storage is the bearing assembly, which allows the wings to rotate and joins the wings with the aircraft’s internal structure. Each wing is sandwiched between plain thrust bearings, as shown in Section 4.4. The combination of these design choices resulted in a fuselage with a flat underbelly and an overhang to house the wing roots.
The second requirement that presented unique challenges was the need for the aircraft to carry and deploy two 2.3 kg canisters. Space was reserved between the wings to allow the vertically stacked canisters to fall through. An internal payload deployment system was designed to drop each payload independently. The two canisters were contained between standoff plates and supported vertically by pins, as shown in Section 4.6. Since one canister sits on top of the other, the bottom canister must be dropped first.

6.2. Performance and Risk Assessment

The XM-24 design was driven by key operational requirements, including a maximum weight of 55.0 lbs (24.9 kg) and a maximum storage width of 610 mm. The final commercial configuration met these constraints, weighing 22.59 kg with full fuel and both payloads included, the wings measuring 567 mm in width when stored, and the horizontal tail measuring 610 mm in width. Performance requirements such as the endurance minimum of 4 h, one way range minimum of 370 km, dash speed of 51.4 m/s, and operational altitude greater than 3700 m MSL were also verified. Flight testing showed a maximum speed of 55 m/s, while computational analysis verified endurance, range, and altitude requirements. Of the 62 total requirements, 56 requirements were verified through testing, observation, or analysis.
During the preliminary risk assessment, several catastrophic and hazardous risks were identified that required mitigation. The most critical was the risk of wing deployment failure, which was classified as catastrophic due to the high impact of potential aircraft loss and the high likelihood of occurrence observed during subsystem testing. Redesigning and reinforcing the wing deployment mechanism reduced the likelihood to rare following successful pre-flight tests under simulated conditions. The second most critical risk was payload deployment failure, which would stop the aircraft from completing the mission it was designed for. Initially, deployment failure was almost certain during subsystem testing. A critical redesign focusing on mechanical simplification decreased the likelihood to rare, demonstrated by the successful payload deployments during flight testing. Iterative testing and focused design changes mitigated these high-priority risks.

6.3. Future Work

Over the fall and spring semesters, MEDAID determined that some requirements were unverifiable within the time and resource constraints of a capstone team. MEDAID recommends future researchers verify requirements OP.5.0 through OP.5.4, relating to the deployment of the Orca from a host aircraft. The Orca is not required to be reusable, so the landing gear could be replaced with alternative ground-launch methods. Additionally, the team chose not to verify OP.2.0, having to do with the Orca being ready to deploy in five minutes or less. Instead, MEDAID chose to perform a detailed pre-flight checklist to ensure the Orca’s safety. Finally, requirement SA.3.0 was not met due to the use of a remote pilot rather than an autonomous flight computer.
Future research should focus on addressing the remaining requirements and risks. Requirement OP.2.0 can be met once the pre-flight checklist can be safely shortened to deploy within a five-minute margin. After confirming airworthiness and flight stability, OP.4.0 can be satisfied through deployment from a carrier aircraft and maintaining or improving ground-launch features. Once the Orca is deployed successfully from a host and maintains stable flight, the researchers can conduct testing to meet requirements OP.5.0 through OP.5.4. To fulfill SA.3.0, additional hardware must be integrated into the Orca, along with automated flight software. Although meeting these final requirements may involve significant research and development, the result will be a highly reliable and capable aircraft.

Author Contributions

Conceptualization, S.A.C., C.J.K., E.M.H., C.N.B., I.R.W., J.P.R., D.C.M., J.M.S., M.A.W., J.A.K., N.B. and Z.J.B.; methodology, S.A.C., C.J.K., E.M.H., C.N.B., I.R.W., J.P.R., D.C.M., J.M.S., M.A.W., J.A.K., N.B. and Z.J.B.; software, S.A.C., C.J.K., E.M.H., C.N.B., I.R.W., J.P.R., D.C.M., J.M.S., M.A.W., J.A.K., N.B. and Z.J.B.; validation, S.A.C., C.J.K., E.M.H., I.R.W., J.M.S., M.A.W., J.A.K., N.B. and B.D.R.; formal analysis, S.A.C., C.J.K., E.M.H., C.N.B., I.R.W., J.P.R., D.C.M., J.M.S., M.A.W., J.A.K., N.B. and Z.J.B.; investigation, S.A.C., C.J.K., E.M.H., C.N.B., I.R.W., J.P.R., D.C.M., J.M.S., M.A.W., J.A.K., N.B. and Z.J.B.; resources, C.J.K., J.P.R., M.A.W. and B.D.R.; data curation, S.A.C., E.M.H., I.R.W., D.C.M., J.A.K. and N.B.; writing—original draft preparation, S.A.C., C.J.K., E.M.H., C.N.B., I.R.W., J.P.R., D.C.M., J.M.S., M.A.W., J.A.K., N.B. and Z.J.B.; writing—review and editing, S.A.C., C.J.K., D.C.M. and B.D.R.; visualization, S.A.C. and C.N.B.; supervision, B.D.R.; project administration, S.A.C., J.P.R., M.A.W. and B.D.R.; funding acquisition, B.D.R. All authors have read and agreed to the published version of the manuscript.

Funding

This research was funded in part by Embry-Riddle Aeronautical University.

Data Availability Statement

Data available on request due to ownership restrictions. The data presented in this study are available on request from the corresponding authors. The data are not publicly available due to Embry-Riddle Aeronautical University owning the rights to the data.

Acknowledgments

MEDAID would like to thank the following people for their support for our work: Richard Mangum, Donald Sauder, Thomas Sly, Christopher Bennett, Lance Traub, Elliot Bryner, Patrick David, Kathryn Wesson, Kathy Wood, Wahyu Lestari, Ian Brubaker, Lukus Debevec, Julian Peña, Cooper J. Grossgold, Alex W. Card, Zhaoyu “Jeb” Wang, and Jackson W. Hegarty.

Conflicts of Interest

The authors declare no conflicts of interest.

Nomenclatures and Abbreviations

The following nomenclatures and abbreviations are used in this manuscript:
Nomenclatures
αAngle of attack
βSideslip angle
ΛLeading edge sweep
ARAspect ratio
ARhHorizontal tail aspect ratio
ARvVertical tail aspect ratio
bWingspan
bhHorizontal tail span
bvVertical tail span
CDCoefficient of drag
CDiCoefficient of induced drag
CDminMinimum coefficient of drag
CDpCoefficient of parasitic drag
CLCoefficient of lift
ClRoll moment coefficient
CmPitching moment coefficient
cmacMean aerodynamic chord length
crootChord length at wing root
ctipChord length at wing tip
DDrag force
EEndurance
eOswald’s span efficiency factor
GLoad factor
hnNeutral point moment arm
itTail incidence angle
iwWing incidence angle
LhHorizontal tail moment arm
LmwWing moment arm
LvVertical tail moment arm
PPower
PreqPower required
SPlanform wing area
ShHorizontal tail area
SvVertical tail area
TThrust
tWing taper ratio
tflightFlight time
thHorizontal tail taper ratio
tvVertical tail taper ratio
VSpeed
VbGust maneuver speed
VcCruise speed
VclimbClimb speed
VdDive speed
VeEquivalent air speed
VneMaximum allowable (Never Exceed) speed
VySpeed for maximum climb rate
WMaximum takeoff weight
Abbreviations
3DThree Dimensional
AltFlight altitude
AltmaxMaximum flight altitude
ASAerodynamic and Stability and Control Requirement
BEMBlade Element and Momentum
CADComputer-Aided Design
CFDComputational Fluid Dynamics
CGCenter of Gravity
ConOpsConcept of Operations
EFIElectronic Fuel Ignition
ESCElectronic Speed Controller
FAAFederal Aviation Administration
FOSFactor of Safety
FPFlight Performance Requirement
FTAFlight Test Article
hHours
in.Inches
kgKilograms
kmKilometers
ktsKnots
kWKilowatts
lbsPounds
mMeters
MEDAIDMultiple Environment Deployable Aerial Item Delivery
minMinutes
mmMillimeters
MOSMargin of Safety
m/sMeters per Second
MSLMean Sea Level
NNewtons
N/ANot Applicable
NATONorth Atlantic Treaty Organization
OPOperational Requirement
OpROperational Risk
PLAPolylactic Acid
ReReynolds Number
RPMRevolutions per Minute
sSeconds
SASafety Requirement
SAESociety of Automotive Engineers
SMStatic Margin
STStructures Requirement
TACOMTayouto Cogata Mujinki
TeRTechnological Risk
UAVUnmanned Aerial Vehicle
WWatts

Appendix A

Table A1. Operational requirements.
Requirement Identifier Explicit (E) or Derived (D) Requirement If Derived, Why?
OP.1.0 D The aircraft shall weigh less than 55.0 lbs (24.9 kg),
including the weight of the payload.
FAA rule for small UAV,
14 CFR Part 107
OP.2.0 D The set up and deployment shall be equal to or less than 5 min. Usability: meets standards set by competitors
OP.3.0 D The aircraft shall be operable for reuse after landing on a designated runway. Usability for testing as a Capstone project
OP.4.0 E The aircraft shall be deployable from the ground or air deployable from standard 14.0 in. (356 mm) lugs when mounted to host aircraft.
OP.5.0 E The aircraft shall be deployable from host aircraft at an altitude of 1525 m and an airspeed of 41 m/s.
OP.5.1 D Deployment from host aircraft shall occur at an altitude ≥305 m AGL. Altitude required to regain steady flight after air deployment
OP.5.2 D Deployment from host aircraft shall occur in flight
conditions with crosswind gusts less than 7.7 m/s.
Derived from NATO Standard AEP-83
OP.5.3 D Deployment from host aircraft shall occur in flight
conditions within a β range of −5° to 5°.
Safe range for control while wings deploy
OP.5.4 D Deployment from host aircraft shall only occur overground where a crash of the aircraft would not cause damage to civilian or military operations. Mitigates risks associated with crashes during air
deployment
OP.6.0 E The aircraft shall be able to carry and deploy two 2.3 kg canisters.
OP.6.1 E The aircraft shall be able to deploy one canister at a time.
OP.6.2 D The aircraft shall be able to deploy both canisters within 8 s. Competitive advantage
OP.6.3 E The payload shall be deployable at all operational flight speeds.
OP.6.4 D The payload shall be deployable at a pitch angle of ±5°. Necessary for mission
accomplishment
OP.6.5 D The payload shall be deployable at a roll angle of ±5°. Necessary for mission
accomplishment
OP.6.6 D The payload shall be deployable at a yaw angle of ±5°. Necessary for mission
accomplishment
OP.6.7 E The payload shall land within a 6.1 m radius of the
intended drop point.
OP.6.8 D The payload deployment system shall have a 95%
success rate after the deployment command.
Competitive advantage
OP.7.0 E The unit cost at the 100th unit shall cost less than or equal to USD 50,000.
OP.7.1 E The total project expenditure shall cost less than or equal to USD 7000.
OP.8.0 E The aircraft shall have a maximum width of 610 mm when measured from rightmost edge to leftmost edge when in the stored configuration.
OP.8.1 D The aircraft shall fully deploy the wings within 2
seconds.
Necessary for mission accomplishment
OP.8.2 D The wing deployment mechanism shall be locked while attached to the host aircraft. Mitigates risk of wings
deploying while attached to host aircraft
Table A2. Safety requirements.
Requirement Identifier Explicit (E) or Derived (D) Requirement If Derived, Why?
SA.1.0 D Airworthiness shall be determined by the condition for safe operation as determined in 14 CFR 107.15. Governing regulations for a small UAV
SA.1.1 D Routine maintenance shall be limited to inspections of airworthiness as determined by Safety Requirement 1.0 (SA.1.0). Low impact on daily
operations
SA.1.2 D The aircraft shall be disassembled for inspection and maintenance of all moving parts. Maintainability, from
usability requirement
SA.2.0 D The flight demonstrator test pilot shall follow safety guidelines listed in AMA document #706 and all subsequent documents referenced in AMA document #706. Governing regulations for flying at AMA fields
SA.3.0 D The aircraft shall immediately perform a power-off
landing if thrust is lost.
Safe operation based of risk identification
SA.3.1 D There shall be a preprogrammed landing sequence if control is lost for the flight demonstrator. Ensures aircraft will return to ground if control is lost
SA.4.0 D There shall be at least three signal receivers in different locations across the aircraft. Ensures backups for control of aircraft while in flight
Table A3. Aerodynamic and stability and control requirements.
Requirement Identifier Explicit (E) or Derived (D) Requirement If Derived, Why?
AS.1.0 D The aircraft shall have full control of roll, pitch, and yaw. Required for full
controllability
AS.2.0 D The aircraft shall have a positive static margin regardless of payload configuration. Required for aircraft
stability
AS.3.0 D The aircraft shall be statically stable as defined by the nine static stability criteria for low-speed aircraft. Required for aircraft
stability
AS.3.1 D The aircraft shall tend to return to its initial trimmed air speed after a small disturbance as characterized by the equation:
  c T X u c D u < 0
SSC #1:
Speed stability
AS.3.2 D The aircraft shall tend to return to its initial trimmed sideslip value after a small disturbance as characterized by the equation:
  c Y β < 0
SSC #2:
Lateral force due to sideslip
AS.3.3 D The aircraft shall tend to return to its initial flight path after a small disturbance as characterized by the
equation:
  c L α > 0
SSC #3:
Lift force due to angle of
attack
AS.3.4 D The aircraft shall tend to return to its initial angle of
attack after a small disturbance as characterized by the equation:
  c m α < 0
SSC #4:
Pitch stability
AS.3.5 D The aircraft shall tend to yaw to face into relative wind to maintain directional equilibrium as characterized by the equation:
  c n β > 0
SSC #5:
Yaw stability
AS.3.6 D The aircraft shall tend to return to its initial roll condition after a small disturbance as characterized by the equation:
  c l p < 0
SSC #6:
Roll dampening
AS.3.7 D The aircraft shall have a positive static margin as
characterized by the equation:
  c m q < 0
SSC #7:
Pitch dampening
AS.3.8 D The aircraft shall tend to return to its initial yaw
condition after a small disturbance as characterized by the equation:
  c n r < 0
SSC #8:
Yaw dampening
AS.3.9 D The aircraft shall tend to offset sideslip by rolling to
decrease the sideslip angle as characterized by the equation:
  c l β < 0
SSC #9:
Roll stability
Table A4. Flight performance requirements.
Requirement Identifier Explicit (E) or Derived (D) Requirement If Derived, Why?
FP.1.0 E The aircraft shall have a dash speed ≥51.4 m/s.
FP.2.0 E The aircraft shall operate at an altitude ≥3658 ft.
FP.3.0 E The aircraft shall have an endurance ≥ 4 h in optimal flight conditions with no wind.
FP.4.0 E The aircraft shall have a one-way range ≥370 km in
optimal flight conditions with no wind.
FP.5.0 D The maximum operating speed shall be less than 90% of the max design speed. FOS; Vne
FP.6.0 D The ISA sea level rate of climb for Vy shall be ≥1.5 m/s with no more than takeoff power. NATO Standard AEP-83
FP.6.1 D The minimum Vy shall be measured when the aircraft is at MTOW, with the aircraft in takeoff configuration. NATO Standard AEP-83
FP.7.0 D The aircraft shall operate in conditions with up to 7.7 m/s updraft and downdraft gusts. NATO Standard AEP-83
FP.8.0 D The aircraft shall operate in conditions with up to 7.7 m/s crosswind gusts. NATO Standard AEP-83
FP.9.0 E The aircraft shall operate in temperature conditions from 0 °C to 46 °C.
Table A5. Structures requirements.
Requirement Identifier Explicit (E) or Derived (D) Requirement If Derived, Why?
ST.1.0 D A symmetric limit maneuvering load factor ≥3.8 should be established. NATO Standard AEP-83
ST.2.0 D A symmetric negative limit maneuvering load factor
≤−1.5 shall be established.
NATO Standard AEP-83
ST.3.0 D An ultimate load FOS ≥1.5 shall be used for all critical structures. NATO Standard AEP-83
ST.3.1 D In the case of castings, a FOS of ≥2.0 shall be used. NATO Standard AEP-83
ST.3.2 D In the case of fittings, a FOS of ≥1.15 shall be used. NATO Standard AEP-83
ST.3.3 D In the case of bearings at bolted or pinned joints subject to rotation, a FOS of ≥2.0 shall be used. NATO Standard AEP-83
ST.3.4 D In the case of control surface hinge-bearing loads except ball and roller bearing hinges, a FOS of ≥4.45 shall be used. NATO Standard AEP-83
ST.3.5 D In the case of push-pull control system joints, a FOS of
≥2.2 shall be used.
NATO Standard AEP-83
ST.3.6 D In the case of attachments in frequently assembled and disassembled structural parts, a FOS of ≥ 1.5 shall be used. NATO Standard AEP-83
ST.3.7 D In the case of wing stow retention critical structures,
a FOS ≥2.5 shall be used.
Mitigation for wing
deployment risk

Appendix B

Table A6. Failure condition severity classification examples [16].
Effect on AircraftEffect on Ground CrewEffect on External PersonnelClassification
Loss of aircraftCrew unable to accomplish required tasks, or
required crew strength or skill in excess of crew capability, or crew incapacitation, or
crew fatalities
Any fatalitiesCatastrophic
Large reduction in aircraft functional
capability
Excessive crew workload increase, crew unable to fully accomplish required tasks, or
crew physical distress
Severe injuriesHazardous
Significantly reduced aircraft functional
capability
Significant crew workload increase, or
conditions impairing crew efficiency, or
crew physical discomfort
Physical distress or non-fatal injuriesMajor
Slightly reduced
aircraft functional
capability
Slight crew workload increasePhysical discomfortMinor
No effect on aircraft function capabilityNo effect on crew workloadNo effectInsignificant
Figure A1. Sample risk matrix—likelihood plotted versus impact.
Aerospace 12 00977 g0a1
Figure A2. Operational risk matrix after flight testing.
Aerospace 12 00977 g0a2
Figure A3. Technological risk matrix after flight testing.
Aerospace 12 00977 g0a3
Table A7. Operational risks.
IdentifierRiskLikelihoodEffect
OpR.1Vibration from engine causing signal loss—wires disconnecting15
OpR.2Loss of control when air deployed in conditions with high sideslip15
OpR.3Not enough altitude to attain steady flight after air deployment15
OpR.4Vertical tail may not fit under some host aircraft due to height11
OpR.5Propeller breaking during flight due to strike15
OpR.6Fuselage/Boom tail connection breaking during operation due to high loads 15
OpR.7Wing pin connector failing during flight15
OpR.8Vibration from engine causing signal interference—frequencies11
OpR.9Propeller breaking during landing11
OpR.10Flutter of wings during stored configuration22
OpR.11Aircraft striking debris during take-off12
OpR.12Flutter of tail boom during flight22
OpR.13CG Changing after Payload Deployment51
OpR.14Inability to reuse aircraft after landing on a non-designated runway surface11
Table A8. Technological risks.
IdentifierRiskLikelihoodEffect
TeR.1Insufficient engine venting may cause heat damage to subsystems inside
fuselage
15
TeR.2Wing deployment mechanism failing to deploy the wings14
TeR.3Wing deployment/locking mechanism failing while mounted to host aircraft wings potentially deploying while still mounted to host aircraft15
TeR.4Engine failing midair—unrestartable22
TeR.5Engine failing midair—restartable22
TeR.6High engine temperature melting composite15
TeR.7Exhaust fumes melting/causing failure of composite15
TeR.8Payload doors not fully extending due to wing placement12
TeR.9Insufficient lift points for mounting/attachment to host aircraft13
TeR.10Payload doors become stuck “open”12
TeR.11Second payload does not assume correct position after deployment of the first11
TeR.12Either payload fail to deploy14
TeR.13Wings being overly difficult to restow after deployment—takes more than crew would be able to handle14

References

  1. Bomb, Guided, Fritz X (X-1). Available online: https://bit.ly/47fmHYH (accessed on 4 October 2025).
  2. Hs 293 A-1 Missile. Available online: https://bit.ly/4qgOfFN (accessed on 4 October 2025).
  3. Federation of American Scientists. D-21 Strategic Reconnaissance Drone. Available online: https://bit.ly/3J14Yfz (accessed on 4 October 2025).
  4. Doi, H. TACOM-Air-Launched Multi-Role UAV. In Proceedings of the 24th Congress of International Council of the Aeronautical Sciences, Yokohama, Japan, 29 August–3 September 2004; Volume 24. Available online: https://bit.ly/431C4CA (accessed on 4 October 2025).
  5. U.S. Army Unmanned Aircraft Systems Roadmap 2010–2035. Available online: https://bit.ly/4pPanqt (accessed on 4 October 2025).
  6. Parsch, A. Raytheon Coyote. Available online: https://bit.ly/46TZdbs (accessed on 4 October 2025).
  7. Wang, G.; Xu, G.; Wang, Y.; Yao, Y.; Wang, K.; Hu, X.; Sun, H.; Liu, J. Deployment Modes and Aerodynamic Analysis of UAV Orthogonal Biaxial Folding Wing. Aerospace 2023, 10, 26. [Google Scholar] [CrossRef]
  8. AeroVironment. Switchblade 300 Block 20 Loitering Munition. Available online: https://bit.ly/3WbNyji (accessed on 17 October 2025).
  9. Finigan, M.; Kavounas, P.A.; Ho, I.; Smith, C.C.; Witusik, A.; Hopwood, A.; Avent, C.; Ragasa, B.; Roth, B. Design and Flight Test of a Tube-Launched Unmanned Aerial Vehicle. Aerospace 2024, 11, 133. [Google Scholar] [CrossRef]
  10. Zipline. Zipline Fact Sheet: Zipline Instant Delivery. Available online: https://bit.ly/3ISbLrP (accessed on 4 October 2025).
  11. INSITU. ScanEagle. Available online: https://bit.ly/3VLFQMC (accessed on 4 October 2025).
  12. Northrop Grumman. Bat UAS. Available online: https://bit.ly/42oVOQz (accessed on 4 October 2025).
  13. General Atomics. Sparrowhawk. Available online: https://bit.ly/4o5pwT4 (accessed on 4 October 2025).
  14. Lockheed Martin Corporation. Stalker VXE30 Product Card. Available online: https://bit.ly/4qcDvsb (accessed on 4 October 2025).
  15. 14 C.F.R. § 107 A; Small Unmanned Aircraft Systems. National Archives and Records Administration: College Park, MD, USA, 2024. Available online: https://www.ecfr.gov/ (accessed on 4 October 2025).
  16. ARP4761A; Guidelines for Conducting the Safety Assessment Process on Civil Aircraft, Systems, and Equipment. SAE International: Warrendale, PA, USA, 2023. Available online: https://doi.org/10.4271/ARP4761A (accessed on 4 October 2025).
  17. XFLR5, version 6.41; Software for Airfoil CFD; XLFR5 2020; Available online: https://www.xflr5.tech/ (accessed on 4 October 2025).
  18. Gudmundsson, S. General Aviation Aircraft Design Applied Methods and Procedures, 1st ed.; Butterworth-Heineman: Oxford, UK, 2014. [Google Scholar] [CrossRef]
  19. Hoerner, S. Fluid-Dynamic Drag, 2nd ed.; Sighard, F., Ed.; Hoerner: Bakersfield, CA, USA, 1965; Available online: https://n2t.net/ark:/13960/t57f0bk2j (accessed on 4 October 2025).
  20. Drela, M. V-Tail to a Standard Tail, March 2003. Available online: https://bit.ly/3IS7xAt (accessed on 4 October 2025).
  21. Drela, M. Sharon 3.7 V-Tail Tail Volume Coefficient and Rudder Power, October 2006. Available online: https://bit.ly/47aI7Y4 (accessed on 4 October 2025).
  22. FlightStream, version 2025.0; Software for Aircraft CFD; Altair: Troy, MI, USA, 2025; Available online: https://altair.com/ (accessed on 4 October 2025).
  23. Müller, M. eCalc Reliable Electric Drive Simulations. Available online: https://ecalc.ch/ (accessed on 4 October 2025).
  24. 14 C.F.R. § 23 C; Airworthiness Standards: Normal Category Airplanes. National Archives and Records Administration: College Park, MD, USA, 2017. Available online: https://www.ecfr.gov/ (accessed on 4 October 2025).
  25. 14 C.F.R. § 25 C; Airworthiness Standards: Transport Category Airplanes. National Archives and Records Administration: College Park, MD, USA, 2024. Available online: https://www.ecfr.gov/ (accessed on 4 October 2025).
  26. Catia V5, version V5-6R2020; CATIA V5; Dassault Systemes: Vélizy-Villacoublay, France, 2024; Available online: https://www.3ds.com/ (accessed on 18 October 2025).
  27. Ansys Workbench, version 2024 R2; Ansys Workbench; Ansys: Canonsburg, PA, USA, 2024; Available online: https://www.ansys.com/ (accessed on 18 October 2025).
  28. AEP-83; Light Unmanned Aircraft Systems Airworthiness Requirements. North Atlantic Treaty Organization: Brussels, Belgium, 2014. Available online: https://bit.ly/4pW7B2N (accessed on 4 October 2025).
  29. MIL-STD-8591; Airborne Stores, Suspension Equipment, and Aircraft-Store Interface (Carriage Phase); Change 1. U.S. Department of Defense: Washington, DC, USA, 2017. Available online: https://bit.ly/4o9thqK (accessed on 27 October 2025).
  30. Traub, L.W. Scale effects in wind tunnel testing: Extrapolation of the drag coefficient. J. Aircr. 2024, 61, 1482–1489. Available online: https://www.researchgate.net/publication/380932395 (accessed on 4 October 2025). [CrossRef]
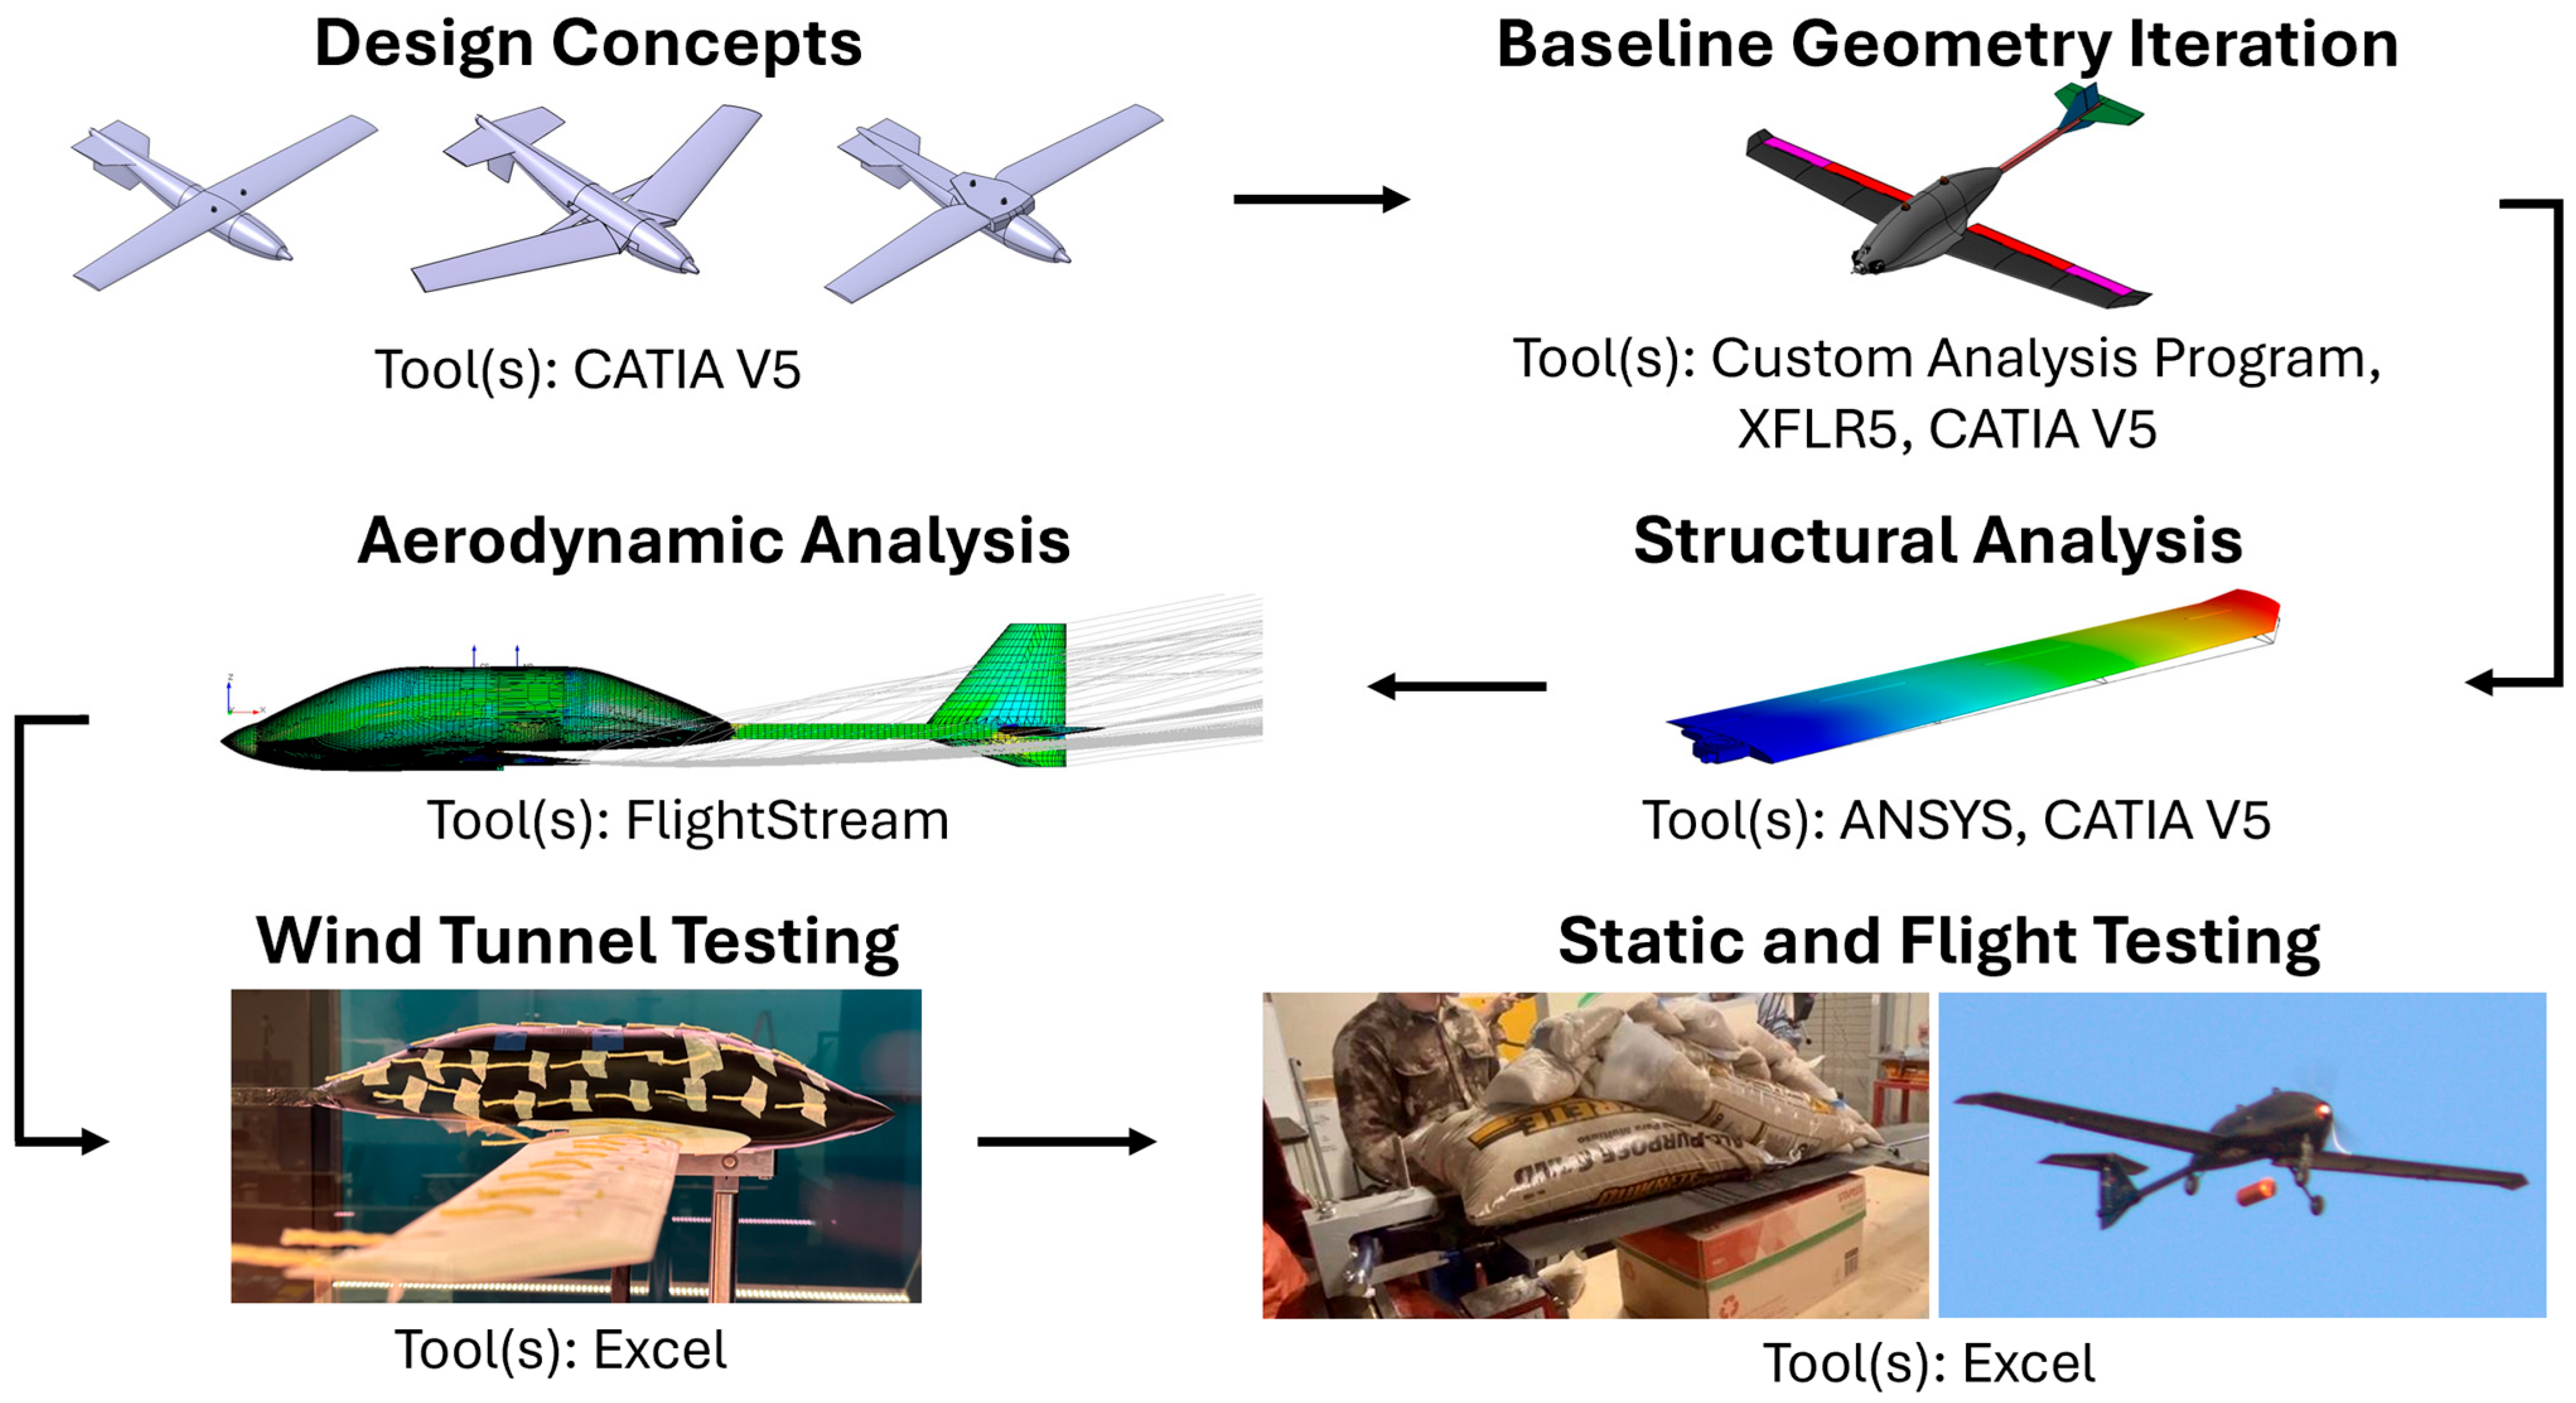
Figure 1. Detail design process flowchart.
Aerospace 12 00977 g001
Figure 2. XM-24 Orca ConOps.
Aerospace 12 00977 g002
Figure 3. Mission performance diagram.
Aerospace 12 00977 g003
Figure 4. The general dimensions of the final design in millimeters.
Aerospace 12 00977 g004
Figure 5. Predicted CL versus CD of the whole aircraft.
Aerospace 12 00977 g005
Figure 6. FlightStream flow visualization.
Aerospace 12 00977 g006
Figure 7. eCalc trend example displaying maximum speed plotted versus propeller diameter.
Aerospace 12 00977 g007
Figure 8. Thrust versus power.
Aerospace 12 00977 g008
Figure 9. Power versus propeller RPM.
Aerospace 12 00977 g009
Figure 10. CG excursion diagram.
Aerospace 12 00977 g010
Figure 11. V-n loading diagram.
Aerospace 12 00977 g011
Figure 12. Wing critical structural elements.
Aerospace 12 00977 g012
Figure 13. Program design tool flowchart.
Aerospace 12 00977 g013
Figure 14. Carpet plot of power-to-weight ratio versus wing loading.
Aerospace 12 00977 g014
Figure 15. Plot of range and endurance versus velocity.
Aerospace 12 00977 g015
Figure 16. Internal structural layout.
Aerospace 12 00977 g016
Figure 17. Lug and mount (A), avionics tray (B), and fuel tank (C).
Aerospace 12 00977 g017
Figure 18. Payload deployment system.
Aerospace 12 00977 g018
Figure 19. Stowed aircraft, aft looking forward.
Aerospace 12 00977 g019
Figure 20. Top view of stowed aircraft, and rear view of aileron deconfliction.
Aerospace 12 00977 g020
Figure 21. Port side fuselage mold.
Aerospace 12 00977 g021
Figure 22. Half fuselage with internals placed.
Aerospace 12 00977 g022
Figure 23. Access hatches in fuselage and payload deployment cutout.
Aerospace 12 00977 g023
Figure 24. Flight ready flight test article.
Aerospace 12 00977 g024
Figure 25. Pitching moment coefficient for conventional and T-tail configurations.
Aerospace 12 00977 g025
Figure 26. Pitching moment versus angle of attack.
Aerospace 12 00977 g026
Figure 27. Roll moment versus sideslip angle.
Aerospace 12 00977 g027
Figure 28. Surface flow visualization.
Aerospace 12 00977 g028
Table 1. Parameters and geometry of the wing.
Wing ParametersWing Geometry
Reference Area (S)0.92 m2
Aspect Ratio (AR)13
Wingspan (b)3.46 m
Root Chord Length (croot)0.37 m
Mean Aerodynamic Chord Length (cmac)0.27 m
Tip Chord Length (ctip)0.15 m
Leading Edge Sweep (Ʌ)2.50° (50.00° tip)
Incidence Angle (iw)0.00°
Twist0.00°
Oswald’s Span Efficiency Factor (e)0.88
Table 2. Drag estimation.
ComponentCDi (Induced)CDp (Parasite)CD (Interference)CD (Total)
Main Wing0.01460.00940.00390.0279
Vertical TailN/A0.0004N/A0.0004
Horizontal Tail0.00010.00060.00000.0007
FuselageN/A0.0138N/A0.0138
MiscellaneousN/A0.0001N/A0.0001
Total Drag0.01470.02430.00390.0429
Table 3. Tail sizing.
Tail SurfaceSurface Area (m2)Taper Ratio
Horizontal Stabilizer0.1370.550
Vertical Stabilizer0.0740.400
Ventral Fin0.0210.346
Table 4. Control surface sizing.
SurfaceDesign Percentage of Host Surface Area (%)Manufactured Percentage of Host Surface Area (%)Acceptable Range of Host
Surface Area (%)
Elevator 30.031.021.5–38.0
Rudder35.021.920.0–60.0
Aileron11.910.76.0–15.0
Table 5. Mass estimation tests.
NameMeasured (kg)Calculated (kg)Error (%)
Launch UAV [9]1.01.04.0
Zipline P1 [10]8.48.40.7
ScanEagle [11]26.328.27.2
Bat [12]95.395.90.7
Sparrowhawk [13]226.8227.50.3
Table 6. Aircraft component masses.
Component GroupCommercial Article (kg)Flight Test Article (kg)
Fuselage Structure3.081.86
Wings4.725.49
Tail1.181.50
Propulsion System6.355.44
Payload Deployment4.815.03
Avionics2.452.86
Landing Gear0.001.22
Total22.5923.40
Table 7. Performance validation tests.
NamePublished
Endurance (h)
Calculated
Endurance (h)
Error (%)Published Range (km)Calculated Range (km)Error (%)
Stalker [14]44.184.44334769.4
ScanEagle [11]1818.271.59208567.3
Bat [12]87.921.0---
Table 8. Comparison of drag at cruise.
Prediction MethodTotal CD
Aircraft Sizing Code0.0429
Wind Tunnel0.0384
FlightStream0.0309
Table 9. Ground tests.
Ground TestObjectiveRequirements Verified
Payload
Deployment
Demonstrate Aircraft can Consistently Deploy both
Canisters at any Operational Pitch and Roll Angle
OP.6.0–OP.6.6,
OP.6.8
Wing
Deployment
Demonstrate Aircraft can Deploy Wings Autonomously under Simulated Operational Aerodynamic LoadingOP.8.0–OP.8.2
DropDemonstrate Aircraft and Landing Gear Integrity with Respect to Loads Encountered During LandingSA.1.0
Wing Static LoadingDemonstrate Wing and Fuselage Integrity with Respect to Loads Encountered During FlightST.1.0–ST.3.0
Table 10. Flight tests.
Flight TestObjectiveRequirements Verified
Maiden FlightDemonstrate Basic Aircraft Ability: Pitching, Banking,
Yawing, Climbing, Descending. Verify No Failure After Flight.
OP.2.0, OP.4.0, OP.5.0, AS.1.0
Priority 1 TestDemonstrate Aircraft Dynamic Stability with 5 Stability Tests. Verify No Failure After Flight.FP.6.0, AS.5.0–5.9, ST.1.0, ST.2.0
Priority 2 TestDemonstrate Aircraft Maximum Speed.
Verify No Failure After Flight.
OP.6.0, FP.1.0, FP.5.0
Priority 3 TestDemonstrate Airborne Payload Deployment Capability.OP.6.4, OP.7.3, OP.7.7, OP.7.8
Disclaimer/Publisher’s Note: The statements, opinions and data contained in all publications are solely those of the individual author(s) and contributor(s) and not of MDPI and/or the editor(s). MDPI and/or the editor(s) disclaim responsibility for any injury to people or property resulting from any ideas, methods, instructions or products referred to in the content.