New Patterns of Temporal and Spatial Variation in Water Quality of a Highly Artificialized Urban River-Course—a Case Study in the Tongzhou Section of the Beiyun River

Abstract
1. Introduction
2. Materials and Methods
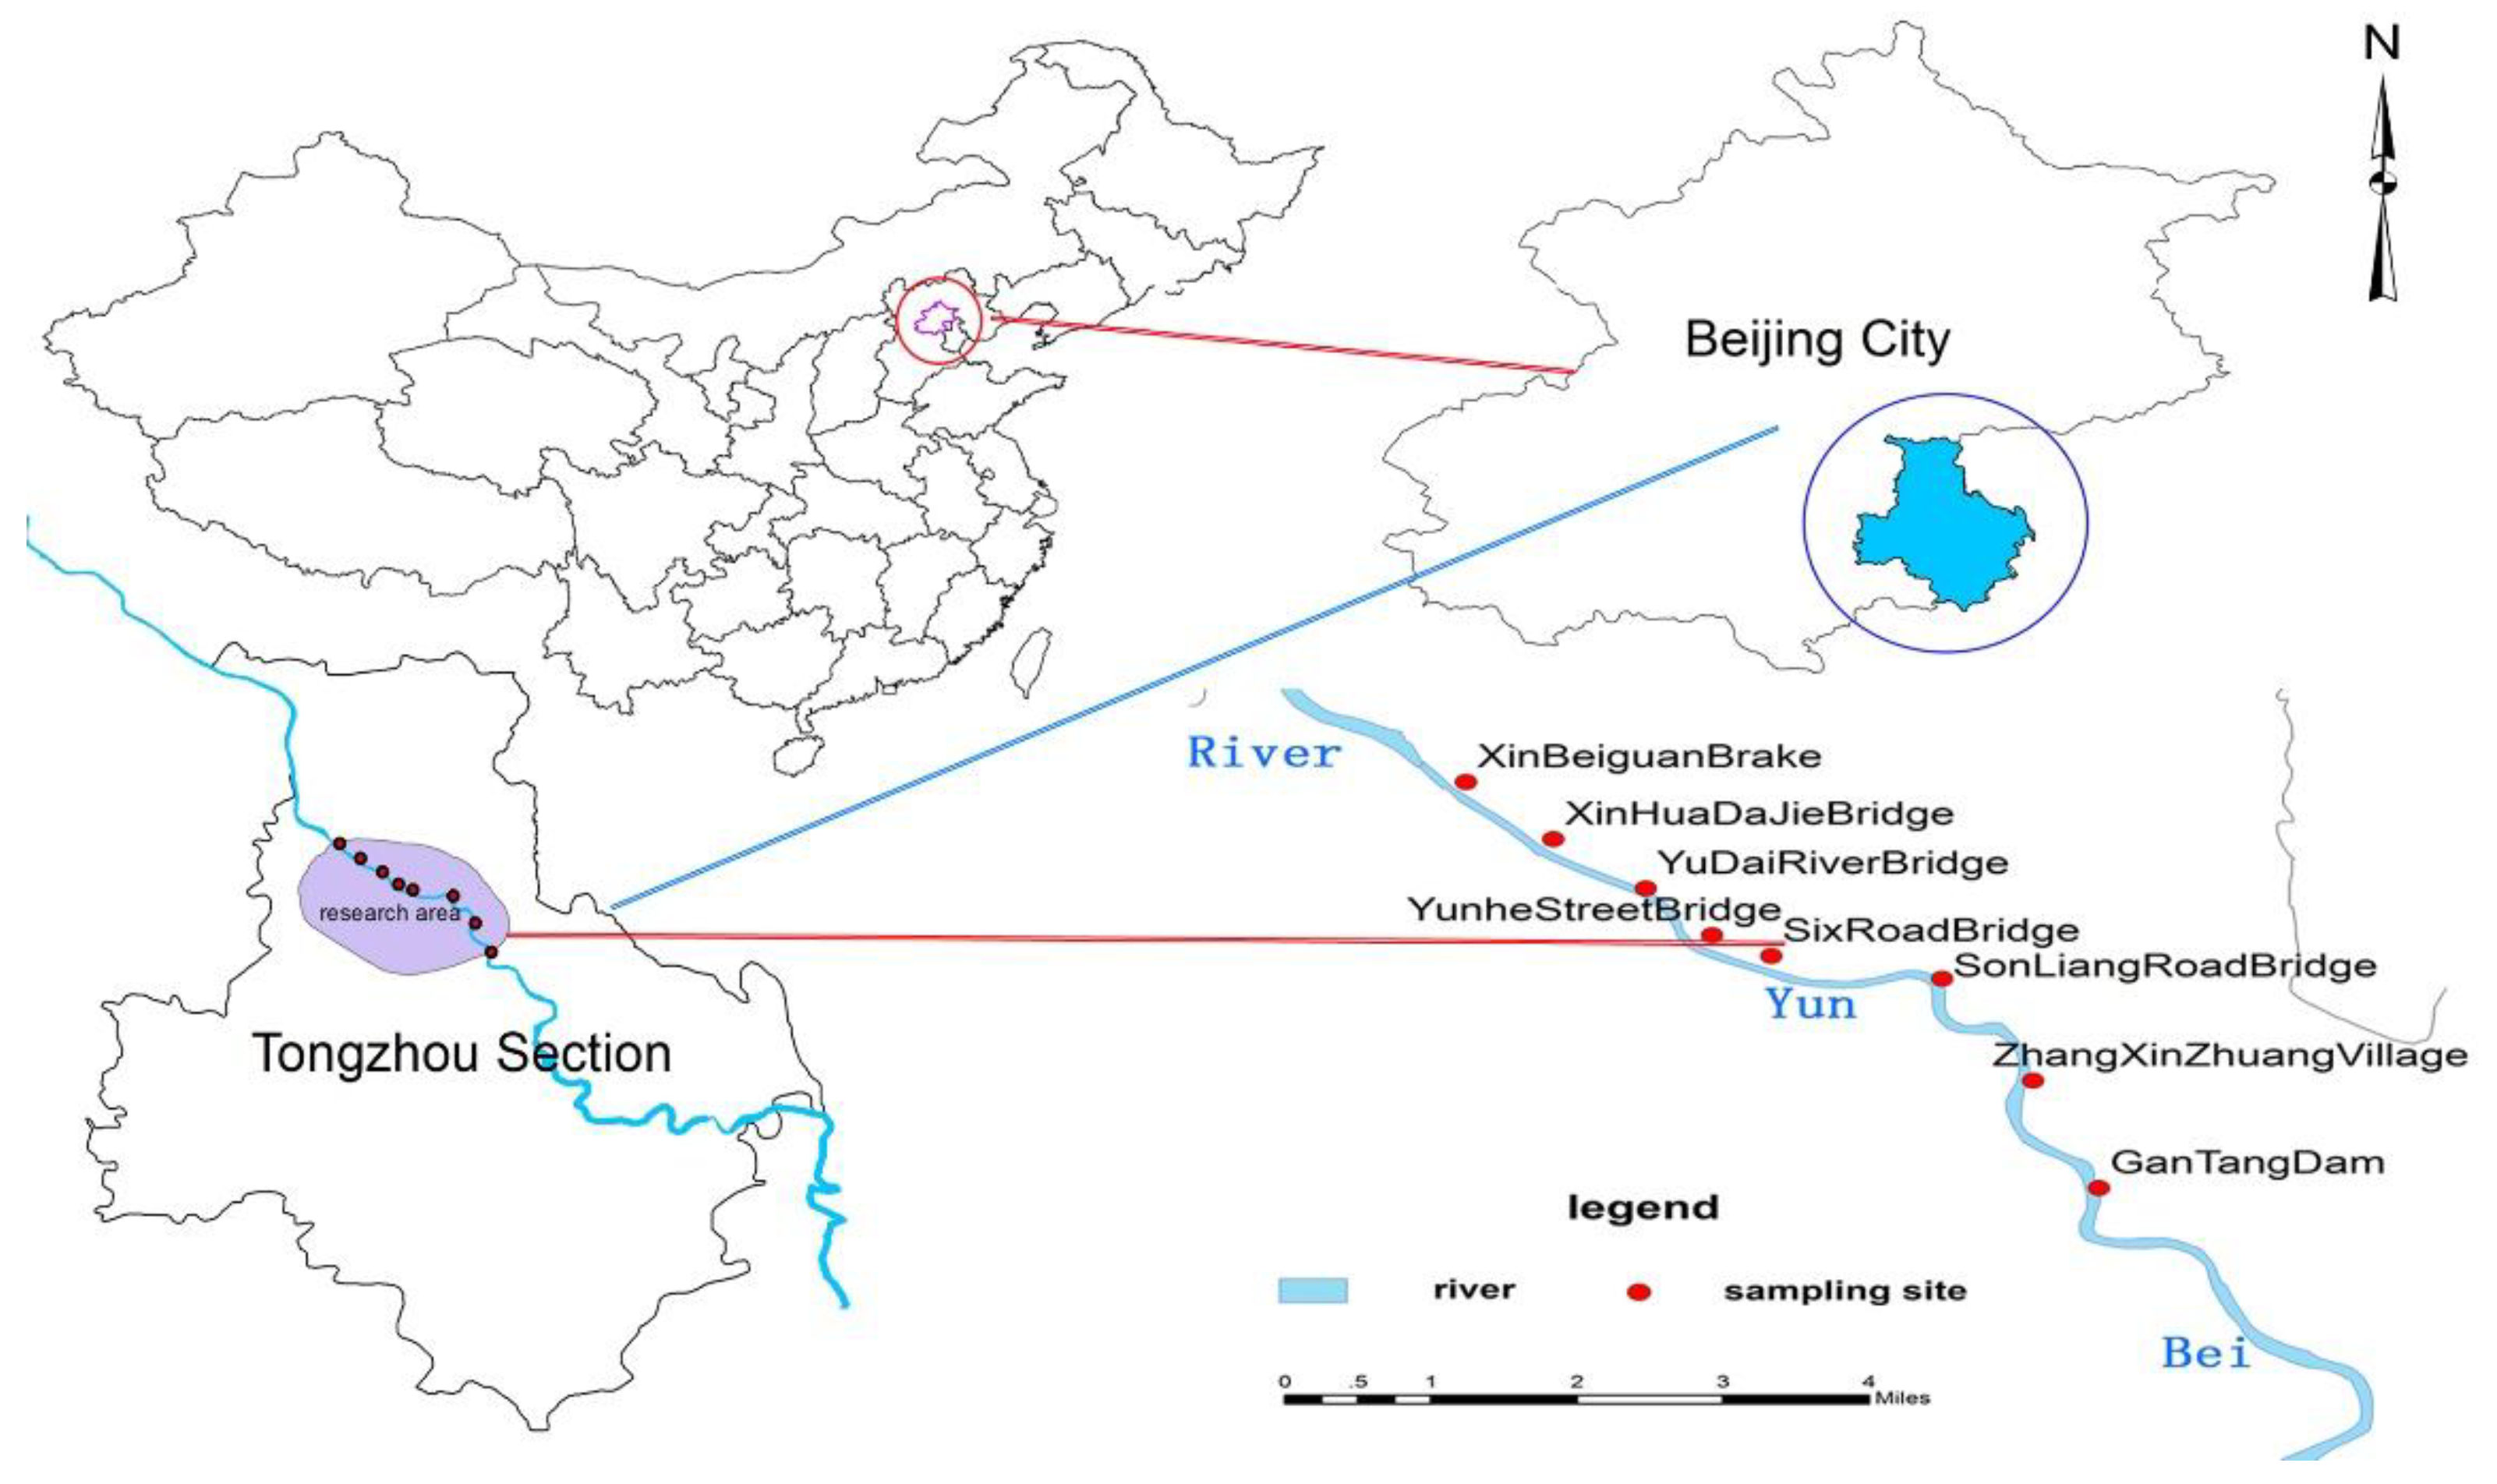
2.1. Study Areas
2.2. Sampling and Parameters
2.3. Analytical Methods
2.3.1. Fuzzy Comprehensive Assessment (FCA)
2.3.2. Multivariate Statistical Methods
3. Data Analysis and Results
3.1. The Overall Status of Water-Quality Characteristics
3.2. Temporal and Spatial Distribution Characteristics of Water Quality
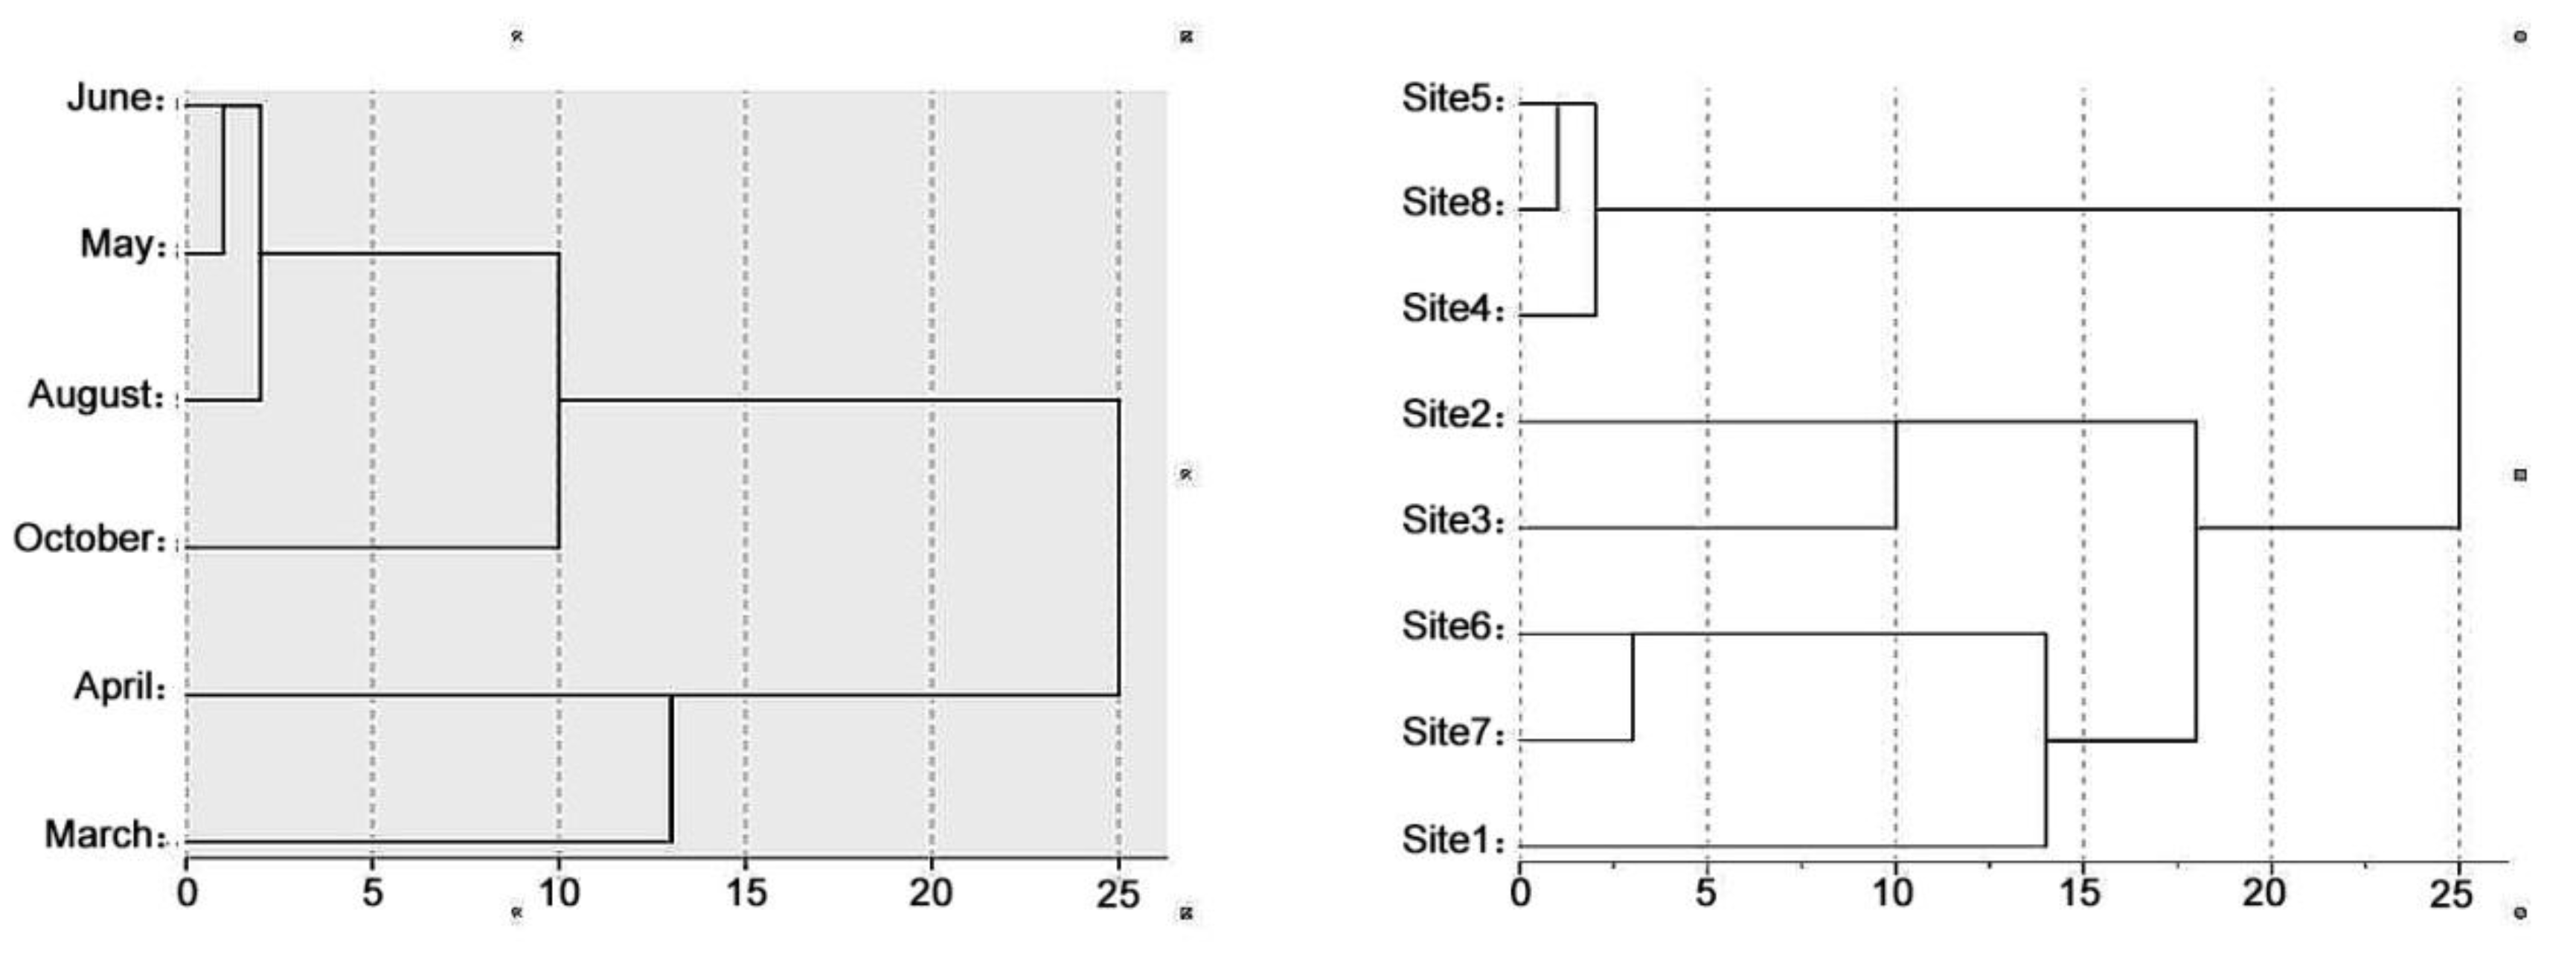
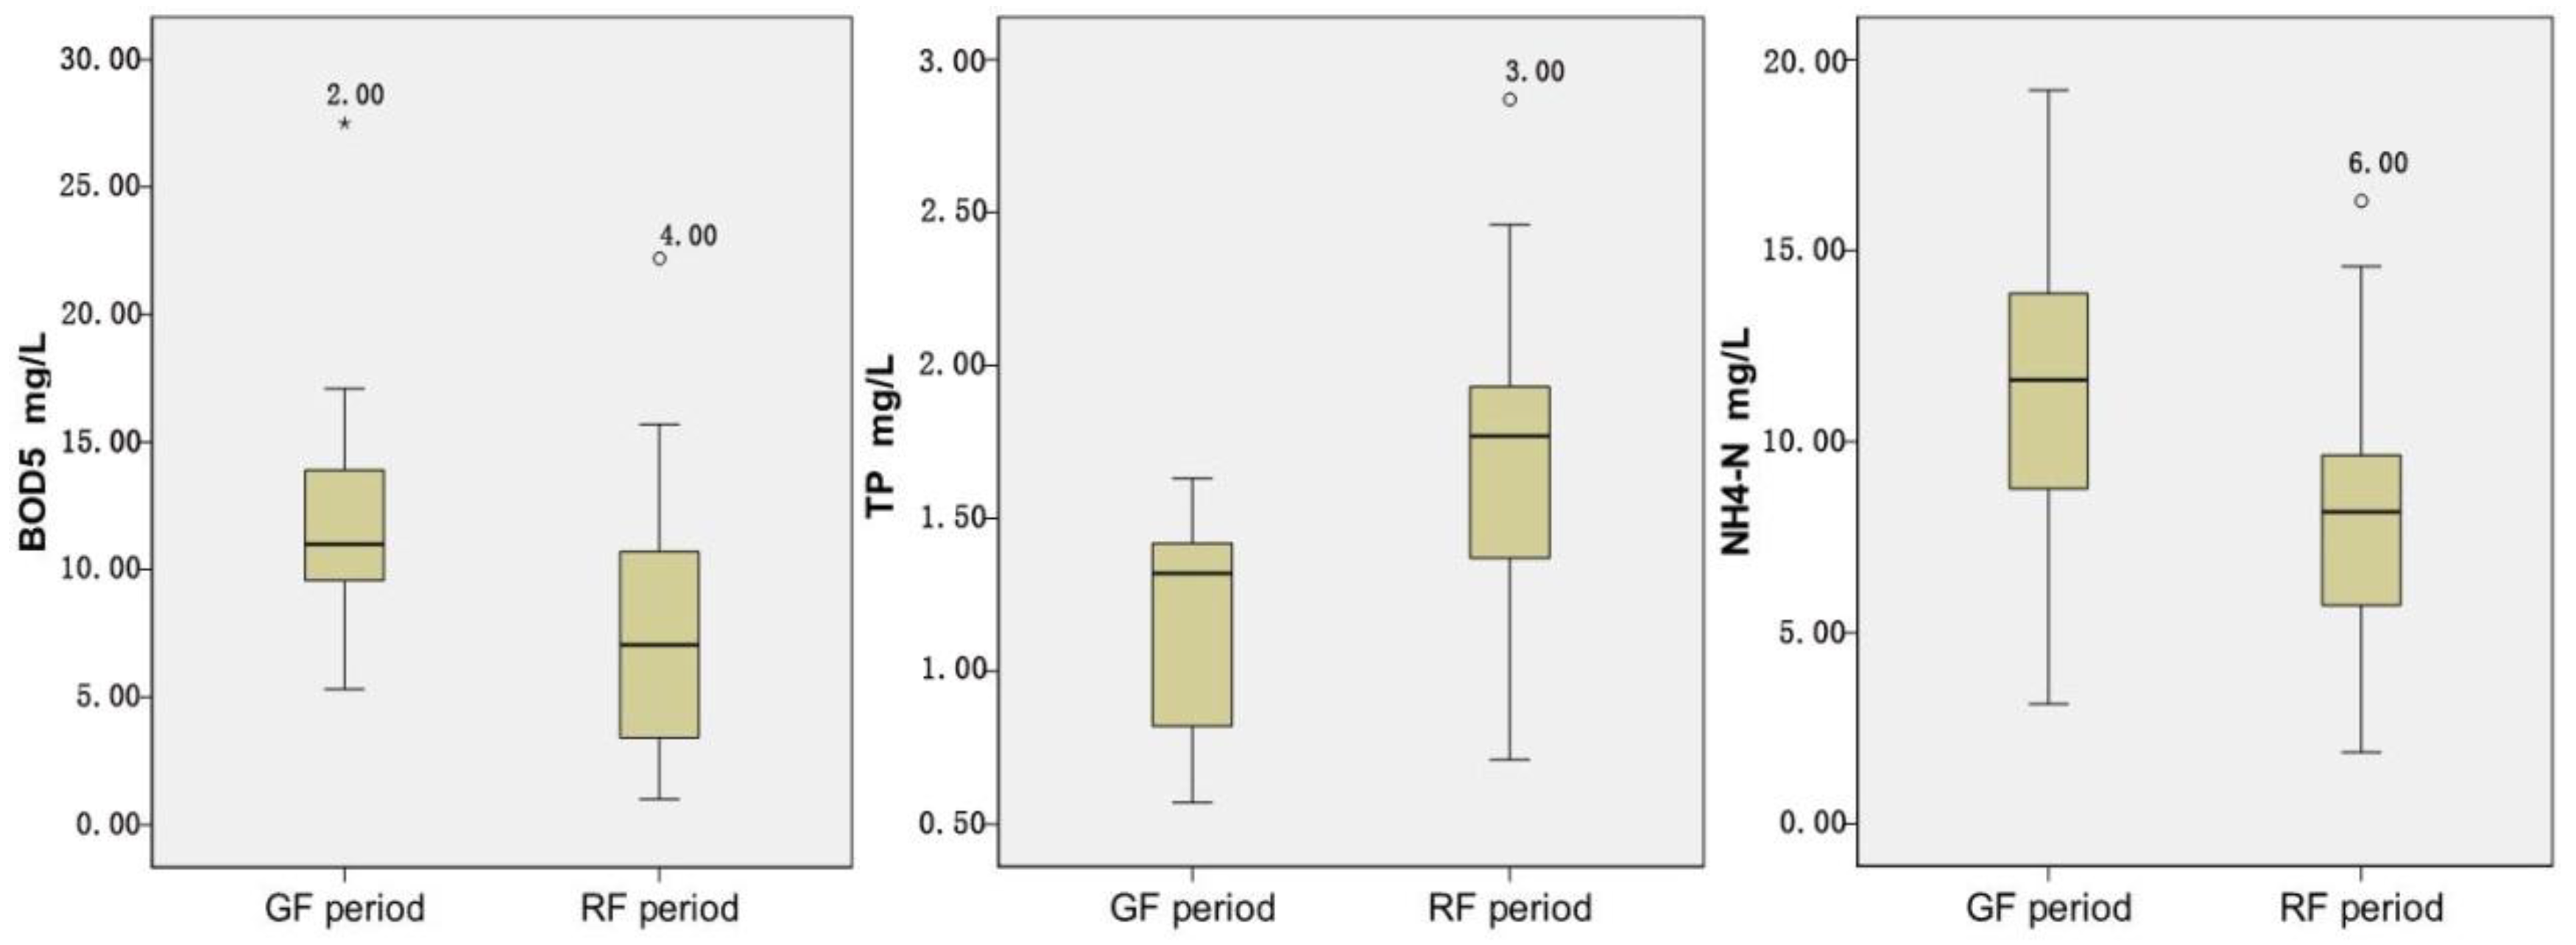
3.2.1. Temporal Variations
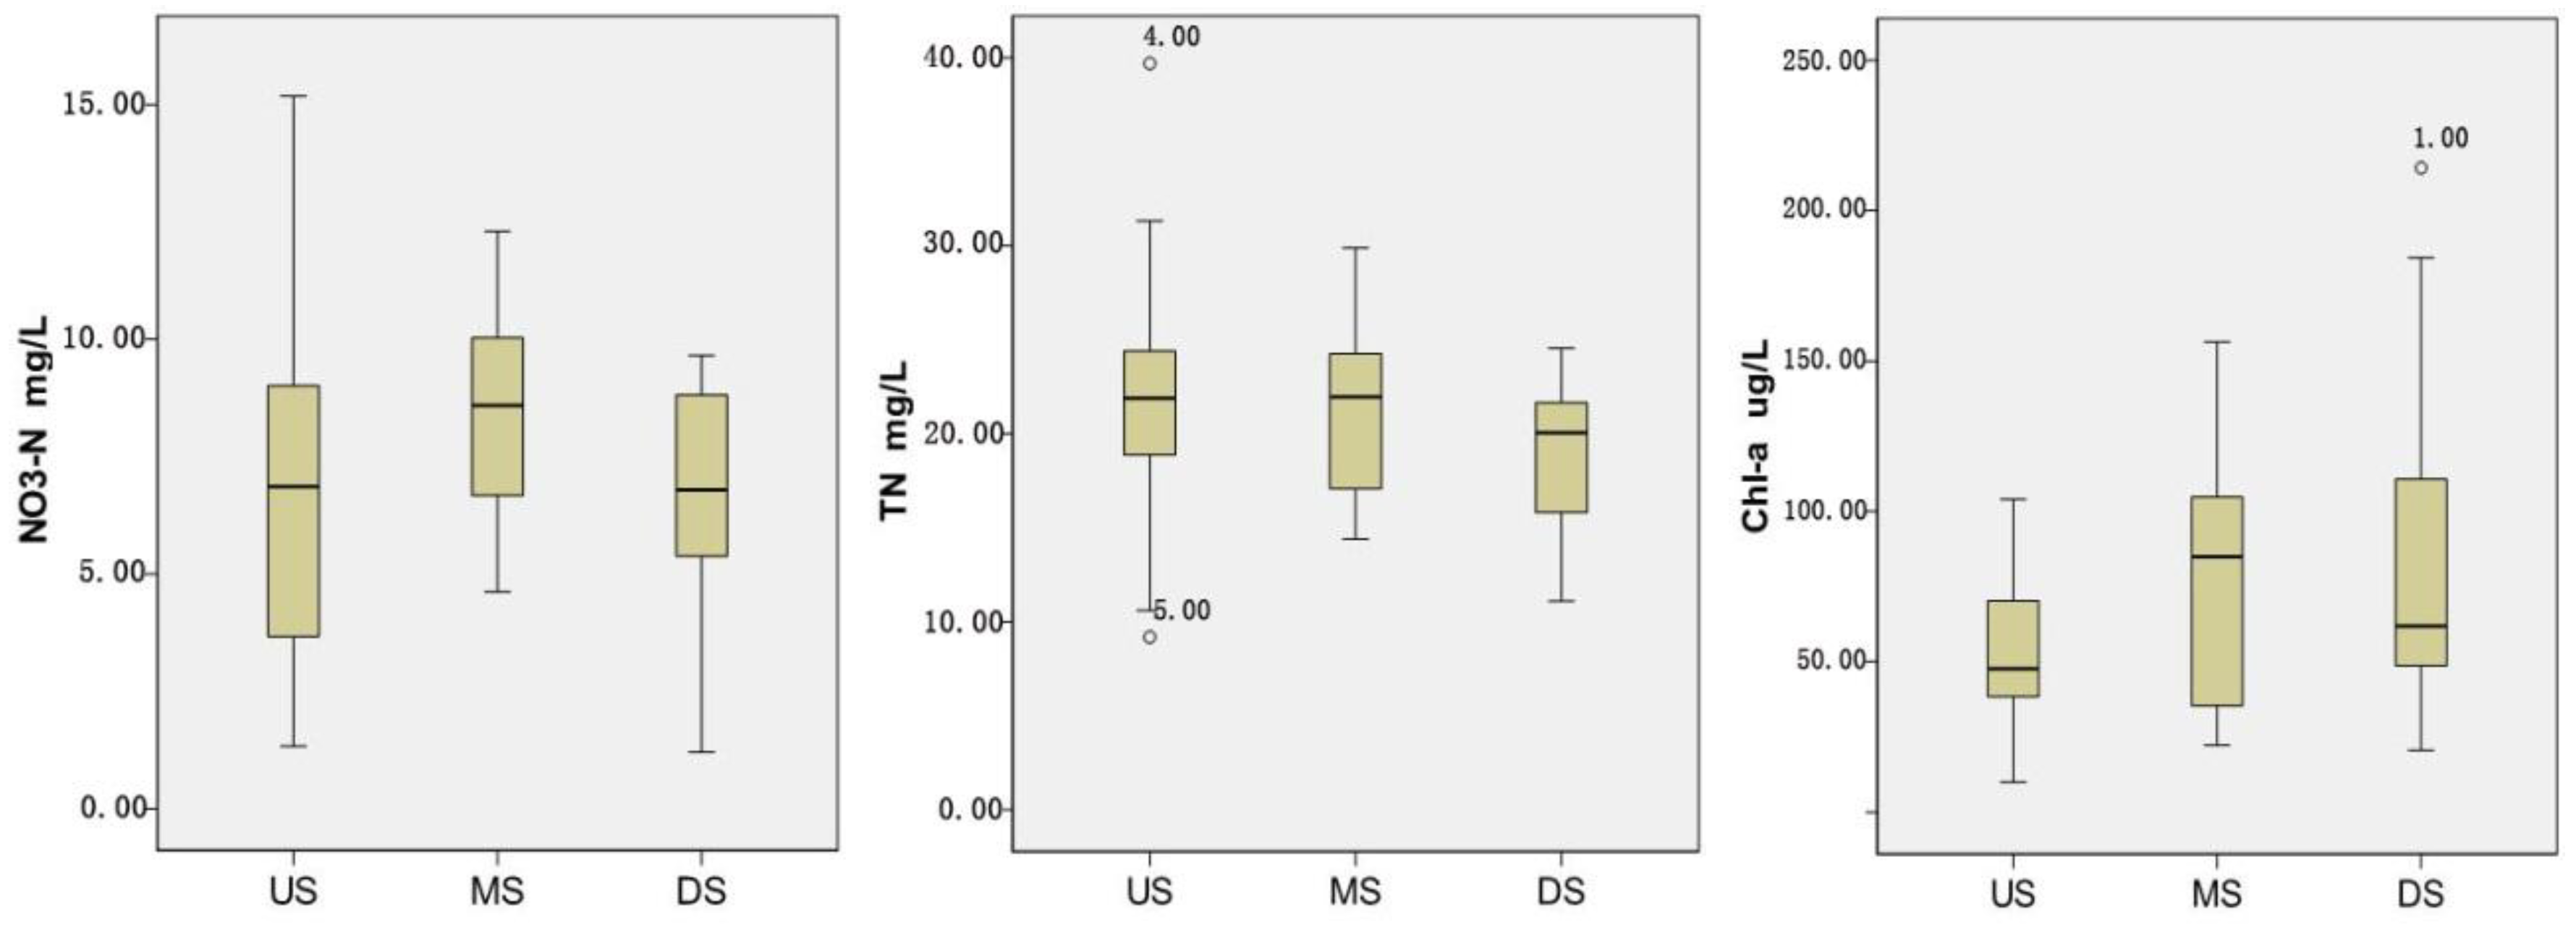
3.2.2. Spatial Variations
3.3. Source Identification
4. Conclusions and Discussions
Author Contributions
Funding
Acknowledgments
Conflicts of Interest
References
- Costanza, R.; D’Arge, R.; De, G.R. The value of the world’s ecosystem services and natural capital. Nature 1997, 387, 253–260. [Google Scholar] [CrossRef]
- Singh, K.P.; Malik, A.; Mohan, D. Multivariate statistical techniques for the evaluation of spatial and temporal variations in water quality of Gomti River (India): A case study. Water Res. 2004, 38, 3980–3992. [Google Scholar] [CrossRef] [PubMed]
- Vega, M.; Pardo, R.; Barrado, E. Assessment of seasonal and polluting effects on the quality of river water by exploratory data analysis. Water Res. 1998, 32, 3581–3592. [Google Scholar] [CrossRef]
- Qiu, J.L.; Shen, J.Y.; Wei, G.Y.; Wang, G.B.; Xie, H.; Lv, G.P. A systematic assessment of watershed-scale nonpoint source pollution during rainfall-runoff in the Miyun Reservoir watershed. Environ. Sci. Pollut. Res. 2018, 25, 6514–6531. [Google Scholar] [CrossRef] [PubMed]
- Shen, J.Y.; Qiu, J.L.; Hong, Q.; Chen, L. Simulation of spatial and temporal distributions of non-point source pollution load in the Three Gorges Reservoir Region. Sci. Total Environ. 2014, 493, 138–146. [Google Scholar] [CrossRef] [PubMed]
- Simeonov, V.; Stratis, J.A.; Samara, C. Assessment of the surface water quality in Northern Greece. Water Res. 2003, 37, 4119–4124. [Google Scholar] [CrossRef]
- Soko, M.I.; Gyedu-Ababio, T. The spatial and temporal variations of Ichythyofauna and water quality in the Crocodile River (East), Mpumalanga, South Africa. J. Water Res. Prot. 2015, 7, 152–170. [Google Scholar] [CrossRef]
- Gert-Jan, W.; Mathias, B.; La, T.N.; Zita, S.; Fabrice, G.R. Spatial and temporal variability of surface water pollution in the Mekong Delta, Vietnam. Sci. Total Environ. 2014, 485–486, 653–665. [Google Scholar]
- Mei, K.; Liao, L.L.; Zhu, Y.L.; Lu, P.; Wang, Z.F.; Dahlgren, R.A.; Zhang, M.H. Evaluation of spatial-temporal variations and trends in surface water quality across a rural-suburban-urban interface. Environ. Sci. Pollut. Res. 2014, 21, 8036–8051. [Google Scholar] [CrossRef] [PubMed]
- Zhou, F.; Hao, Z.J.; Guo, H.C. Temporal and spatial distribution patterns of marine water quality in Eastern Hong Kong. Acta Sci. Circumst. 2007, 27, 1517–1524. (In Chinese) [Google Scholar]
- Pejman, A.H.; Bidhendi, G.; Karbassi, A. Evaluation of spatial and seasonal variations in surface water quality using multivariate statistical techniques. Int. J. Environ. Sci. Technol. 2009, 6, 467–476. [Google Scholar] [CrossRef]
- Sharma, M.; Kansal, A.; Jain, S.; Sharma, P. Application of multivariate statistical techniques in determining the spatial temporal water quality variation of Ganga and Yamuna Rivers present in Uttarakhand State, India. Water Qual. Expo. Health 2015, 7, 567–581. [Google Scholar] [CrossRef]
- Koklu, R.; Sengorur, B.; Topal, B. Water quality assessment using multivariate statistical methods-A case study: Melen River System (Turkey). Water Resour. Manag. 2010, 24, 959–978. [Google Scholar] [CrossRef]
- Adebola, A.O.; Seun, M.A.; Oladele, O. Water quality assessment of river Ogun using multivariate statistical techniques. J. Environ. Prot. 2013, 4, 466–479. [Google Scholar]
- Islam, M.M.; Lenz, O.K.; Azad, A.K.; Ara, M.H.; Rahman, M.; Hassan, N. Assessment of spatio-temporal variations in water quality of Shailmari River, Khulna (Bangladesh) using multivariate statistical techniques. J. Geosci. Environ. Prot. 2017, 5, 1–26. [Google Scholar] [CrossRef]
- Wu, Y.M.; Chen, Q.W.; Li, J. Fuzzy comprehensive assessment on spatio-temporal variations of water quality of a small catchment. Acta Sci. Circumst. 2011, 31, 1198–1205. (In Chinese) [Google Scholar]
- Lu, R.S.; Lo, S.L. Diagnosing reservoir water quality using self-organizing maps and fuzzy theory. Water Res. 2002, 36, 2265–2274. [Google Scholar] [CrossRef]
- Yu, Y.X.; Liao, H.K.; Zhou, Y.; Zhong, W. Reasoning and fuzzy comprehensive assessment methods based CAD system for boiler intelligent design. J. Mech. Sci. Technol. 2015, 3, 1123–1130. [Google Scholar] [CrossRef]
- Zhou, F.; Liu, Y.; Guo, H. Application of multivariate statistical methods to water quality assessment of the watercourses in Northwestern New Territories, Hong Kong. Environ. Monit. Assess. 2007, 132, 1–13. [Google Scholar] [CrossRef] [PubMed]
- Tabata, T.; Hiramatsu, K.; Harada, M. Assessment of the water quality in the Ariake Sea using principal component analysis. J. Water Res. Prot. 2015, 1, 41–49. [Google Scholar] [CrossRef]
- Mohammad, H.; Assefa, M.M. Assortment and spatiotemporal analysis of surface water quality using cluster and discriminant analyses. CATENA 2017, 247–258. [Google Scholar]
- Reghunath, R.; Murthy, T.R.; Raghavan, B.R. The utility of multivariate statistical techniques in hydrogeochemical studies: An example from Karnataka, India. Water Res. 2002, 36, 2437–2442. [Google Scholar] [CrossRef]
- Emad, A.M.S.; Ahmed, M.T.; Eethar, M.A.O. Assessment of water quality of Euphrates River using cluster analysis. J. Environ. Prot. 2012, 12, 1629–1633. [Google Scholar]
- Alberto, W.D.; Marýìa, D.P.D.; Marýìa, V.A. Pattern recognition techniques for the evaluation of spatial and temporal variations in water quality. A case study: Suquýìa River Basin (Córdoba–Argentina). Water Res. 2001, 35, 2881–2894. [Google Scholar] [CrossRef]
- Onkal-Engin, G.; Demir, I.; Hiz, H. Assessment of urban air quality using fuzzy synthetic evaluation. Atmos. Environ. 2004, 38, 3809–3815. [Google Scholar] [CrossRef]
- Lao, S. Fuzzy comprehensive assessment of urban overall environmental quality. China Environ. Sci. 1990, 10, 93–97. [Google Scholar]
- Wang, P. Fuzzy Sets and Their Application; Shanghai Science and Technology Press: Shanghai, China, 1983. (In Chinese) [Google Scholar]
- Wang, H.Y. Assessment and prediction of overall environmental quality of Zhuzhou City, Hunan Province, China. J. Environ. Manag. 2002, 66, 329–340. [Google Scholar]
- Zhou, F.; Guo, H.C.; Liu, Y. A new approach for water quality assessment based on multivariate statistical analysis and Radial Basis Function Neural Networks. Acta Sci. Circumst. 2007, 27, 846–853. (In Chinese) [Google Scholar]
- Lattin, J.M.; Carroll, J.D.; Green, P.E. Analyzing Multivariate Data; Thomson Brooks/Cole: Pacific Grove, CA, USA, 2003. [Google Scholar]
- Tabachnick, B.G.; Fidell, L.S. Using Multivariate Statistics, 3rd ed.; Harper Collins College Publishers: New York, NY, USA, 1996. [Google Scholar]
- Shrestha, S.; Kazama, F. Assessment of surface water quality using multivariate statistical techniques: A case study of the Fuji river basin, Japan. Environ. Model. Softw. 2007, 22, 464–475. [Google Scholar] [CrossRef]
- Pekey, H.; Karaka, D.; Bakoglu, M. Source apportionment of trace metals in surface waters of a polluted stream using multivariate statistical analysis. Mar. Pollut. Bull. 2004, 49, 809–818. [Google Scholar] [CrossRef] [PubMed]
- Suthar, S.; Sharma, J.; Chabukdhara, M. Water quality assessment of river Hindon at Ghaziabad, India: Impact of industrial and urban wastewater. Environ. Monit. Assess. 2010, 165, 103–112. [Google Scholar] [CrossRef] [PubMed]
- Alam, J.B.; Hossain, A.; Khan, S.K. Deterioration of water quality of Surma River. Environ. Monit. Assess. 2007, 134, 233–242. [Google Scholar] [CrossRef] [PubMed]
- Trauth, R.; Xanthopoulos, C. Non-point pollution of groundwater in urban areas. Water Res. 1997, 31, 2711–2718. [Google Scholar] [CrossRef]
- Evans, D.J.; Johnes, P.J.; Lawrence, D.S. Physico-chemical controls on phosphorus cycling in two lowland streams. Part 2-the sediment phase. Sci. Total Environ. 2004, 329, 165–182. [Google Scholar] [CrossRef] [PubMed]
- Eganhouse, R.P.; Sherblom, P.M. Anthropogenic organic contaminants in the effluent of a combined sewer overflow: Impact on Boston Harbor. Mar. Environ. Res. 2001, 51, 51–74. [Google Scholar] [CrossRef]
- Fernandez, H.M.; Conti, L.F.C.; Patchineelam, S.R. An assessment of the pollution of heavy metals in Jacarepagua basin, Rio de Janeiro, Brazil: A statistical approach. Environ. Technol. 1994, 15, 87–94. [Google Scholar] [CrossRef]
- Sui, S.F.; Luo, Q.F. Release Character of Phosphorus from the Sediments of East Lake, Wuhan. Environ. Sci. 2001, 22, 102–105. (In Chinese) [Google Scholar]
- Kannel, P.R.; Lee, S.; Lee, Y.S. Assessment of spatial–temporal patterns of surface and ground water qualities and factors influencing management strategy of groundwater system in an urban river corridor of Nepal. J. Environ. Manag. 2008, 86, 595–604. [Google Scholar] [CrossRef] [PubMed]
- Ho, M.H.; Huang, J.L. Identification of spatio-temporal variation in the seaside water quality along Macau Peninsula. Environ. Sci. 2010, 31, 606–611. (In Chinese) [Google Scholar]
- Xi, D.L.; Sun, Y.S.; Liu, X.Y. Environmental Monitoring; Higher Education Press: Beijing, China, 1999. (In Chinese) [Google Scholar]
- Liu, C.W.; Lin, K.H.; Kuo, Y.M. Application of factor analysis in the assessment of groundwater quality in a blackfoot disease area in Taiwan. Sci. Total Environ. 2003, 313, 77–89. [Google Scholar] [CrossRef]
- Iscen, C.F.; Emiroglu, Ö.; Ilhan, S. Application of multivariate statistical techniques in the assessment of surface water quality in Uluabat Lake, Turkey. Environ. Monit. Assess. 2008, 144, 269–276. [Google Scholar] [CrossRef] [PubMed]
- Xing, G.; Cao, Y.; Shi, S. N pollution sources and denitrification in waterbodies in Taihu Lake region. Sci. China Ser. B Chem. 2001, 44, 304–314. (In Chinese) [Google Scholar] [CrossRef]
- Andersen, T.K.; Jensen, M.H.; Sørensen, J. Diurnal variation of nitrogen cycling in coastal, marine sediments. Mar. Biol. 1984, 83, 171–176. [Google Scholar] [CrossRef]
- Andersen, J.M. Significance of denitrification on the strategy for preserving lakes and coastal areas against eutrophication. In Denitrification in the Nitrogen Cycle; Plenun Press Publishing Corporation: New York, NY, USA, 1985; pp. 171–190. [Google Scholar]
- Wang, C.Y.; Yang, Y.H.; Zhou, F. Spatio-temporal characteristics and source identification of water pollutants in River Qinhe Basin. Acta Sci. Circumst. 2012, 32, 2267–2278. (In Chinese) [Google Scholar]
- Ouyang, Y.; Nkedi-Kizza, P.; Wu, Q.T. Assessment of seasonal variations in surface water quality. Water Res. 2006, 40, 3800. [Google Scholar] [CrossRef] [PubMed]
- Chen, P.; Li, L.; Zhang, H.B. Spatio-temporal variations and source apportionment of water pollution in Danjiangkou Reservoir Basin, Central China. Water 2015, 7, 2591–2611. [Google Scholar] [CrossRef]
- Panda, U.C.; Sundaray, S.K.; Rath, P. Application of factor and cluster analysis for characterization of river and estuarine water systems–A case study: Mahanadi River (India). J. Hydrol. 2006, 331, 434–445. [Google Scholar] [CrossRef]


| Summary Statistics of Measured Parameters | National Standards for Surface Water Quality | ||||||||||
|---|---|---|---|---|---|---|---|---|---|---|---|
| Parameters | Unit | Minimum | Maximum | Mean | S.D. | C.V.% | I | II | III | IV | V |
| NH4-N | mg/L | 0.30 | 22.76 | 11.53 | 4.59 | 39.83 | 0.15 | 0.50 | 1.00 | 1.50 | 2.00 |
| NO3-N | mg/L | 0.06 | 19.19 | 6.50 | 4.24 | 65.22 | 5.00 | 10.00 | 20.00 | 23.00 | 25.00 |
| TP | mg/L | 0.57 | 5.64 | 1.85 | 0.64 | 34.53 | 0.02 | 0.10 | 0.20 | 0.30 | 0.40 |
| PO4-P | mg/L | 0.44 | 3.31 | 1.48 | 0.52 | 35.43 | - | - | - | - | - |
| COD | mg/L | 2.30 | 132.00 | 57.75 | 19.57 | 33.89 | 15.00 | 15.00 | 20.00 | 30.00 | 40.00 |
| BOD5 | mg/L | 1.00 | 27.50 | 9.42 | 4.49 | 47.65 | 3.00 | 3.00 | 4.00 | 6.00 | 10.00 |
| TN | mg/L | 7.85 | 39.70 | 22.25 | 4.75 | 21.35 | 0.20 | 0.50 | 1.00 | 1.50 | 2.00 |
| Chl-a | ug/L | 4.09 | 955.06 | 96.82 | 134.72 | 139.15 | - | - | - | - | - |
| SS | g/L | 5.00 | 66.00 | 15.71 | 8.84 | 56.30 | 15.00 | 15.00 | 20.00 | 30.00 | 40.00 |
| DO | mg/L | 0.06 | 15.40 | 3.85 | 3.98 | 103.33 | 7.50 | 6.00 | 5.00 | 3.00 | 2.00 |
| Scales | I | II | III | IV | V | |
|---|---|---|---|---|---|---|
| Temporal | Gentle-flow (GF) period | 0.000 | 0.000 | 0.007 | 0.061 | 0.942 |
| Rapid-flow (RF) period | 0.000 | 0.011 | 0.003 | 0.009 | 0.976 | |
| Spatial | Upstream | 0.000 | 0.002 | 0.018 | 0.000 | 0.982 |
| Middle-stream | 0.003 | 0.003 | 0.000 | 0.021 | 0.969 | |
| Downstream | 0.000 | 0.000 | 0.020 | 0.029 | 0.960 | |
| Temporal Discriminant | Spatial Discriminant | ||||||||||||
|---|---|---|---|---|---|---|---|---|---|---|---|---|---|
| Standard Mode | Stepwise Mode | Standard Mode | Stepwise Mode | Stepwise Mode (F = 2) | |||||||||
| parameters | RF | GF | RF | GF | US | MS | DS | US | MS | DS | US | MS | DS |
| Chl-a | 0.137 | 0.073 | 0.077 | 0.042 | 0.054 | 0.047 | 0.031 | 0.028 | 0.009 | 0.017 | |||
| NH4-N | 2.036 | 1.39 | 0.769 | 0.545 | 0.374 | ||||||||
| NO3-N | 3.089 | 2.227 | 1.231 | 1.569 | 1.078 | 0.394 | 0.32 | 0.714 | −0.023 | −0.234 | 0.301 | ||
| TN | 1.026 | 0.558 | 1.417 | 0.772 | 0.232 | 0.279 | 0.515 | 0.662 | 0.864 | 0.651 | |||
| TP | 9.637 | 11.418 | 18.932 | 22.934 | 19.113 | ||||||||
| PO4-P | −16.826 | −6.4 | −1.011 | 8.095 | −5.002 | −9.721 | −6.828 | ||||||
| COD | 1.323 | 1.105 | 1.044 | 1.183 | 1.094 | ||||||||
| BOD5 | −0.113 | −0.295 | −0.376 | −0.351 | −0.249 | ||||||||
| SS | 0.458 | 0.351 | 0.353 | 0.423 | 0.447 | ||||||||
| DO | −0.253 | 0.254 | 0.648 | 0.606 | 0.518 | ||||||||
| Residual | −80.929 | −54.933 | −21.26 | −14.327 | −52.81 | −62.798 | −55.323 | −2.26 | −1.867 | −4.911 | −8.446 | −9.645 | −10.018 |
| Discriminant Mode | Period | Correct% | Period Assigned by DA | |
|---|---|---|---|---|
| GF | RF | |||
| standard mode | GF | 93.3 | 14 | 1 |
| RF | 100 | 0 | 30 | |
| Total | 97.8 | 14 | 31 | |
| stepwise mode | GF | 93.3 | 14 | 1 |
| RF | 93.3 | 2 | 28 | |
| Total | 93.3 | 16 | 29 | |
| Spearman’s Correlation Coefficient | ||||||||||
|---|---|---|---|---|---|---|---|---|---|---|
| NH4-N | NO3-N | TN | TP | PO4-P | COD | BOD5 | Chl-a | SS | DO | |
| Temporal | −0.402 | −0.009 | −0.513 | 0.515 | 0.677 | −0.201 | −0.412 | −0.438 | −0.207 | −0.018 |
| Sig. | 0.001 | 0.944 | 0.000 | 0.000 | 0.000 | 0.124 | 0.001 | 0.001 | 0.172 | 0.906 |
| Spatial | −0.103 | 0.337 | 0.214 | 0.188 | 0.092 | −0.047 | −0.024 | −0.107 | −0.064 | −0.297 |
| Sig. | 0.433 | 0.009 | 0.101 | 0.151 | 0.524 | 0.724 | 0.854 | 0.444 | 0.675 | 0.047 |
| Discriminant Mode | Part | Correct% | Part Assigned by DA | ||
|---|---|---|---|---|---|
| US | MS | DS | |||
| Standard mode | US | 73.7 | 14 | 2 | 3 |
| MS | 53.8 | 1 | 7 | 5 | |
| DS | 61.5 | 4 | 1 | 8 | |
| Total | 64.4 | 19 | 10 | 16 | |
| Stepwise mode | US | 50 | 12 | 5 | 7 |
| MS | 72.2 | 2 | 13 | 3 | |
| DS | 33.3 | 4 | 8 | 6 | |
| Total | 51.7 | 18 | 26 | 16 | |
| Stepwise mode (F = 2) | US | 69.6 | 16 | 3 | 4 |
| MS | 64.3 | 1 | 9 | 4 | |
| DS | 56.3 | 2 | 5 | 9 | |
| Total | 64.2 | 19 | 17 | 17 | |
| Parameters | Rapid-Flow Period | Gentle-Flow Period | ||||
|---|---|---|---|---|---|---|
| VF1 | VF2 | VF3 | VF1 | VF2 | VF3 | |
| NH4-N | 0.169 | −0.092 | 0.913 | 0.654 | −0.022 | −0.593 |
| NO3-N | 0.368 | −0.108 | −0.868 | −0.886 | −0.409 | 0.139 |
| TN | 0.623 | −0.033 | −0.317 | 0.050 | −0.868 | 0.030 |
| TP | 0.924 | −0.072 | 0.101 | −0.027 | 0.170 | 0.769 |
| PO4-P | 0.797 | 0.177 | −0.186 | 0.099 | −0.053 | 0.871 |
| COD | 0.607 | 0.334 | 0.278 | 0.854 | −0.141 | 0.393 |
| BOD5 | 0.101 | 0.848 | 0.046 | 0.921 | −0.159 | −0.065 |
| Chl-a | 0.172 | 0.860 | −0.068 | −0.072 | 0.858 | −0.110 |
| SS | 0.700 | 0.108 | 0.189 | 0.368 | 0.325 | −0.424 |
| DO | −0.435 | 0.749 | 0.031 | 0.127 | 0.787 | 0.278 |
| Eigenvalue | 3.13 | 2.20 | 1.85 | 2.96 | 2.46 | 2.15 |
| Variance % | 31.30 | 22.01 | 18.51 | 29.59 | 24.58 | 21.50 |
| Cumulative variance% | 31.30 | 53.31 | 71.82 | 29.59 | 54.17 | 75.67 |
© 2018 by the authors. Licensee MDPI, Basel, Switzerland. This article is an open access article distributed under the terms and conditions of the Creative Commons Attribution (CC BY) license (http://creativecommons.org/licenses/by/4.0/).
Share and Cite
Ren, J.; Liang, J.; Ren, B.; Zheng, X.; Guo, C. New Patterns of Temporal and Spatial Variation in Water Quality of a Highly Artificialized Urban River-Course—a Case Study in the Tongzhou Section of the Beiyun River. Water 2018, 10, 1446. https://doi.org/10.3390/w10101446
Ren J, Liang J, Ren B, Zheng X, Guo C. New Patterns of Temporal and Spatial Variation in Water Quality of a Highly Artificialized Urban River-Course—a Case Study in the Tongzhou Section of the Beiyun River. Water. 2018; 10(10):1446. https://doi.org/10.3390/w10101446
Chicago/Turabian StyleRen, Juanhui, Ji Liang, Bo Ren, Xiuqing Zheng, and Chaofan Guo. 2018. "New Patterns of Temporal and Spatial Variation in Water Quality of a Highly Artificialized Urban River-Course—a Case Study in the Tongzhou Section of the Beiyun River" Water 10, no. 10: 1446. https://doi.org/10.3390/w10101446
APA StyleRen, J., Liang, J., Ren, B., Zheng, X., & Guo, C. (2018). New Patterns of Temporal and Spatial Variation in Water Quality of a Highly Artificialized Urban River-Course—a Case Study in the Tongzhou Section of the Beiyun River. Water, 10(10), 1446. https://doi.org/10.3390/w10101446