The Economic Reality of Underutilised Crops for Climate Resilience, Food Security and Nutrition: Assessing Finger Millet Productivity in India

 ,
,
Abstract
:1. Introduction
2. Material and Methods
2.1. Study Area and Farm-Level Data Collection
2.2. Econometric Yield Gap Estimation
2.3. Assessment of Total Factor Productivity (TFP)
3. Results
3.1. Determinants of Yield Gap
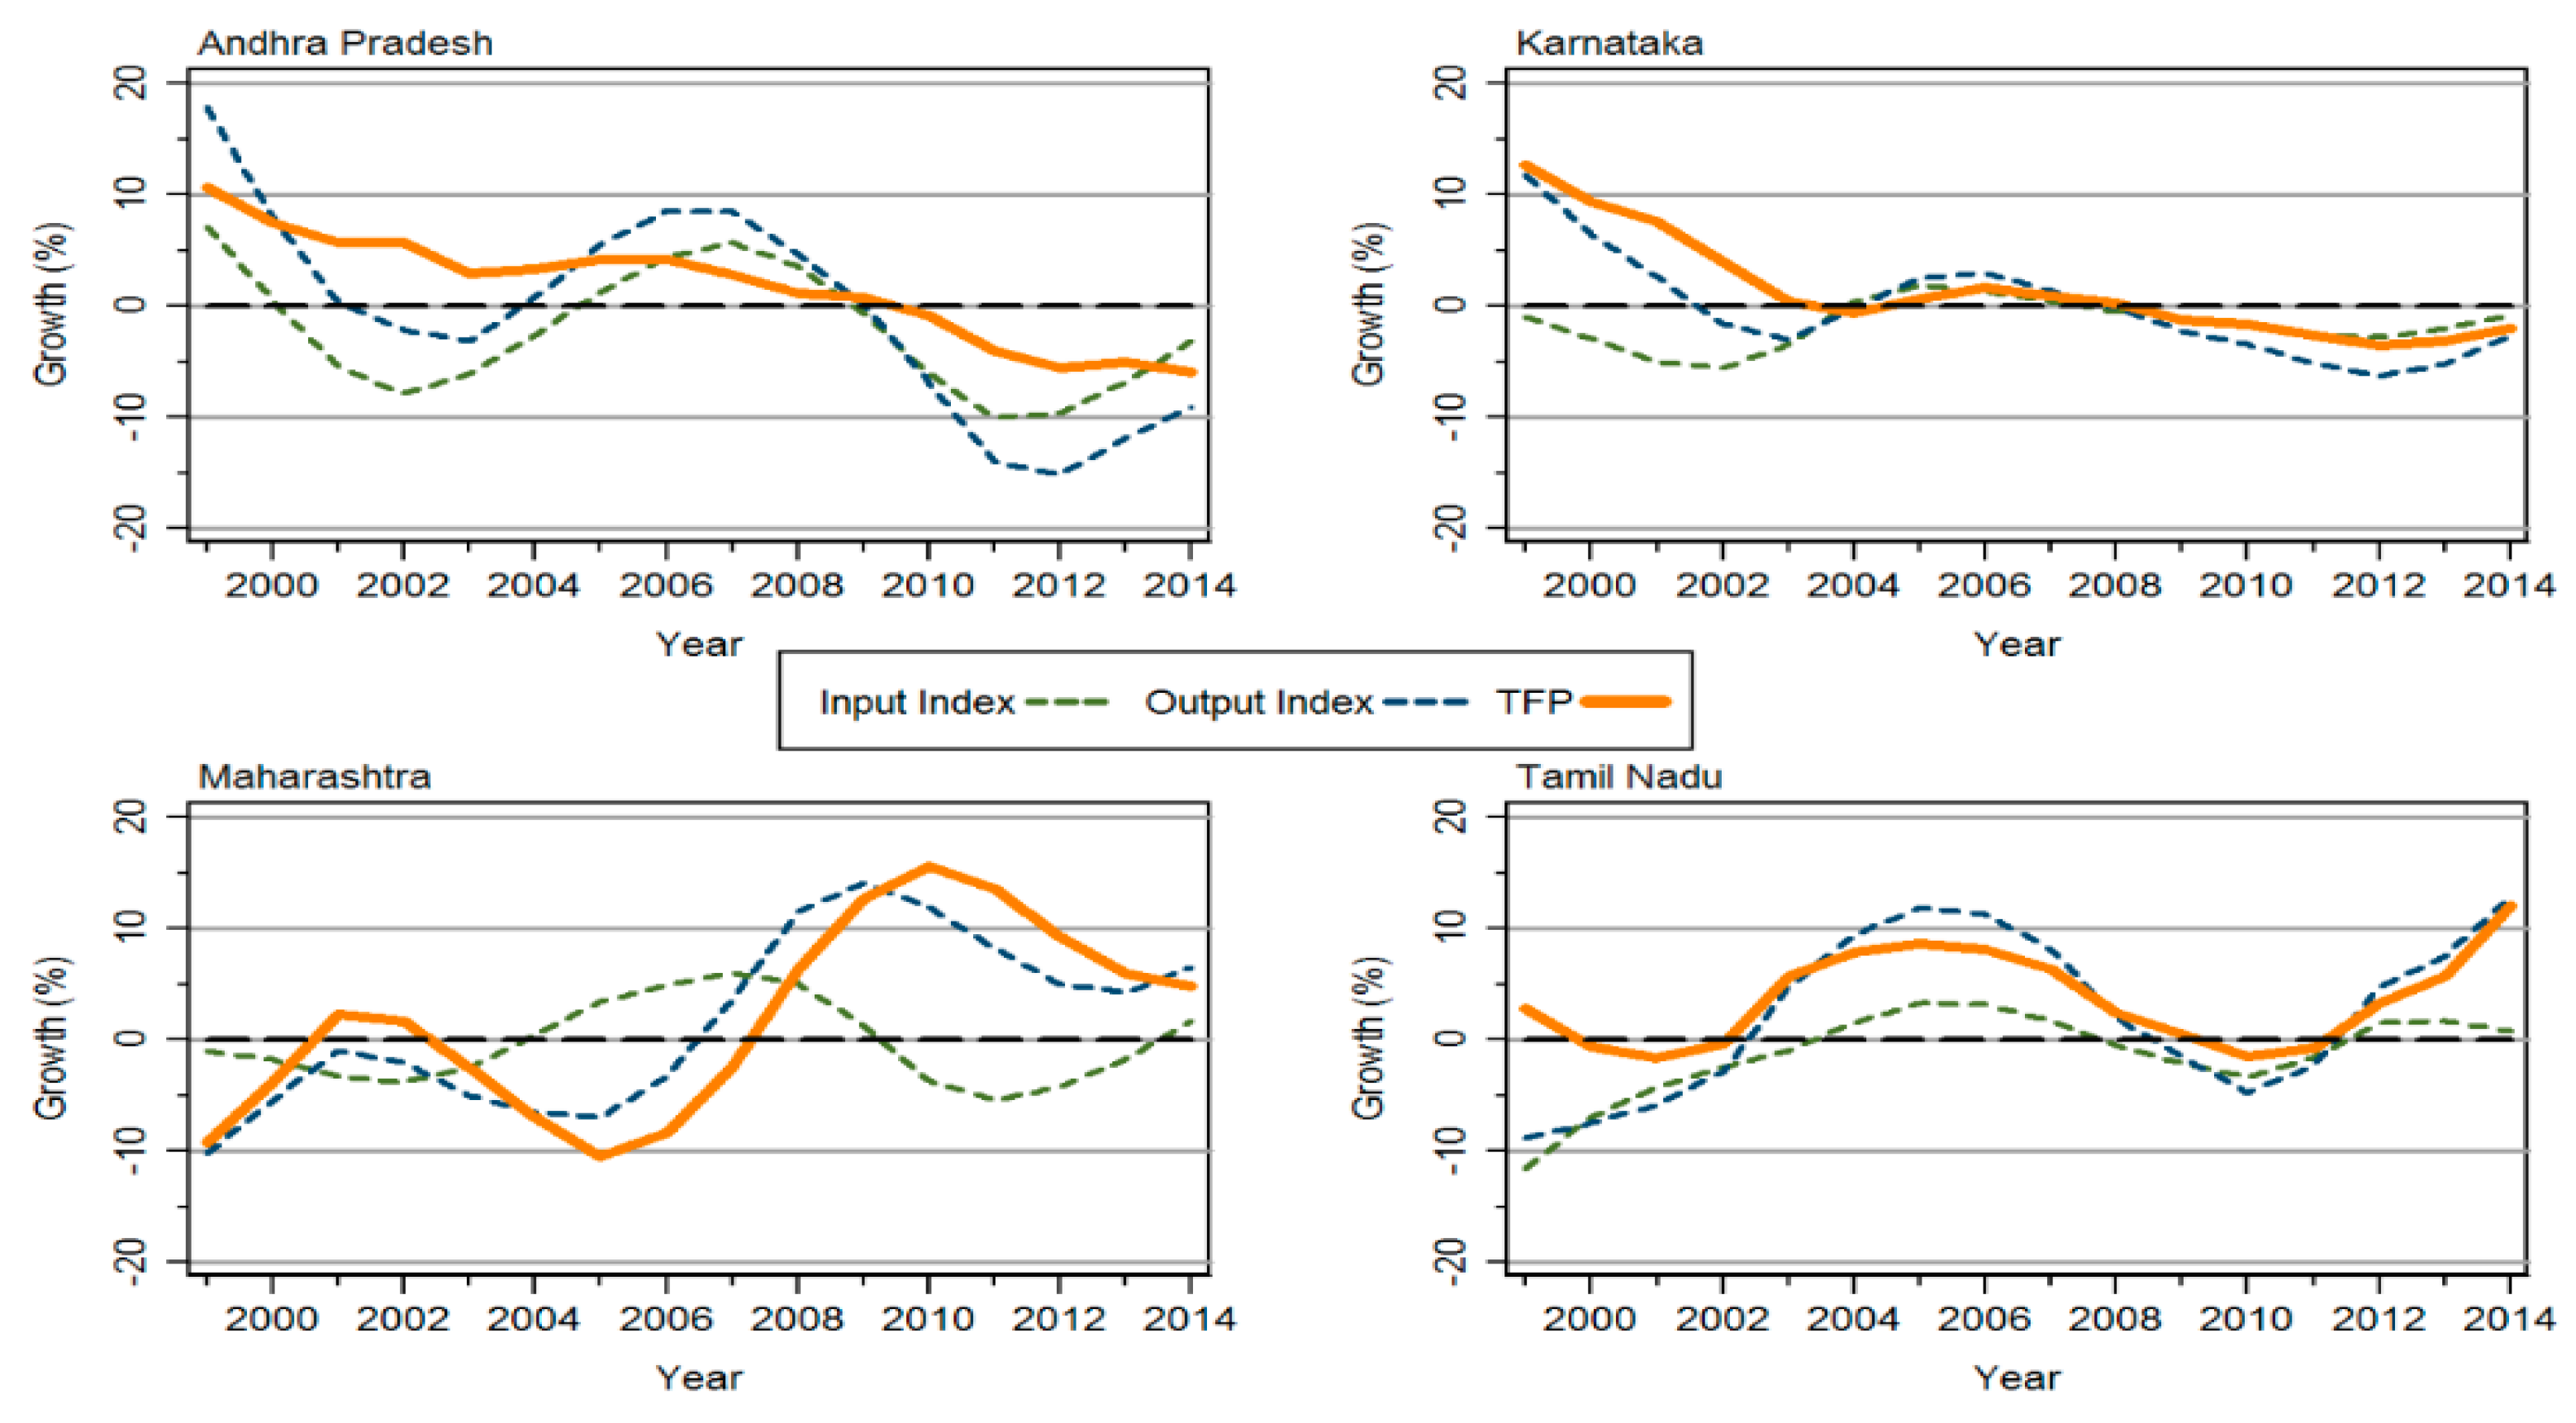
3.2. TFP Growth
4. Discussion
5. Conclusions
Supplementary Materials
Author Contributions
Funding
Acknowledgments
Conflicts of Interest
References
- Pingali, P. Agricultural policy and nutrition outcomes-getting beyond the preoccupation with staple grains. Food Secur. 2015, 7, 583–591. [Google Scholar] [CrossRef]
- Fischer, H.W.; Reddy, N.N.L.; Rao, M.L.S. Can more drought resistant crops promote more climate secure agriculture? Prospects and challenges of millet cultivation in Ananthapur, Andhra Pradesh. World Dev. Perspect. 2016, 2, 5–10. [Google Scholar] [CrossRef]
- International Crops Research Institute for the Semi-Arid Tropics (ICRISAT)/Food and Agriculture Organization (FAO). The World Sorghum and Millet Economies; ICRISAT: Patancheru, India, 2016. [Google Scholar]
- Taylor, J.; Schober, T.; Bean, S. Novel food and non-food uses for sorghum and millets. J. Cereal Sci. 2006, 44, 252–271. [Google Scholar] [CrossRef]
- The National Food Security Bill, Gazette of India, Extraordinary, Part-II, Section-1, 10 September 2013, Act No. 20 of 20 Indian Council of Agricultural Research 2017, DARE/ICAR Annual Reports. Available online: http://indiacode.nic.in/acts-in-pdf/202013.pdf (accessed on 8 November 2017).
- Mal, B.; Padulosi, S.; Bala Ravi, S. Minor Millets in South Asia: Learnings from IFAD-NUS Project in India and Nepal; Bioversity International, Maccarese, Rome, Italy and the M.S. Swaminathan Research Foundation: Chennai, India, 2010. [Google Scholar]
- Ravi, S.B.; Hrideek, T.K.; Kumar, A.T.K.; Prabhakaran, T.R.; Mal, B.; Padulosi, S. Mobilizing neglected and underutilized crops to strengthen food security and alleviate poverty in India. Indian J. Plant Genet. Resour. 2010, 23, 110–116. [Google Scholar]
- Padulosi, S.; Mal, B.; King, O.I.; Gotor, E. Minor millets as a central element for sustainably enhanced incomes, empowerment, and nutrition in rural India. Sustainability 2015, 7, 8904–8933. [Google Scholar] [CrossRef]
- Sorghum, F.A.O. Millets in Human Nutrition; UN Food and Agriculture Organisation: Rome, Italy, 1995; ISBN 92-5-103381-1. [Google Scholar]
- Web Based Land Use Statistics Information System, Directorate of Economics and Statistics, Government of India. Available online: http://aps.dac.gov.in/LUS/Public/Reports.aspx (accessed on 8 November 2017).
- Pallante, G.; Drucker, A.G.; Sthaphit, S. Assessing the potential for niche market development to contribute to farmers’ livelihoods and agrobiodiversity conservation: Insights from the finger millet case study in Nepal. Ecol. Econ. 2016, 130, 92–105. [Google Scholar] [CrossRef]
- Fuglie, K. Accounting for growth in global agriculture. Bio-Based App. Econ. 2015, 4, 201–234. [Google Scholar] [CrossRef]
- Fuglie, K.; Benton, T.; Sheng, Y.; Hardelin, J.; Mondelaers, K.; Laborde, D. Metrics of Sustainable Agricultural Productivity, G20 MACS White Paper. Available online: https://www.oecd.org/tad/events/G20%20MACS%20WP%20Ag%20Productivity%20Metrics%204-26-2016_Final.pdf (accessed on 8 November 2017).
- Papke, L.E.; Wooldridge, J.M. Econometric Methods for Fractional Response Variables with an Application to 401(k) Plan Participation Rates. J. Appl. Econ. 1996, 11, 619–623. [Google Scholar] [CrossRef]
- Dhehibi, B. The Effect of trade liberalization on the sustainability of agricultural sectors in Egypt and Tunisia: A new framework based on TFP growth structure. In Building Sustainable Agriculture for Food Security in the Euro-Mediterranean Area: Challenges and Policy Options; Edizioni Nuova Cultura: Roma, Italy, 2015; pp. 179–201. [Google Scholar]
- Mahadevan, R. To Measure or Not to Measure Total Factor Productivity Growth? Oxf. Dev. Stud. 2003, 31, 365–378. [Google Scholar] [CrossRef]
- Kellermann, M.A. Total Factor Productivity Decomposition and Unobserved Heterogeneity in Stochastic Frontier Models. Agric. Resour. Econ. Rev. 2015, 44, 124–148. [Google Scholar] [CrossRef]
- Hossain, M.K.; Kamil, A.A.; Baten, M.A.; Mustafa, A. Stochastic frontier approach and data envelopment analysis to total factor productivity and efficiency measurement of Bangladeshi rice. PLoS ONE 2015, 7, e46081. [Google Scholar] [CrossRef] [PubMed] [Green Version]
- Mahadevan, R. The Economics of Productivity in Asia and Australia; Edward Elgar: Cheltenham, UK, 2004. [Google Scholar]
- Fuglie, K.; Wang, S.L.; Ball, V.E. Productivity Growth in Agriculture: An International Perspective; CABI: Wallingford, UK, 2012. [Google Scholar]
- OECD Glossary of Statistical Terms-Törnqvist Price Index. Available online: https://stats.oecd.org/glossary/detail.asp?ID=2711 (accessed on 10 August 2017).
- Capalbo, S.; Vo, T. A review of evidence on agricultural productivity and aggregate technology. In Agricultural Productivity Measurement and Explanation; Capalbo, S., Antle, J., Eds.; Resources for the Future: Washington, DC, USA, 1998; pp. 96–137. [Google Scholar]
- Coelli, T.J. Measurement of total factor productivity growth and biases in technological change in western Australian agriculture. J. Appl. Econ. 1996, 11, 77–91. [Google Scholar] [CrossRef]
- District-Wise, Season-Wise Crop Production Statistics from 1997. Ministry of Agriculture and Farmers Welfare. Available online: https://data.gov.in/catalog/district-wise-season-wise-crop-production-statistics (accessed on 8 November 2017).
- Inflation, Consumer Prices (Annual %). Available online: http://data.worldbank.org/indicator/FP.CPI.TOTL.ZG (accessed on 10 August 2017).
- Methodology for Measuring International Agricultural Total Factor Productivity (TFP). Available online: https://www.ers.usda.gov/data-products/international-agricultural-productivity/documentation-and-methods/ (accessed on 8 November 2017).
- Agricultural Productivity Trends in India: Sustainability Issues, Agricultural Economics Research Review. Available online: https://ageconsearch.umn.edu/bitstream/57779/2/DrP-Kumar.pdf (accessed on 8 November 2017).
- West, P.C.; Gerber, J.S.; Engstrom, P.M.; Mueller, N.D.; Brauman, K.A.; Carlson, K.M.; Cassidy, E.S.; Johnston, M.; MacDonald, G.K.; Ray, D.K.; et al. Leverage points for improving global food security and the environment. Science 2014, 345, 325–328. [Google Scholar] [CrossRef] [PubMed] [Green Version]
- Pradhan, P.; Fischer, G.; van Velthuizen, H.; Reusser, D.E.; Kropp, J.P. Closing yield gaps: How sustainable can we be? PLoS ONE 2015, 10, e0129487. [Google Scholar] [CrossRef] [PubMed] [Green Version]
- Alston, J.; Pardey, P. Agriculture in the global economy. J. Econ. Perspect. 2014, 28, 121–146. [Google Scholar] [CrossRef]
- Coelli, T.; Rao, D.S.P. Total factor productivity growth in agriculture: A malmquist index analysis of 93 Countries, 1980–2000. Agric. Econ. 2005, 32, 115–134. [Google Scholar] [CrossRef]
- Ananth, G.S. Returns to Investment on Agricultural Research in Karnataka–An Analysis of Major Field Crops. Ph.D. Thesis, University of Agricultural Sciences, Bangalore, India, 2004. [Google Scholar]


| Andhra Pradesh (n = 181) | Karnataka (n = 238) | Maharashtra (n = 106) | Tamil Nadu (n = 200) | |||||
|---|---|---|---|---|---|---|---|---|
| Mean | SD1 | Mean | SD | Mean | SD | Mean | SD | |
| Yield (tons per ha) | 1.82 | 1.18 | 2.45 | 0.78 | 1.41 | 0.65 | 2.22 | 0.74 |
| Yield gap (proportion) | 0.49 | 0.23 | 0.37 | 0.19 | 0.55 | 0.20 | 0.36 | 0.19 |
| Age (Years) | 48.39 | 9.63 | 53.43 | 14.25 | 49.31 | 10.89 | 48.37 | 13.30 |
| Education (0 = Low to 2 = High) | 0.83 | 0.79 | 1.17 | 0.71 | 0.87 | 0.78 | 0.69 | 0.78 |
| Below poverty line (yes = 1) | 0.99 | 0.07 | 0.42 | 0.49 | 1.00 | 0.00 | 0.69 | 0.47 |
| Lack of technical support (yes = 1) | 0.28 | 0.28 | 0.30 | 0.18 | 0.75 | 0.21 | 0.12 | 0.15 |
| Farm size (ha) | 3.19 | 2.17 | 1.33 | 0.66 | 4.62 | 4.06 | 3.05 | 2.28 |
| Irrigated area (%) | 15.47 | 36.26 | 35.04 | 36.36 | 0.00 | 0.00 | 0.00 | 0.00 |
| Labour (person-days per ha) | 128.98 | 54.14 | 90.62 | 22.46 | 194.82 | 49.53 | 79.35 | 18.06 |
| Machine (person-hours per ha) | 3.77 | 3.50 | 11.53 | 6.49 | 6.05 | 3.65 | 16.30 | 8.97 |
| Mineral fertiliser (kg per ha) | 35.46 | 49.34 | 445.72 | 362.03 | 300.74 | 145.49 | 316.37 | 196.84 |
| Manure fertiliser (tons per ha) | 3.61 | 3.07 | 3.02 | 1.98 | 4.96 | 2.18 | 1.42 | 1.33 |
| Seed (kg per ha) | 15.33 | 7.78 | 19.87 | 11.13 | 2.28 | 1.07 | 32.40 | 11.88 |
| Variables | Marginal Effects | SE (Δ-method) 5 | Sign 6 |
|---|---|---|---|
| Age (years) | −0.05 | 0.00 | |
| Education (1 = medium) 1 | −1.28 | 1.58 | |
| Education (1 = high) 1 | −9.27 | 2.45 | *** |
| Below poverty line (1 = yes) | 0.78 | 1.00 | |
| Lack of tech. support (1 = yes) | 8.66 | 3.36 | ** |
| Farm size (ha) | −0.87 | 0.15 | *** |
| Irrigation (1 = moderate) 2 | −13.14 | 1.18 | *** |
| Irrigation (1 = intensive) 2 | −21.97 | 2.46 | *** |
| Labour (person-days/ha, ln) | −0.79 | 0.15 | *** |
| Machine labour (person-days/ha, ln) | −0.08 | 0.38 | ** |
| Mineral fertiliser (kg/ha, ln) | −0.33 | 0.05 | *** |
| Manure fertiliser (kg/ha, ln) | −0.10 | 0.05 | ** |
| Seed (kg/ha, ln) | 0.02 | 0.05 | |
| Location 1 (1 = Karnataka) 3 | 13.51 | 4.26 | *** |
| Location 2 (1 = Maharashtra) 3 | 26.98 | 4.42 | *** |
| Location 3 (1 =Tamil Nadu) 3 | 1.06 | 6.78 | |
| N | 723 | ||
| Log pseudolikelihood 4 | −317.47 |
| State | Period | Output Growth (%) | Input Growth (%) | TFP Growth (%) |
|---|---|---|---|---|
| Andhra Pradesh | 1999–2002 | 5.75 | −1.58 | 7.42 |
| 2003–2006 | 2.84 | −0.83 | 3.69 | |
| 2007–2010 | 1.49 | 0.56 | 0.98 | |
| 2011–2014 | −12.54 | −7.43 | −5.13 | |
| 1999–2014 | −0.88 | −2.37 | 1.64 | |
| Karnataka | 1999–2002 | 4.72 | −3.61 | 8.38 |
| 2003–2006 | 0.57 | 0.02 | 0.55 | |
| 2007–2010 | −1.12 | −0.73 | −0.38 | |
| 2011–2014 | −4.81 | −2.04 | −2.77 | |
| 1999–2014 | −0.22 | −1.60 | 1.36 | |
| Maharashtra | 1999–2002 | −4.75 | −2.46 | −2.34 |
| 2003–2006 | −5.45 | 1.54 | −7.07 | |
| 2007–2010 | 10.23 | 2.12 | 7.88 | |
| 2011–2014 | 6.02 | −2.43 | 8.37 | |
| 1999–2014 | 1.28 | −0.33 | 1.49 | |
| Tamil Nadu | 1999–2002 | −6.26 | −6.35 | 0.04 |
| 2003–2006 | 9.32 | 1.76 | 7.57 | |
| 2007–2010 | 0.86 | −1.06 | 1.98 | |
| 2011–2014 | 5.58 | 0.60 | 5.02 | |
| 1999–2014 | 2.21 | −1.31 | 3.61 |
© 2018 by the authors. Licensee MDPI, Basel, Switzerland. This article is an open access article distributed under the terms and conditions of the Creative Commons Attribution (CC BY) license (http://creativecommons.org/licenses/by/4.0/).
Share and Cite
Grovermann, C.; Umesh, K.B.; Quiédeville, S.; Kumar, B.G.; S., S.; Moakes, S. The Economic Reality of Underutilised Crops for Climate Resilience, Food Security and Nutrition: Assessing Finger Millet Productivity in India. Agriculture 2018, 8, 131. https://doi.org/10.3390/agriculture8090131
Grovermann C, Umesh KB, Quiédeville S, Kumar BG, S. S, Moakes S. The Economic Reality of Underutilised Crops for Climate Resilience, Food Security and Nutrition: Assessing Finger Millet Productivity in India. Agriculture. 2018; 8(9):131. https://doi.org/10.3390/agriculture8090131
Chicago/Turabian StyleGrovermann, Christian, K. B. Umesh, Sylvain Quiédeville, B. Ganesh Kumar, Srinivasaiah S., and Simon Moakes. 2018. "The Economic Reality of Underutilised Crops for Climate Resilience, Food Security and Nutrition: Assessing Finger Millet Productivity in India" Agriculture 8, no. 9: 131. https://doi.org/10.3390/agriculture8090131
APA StyleGrovermann, C., Umesh, K. B., Quiédeville, S., Kumar, B. G., S., S., & Moakes, S. (2018). The Economic Reality of Underutilised Crops for Climate Resilience, Food Security and Nutrition: Assessing Finger Millet Productivity in India. Agriculture, 8(9), 131. https://doi.org/10.3390/agriculture8090131