1. Introduction
The material handling system is one of the elements that influences the manufacturing of products in SMEs [
1]. The duty of distribution of goods contributes a benefit of time and positioning that acquires a value related to getting a product at a provided station with equipment capable to transform the distributed parts into profitable goods.
The process of handling materials in most of the SMEs’ facilities includes employees spending great amounts of time and effort for sorting parts and performing manual tasks, which resulted in higher production costs and longer production time [
2]. However, the concept of intelligent material handling has been developed and introduced, which only relies on manufacturing resources and their control architecture [
3].
Even though, for a few numbers of SMEs, which target the utilization of types of intelligent material handling systems, it would be risky and sometimes not feasible to apply any changes or performance evaluation before a trustable outcome of the system performance validated by a standard about different manufacturing aspects [
4].
1.1. Material Handling Systems Performance Evaluation
SMEs nowadays put so much effort to increase the production line’s effectiveness, to meet the needs of the market. That does not happen if the performance of the production line is not improved. Although before improving any system, its performance has to be checked and brought to the utmost way possible. In order to develop and improve any production line, it is important to have numbers and data that shows the performance [
5].
According to Kathurima et al., to understand material handling systems behavior, it is important to observe and collect records and the data of the system process [
6]. Authors in this study mentioned that to improve the material handling system, it is essential to study the system performance by identifying problems to increase the production line performance efficiency. The goal of this research is to check the overall performance using a specific time study methodology, subsequently followed by an optimization process of each part of the material handling system with specific standards in the industry, which will eventually help to utilize the machinery for better productivity.
There are many ways to evaluate the performance of a production line. One of these methods is applied mathematical modeling, meaning that they are determined by an analytical method (a computational formal). The models are categorized into analytical and experimental, or they can be hybrid; which combines both the analytical and experimental models together. The analytical model can be translated as the mathematical interpretation of a real system, and it is primarily categorized into either exact models or approximation models. In contrast, the experimental model is considered a simulation model. Jarrahi et al introduced a linear programming model, which uses a mathematical form of a time cycle measure of a production line that has workstations, and each workstation is likely to fail [
7]. On the other hand, the approximation model can be demonstrated by De Koster’s method, where he built a continuous flow line of a multi-stage model, which contains some unreliable machines with buffers separating them, and then used repeated aggregation on them to predict the efficiency of the line. Equally for the simulation, Conway et al. have simulated a system in which they investigated the behaviour of buffered lines that lacked synchronization, which led them to discover the aggregation of work-in-process [
8].
1.2. Overall Equipment Effectiveness (OEE)
In Industry 4.0, firm effectiveness of equipment plays a major role to lessen the number of rejections and achieve higher productivity [
9]. In the current dynamic and challenging environment for SMEs, reliable manufacturing equipment and OEE are the main components for increasing performance and profitability of manufacturing systems [
10]. Alternatively, the overall equipment effectiveness (OEE) is an analytical performance evaluation method for SMEs [
11]. The OEE is defined as the valuable time of operation over the loading time. Iannone et al. stated that the operation time can be interpreted as the time during which the equipment produces satisfactory products. Whereas the loading time is the time needed for equipment to run through a given period [
12]. This method is going to be explained in detail in the next point for the time study [
13].
Standard metrics are considered for manufacturing systems evaluation in order to improve productivity of the enterprises. The improvement of the manufacturing system can be determined and improved using these metrics [
14]. Each metric can measure different sides of the production performance, such as efficiency, quality, flexibility, inventory, and profitability. Overall equipment effectiveness (OEE) is one of the metrics to measure the percentage of the truly productive time, and consists of three factors; namely, availability, performance, and quality. Thus, conducting time study with OEE view helps to correct and eliminate the wasted time that may occur in manufacturing process [
15]; overall equipment effectiveness is a metric used to measure the percentage of the truly productive time from the planned production time of a plant or manufacturing process when the percentage is as near to 100% as the more productive the process [
16].
In addition, OEE assessment in manufacturing system is not just limited to evaluating the manufacturing times. Investigation of OEE provides a systematic process to easily identify common sources of productivity losses so that you can effectively apply resources to improve manufacturing performance [
17]. OEE investigation can also improve productivity; reduction cost; and raise awareness, machine productivity, and increase in life of equipment. The effects of these objectives are to reduce costs, increase profits, maintain a distinguished ownership of equipment [
18,
19].
There are three factors that need to be measured to get the percentage of the OEE, which are the following: availability, performance, and quality, and after calculating the percentage of these factors, the OEE percentage can be determined by Equation (1) [
20].
Availability is the ratio of the runtime to the planned time of the production and it takes the consideration the availability loss, which are all the down times that the process faces during that time that it is supposed to be running, and there are unplanned stops that may occur because of equipment failure or the lack of materials, and planned stops that may be caused by the changeover, and then the remaining time from the whole production time, deducting the loss availability loss, is called the runtime [
14].
Calculating the availability mathematically is done by the following Equation (2):
As that if the availability is 100%, it means that there were not any stop times at all during the whole production time.
The second factor of the OEE is the performance, which is the ratio of the net runtime to the runtime, and this factor takes into consideration anything that may reduce the speed of the manufacturing to be less than the maximum speed, including minor stops and slow cycles. To calculate the performance, the following Equation (3) is used:
where the total count is the total numbers of products that are produced [
21].
This factor concerns the parts that are manufactured during the production process and takes account to the quality loss, which is the products that did not meet the quality standards and have some defects on them, and which may need rework to make them meet the quality standards. Quality factor takes in consideration of all the parts that are manufactured, whether or not they met the quality standards. The quality (4) is calculated by the following equation:
where the good count is the number of the products that are manufactured and met the quality standards and the total is the number of all parts manufactured.
Time study tracks the behaviour of each instrument in the process. Also, based on this standard, breaking the process into parts makes evaluation easier, where the actual and the overall performance times of the system are considered [
22,
23].
1.3. Time Study as the Key Factor for OEE
As mentioned before, time plays the most essential role in analysing the OEE. In order to improve a system, an understanding of the system performance has to be made. Therefore, in a time study approach, the study tracks the behaviour of each instrument in the process. Breaking the process into parts makes the evaluation easier, by measuring their actual performance time then measuring the overall performance time of the system by adding each step to the other. Conducting the time study will help to correct and to eliminate the wasted time and the bottlenecks that may occur in the process [
24].
A time study was introduced by Frederick W. Taylor using a paper, pen, and stopwatch with a person observing the system, and can give a performance analysis for a simple production line [
25]. Moreover, this method would not be realistic for a complex production line, the solution is to use a monitoring program or software that gives a detailed report of system activities. The author stated that this report will show the problems and errors that occurred while the production line was performing. To detect the problem and identify the system failure, it is important to check the machines of the system individually.
The first step is to watch and observe the process to get familiar with the system. Setting beginning and ending points allows the system to be able to break down the process into single steps. It is important to record each step and label all the components of the system with a brief description. Any time study requires tools or software programs that are able to record the time data of the system accurately, in the case of using software, the appropriate time parameter has to be selected. Once the program is set, the step of collecting data follows. A second time observation of the process is required, paying attention to details of the bottlenecks and errors of each and every step while recording data. The last step is to analyse data recorded from the most to the least important of each part, making sure that the actual time is recorded to compare it with the standard operation time of the machine. Following these steps will help improve and optimize the system, which means both better performance and better product quality [
24].
1.4. Manufacturing Sustainability Improvement
According to The Organization for Economic Cooperation and Development (OECD), Sustainable manufacturing is a formal name for an exciting new way of doing business and creating value. It is behind many of the green products and processes in demand and celebrated around the world today [
26]. To put it simply, sustainable manufacturing is all about minimising the diverse business risks inherent in any manufacturing operation, while maximising the new opportunities that arise from improving your processes and products. OECD also defined seven steps to set up the requirements for sustainable manufacturing (
Table 1) [
27].
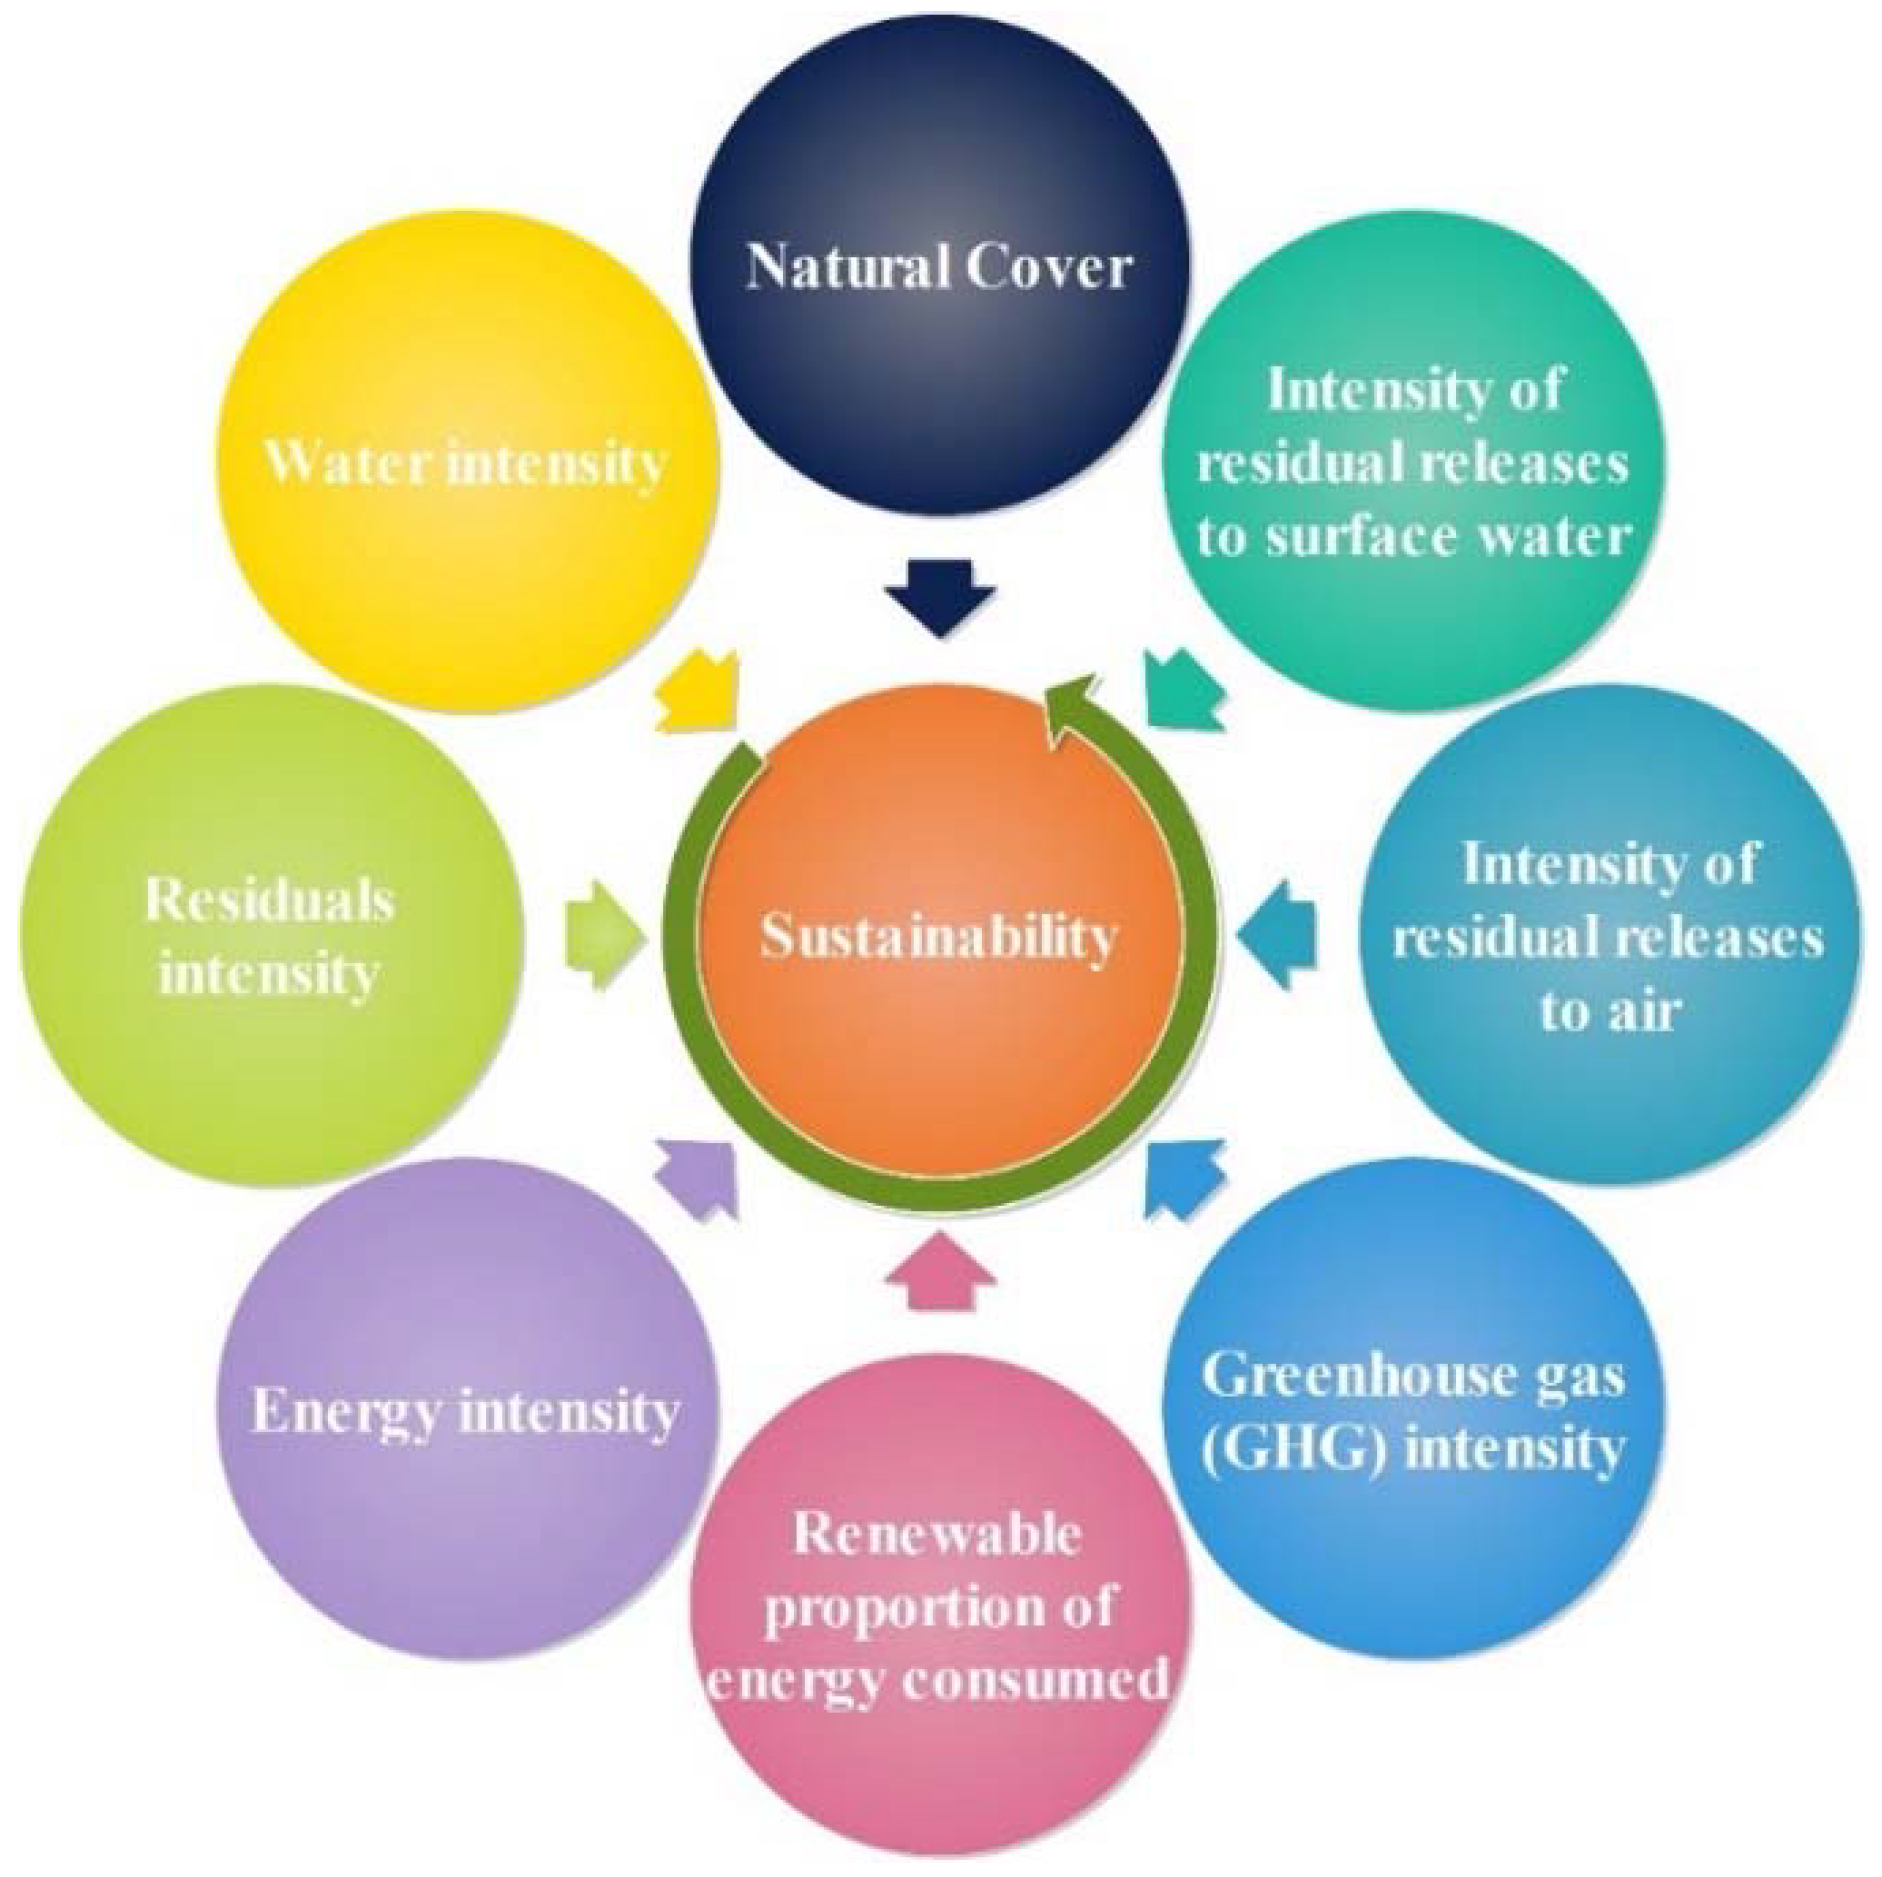
According to OECD, there are eight key factors that must be considered during the sustainability investigation (
Figure 1).
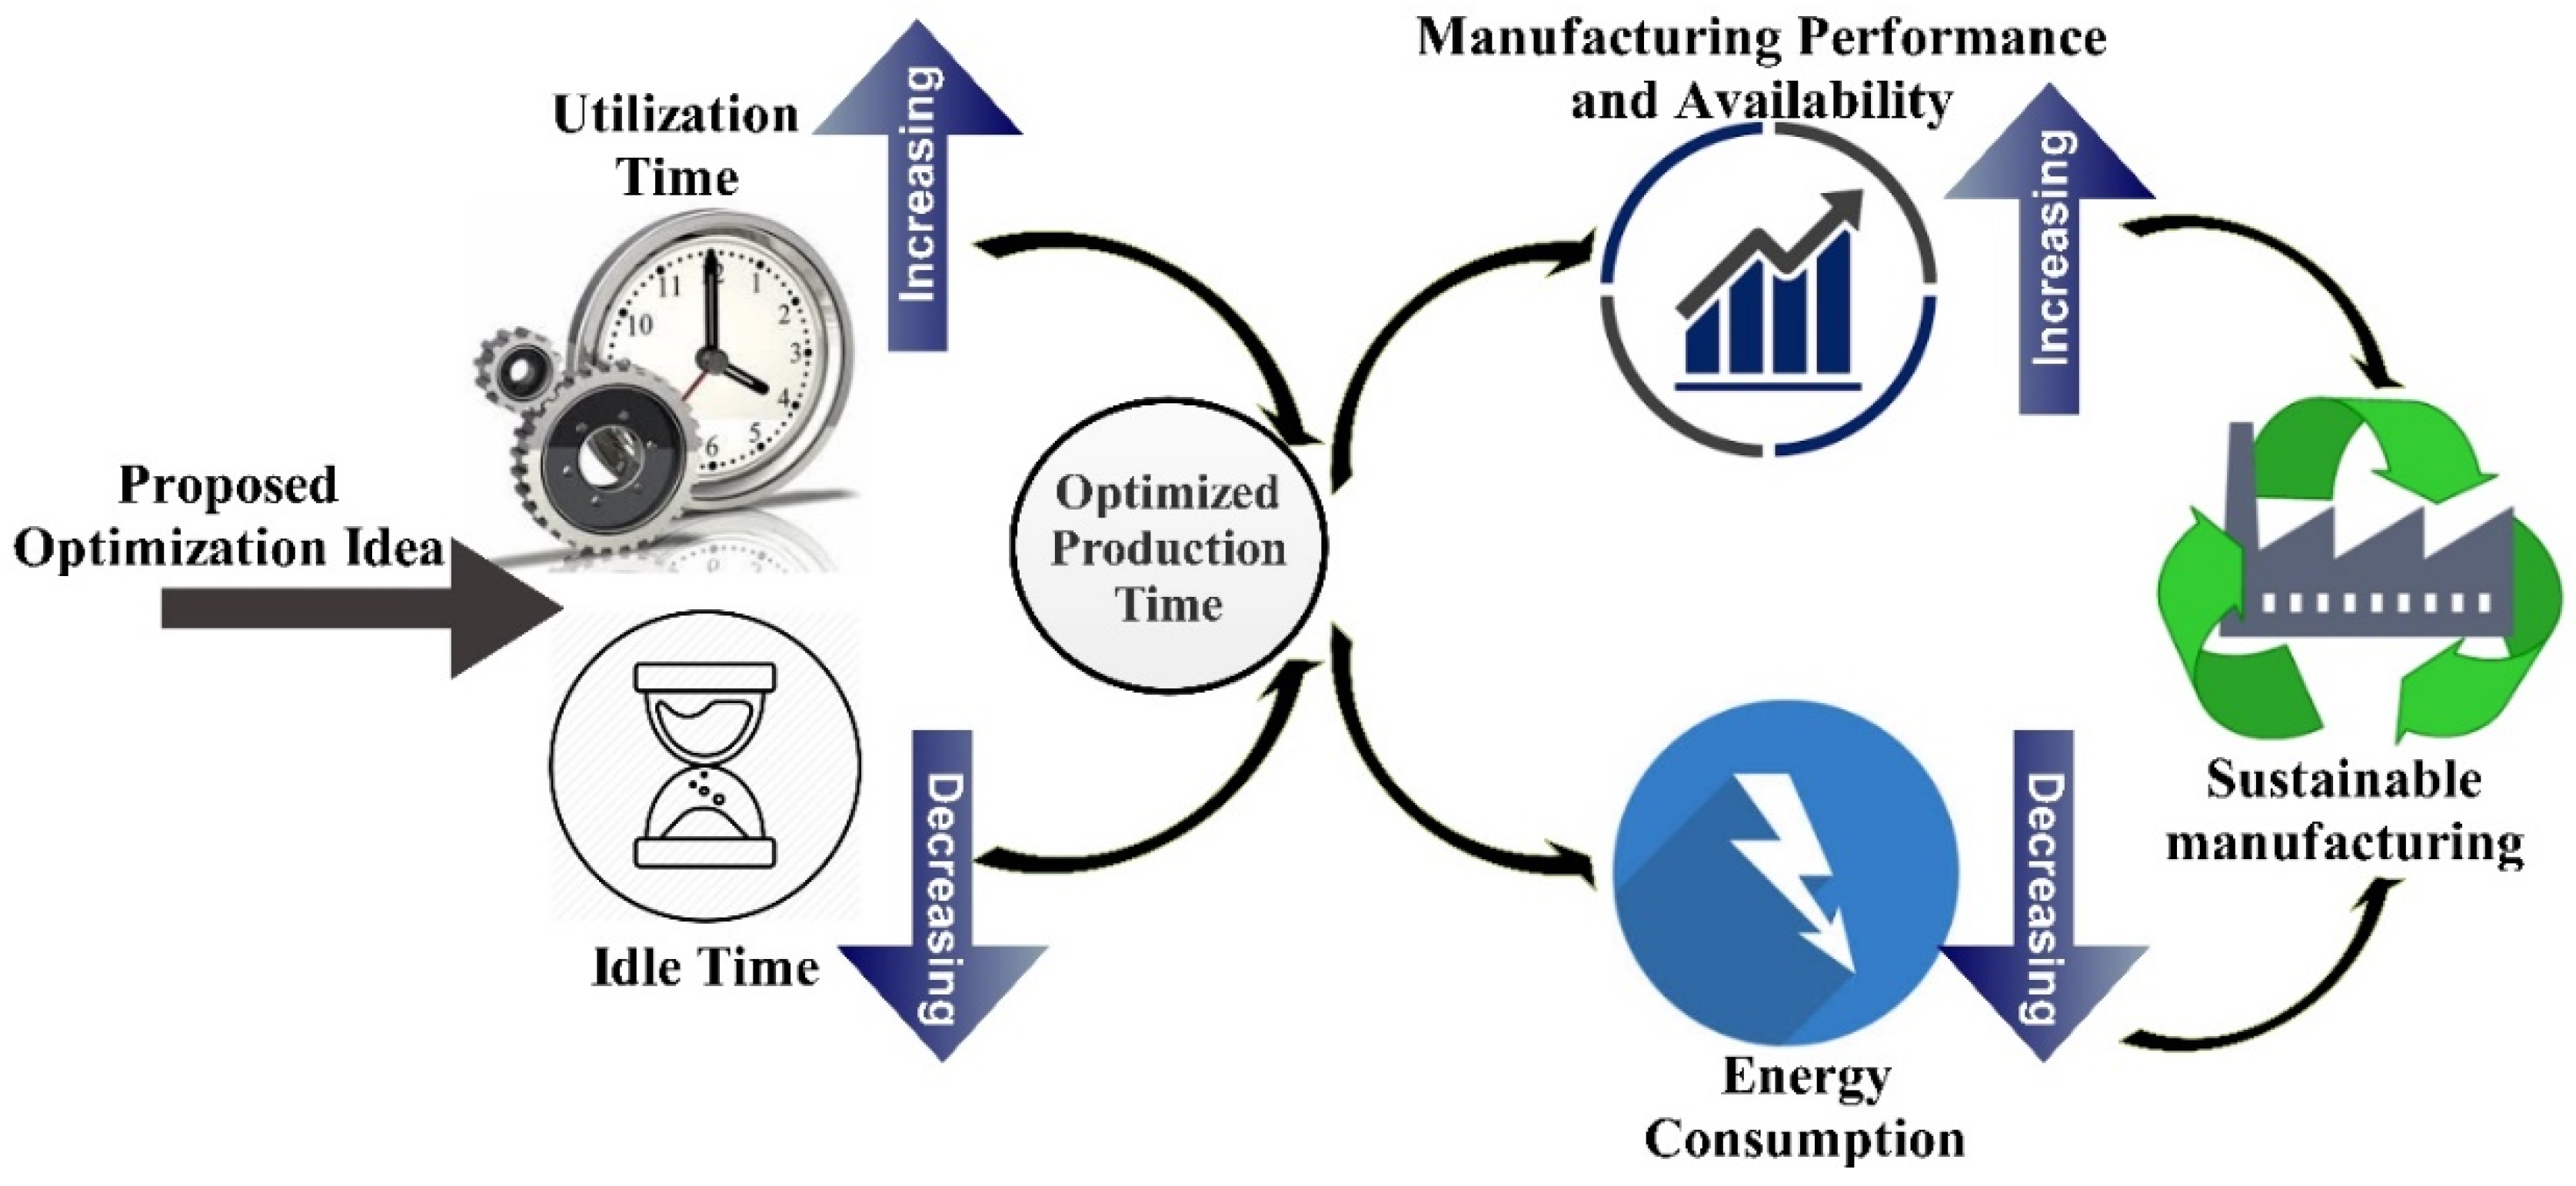
Based on the selected case study system and considering the properties of the functional devices and the defined scenario, the above figure will be simplified to the relationship of the manufacturing sustainability and energy intensity. This means, except for the energy consumption of the devices or the whole system, the other items are neglectable or satisfy the requirement of manufacturing sustainability.
Considering time as the main factor for efficiency or effectiveness (OEE) of an equipment or entire enterprise, a relationship between the time (overall production time, idle time, utilization time, etc.) and sustainability of the SMEs is the aim. However, to fully assess the energy-related efficiency or effectiveness of an equipment, the time-based view alone is not sufficient [
28]. Furthermore, current energy performance indicators are calculated through aggregate measures of energy consumption (e.g., kWh/month or kWh/part). In this section, a method will be added to the proposed methodology to define the relationship between energy consumption and time. The method is a designed device and facilitates the level of SMEs that is selected based on its major contribution to energy consumption and energy efficiency improvement potential, as emphasized by May et al. [
29]. The proposed method connects manufacturing states about energy consumption during a specific period (discrete or continuous time) to energy states about power requirement in Watt through cause–effect relationships. In this way, an action plan is proposed to reduce the entity of these variables for reducing both the amount of time spent and energy consumed.
This study sought to conduct an analytical system performance evaluation by utilizing a time study methodology on an intelligent material handling system for auto part distribution. The proposed methodology has been implemented in the German University of Technology in Oman (GUtech) [
30].
It is noticeable to mention that the system is a small-scale educational manufacturing system with a limited functionality period. Because of utilizing educational equipment to create the system and implement the proposed methodology, system observation and data collection are conducted in a short period of time to prevent any system damage. However, any physical system damage can affect system performance. Thus, all the evaluations and observations and their outcomes have been done in a short period of time and have been expanded theoretically over a long period.
The challenges faced in the implementation of the system and performance evaluation practices are defined in detail. This study used a descriptive methodology for the industrial category target including all of the small and medium enterprises (SMEs). The case study system is an example of an SME with a simple manufacturing system. The research conducted to provide a solution for SMEs to make smooth implementation of a sustainable, intelligent manufacturing system considering the Industry 4.0 preparation requirements. To reach to this goal, OEE standard have been proposed to evaluate the system and provide the required data, which takes into consideration the aim to maintain and improve the sustainability of the system. Thus, a relationship between OEE and manufacturing sustainability has been provided.
The study made use of devices’ utilization time as the key to measure performance. Quantitative required data were collected using Protime Estimation software as the time study tool. In addition, the study conducted an overall equipment effectiveness (OEE) standard analysis to determine the performance evaluation in such material handling systems for SMEs. Finally, the effect of time on energy consumption and sustainability of the system have been investigated.
The study established that considering the time as the key determines most of the hardware, software (control architecture), and layout design problems and limitations. All the system problems, limitations, and solutions, and any possible changes in system performance, are detected from time study results analysis. The study concludes that there will be improvements both partially and overall in the system performance; especially, modification in hardware, software, and layout design of the system were described as solutions. The study also verified the visually observed problems and limitations by time study results.
Finally, by considering the sustainable manufacturing key factors, proper solutions have been suggested to highlight the importance of the result obtained by the proposed methodology and optimization idea on manufacturing sustainability.
2. System Description
In order to implement an intelligent material handling system, a comprehensive layout design including the required resources to accomplish target specific tasks is needed.
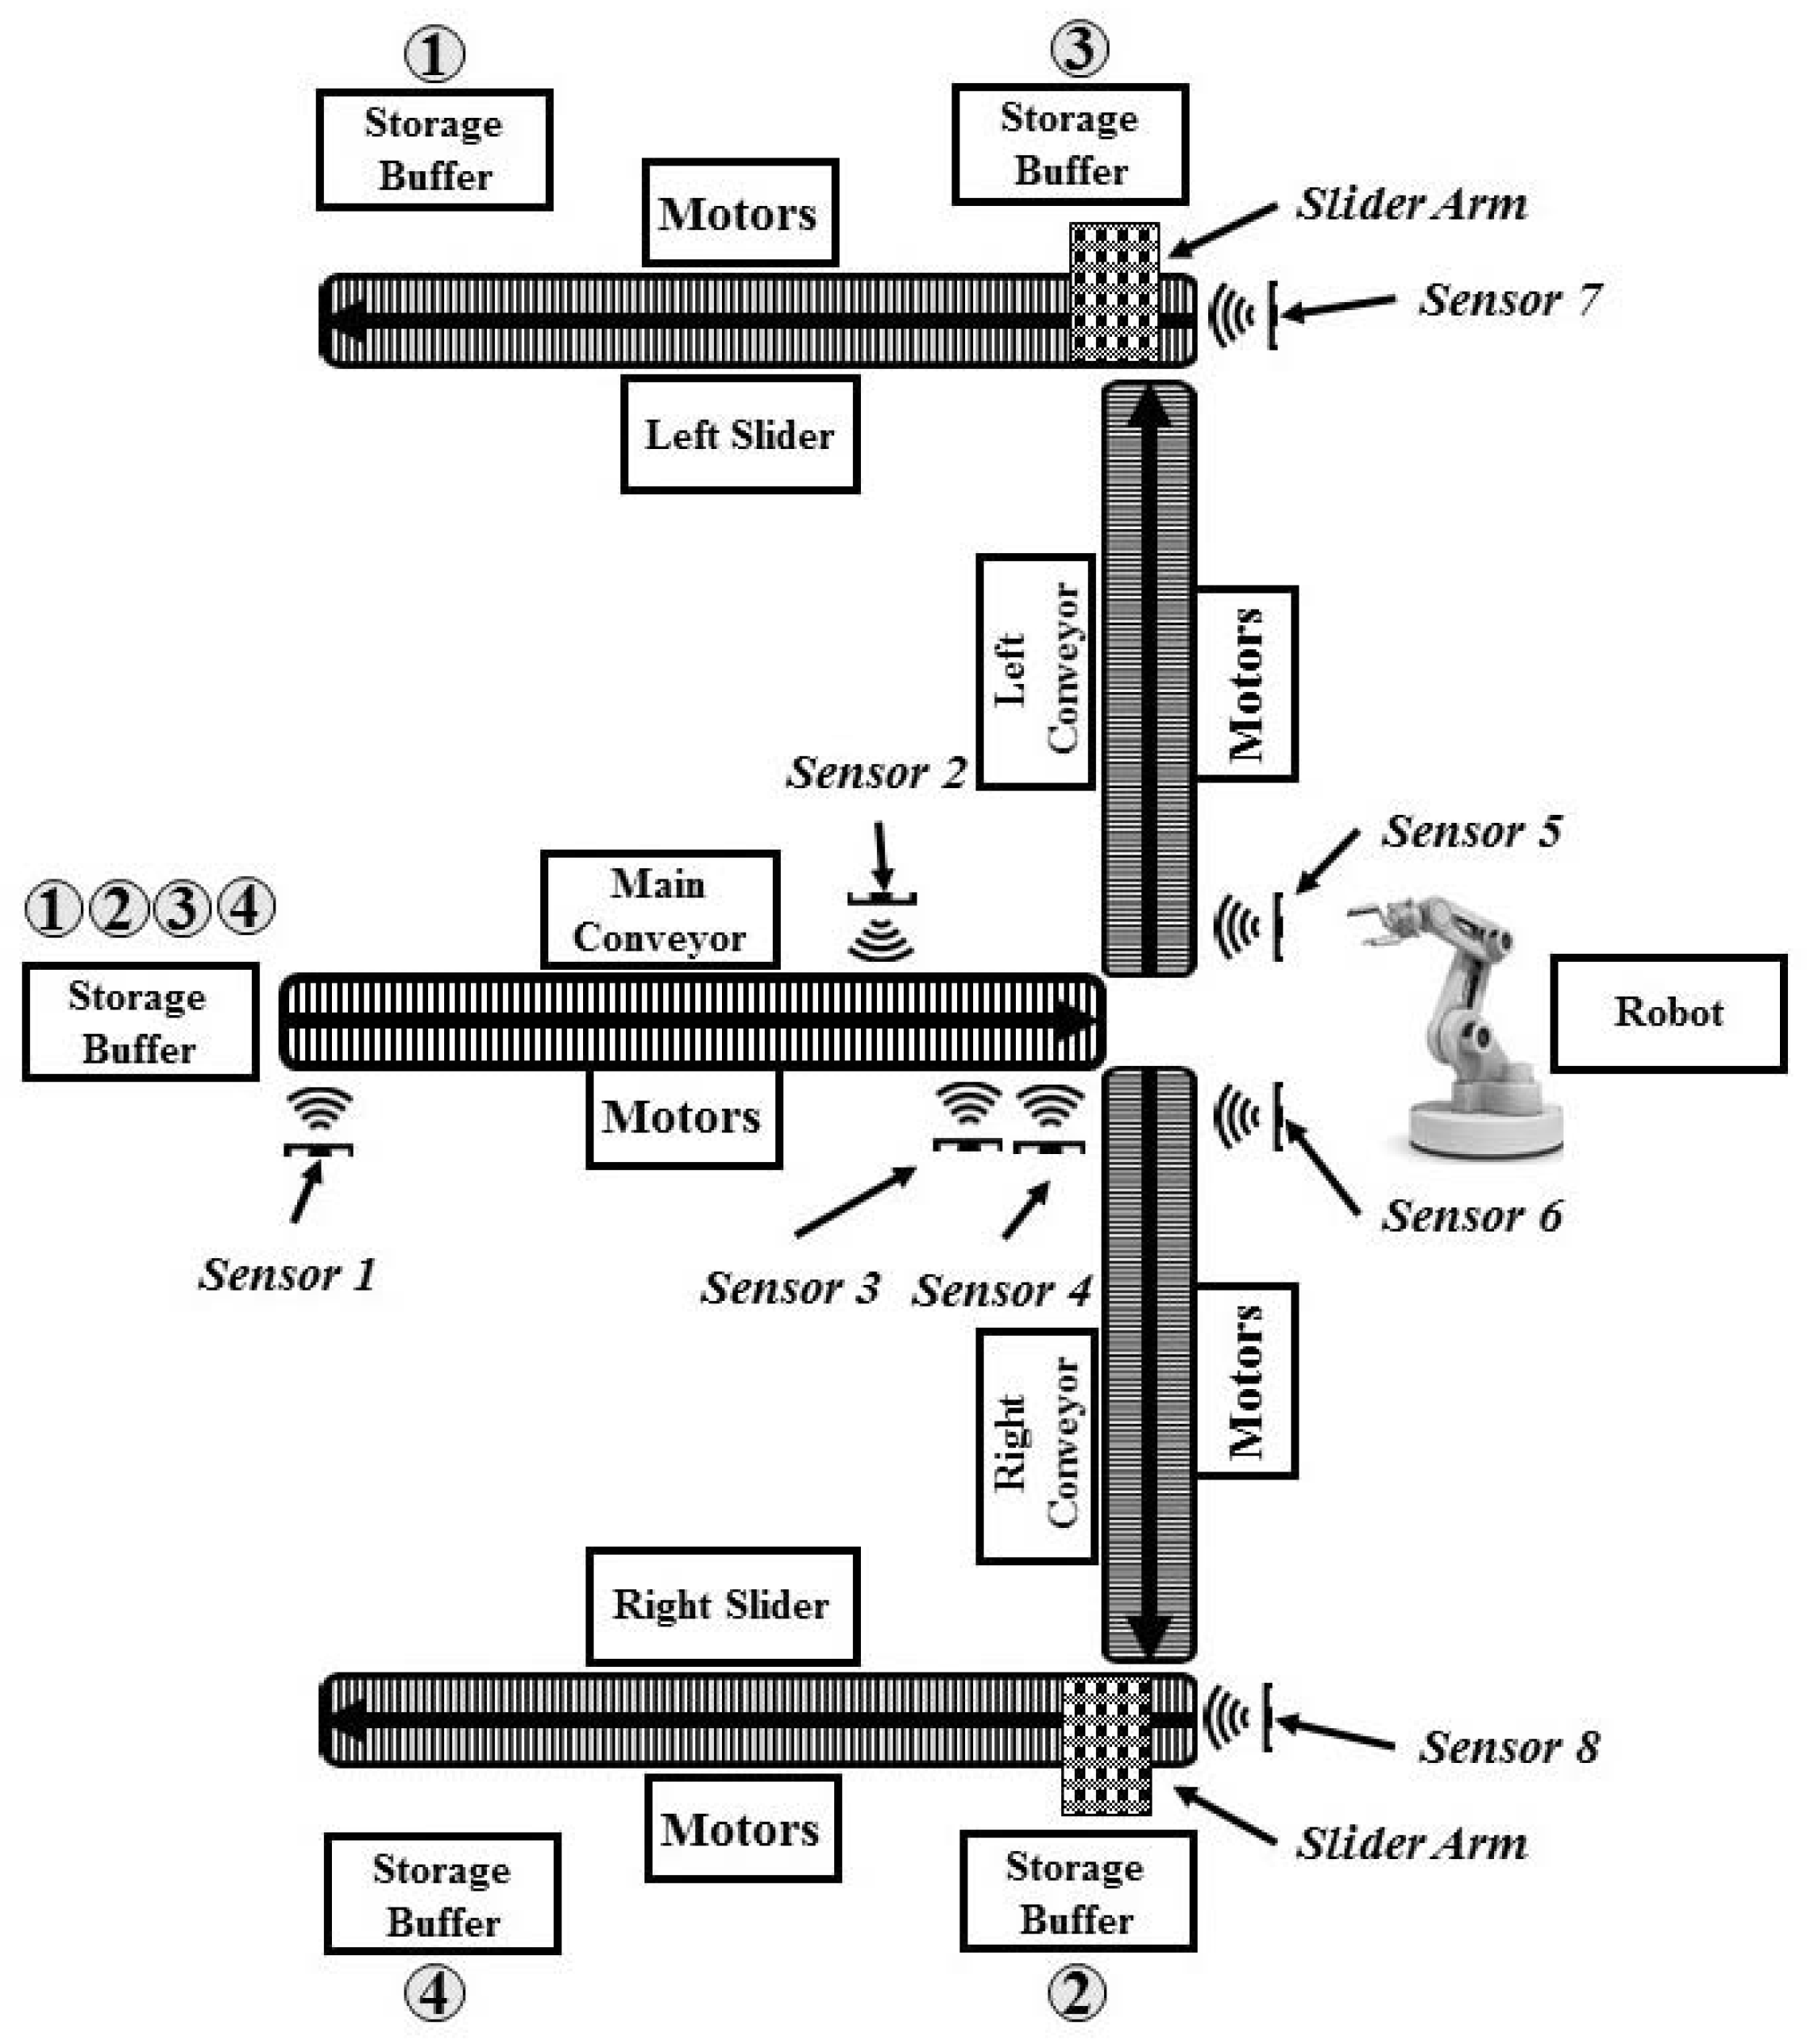
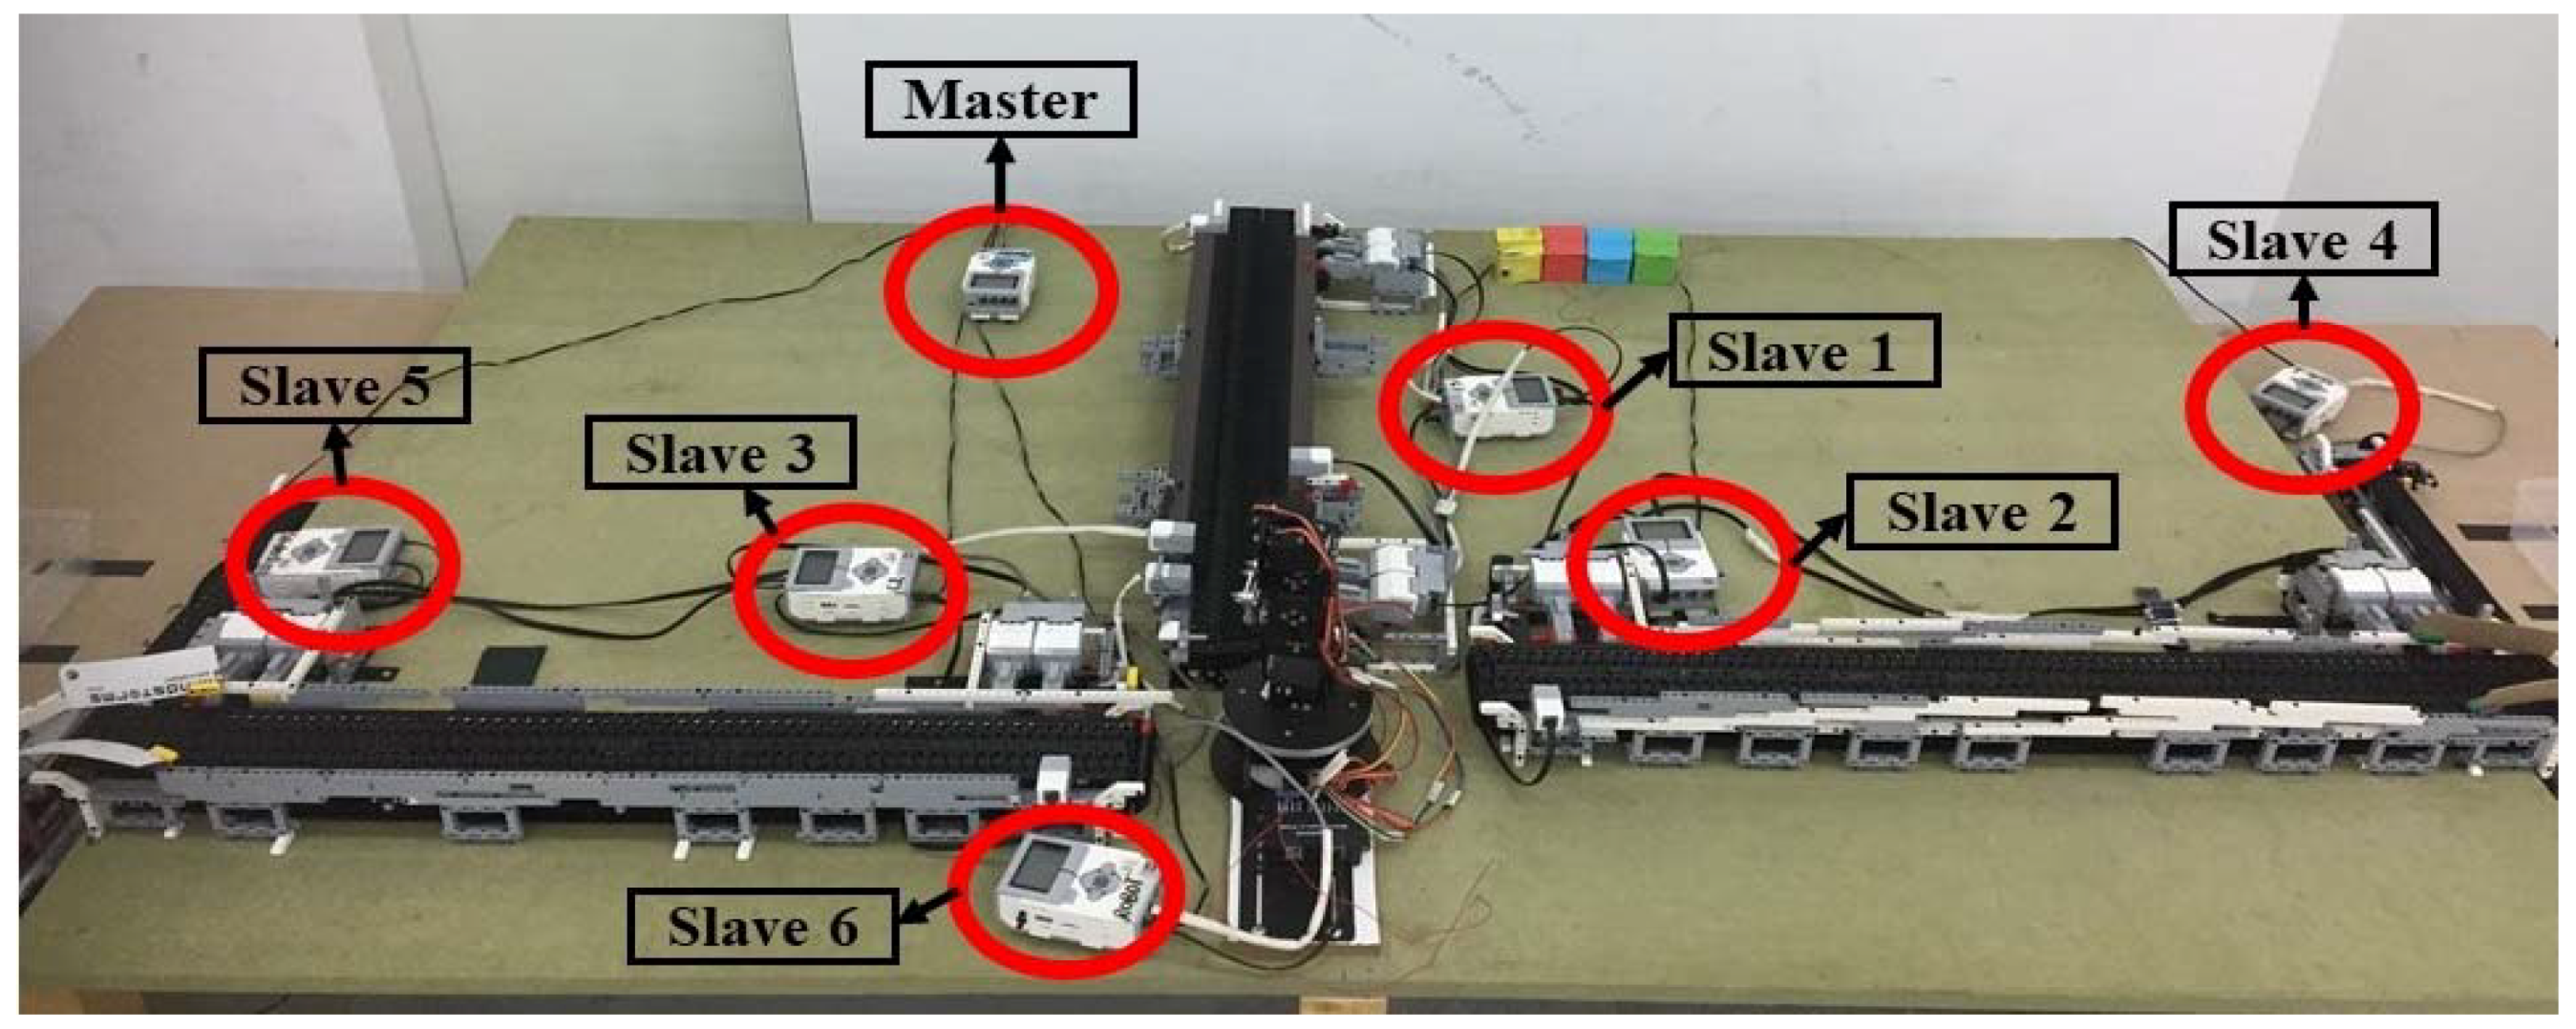
Figure 2 illustrates the system layout design. The system consists of a main conveyor including four sensors, a robot arm, two side conveyors (left and right) including a motion sensor, and two sliders (left and right) including a color sensor. The main and side conveyors are powered by two sets of motors (four motors) and sliders are powered by one motor each. Motors on conveyors and robot’s servo motors are controlled by bricks (controllers) called “slaves”. The slaves receive signals from sensors as input to give an output that is commended to motors. The system has an agent-based control architecture in which slaves are operating and controlling the system after confirmation of the main control unit (master). The master control unit includes the main input–output logic of the system and related resources.
Each slave in the system is considered to be an agent including agent software. Slaves (agents) operate and communicate in the system by means of sensors and actuators. A slave with its software agent perceives or communicates with other software entities in other agent via Bluetooth, which do not act to pursue a specific objective, but only to satisfy requests. The master agent may delegate a task to a slave agent. Master and slaves communicating with each other happens when performance of a task needs confirmation of master more than the slave’s communications.
Referring to
Figure 2, the system can be divided into four main phases. The first phase comprises four sensors, the object’s storage (red, blue, yellow, and green) buffer, the main conveyor, and slave 1. Phase 2 consists of the robotic arm and slave 6. Phase 3 and phase 4 are similar except that they are in the opposite direction and are assigned for handling different objects. Both phases consist of two slider units integrated with a color sensor and controlled by slaves (slave 4 for the right side and slave 5 for the left side), two conveyors integrated with a motion sensor and controlled by slaves (slave 2 for right and slave 3 for left side) and unloading buffers. The unloading buffers are the exits of the system, in which objects are going to be stored separately in each of them based on their color and the scenario.
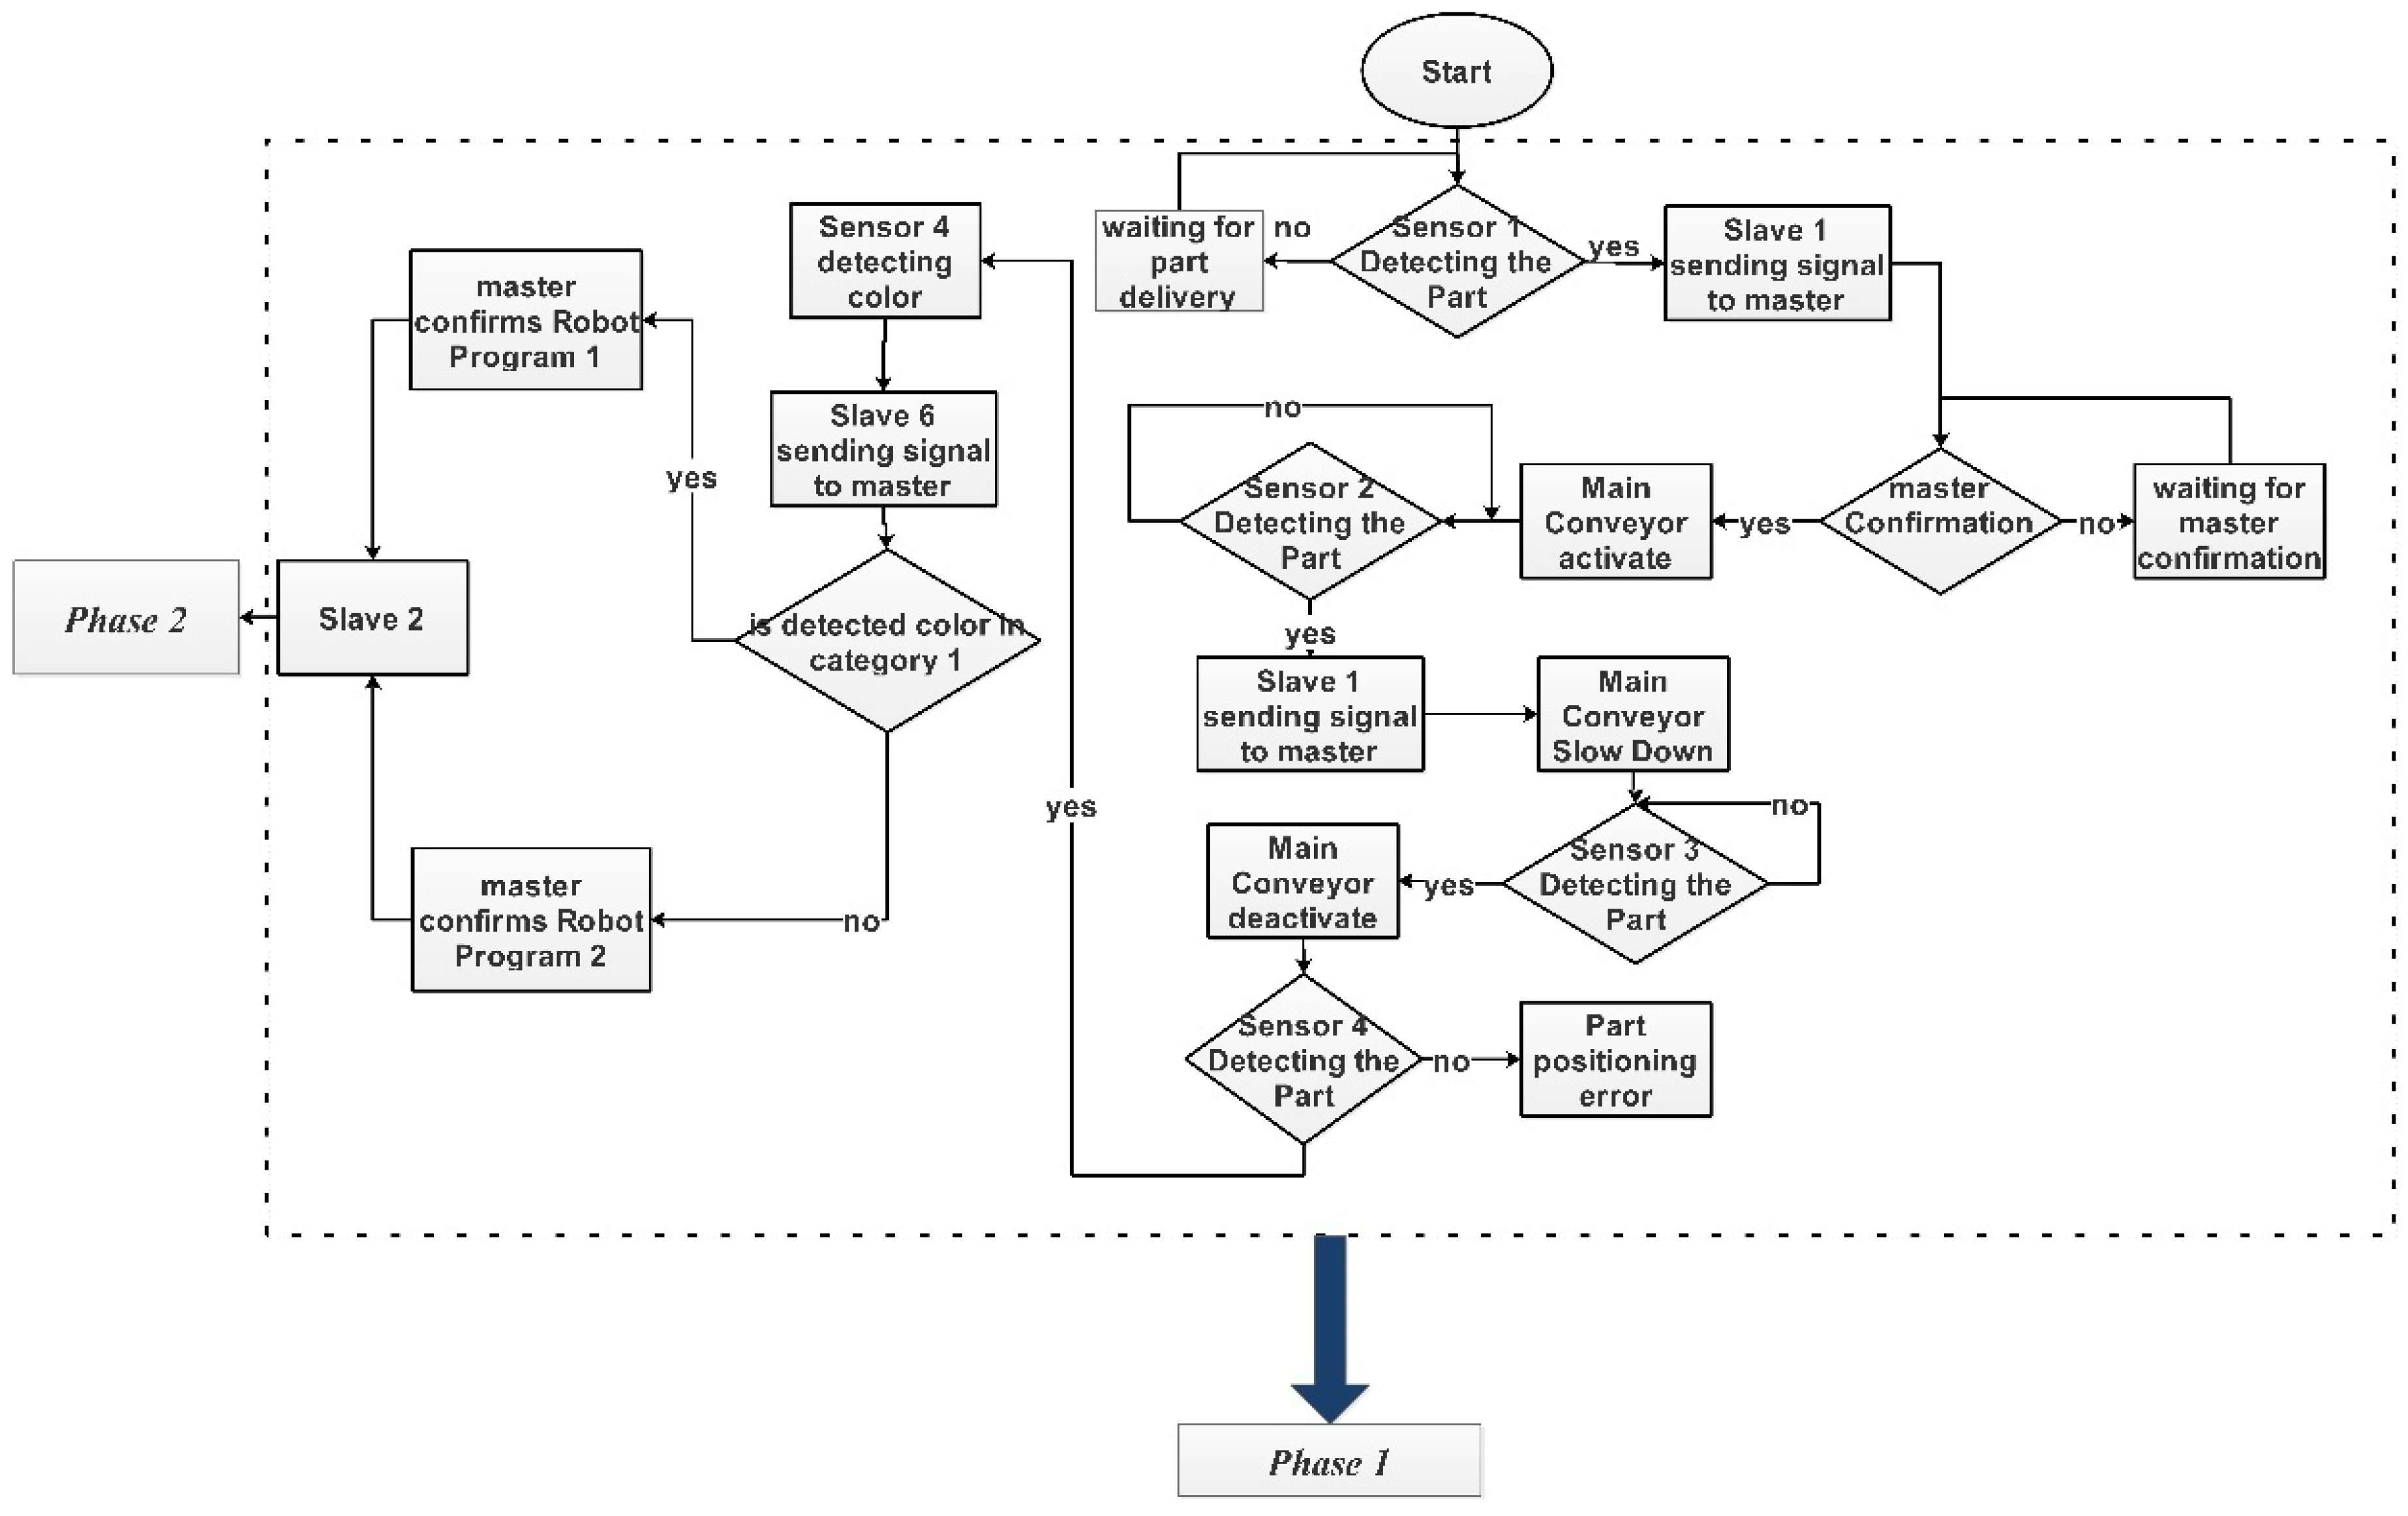
Each phase in the system has a different functionality and control architecture. In the first phase, sensor 1 is utilized to initialize the conveyor. Sensor 2 is added to the system to slow down the conveyor motion. It is thus essential to have sensor 2, because without this sensor, the conveyor will move at a high speed at a critical point and will be difficult to control. In addition, sensor 3, which is used to stop the motion of the conveyor, will not have enough delay to detect the presence of the object. The robotic arm is programmed to pick the material in a specific position. Therefore, if the object is being stopped at a different position, the robotic arm will not be able to pick it up accurately. Hence, it is necessary to slow down the main conveyor motion by sensor 2, and eventually, sensor 3 will be able to stop the conveyor and object in the exact desired position (
Figure 3).
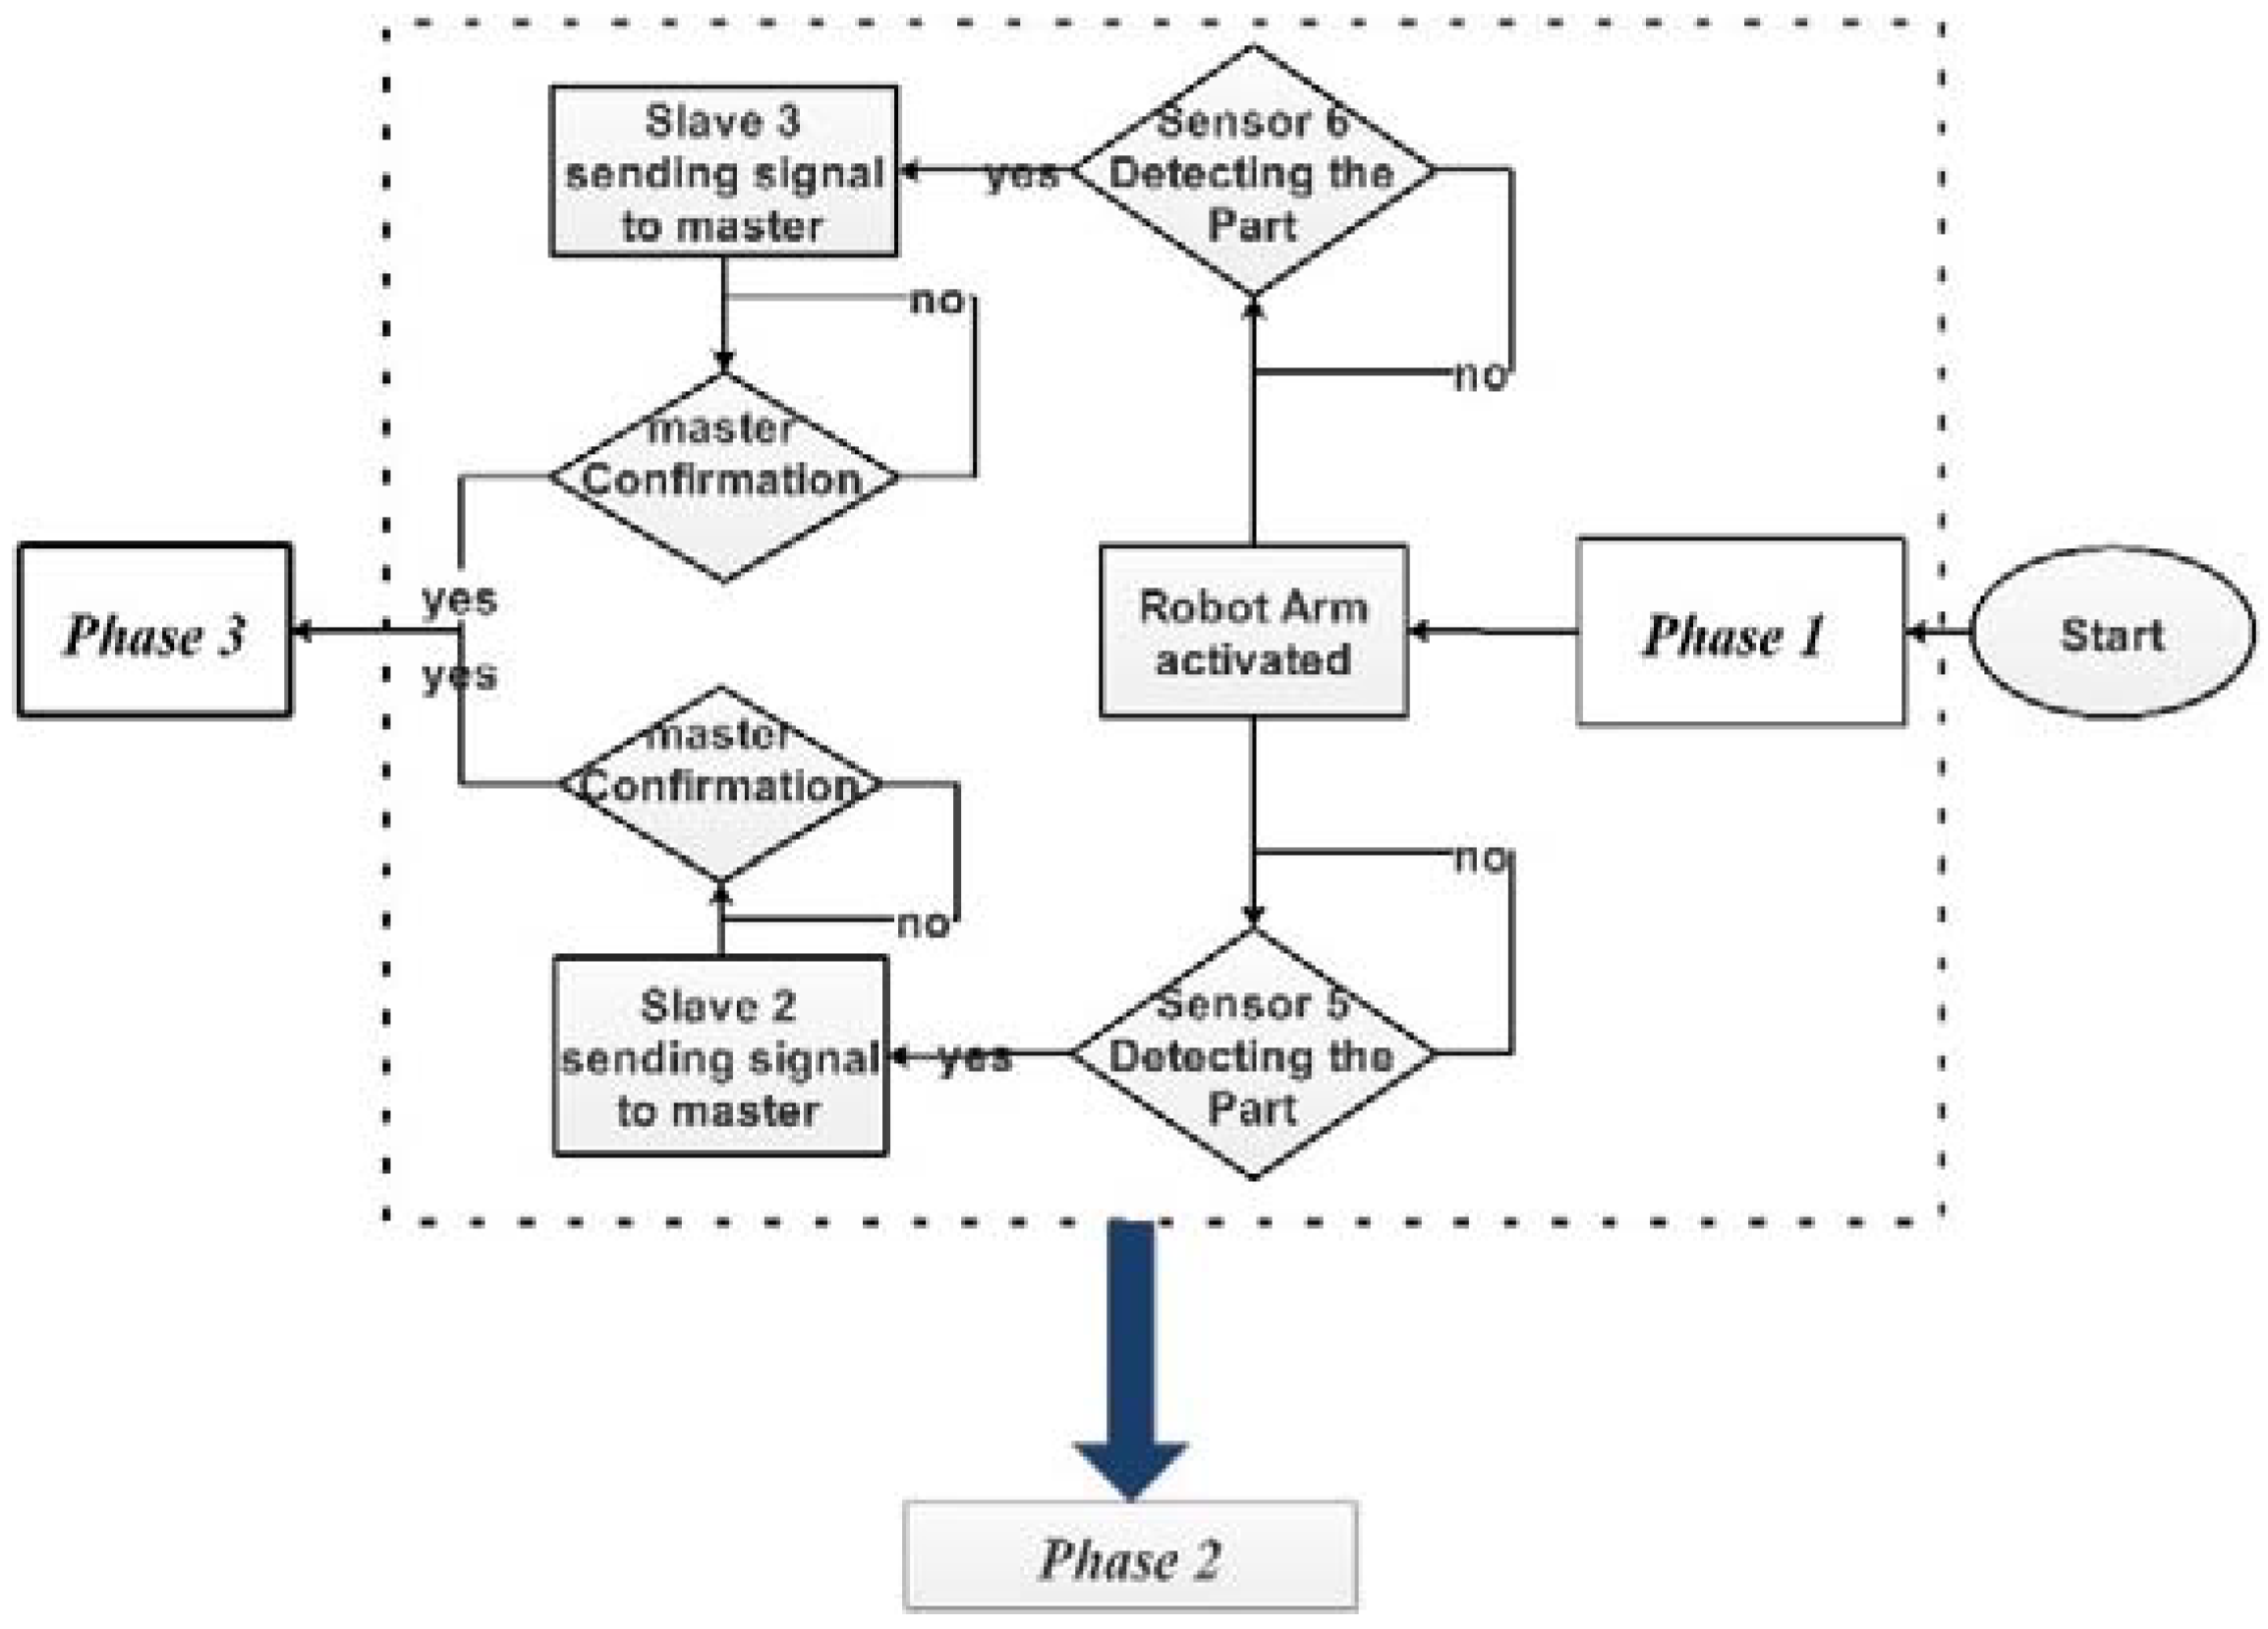
Phase 2 consists of a robot arm. This robot arm’s job is to pick the object from main conveyor and place it either on right or left conveyor depending on the colors and the considered scenario for that color (
Figure 4).
In phase 3 and phase 4, the sensors are added at the beginning of the conveyors. These sensors are used to start the motion of the conveyors. However, for these two phases, there is no sensor where it stops (
Figure 5). As the object should slide to the slider for differentiation based on their color; once the object slides to the slider, the sensor on the slider will distinguish which color it detects. According to that, it will distribute it to the considered buffer (
Figure 5).
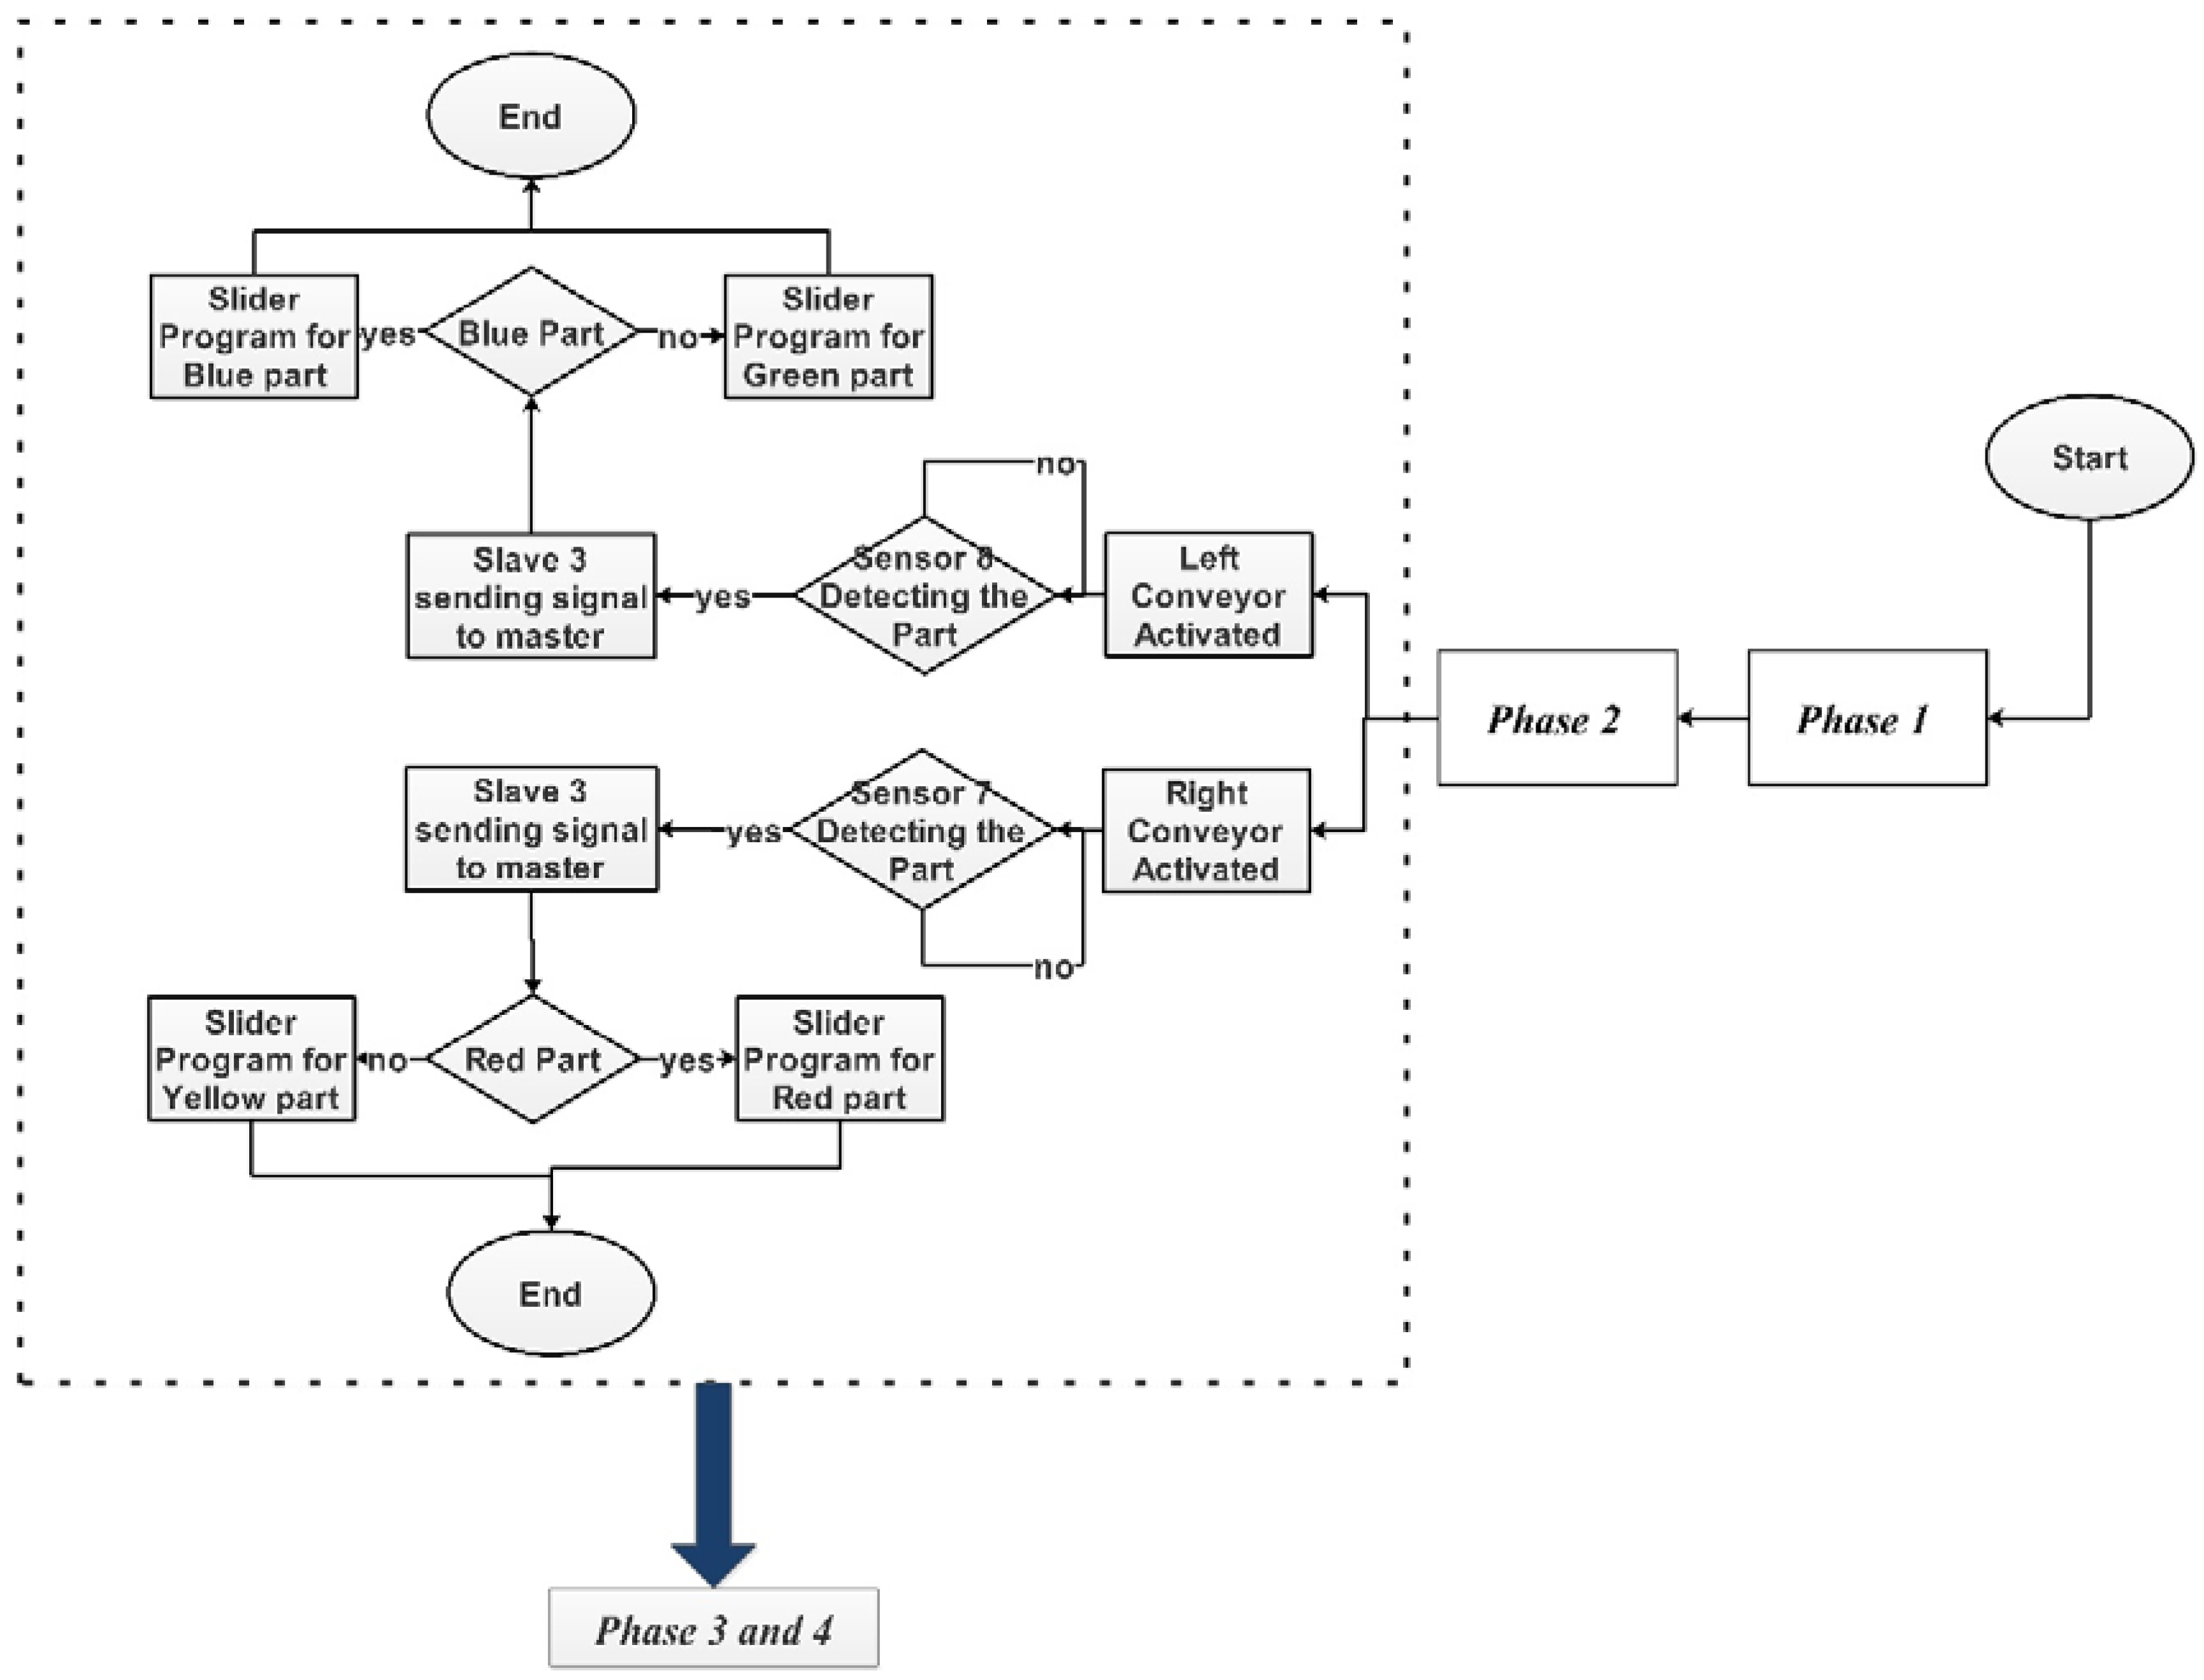
The aim to define the system with agent-based control architecture is limited to prevent bottleneck and resource conflict issues during system performance. In order to achieve this goal, slaves and the master are in continuous communication. The master can control the slaves’ functionality based on the defined scenario to prevent any overlapping and conflict between the phases. For instance, slave 1 on the main conveyor activates the conveyor for the first time and waits for master for reactivation of the next part. In the system control architecture, it is defined that master will not give the confirmation signal to slave 1 before placing the part on side conveyors and activating slave 2 or 3 accordingly (
Figure 6).
3. Methodology
The system is subjected to a time study test in the ProTime estimation program to evaluate each part of the process. The aim to do time study on the system is to obtain the utilization time of each resource and a comprehensive comparison between the resources with the same functionality to record the individual time study result. A time study result of the system shows the individual and overall system performance; limitations; and hardware, software, and layout design problems. These achievements out of time study help to find the proper optimization methods to improve the performance of the system.
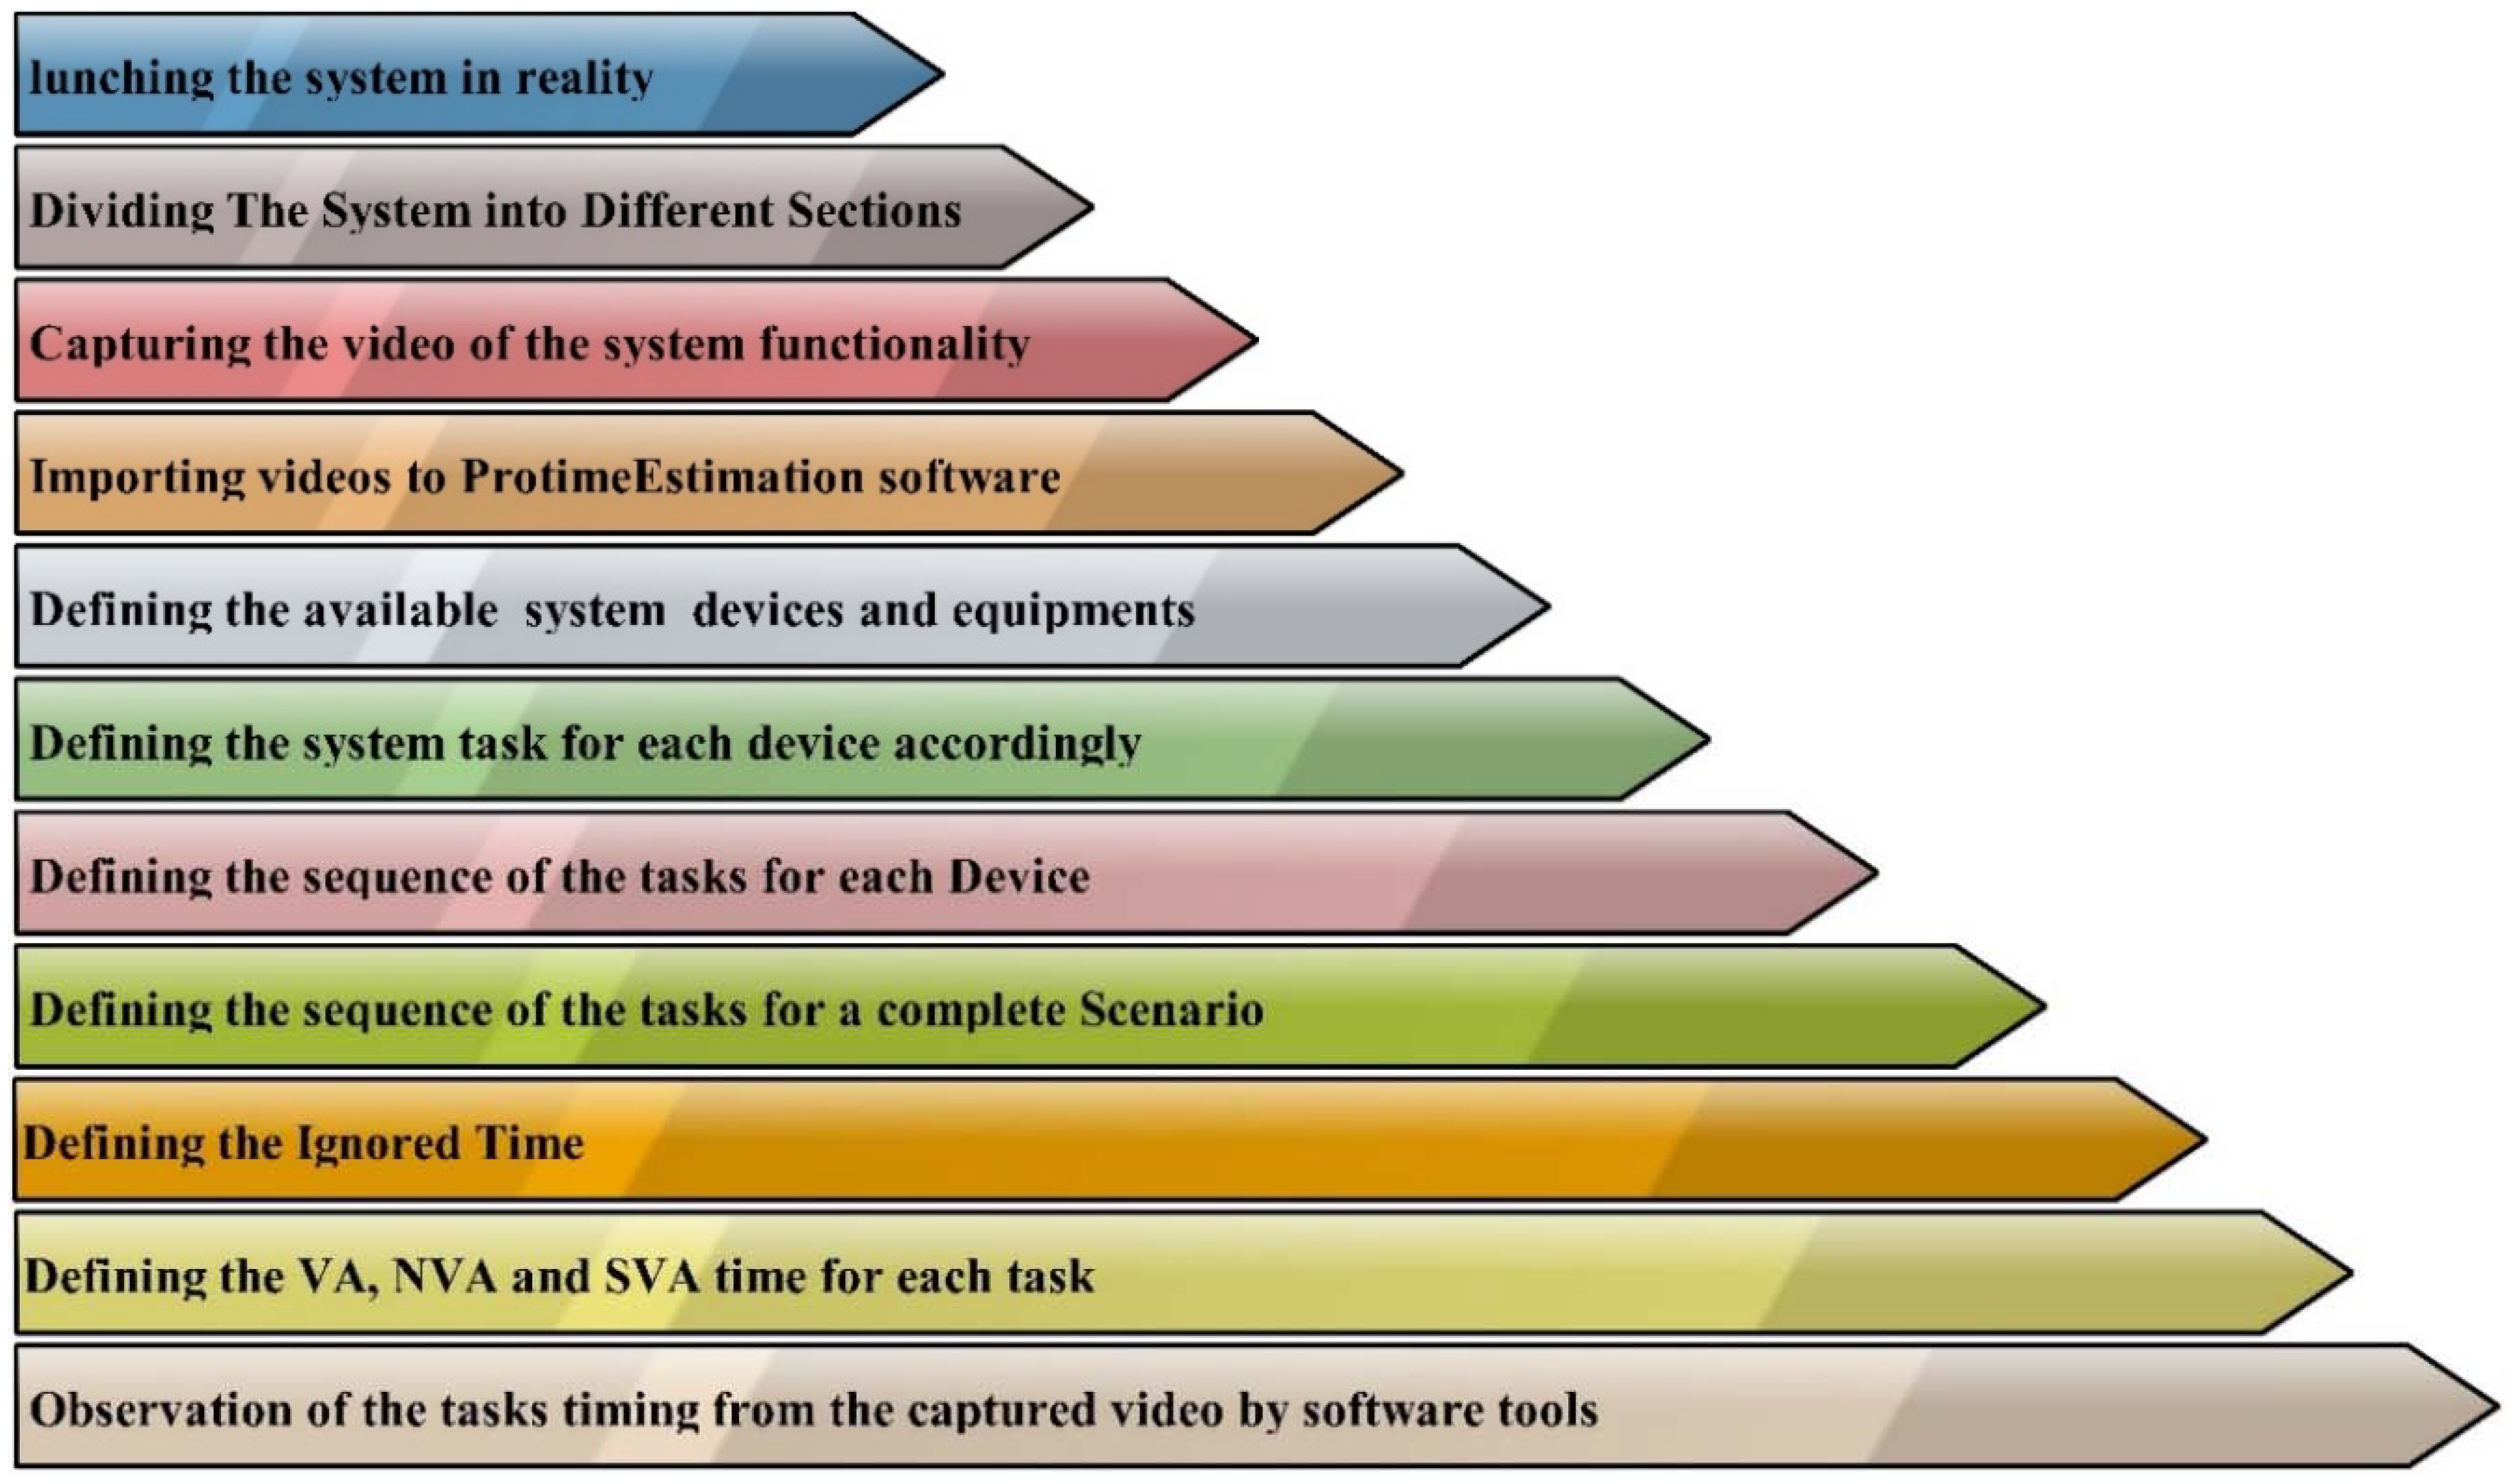
Figure 7 illustrates the process for generating the time study report of the system using the ProTime estimation software. Three different views for videos capturing were chosen (right, left, and front view). The videos were uploaded to the software. The time study was performed using the mentioned methodology, where each recorded video was uploaded in the software, and for each video, the mentioned steps were followed for creating the time study reports (
Figure 7).
The observed time study report for each section was generated for each object (material) individually. Data from each section of the study (left, right, and front) were combined to generate a comprehensive time study of the system.
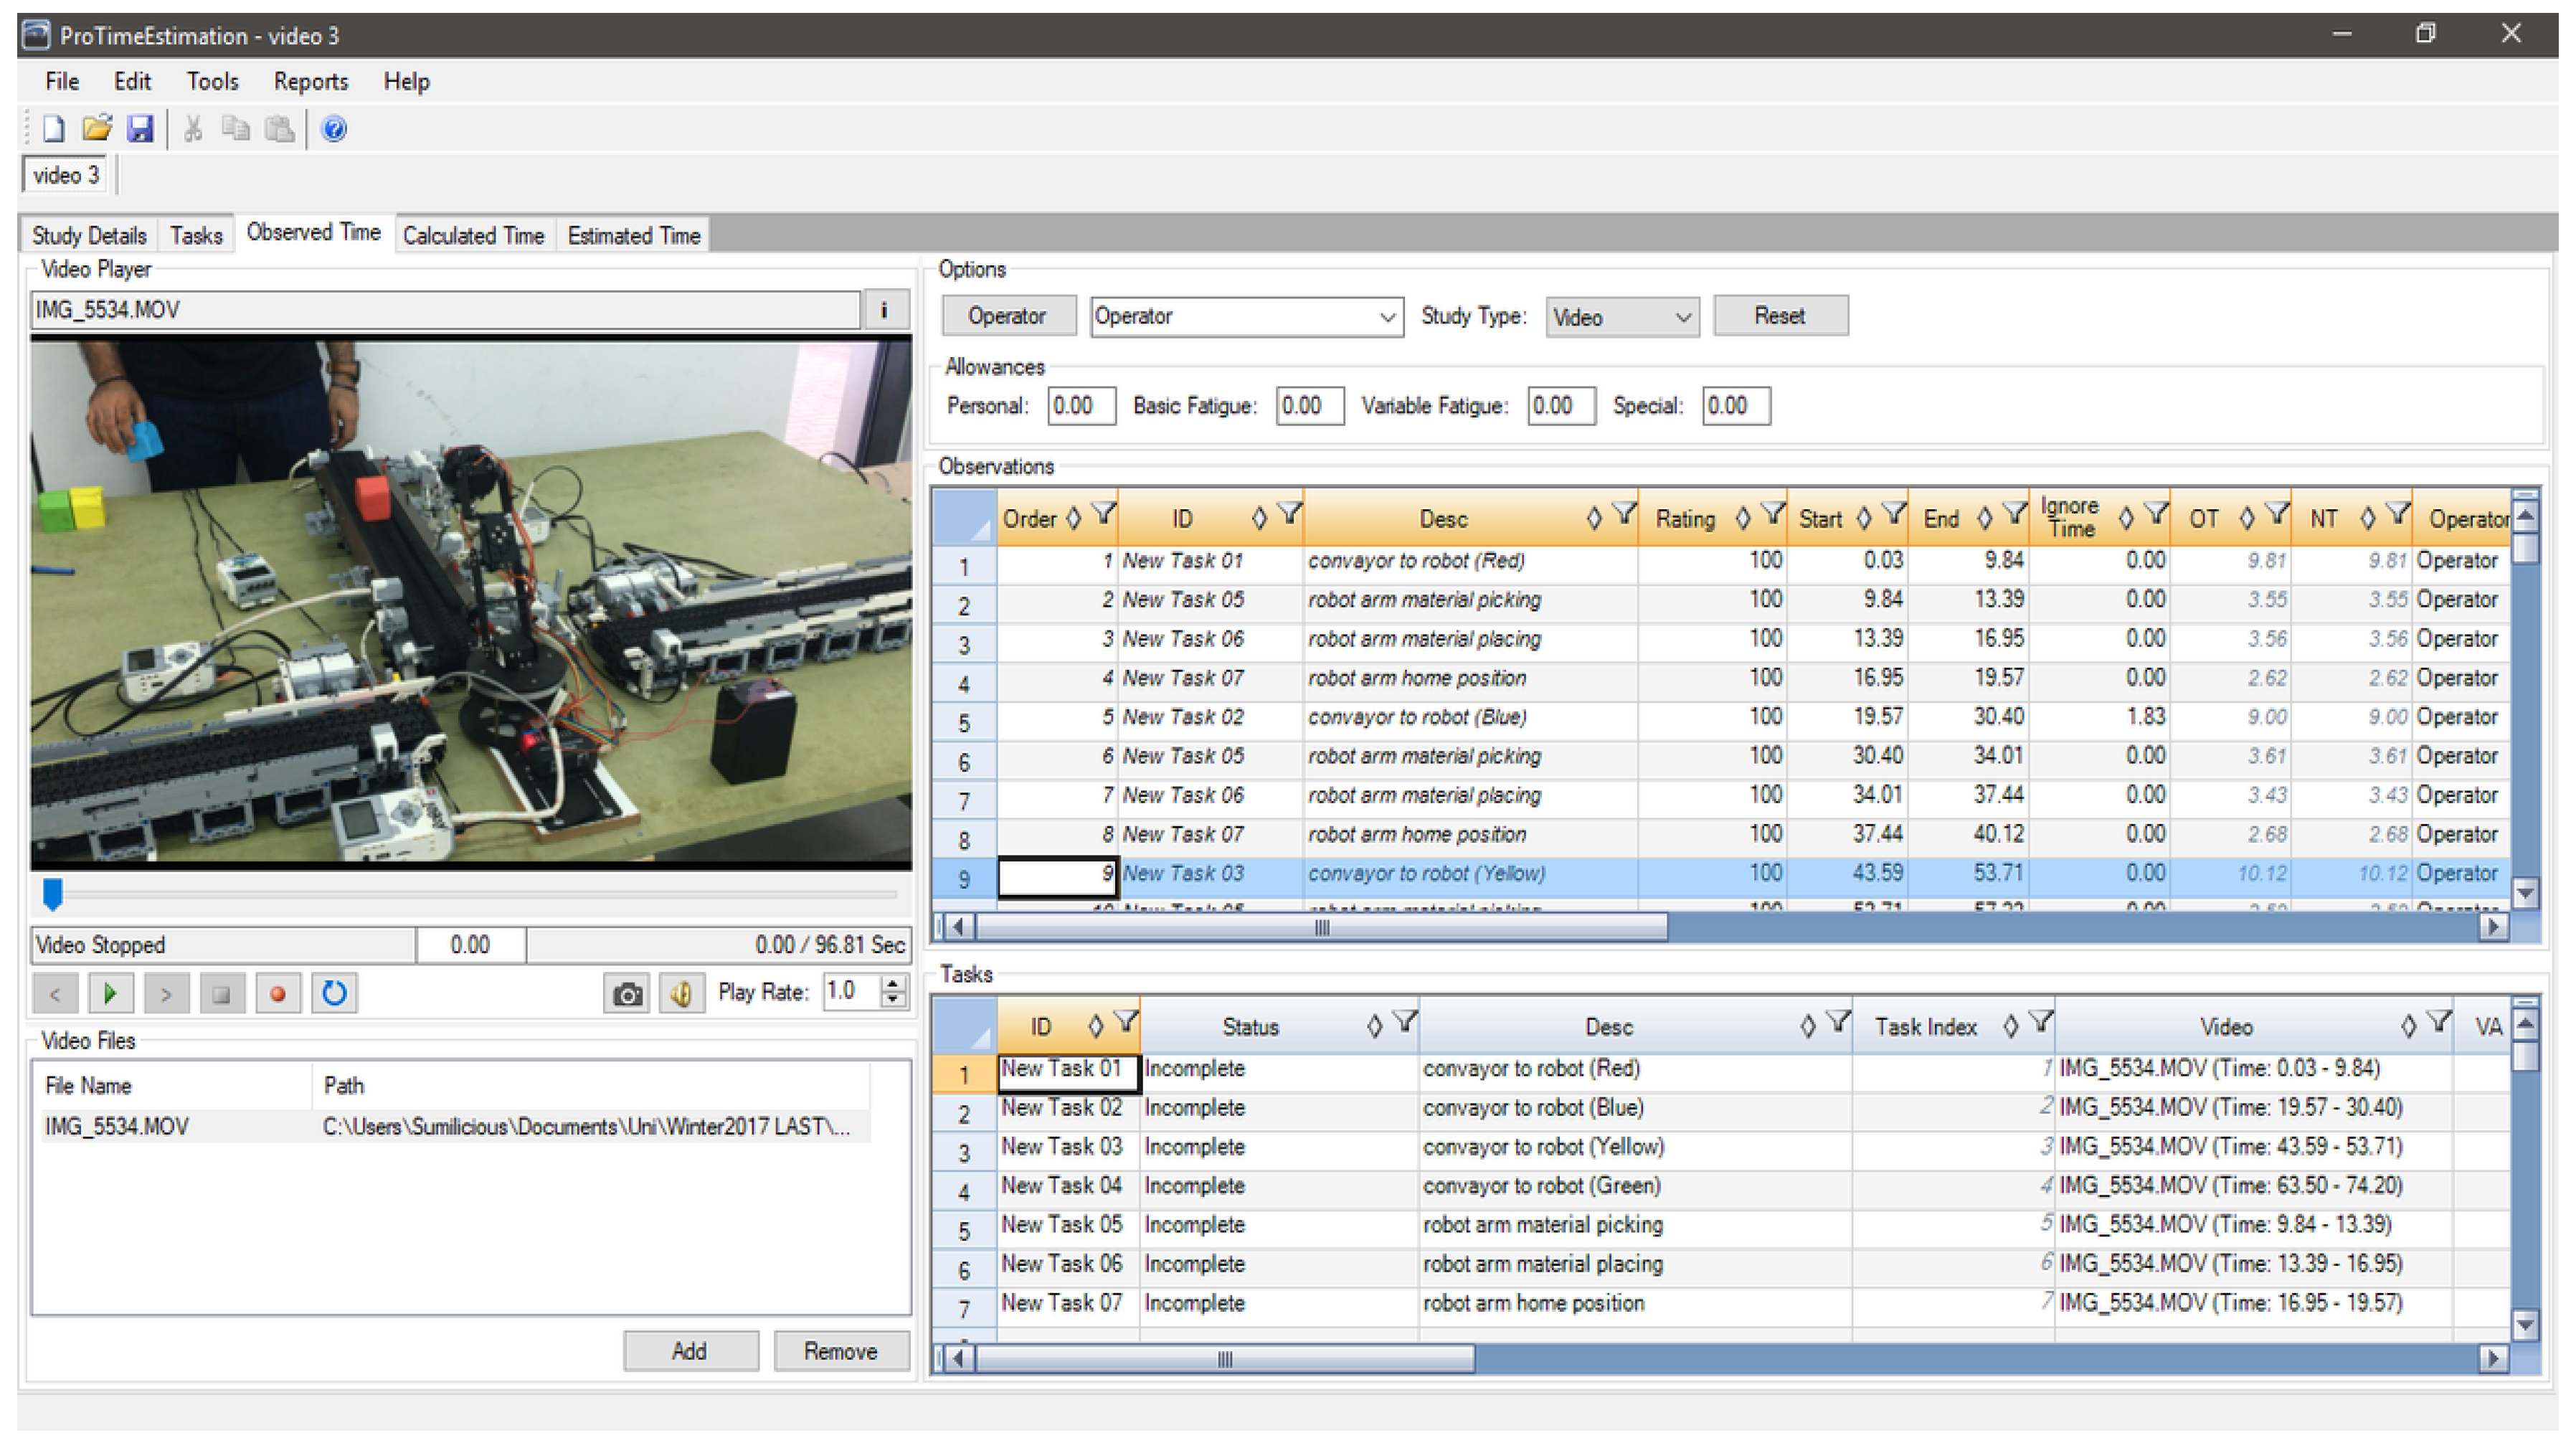
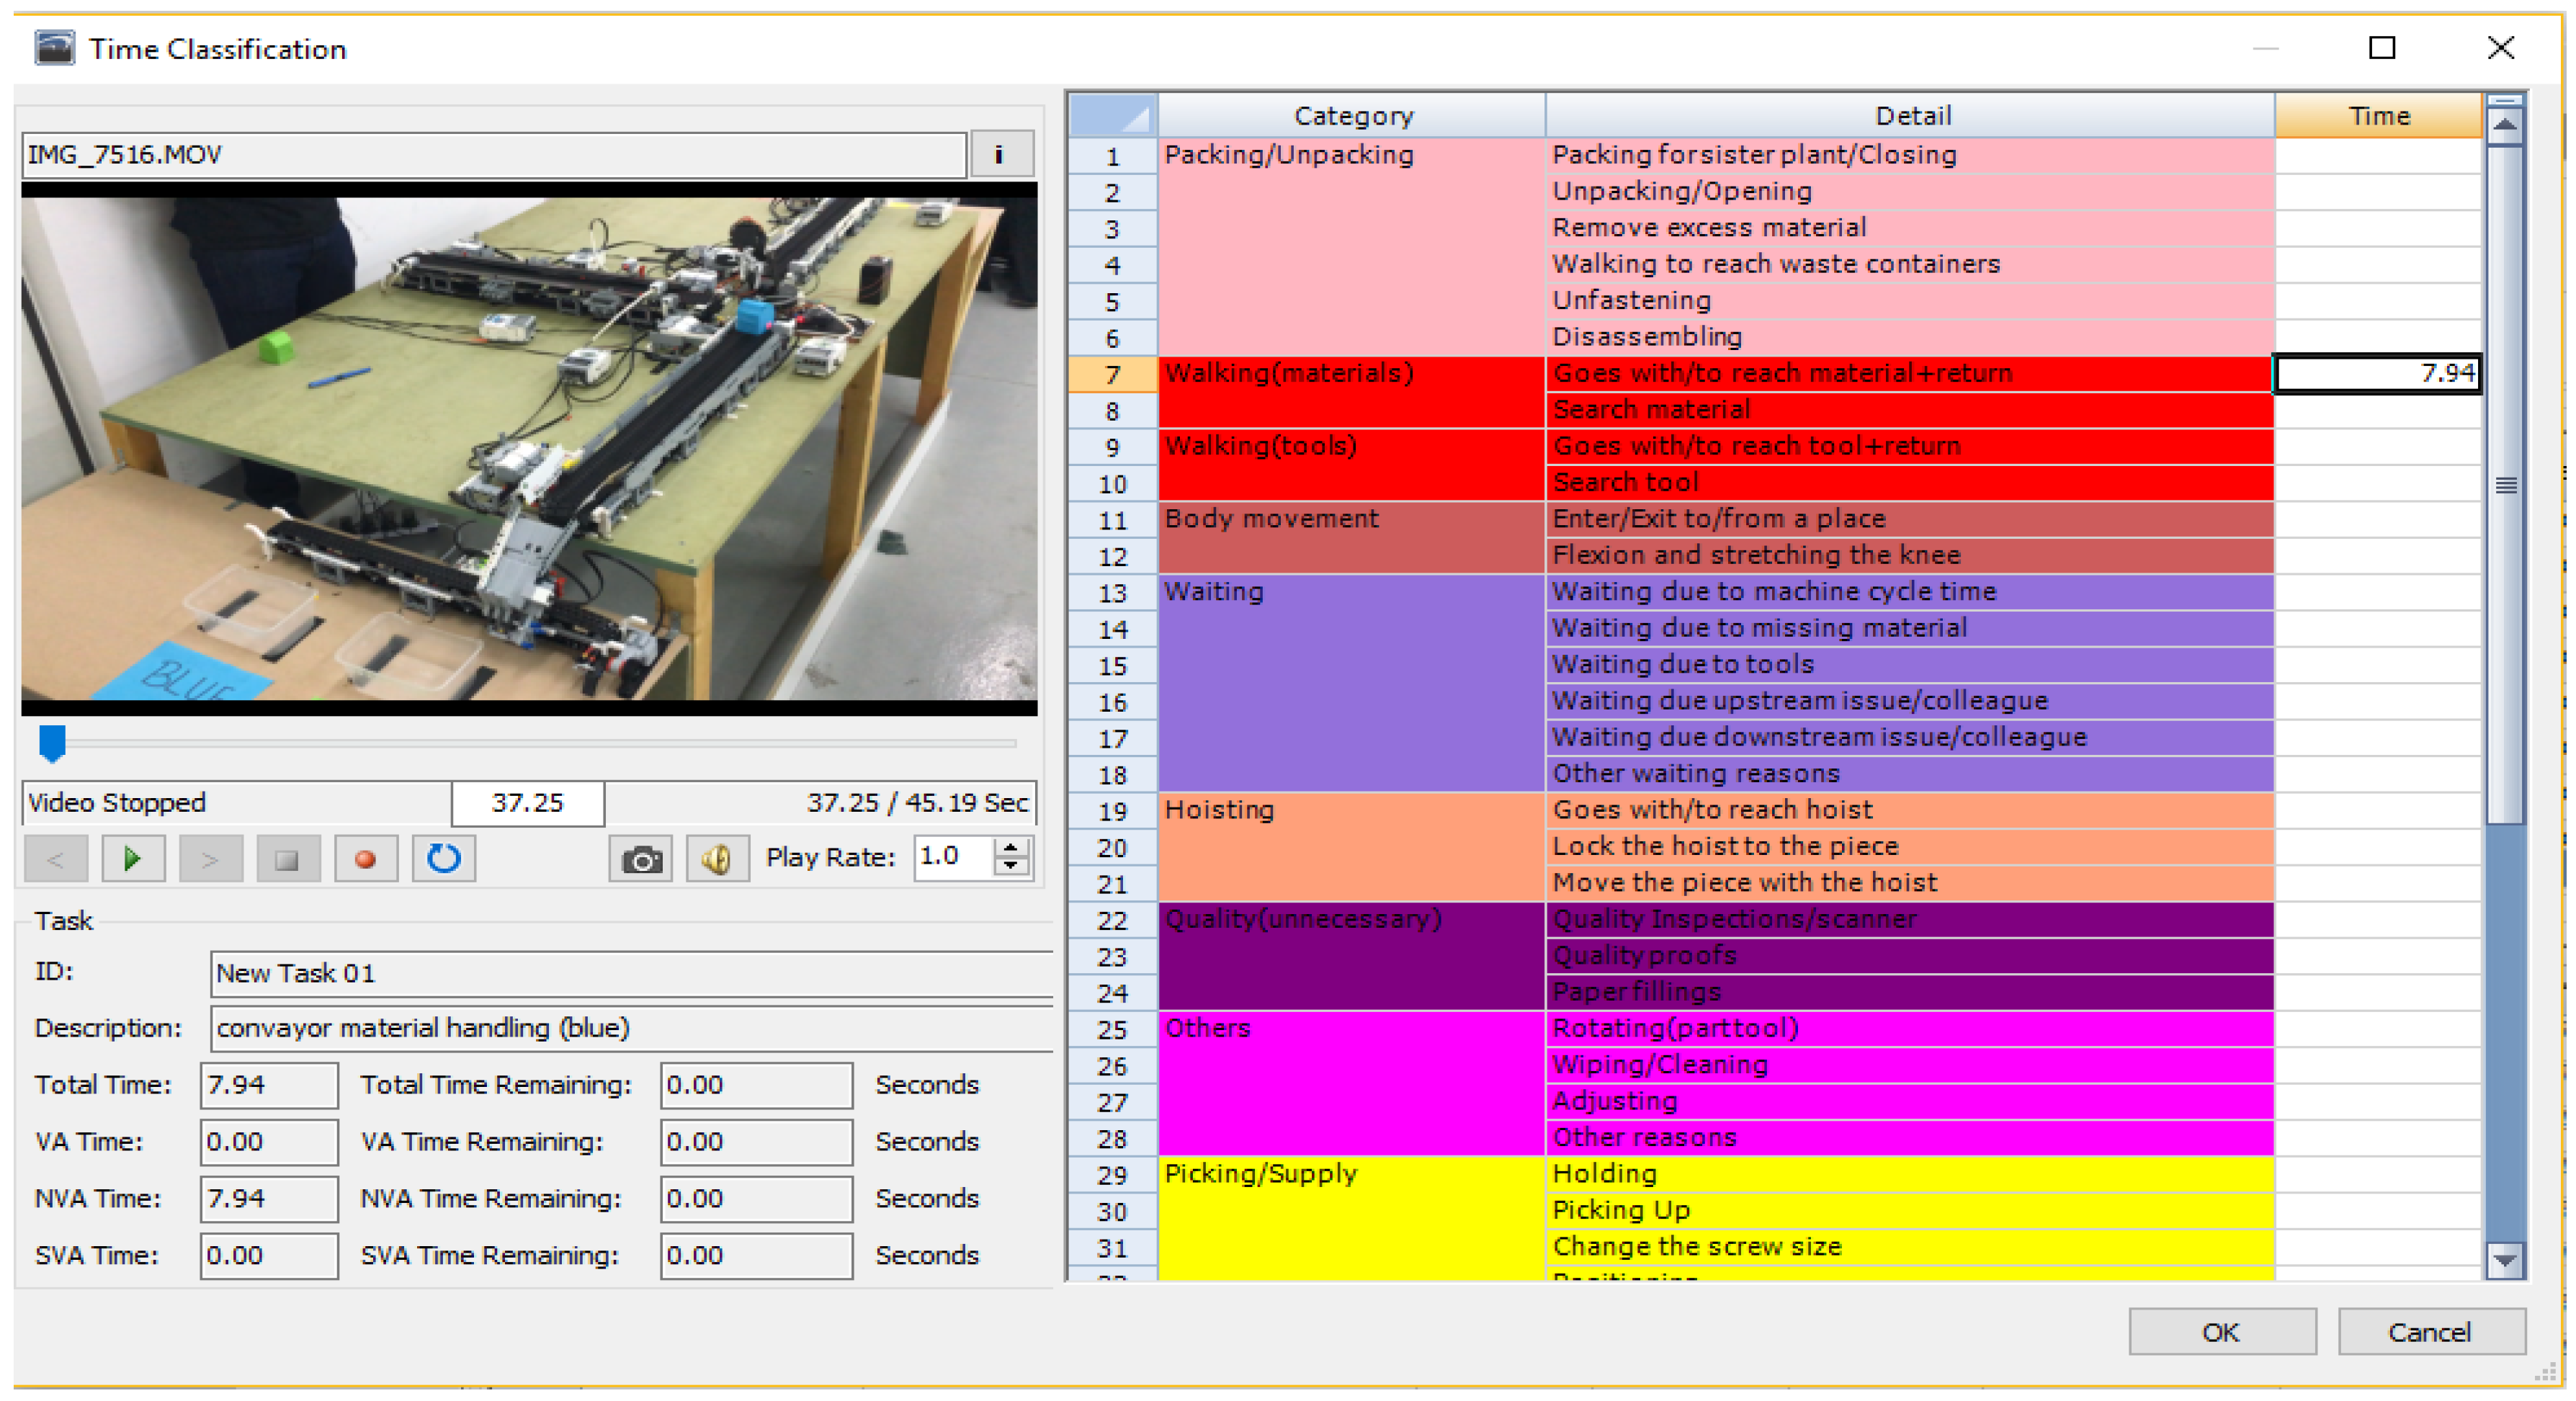
Table 2 describes the total available tasks to complete the entire scenario. Each of these tasks is labeled with a number (task number) and the included resources to perform that task. These tasks should be defined in the ProTime estimation software. After task definition, the sequence of the tasks should be defined as they are in a real scenario and in the recorded video, respectively. The software has the ability to record the start and stop time by a simple procedure (clicking a record button). The software enables the operator to watch the video with a different playing rate and to record the times for each task by observing the video.
In this study, the playing rates were lowered from 1.0 to 0.6 units for getting precise data. The start time for each task was reset. The ignored times were taken into consideration as well, and were calculated manually and written down next to the task that got the ignored time in the observations table. In ProTime estimation software, ignored time is a type of timing that increases the actual timing by human mistakes; for instance, the failure of the operator to put the part on the conveyor on time. Furthermore, this time will not be considered as the effective time on OEE percentage. As the OEE concerns the equipment effectiveness, this time will not take place as breakdown or downtime, as shown by
Figure 8. In this research, there is just one “ignored time”, which is the result of the mentioned example. The amount of this time is 1.83 s.
The value added (VA), non-value added (NVA), and semi-value added (SVA) for each task were defined by the software, which is done by writing the values manually or by double clicking on cells to view the list of actions predefined in the software (
Figure 8 and
Figure 9).
3.1. Observation of Separate Sections of the System
3.1.1. Main Conveyor and Robot
The first stage of the time study has been done on the main conveyor and the robot arm that contained the specific tasks, as shown in
Table 2.
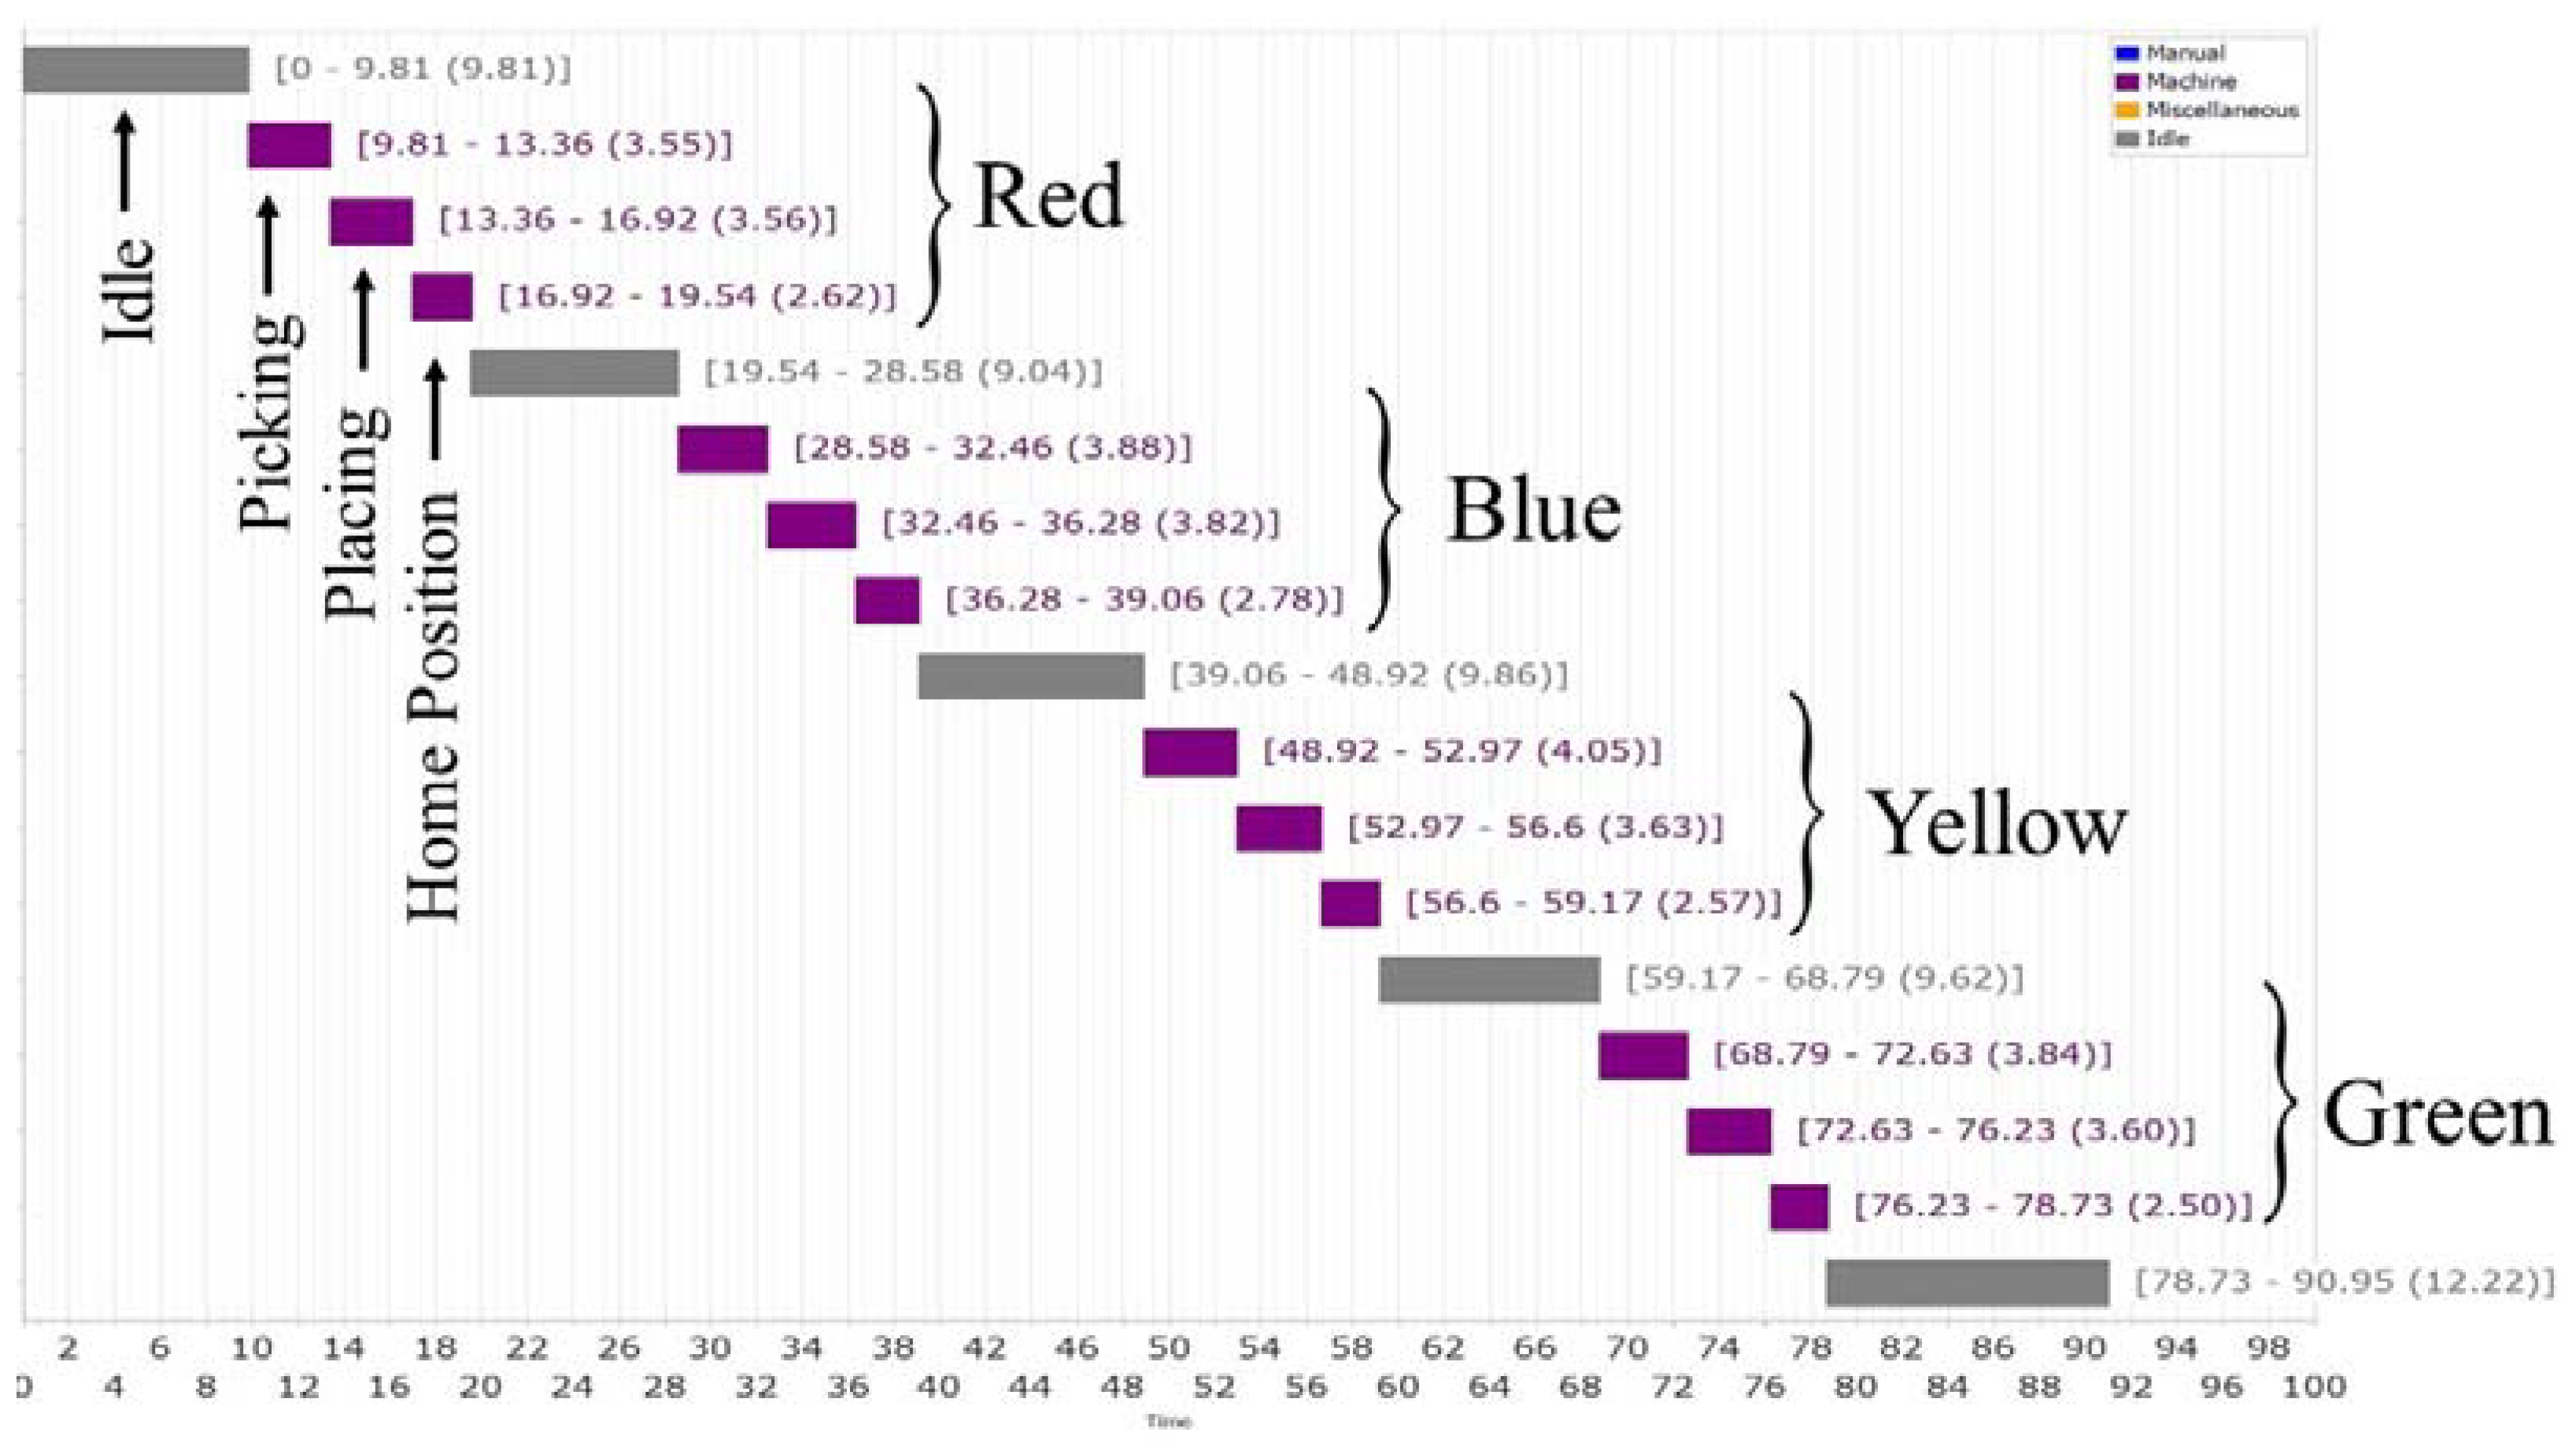
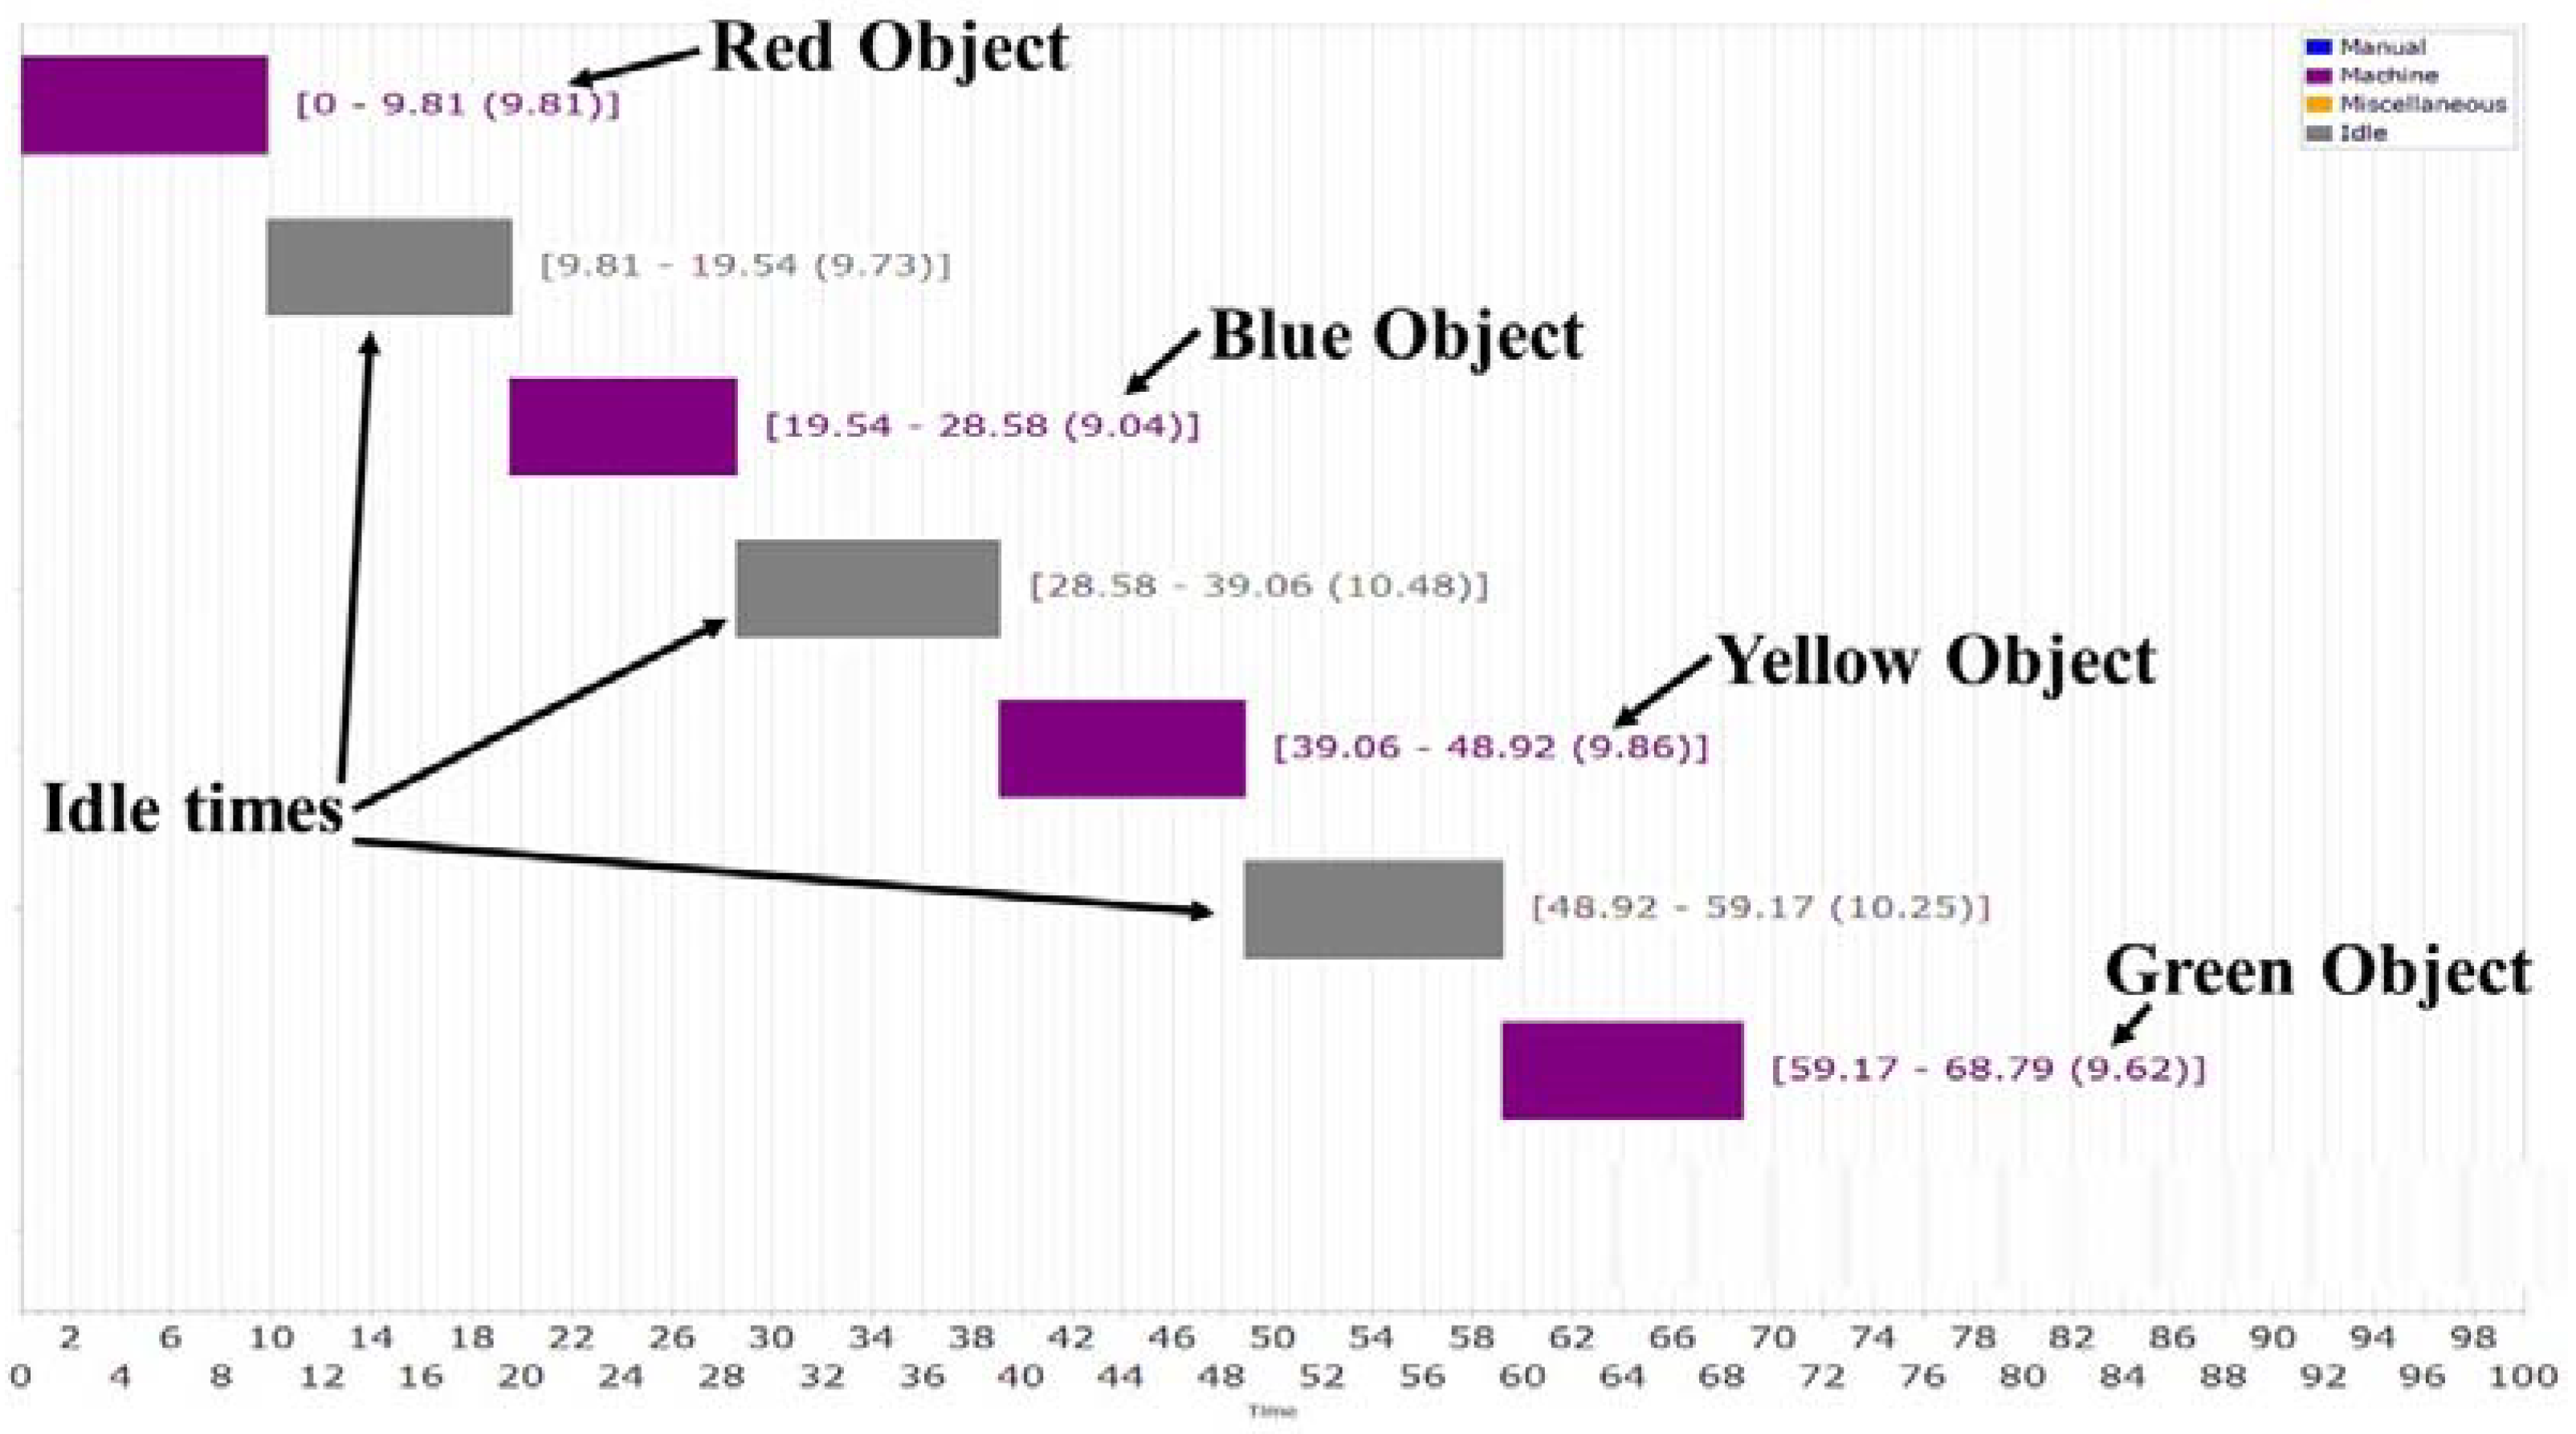
Figure 10 shows the utilization Gantt chart of the main conveyor; the chart displays the overall utilization time. The very first step is when the red object is placed on the conveyor. The motion sensor detects the object and the conveyor moves until 9.81 s, when it comes to a complete stop, where the color sensor detects the red objects and sends signals to the robot to pick it up. Then, the conveyor is on standby for 9.73 s as an idle time, while the robot arm works on picking and placing the object. Once the red object is placed on the right conveyor, the blue object is then placed and handled for 9.04 s until it reaches the robot arm. The process is repeated for the yellow and green objects as well. It can be seen that the idle time of the main conveyor before it handles the yellow object is 10.48 s. The yellow object is delivered to the robot arm in 9.86 s. As for the green object, it was handled for 9.62 s, and the conveyor took 10.25 s before it was handled.
The utilization time of each material handled varies, but they are close in value. The fastest time recorded was the blue object, which indicates that it was the fastest to be delivered, and also means that the rest of the parts can be modified either by shape or color intensity to be recognized faster by sensors. On the other hand, the first three idle times on the chart are nearly the same with a fraction of a second deference. The first problem in the system appeared is the idle time, which cannot be eliminated completely. To reduce the idle time, it is important to optimize the speed of the conveyor and the color of the objects because it affects its recognition by the color sensor.
The robot arm process is steady and the values of picking and placing each object are nearly the same.
Table 3 shows the start, end, and total time spent of the robot arm tasks.
From
Table 3, we notice that the process is steady except for the yellow object picking material. This an indication that the color sensor had difficulty recognizing the object. Consequently, the sensor programming must be modified, after which it recognizes the color of the objects.
Figure 11 shows that the idle times of the robot arm are dependent on the main conveyor process. As a result, reducing the idle time of the robot arm can be achieved by increasing the efficiency of the process of the main conveyor.
3.1.2. Left and Right Conveyors and Sliders
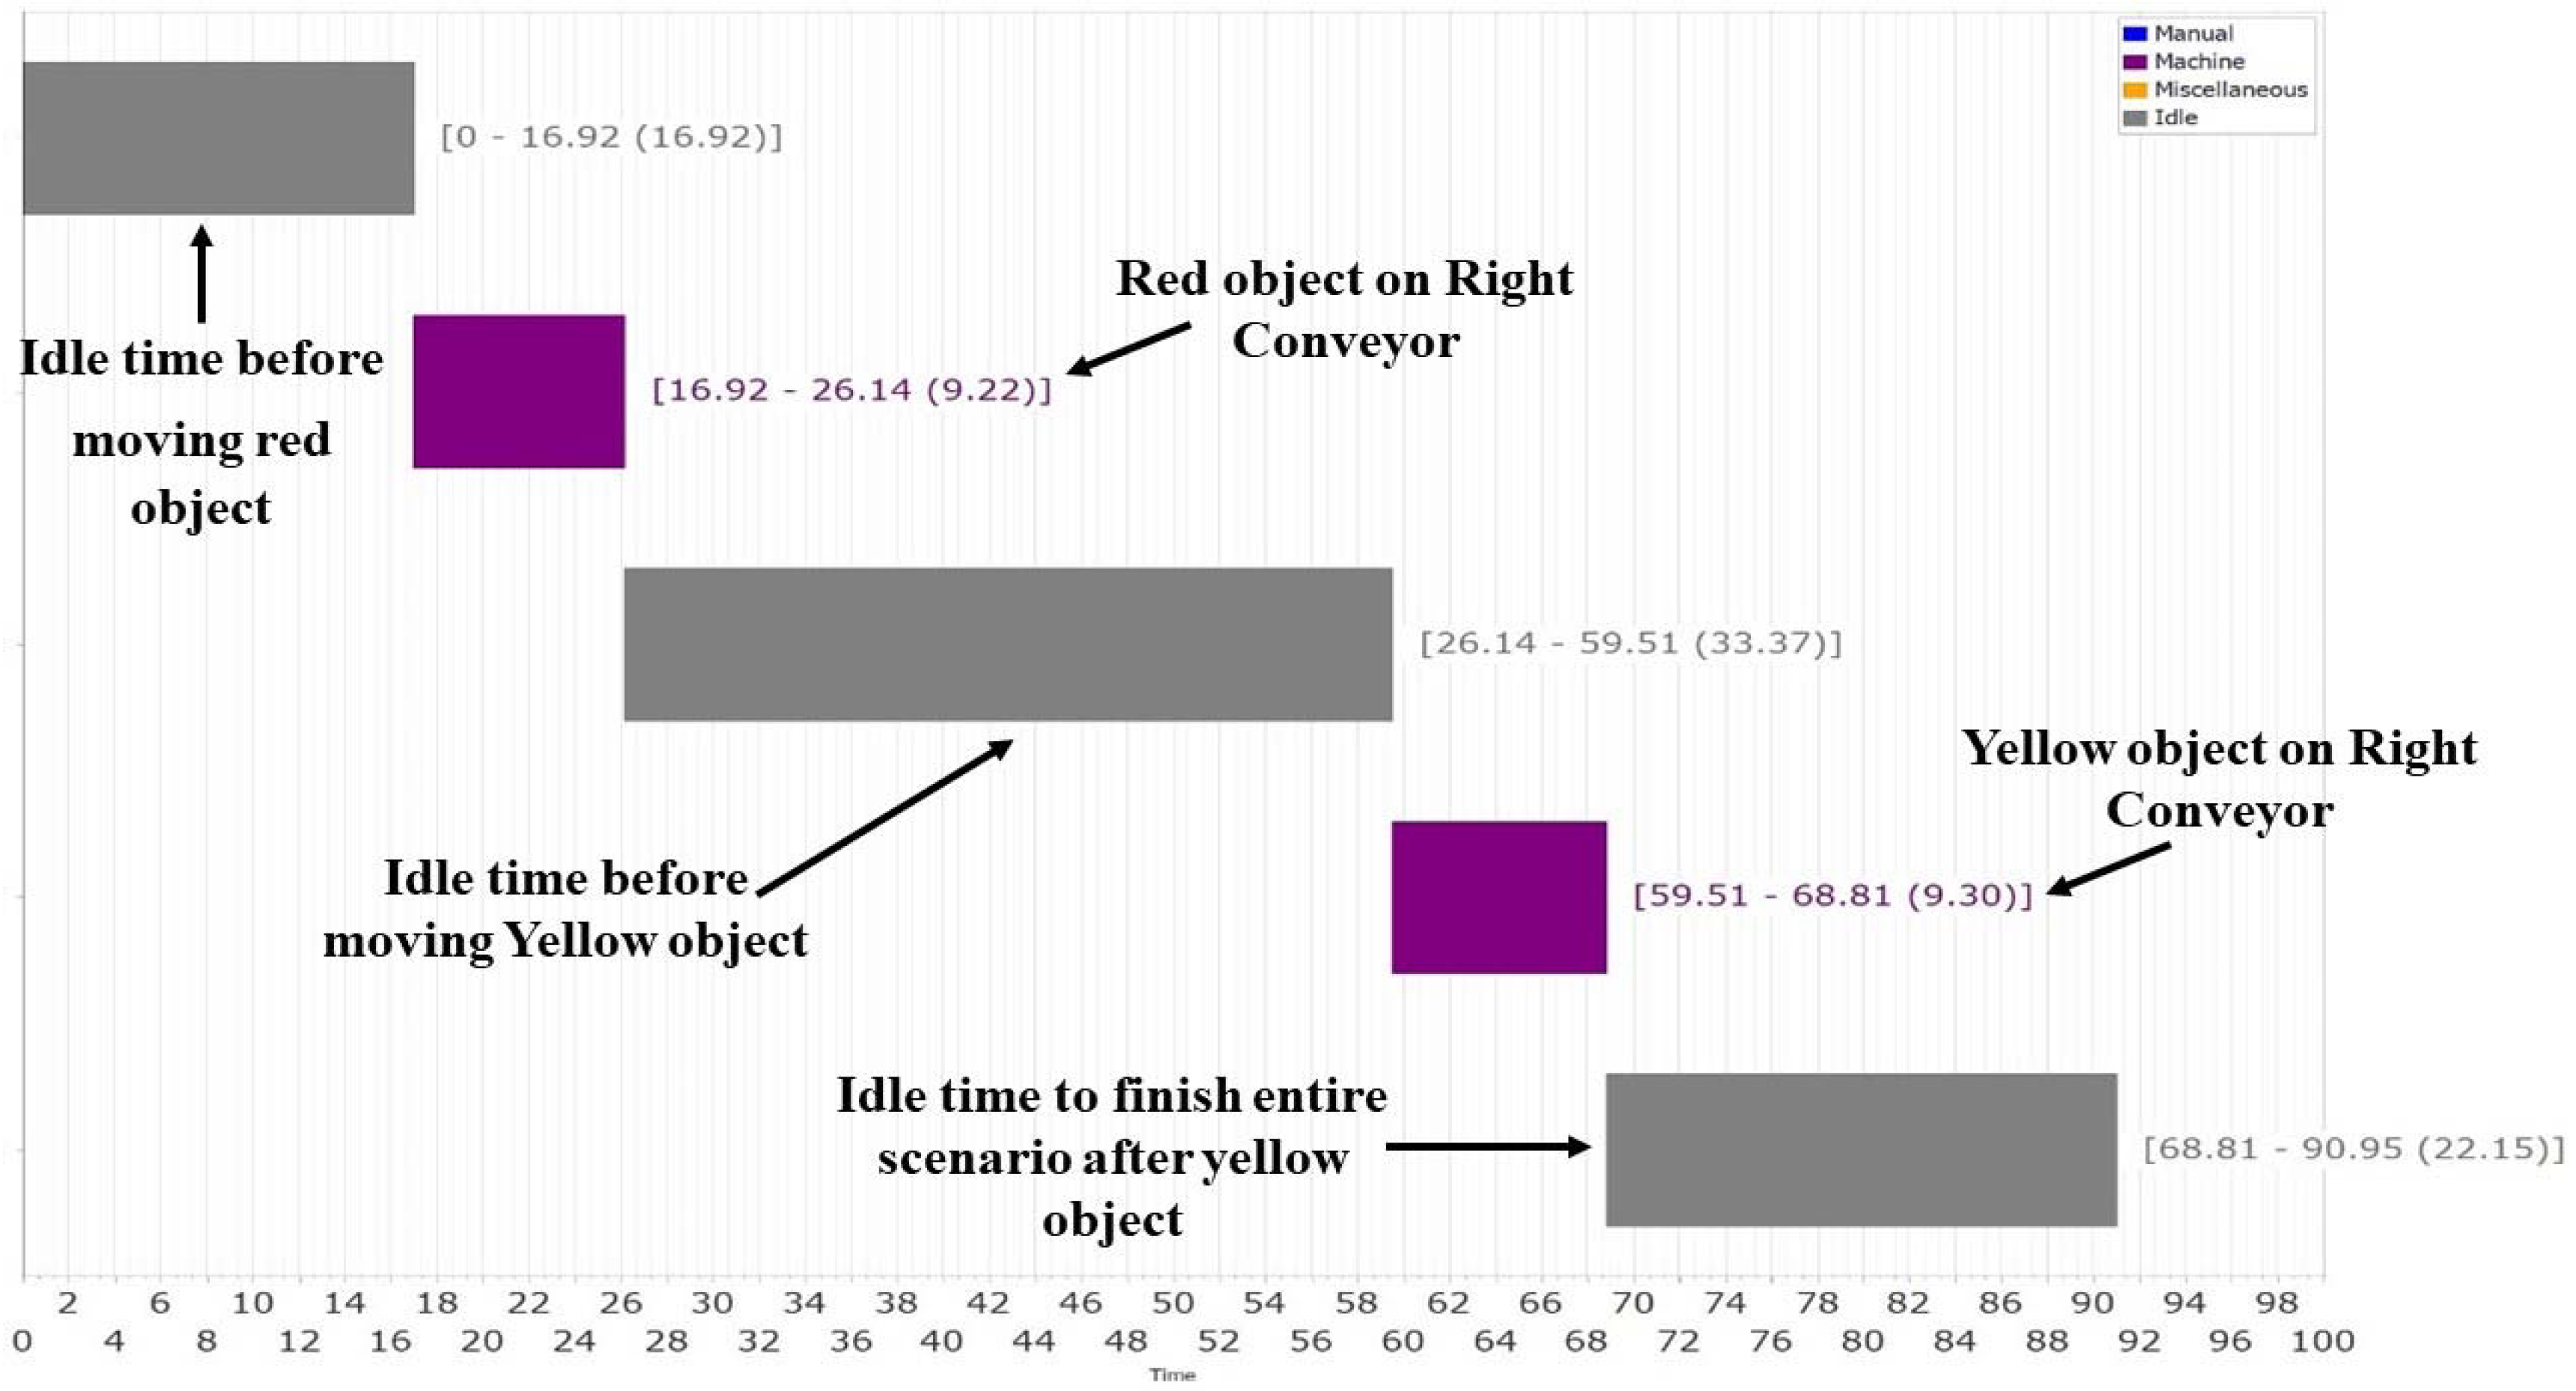
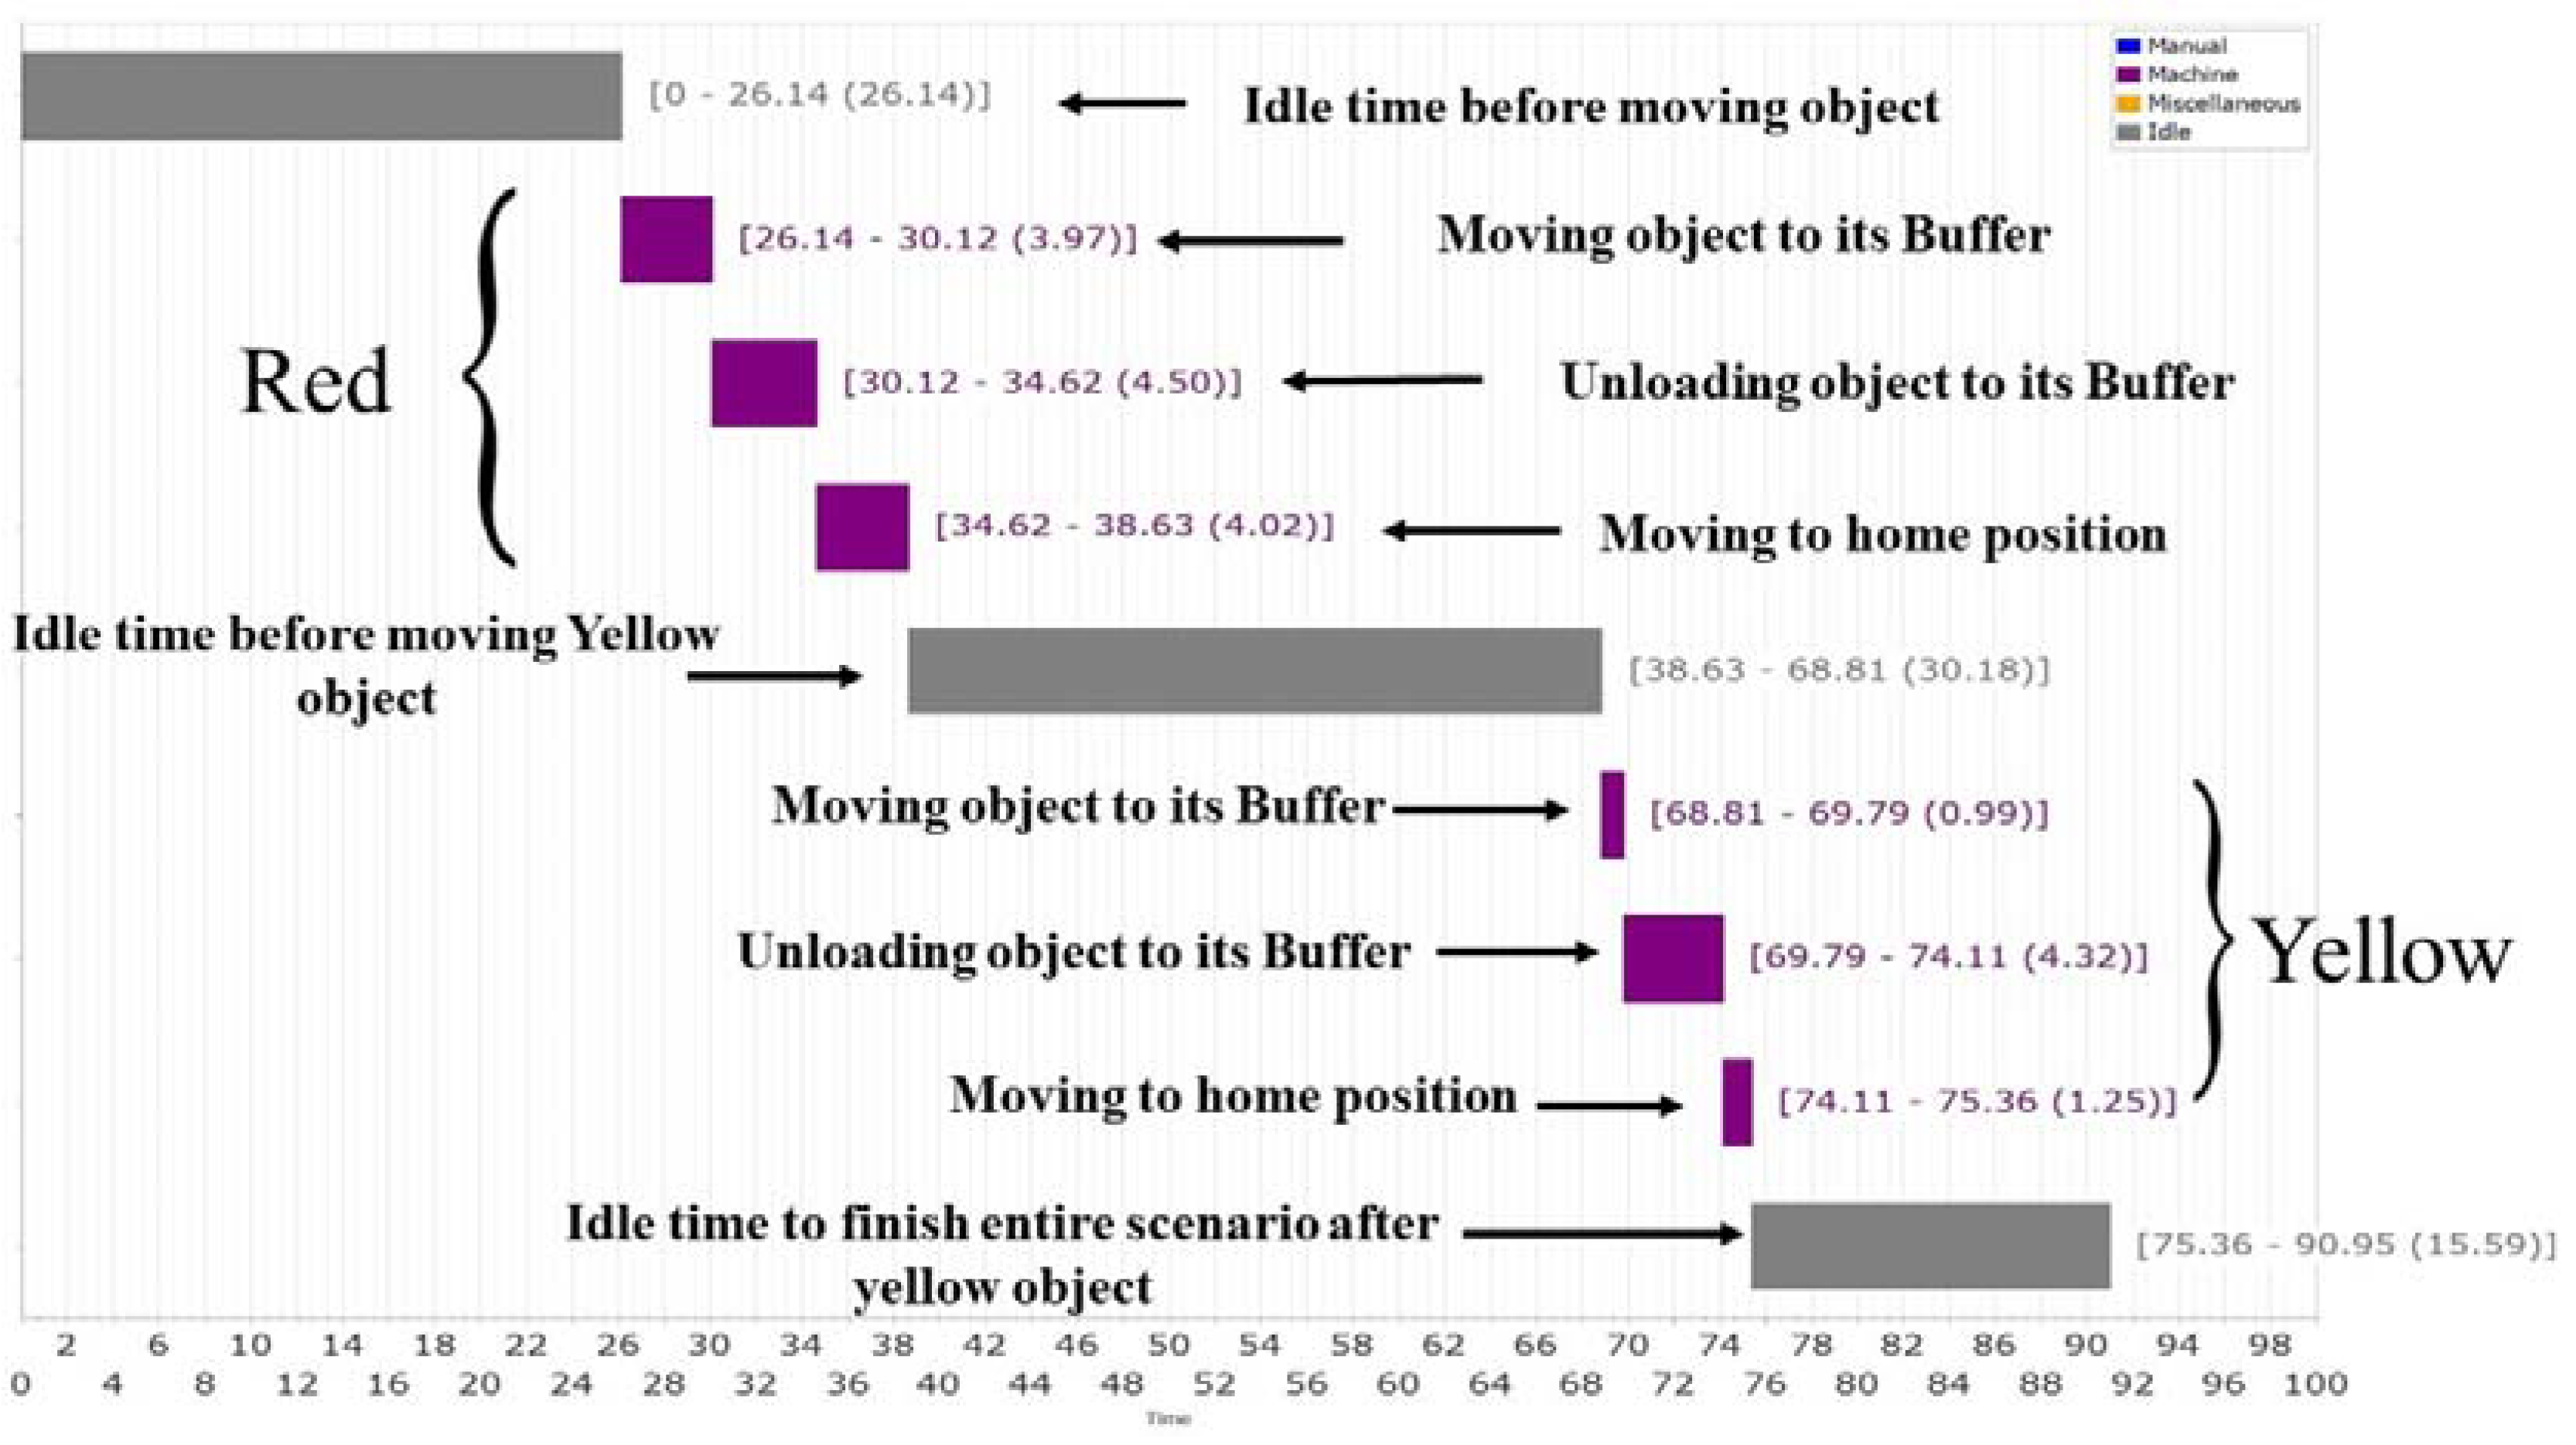
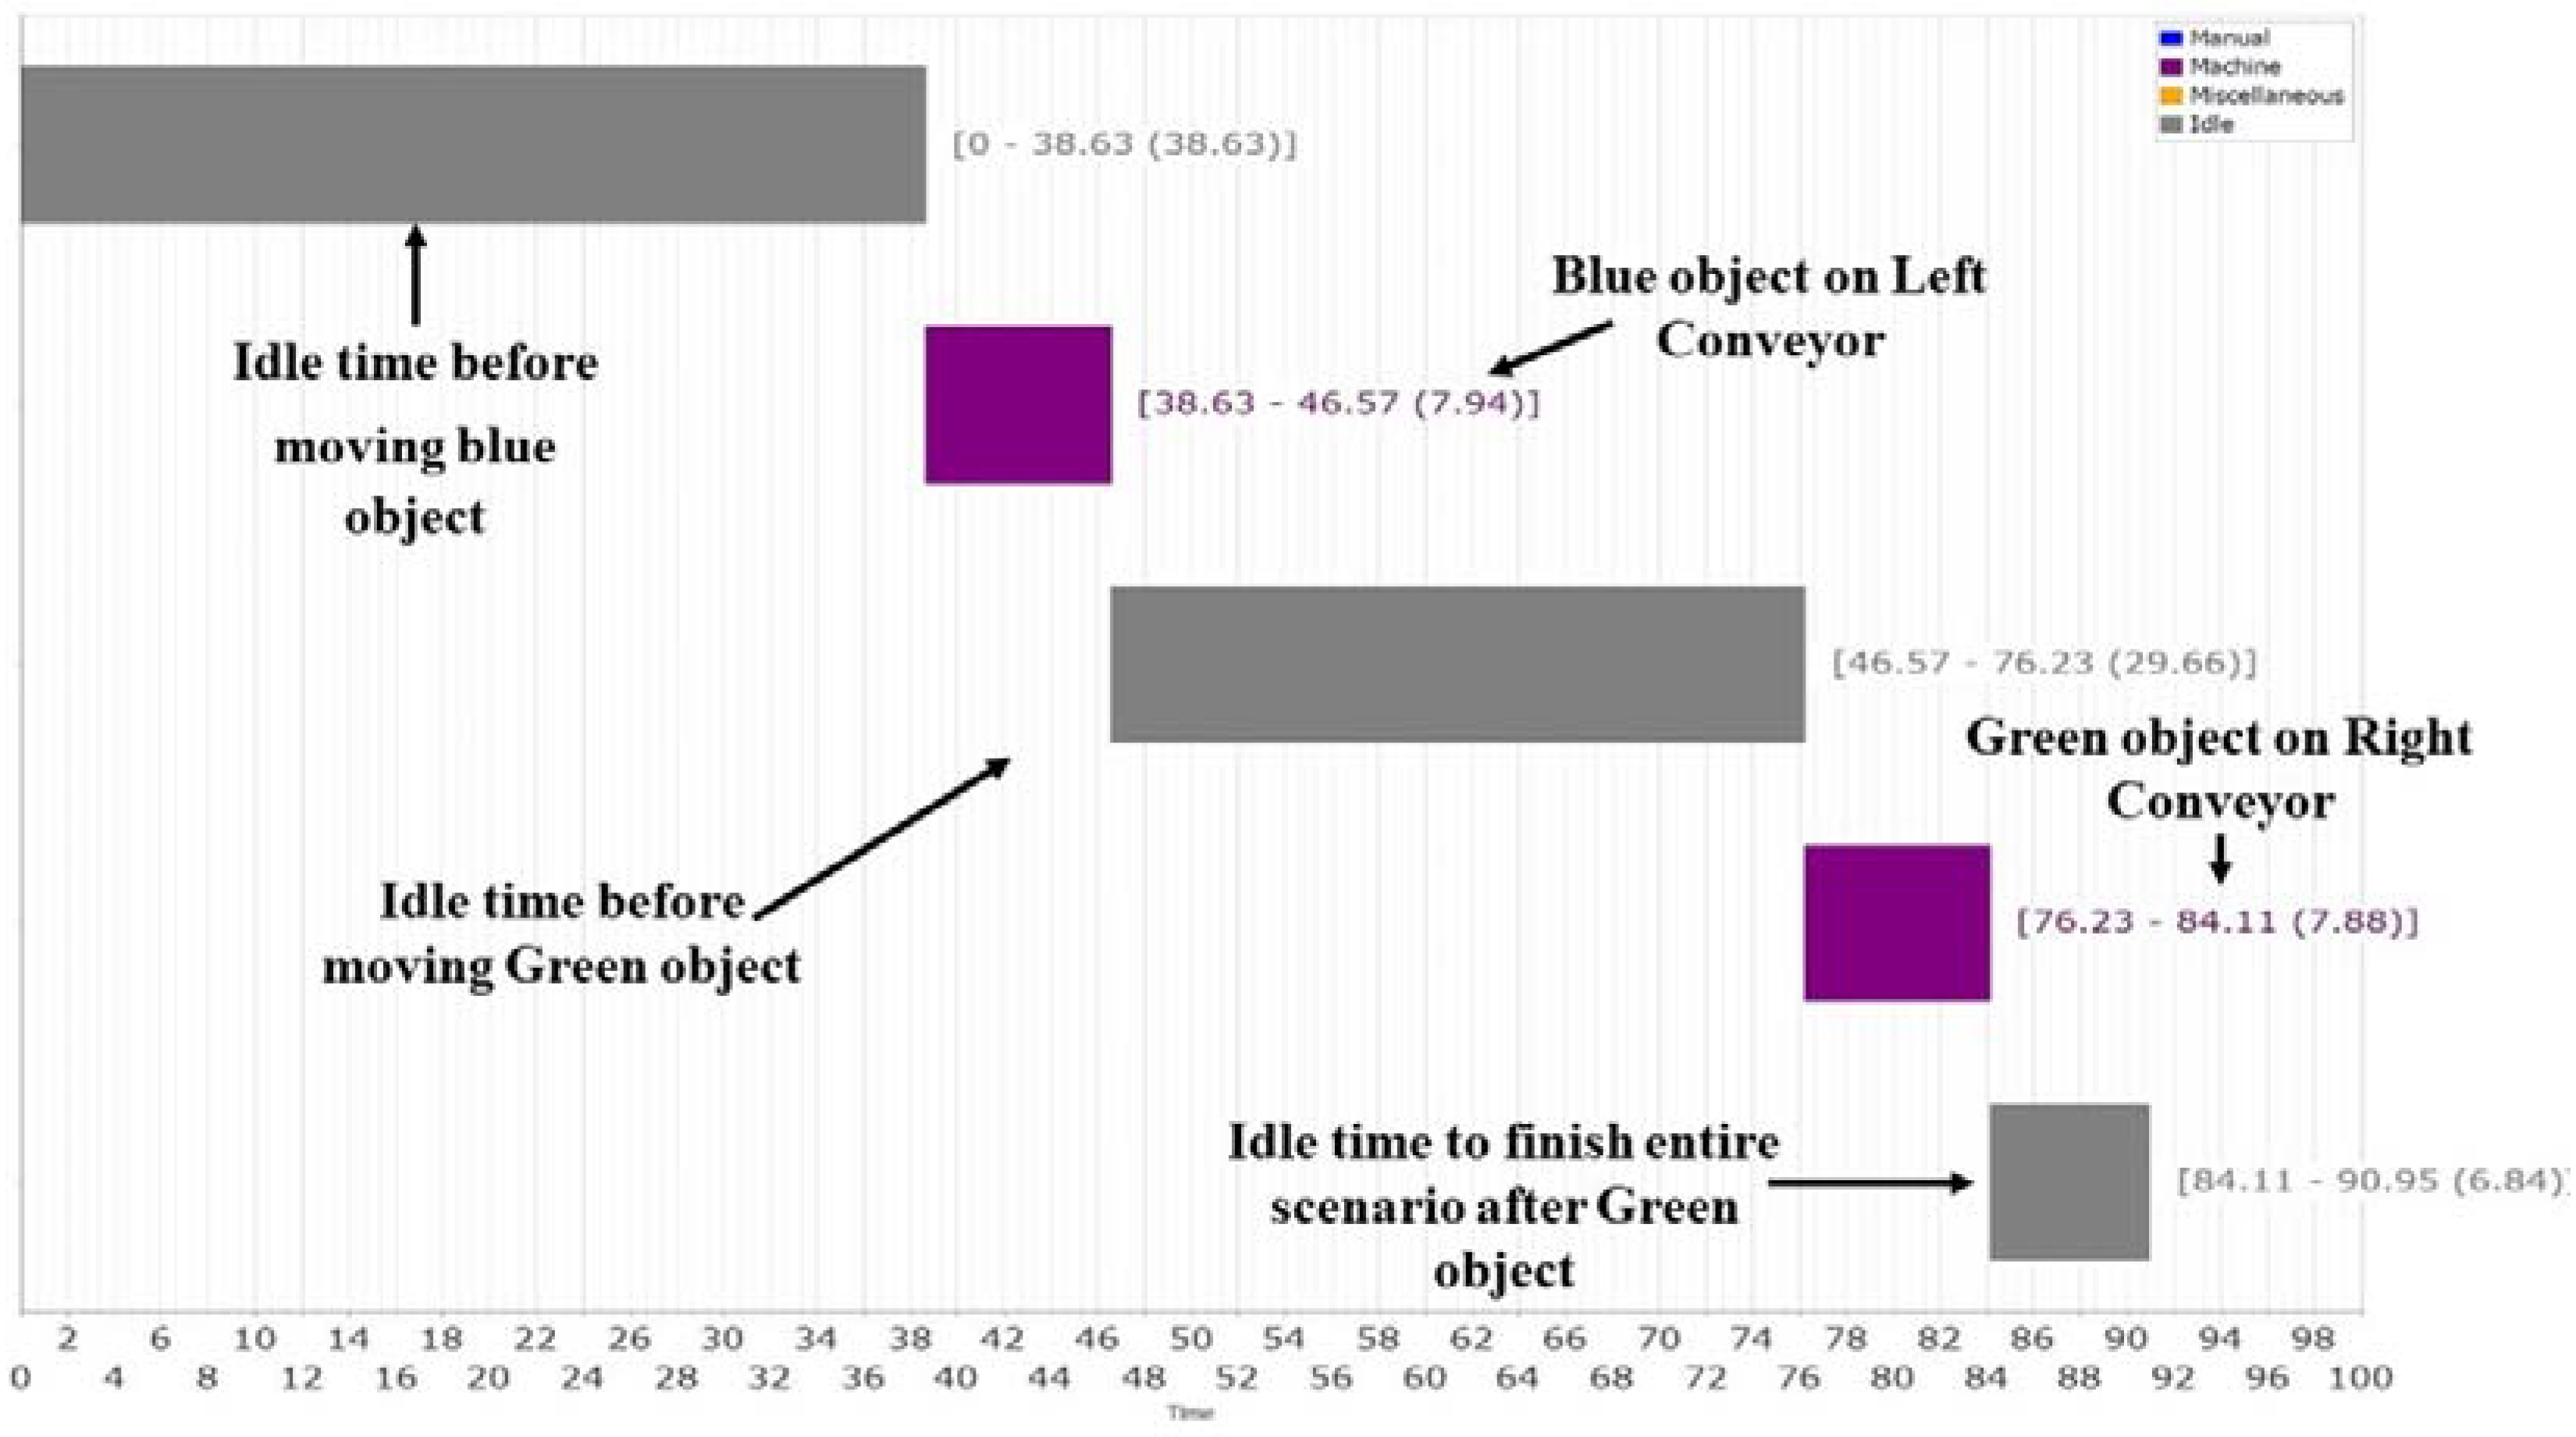
As
Figure 12 shows, an overall idle time value of 72.44 is spent by the red and yellow objects on right conveyor divided as follows: 16.92 s waiting for the red object to reach, whereas 33.37 s is for waiting for the yellow object to reach, and the remaining 22.15 s is for waiting for the process to be completed. When looking at the overall performance of the side-conveyor, we notice that the utilization time—which is shown in
Table 4—is less than the time spent on standby non-added value. To get a better overall performance, the non-added value has to be reduced, increasing the value added to the process. The possible solution to overcome this issue is to improve the control architecture between main and right conveyor to control the input–outputs (IOs) and communication between the main conveyor agent, robot agent, and right conveyor agent. Furthermore, changing the layout design to increase the access points (system entrance) could be an adequate solution.
Similarly, the slider has a greater idle time than utilization time, resulting in 71.91 s of standby time spent to deliver the objects to it. As the sliders have the same behavior as the conveyors, the same strategy could be used to optimize the timing.
Correspondingly, the same applies to the blue–green side-conveyor and slider. The total idle time is 68.29 s, the reason this value is less than the value of red–yellow conveyor is that the process ends when the last task of this side is done working (
Table 5).
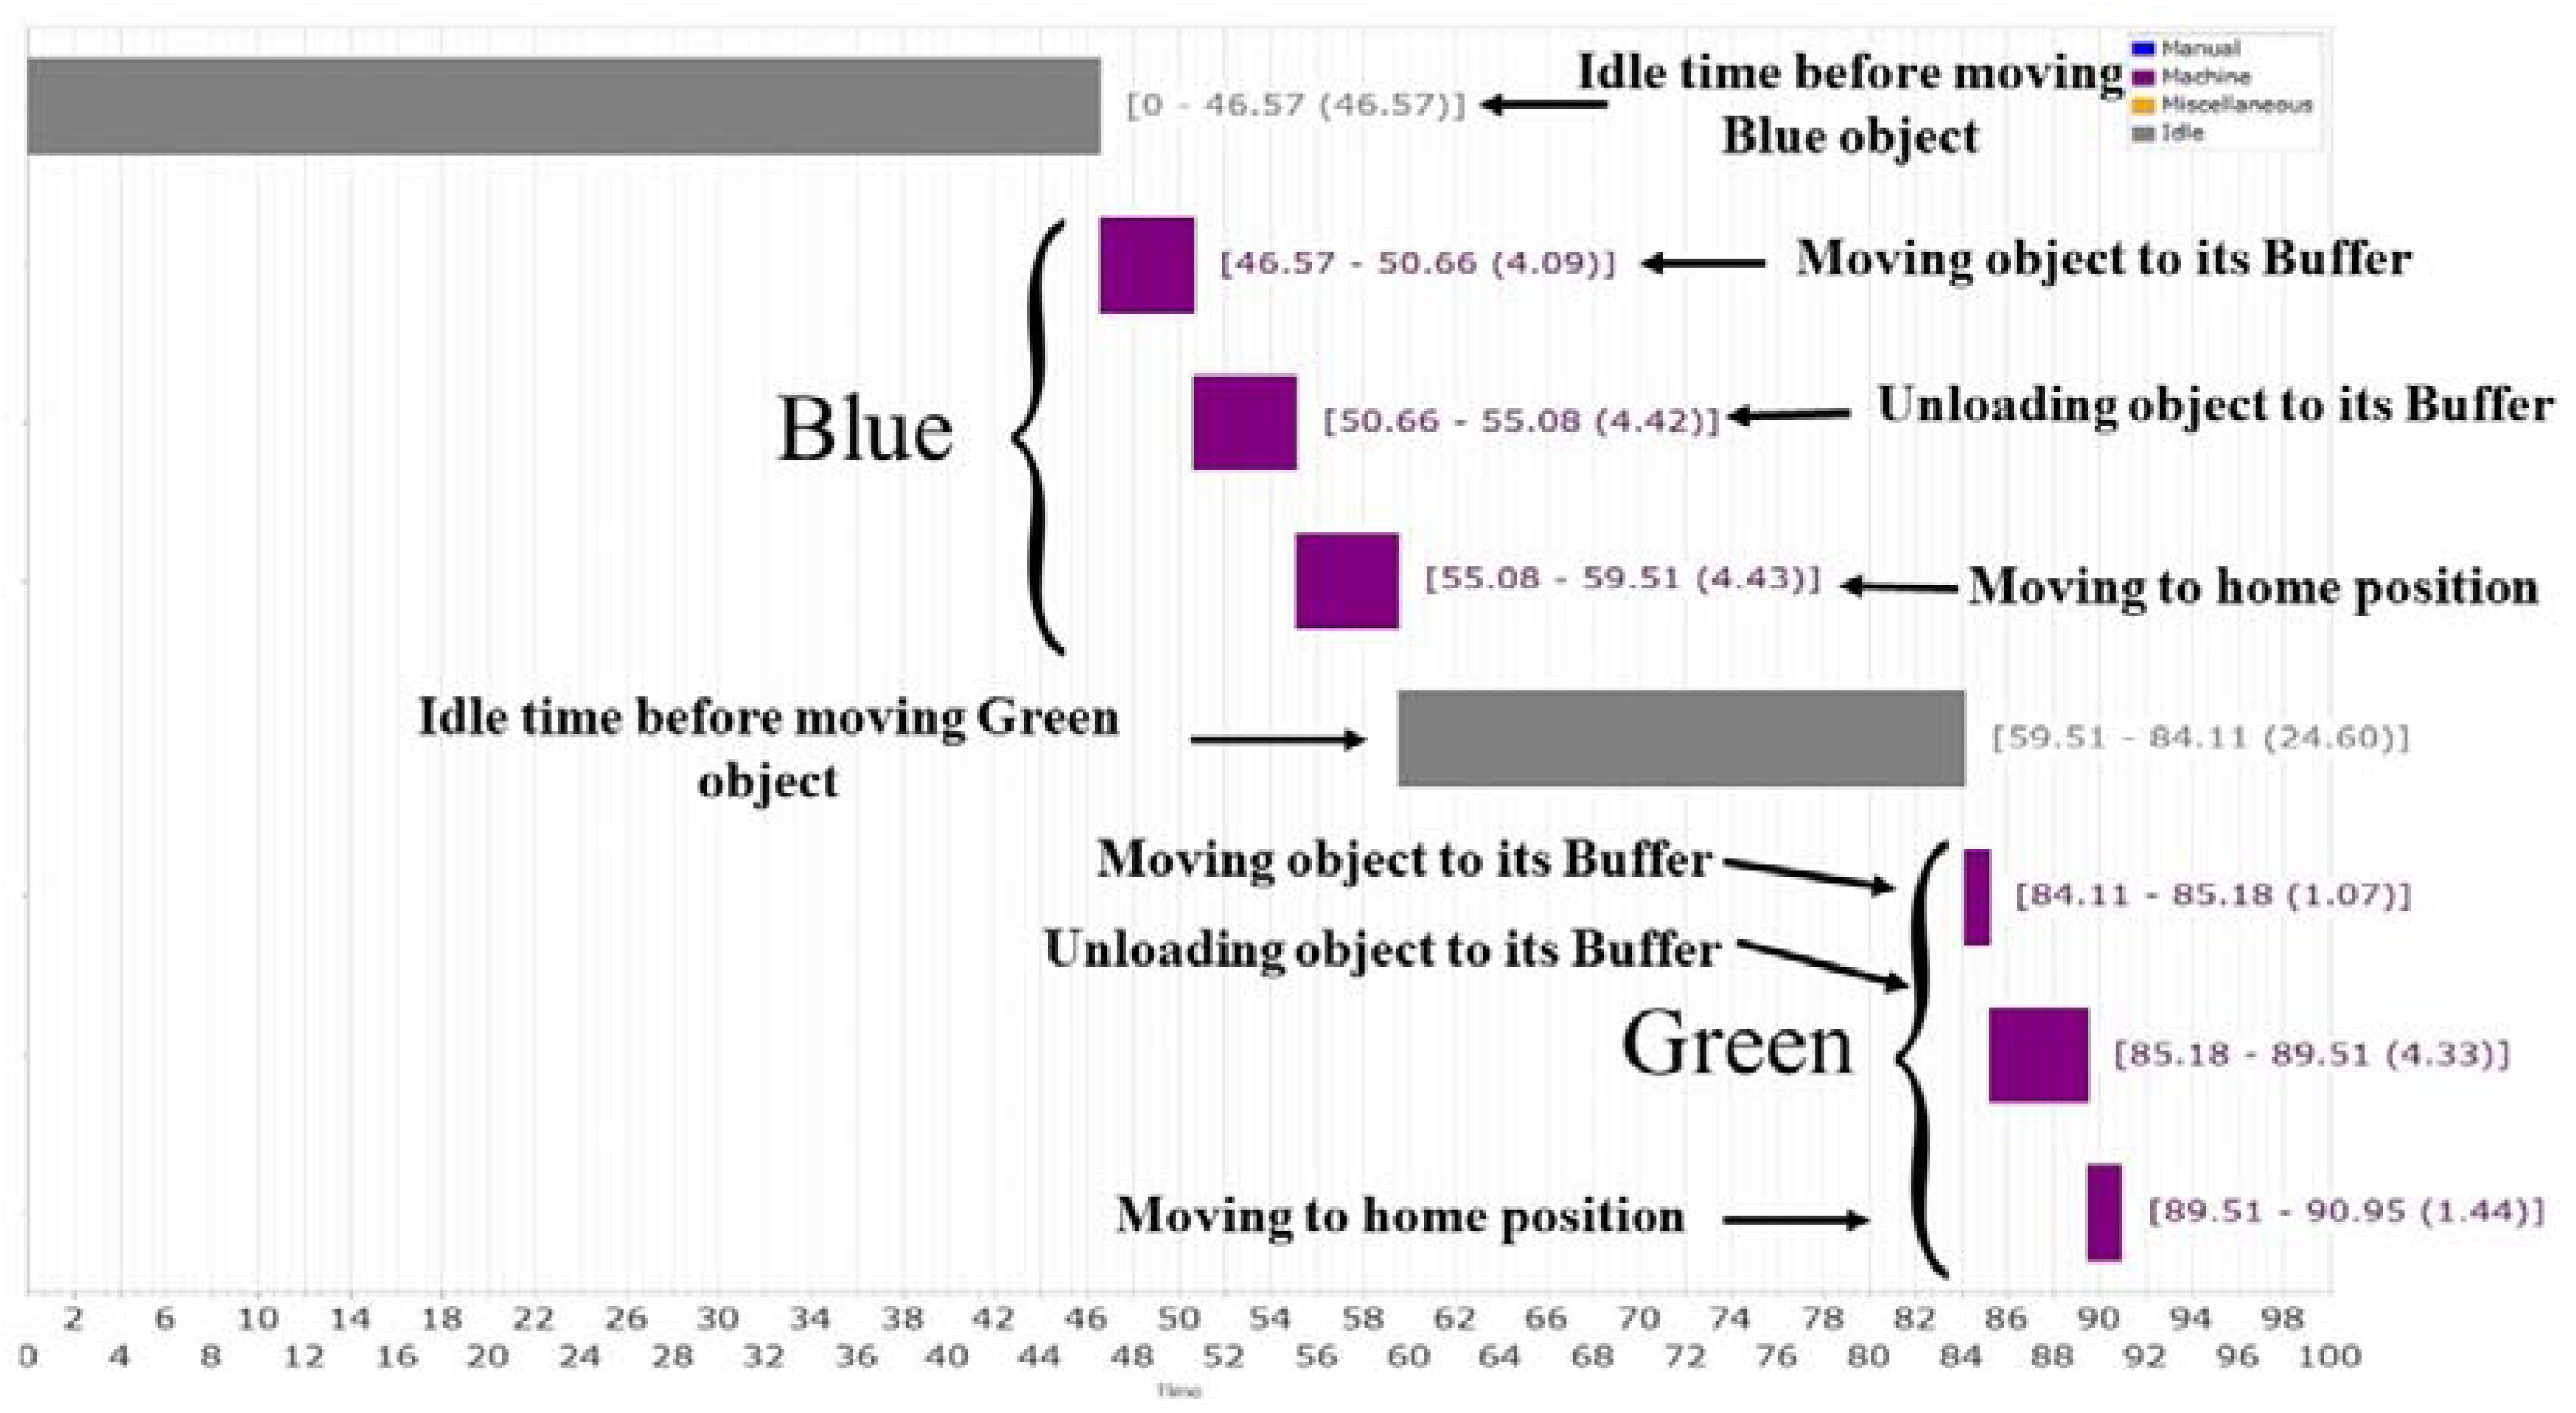
From
Figure 13,
Figure 14 and
Figure 15, we notice that the slider utilization time when delivering the first object of each side differs from the second object delivered. This is an indication of the variance of the storage distance from the slider itself. As for either blue or red, the distance of the storage unit from the slider is greater than the distance of either green or yellow storage.
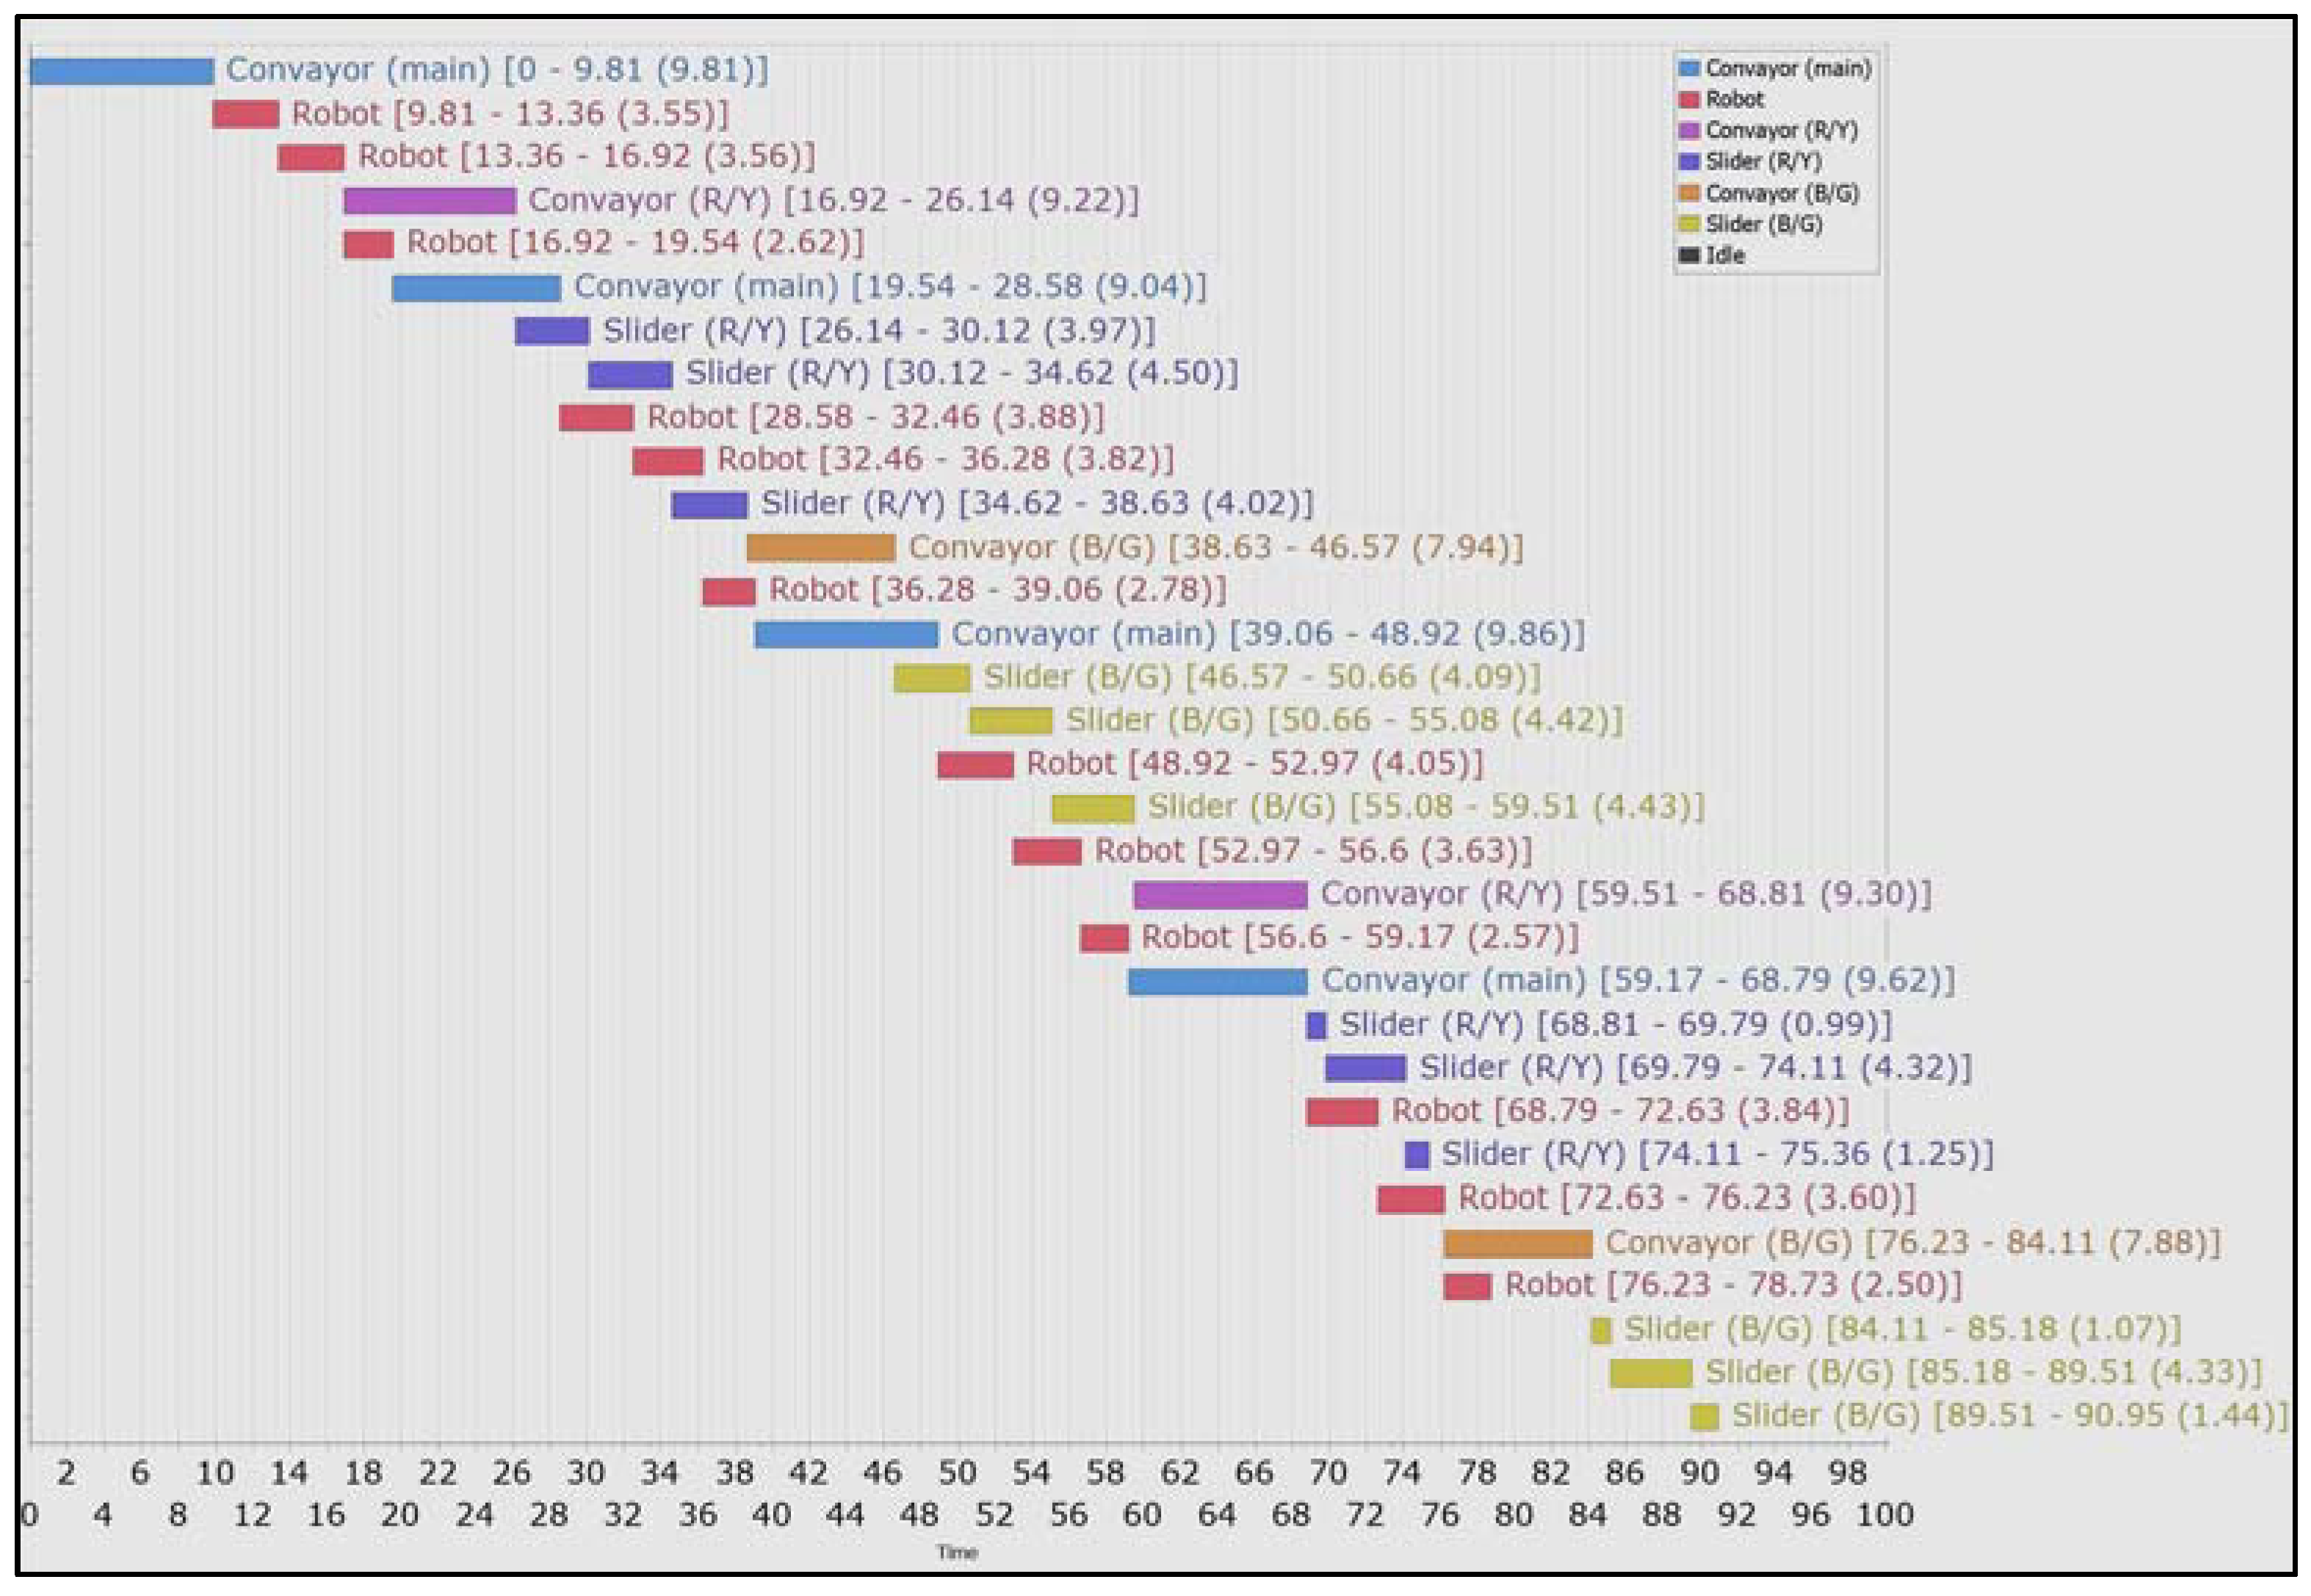
3.2. Observation of the Entire System
The following Gantt chart (
Figure 16) shows the overall system performance with all the sections of the system, showing the utilization time of each resource and the conflictions that occur when two or more resources are working at the same time. This chart was generated using the predecessor of tasks table (
Table 6).
3.2.1. Main Conveyor
Table 7 shows the time spent by each object to move on the main conveyor. The time is related to the speed of object delivery, meaning that with a decrease of time spent, the speed of object delivery is lower, resulting in a better performance.
From
Table 7, it can be seen that the blue object had the fastest delivery time, which is an indication of a minimum utilization time and lesser overall idle time. As for the other objects, there are some factors affecting the time and speed of delivery of the objects, such as the fact that object smoothness and roughness affects the friction and the movement of objects on the conveyor; or the object color intensity, the color sensor on the beginning of the main conveyor does not recognize the object immediately, resulting in a slight increase in the idle time.
3.2.2. Robot Arm
The robot arm moving either to pick or place the object depends on the color sensor at the end of the main conveyor, where it detects the color of the object then sends signals to the robot arm to function, which is why the values of picking and placing objects differ. As for the robot home position after placing all four objects, the values of the time spent are nearly the same, with an average of 2.618 s (
Table 7).
3.2.3. Side Conveyors
The right conveyor (assigned for red and yellow objects) spends greater time in handling the objects to the slider, whereas the left conveyor (assigned for green and blue objects) spends less time by seconds. At first, when generating the charts and getting these values, it has been thought the values were incorrect because both sides were exactly the same. This led to taking additional videos and repetitive time study to evaluate the conveyor performance again. After applying an accurate time study, especially for this section, and evaluating the data, it turned out that the conveyors were designed with different lengths (right conveyor was 10 cm longer than left one), and the times recorded are correct. Therefore, this great value difference is correct because of the additional length on the right conveyor (
Table 7).
3.2.4. Sliders
Table 7 also displays the similarity between the red and blue objects, and between green and yellow objects. This points out that the distances of storage units of the blue and red objects are the same, and the storage unit distances of the yellow and green objects are the same. The slight difference in the time values is because of the color sensor detection ability each on slider and processing of each on the bricks (process units).
5. OEE Analysis
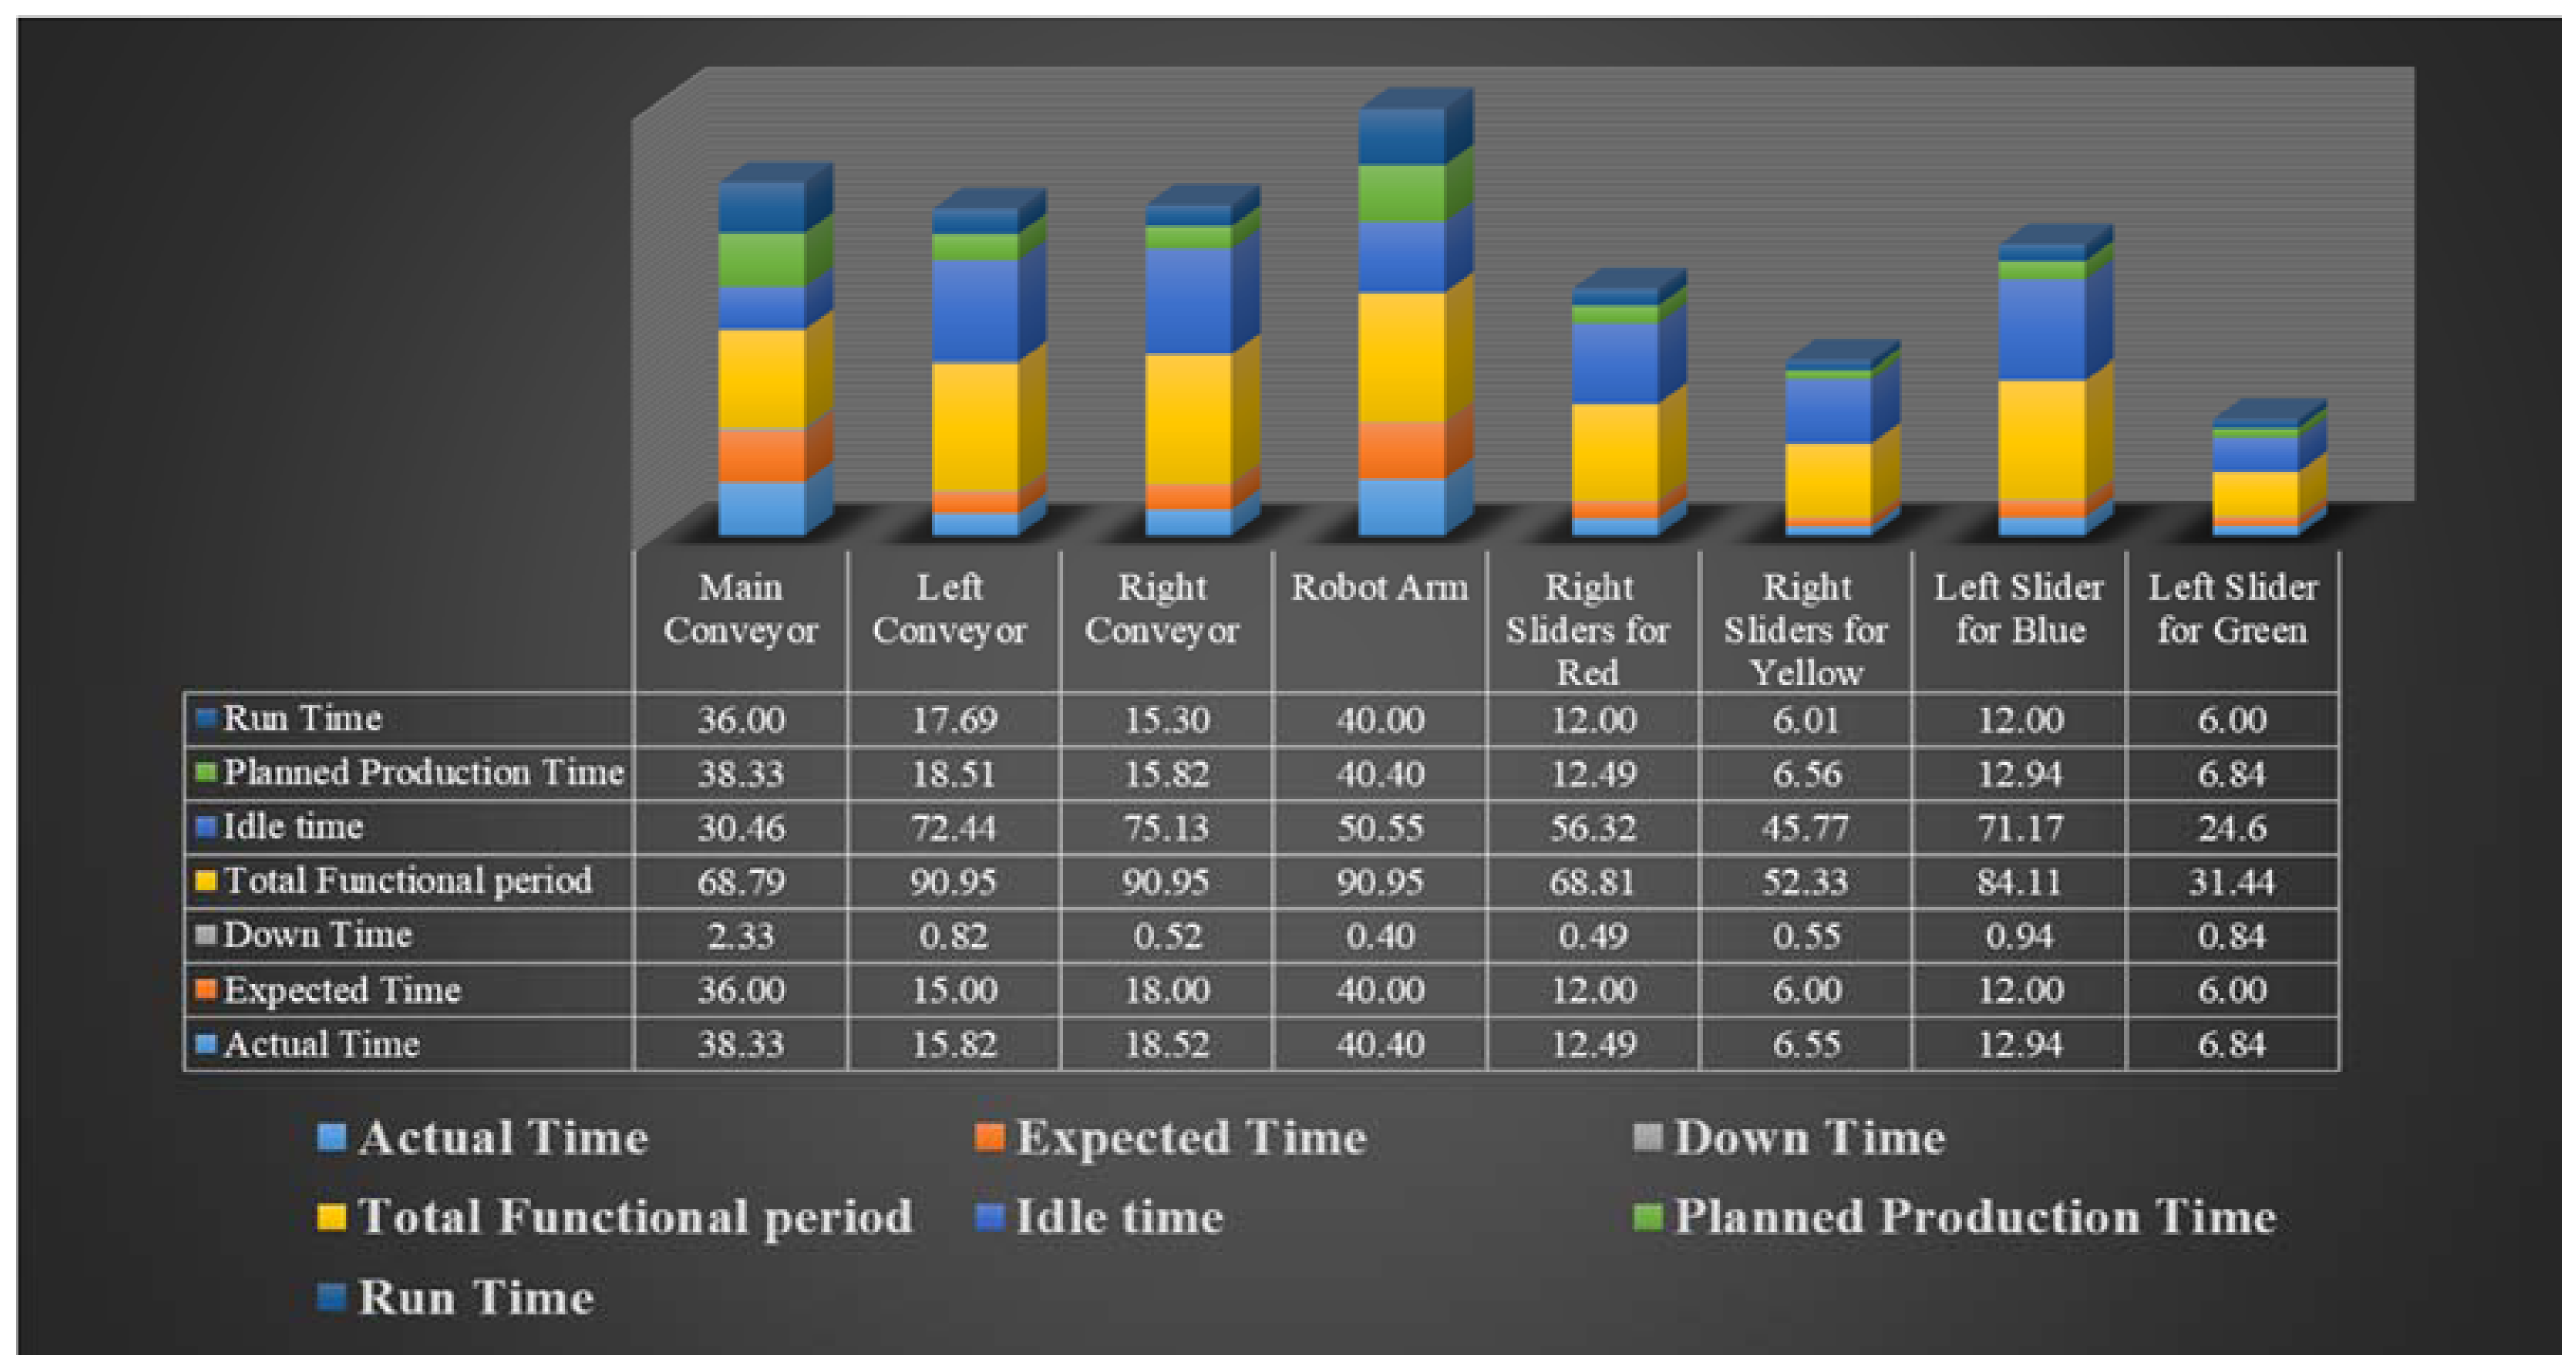
After the design and implementation of the proposed intelligent material handling system and performance of a comprehensive time study, the outcome was analyzed to get the overall system performance. For this reason, the OEE standard was considered and utilized to reach to this goal. The calculation was performed on
Table 7 and
Table 8 to obtain the partial and overall system performance and consequently prepare the
Table 11.
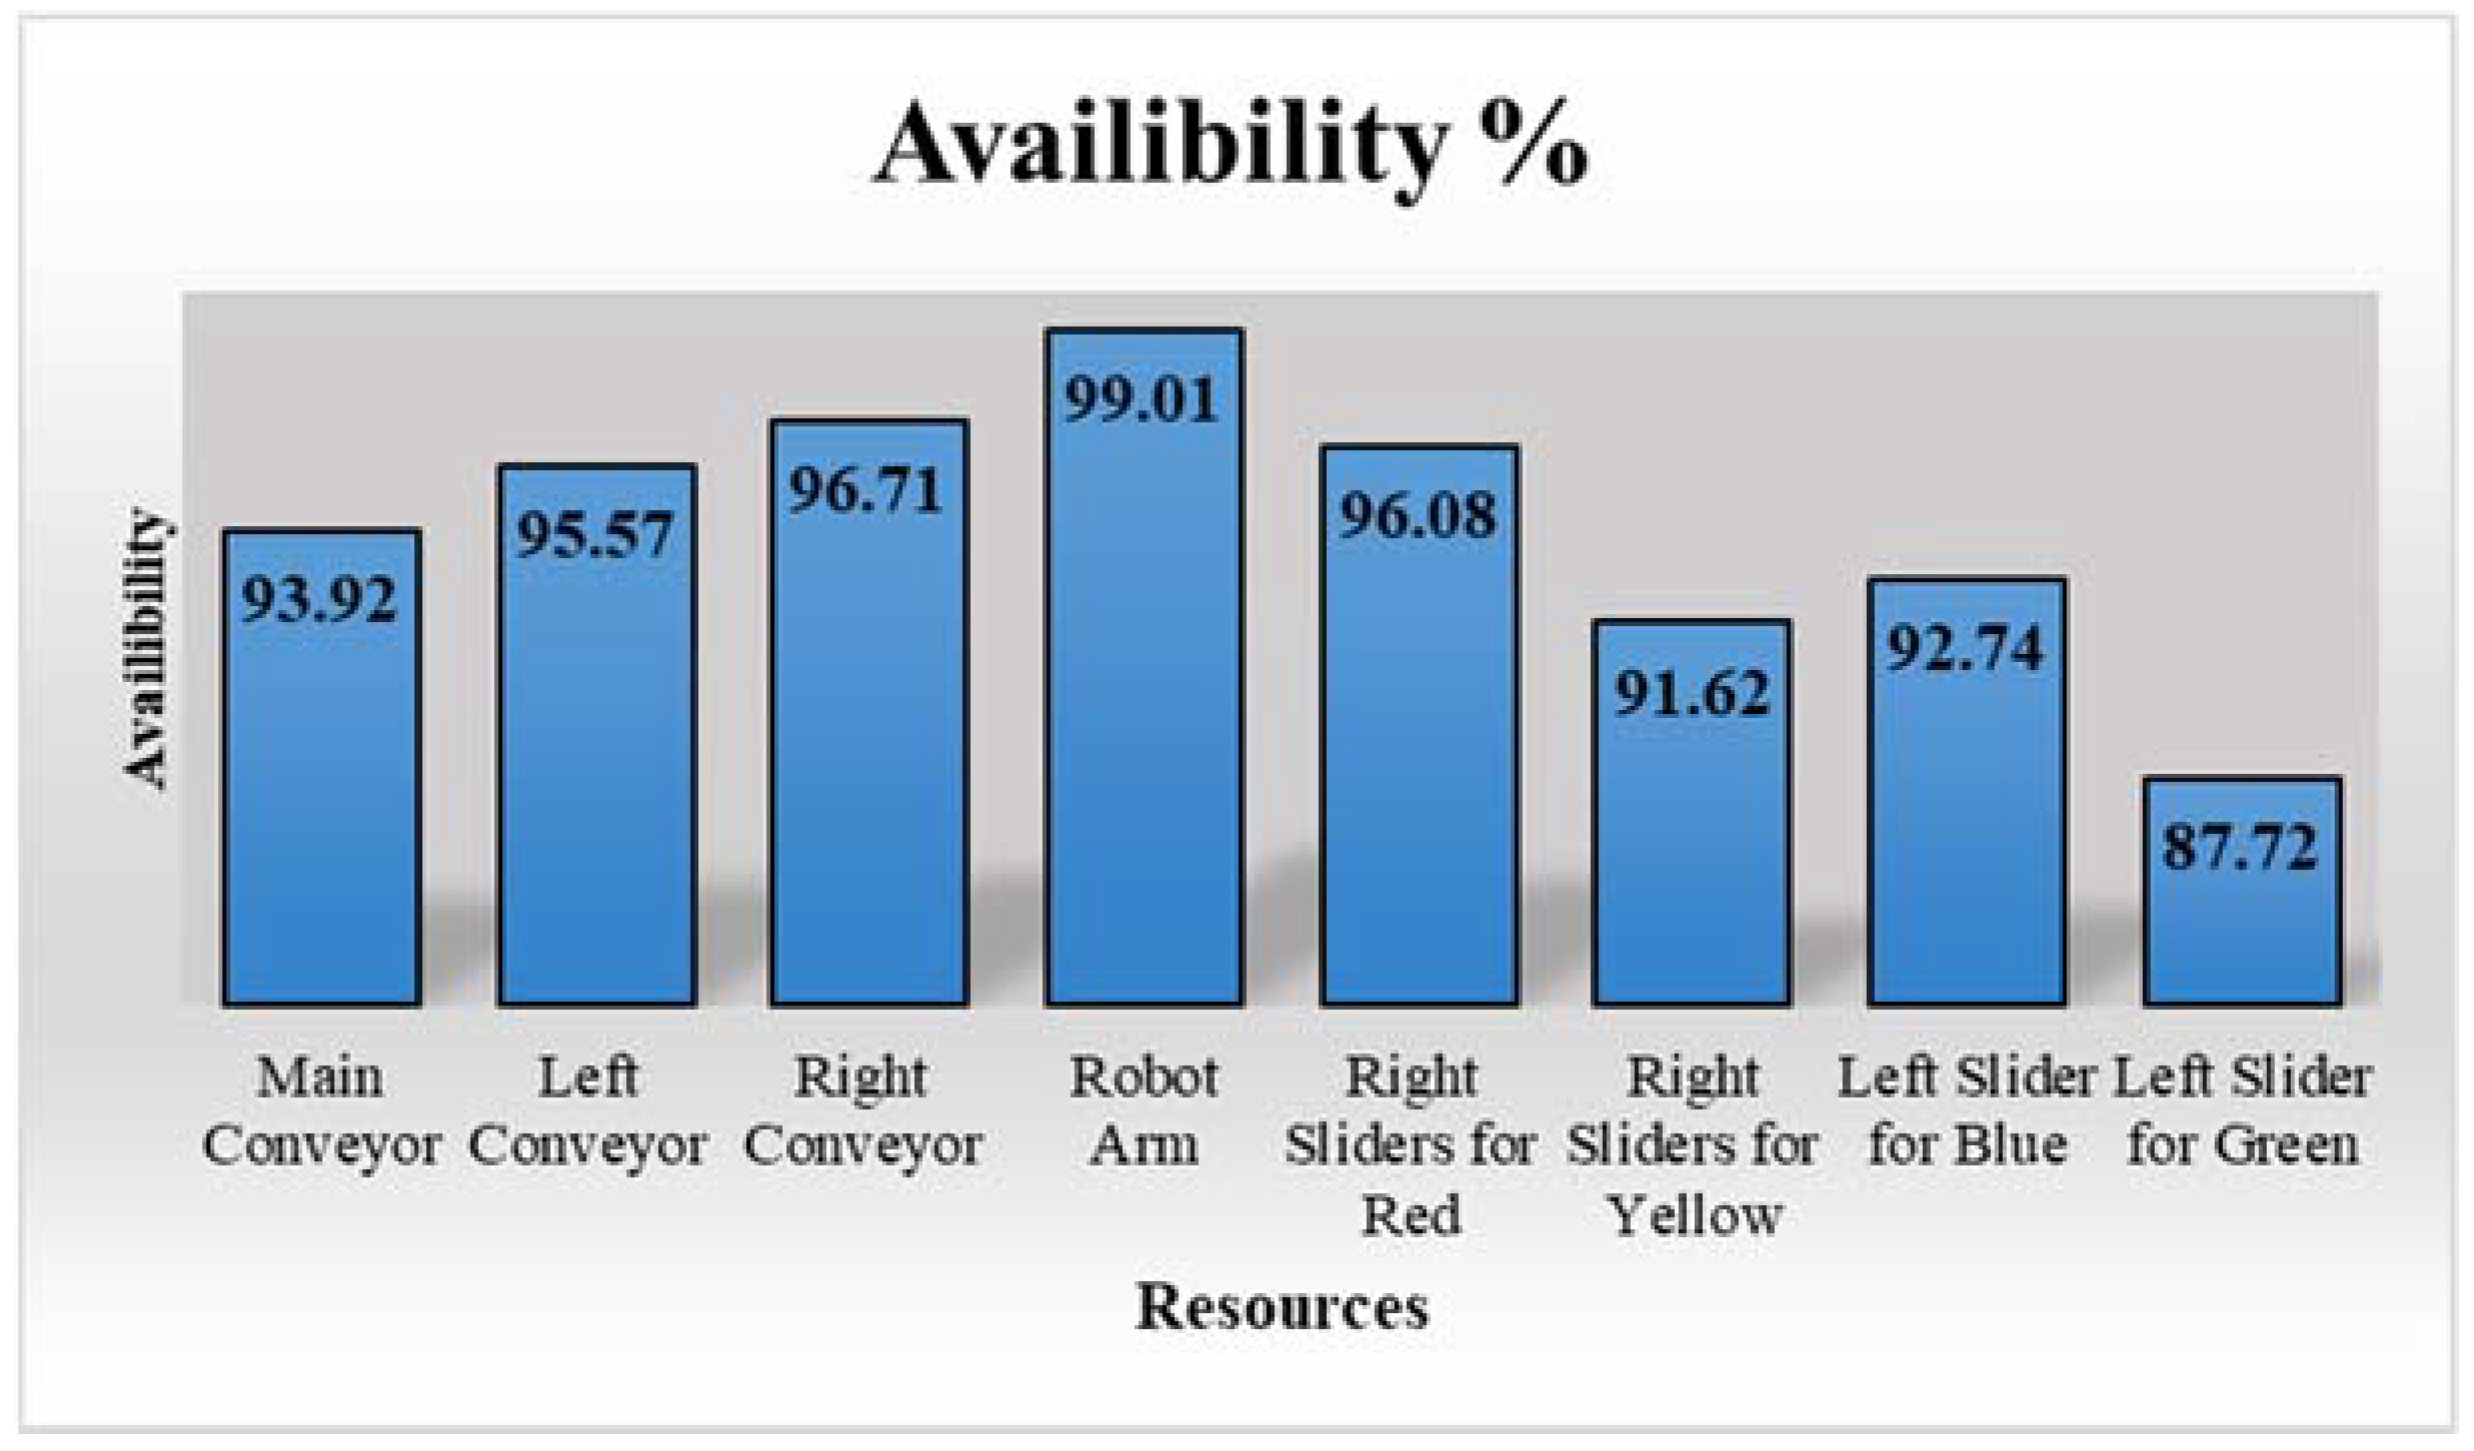
OEE percentage is calculated for each part of the system individually (each resource). This percentage provides an accurate view of how effectively the manufacturing process is running. It also makes it easy to track problems and improvements in the system over time. Availability of the resources is the first factor, and is completely dependent on resource downtime, idle time, and planned production time (
Figure 17).
Figure 18 shows that the availability of all the resources is above 90%, except that of the left slider for sliding green part. This means the overall downtime and breakdowns in the system are not significant in comparison with total functional time. The reason for these deviation from criterion is mentioned in
Table 10 as the problem and limitation of the system. The main conveyor has 2.3 s downtime, which is the result of the inflexibility of the main conveyor for the different shape of objects. In addition, the main conveyor has 30.46s idle time, which is the result of robot downtime of 0.40 s and side conveyors speed limitations. The robot itself has 99% availability because of the total idle time and downtime of 50.49 s out of 90.95 s, which is the minimum value in the comparison between the other resources. In availability percentage analysis, the sliders functionality divided into separated tasks. The reason for this differentiation is the different behavior of sliders to carry the parts to the buffers with different distances. However, as mentioned before, because of physical limitations of the selected system, these breakdowns and downtimes may vary. In order to obtain the most accurate result of the system timing, the observation should be repeated several times in a long period of system functionality. In this research, because of the system limitations, observation have often been conducted instead of increasing the period of functionality.
Overall availability of sliders is less than the resources and the reason for this difference is the instability of the slider’s tray in slider units while they are performing. Consequently, the slider speed should be kept at a minimum to compensate for this instability. In addition, sliders are the final resources in the system and defined scenario, so that the ratio of their observed idle time and total functional time is less than the other resources. The availability percentage of the left slider for green object is less than the others, at 87.72%. The reason for this percentage drop is the shape of the object, which causes downtime on the main conveyor and breakdown time for robot arm failure to pick and place the object.
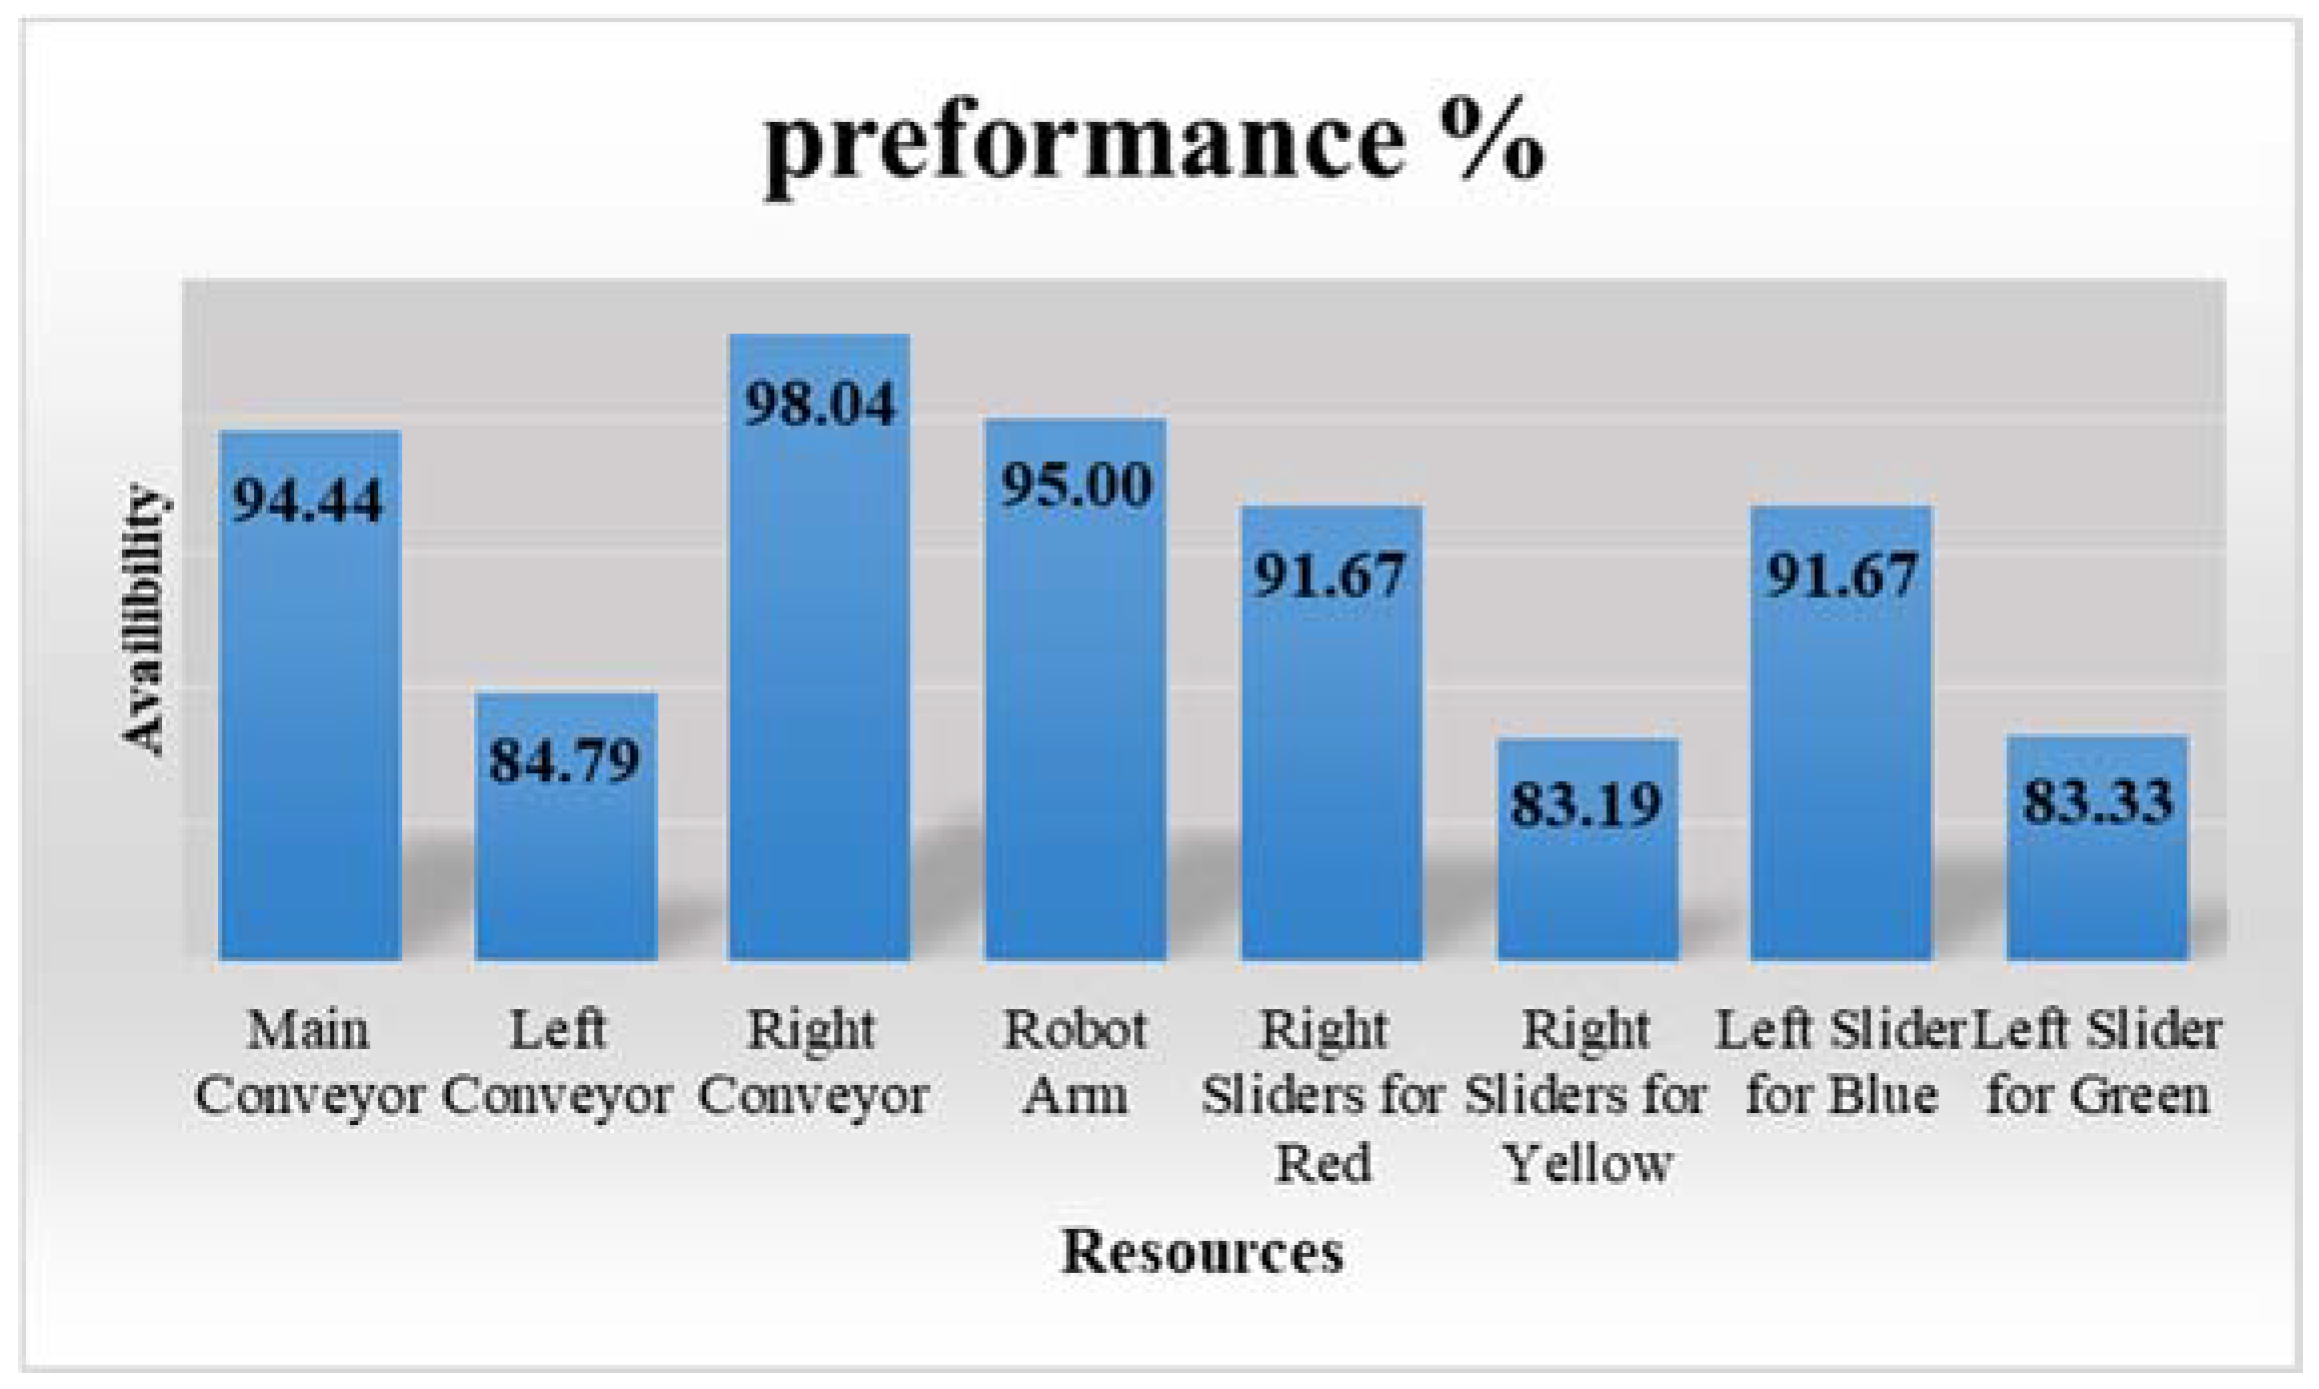
Figure 19 illustrates the performance percentage of the available resources in the system. As mentioned before, the performance of the resource is a ratio of ideal cycle time and runtime for a certain number of products. As long as the performance percentage approaches a maximum, it shows the resource has less runtime and more ideal cycle time, and is preforming as fast as possible.
The performance of sliders for transformation of yellow and green (sort range of transformation) objects is nearly same, at 83.19% and 83.33%, respectively. Sliders for transferring the red and blue objects have the better performance average of 91.67% for transferring.
Left and right conveyors performance percentages differ dramatically because of the unexpected length inequality (right conveyor is 10 cm longer than the left one). Right conveyor has 13.25% performance percentage in comparison with the left one. Although the right conveyor is longer, it has higher performance. This difference shows that the right conveyor preforms with a better speed and with less downtime. In addition, the performance of the side conveyors is totally dependent on the ideal cycle time, runtime, and total good counted products. Furthermore, total good counted products and ideal cycle time for both conveyors is considered as the same. Thus, the only reason for this issue should be the runtime. Runtime is affected by the idle time and downtime, which are both significantly less in value in the right conveyor. It is considerable to mentioned that idle and downtimes are effacing by the other resources in addition to the conveyors itself. This means that although the right conveyor is 10 cm longer than the left one, the proper value of run and downtime compensates for this difference and gives a better performance as the result.
As mentioned before, OEE percentage of the resources is the percentage multiplication of availability, performance, and quality. As the considered system in this research is a product distribution cell, all of the loading objects (products) loading into the system are assumed as passed quality products and the quality percentage for all system resources is considered as 100%.
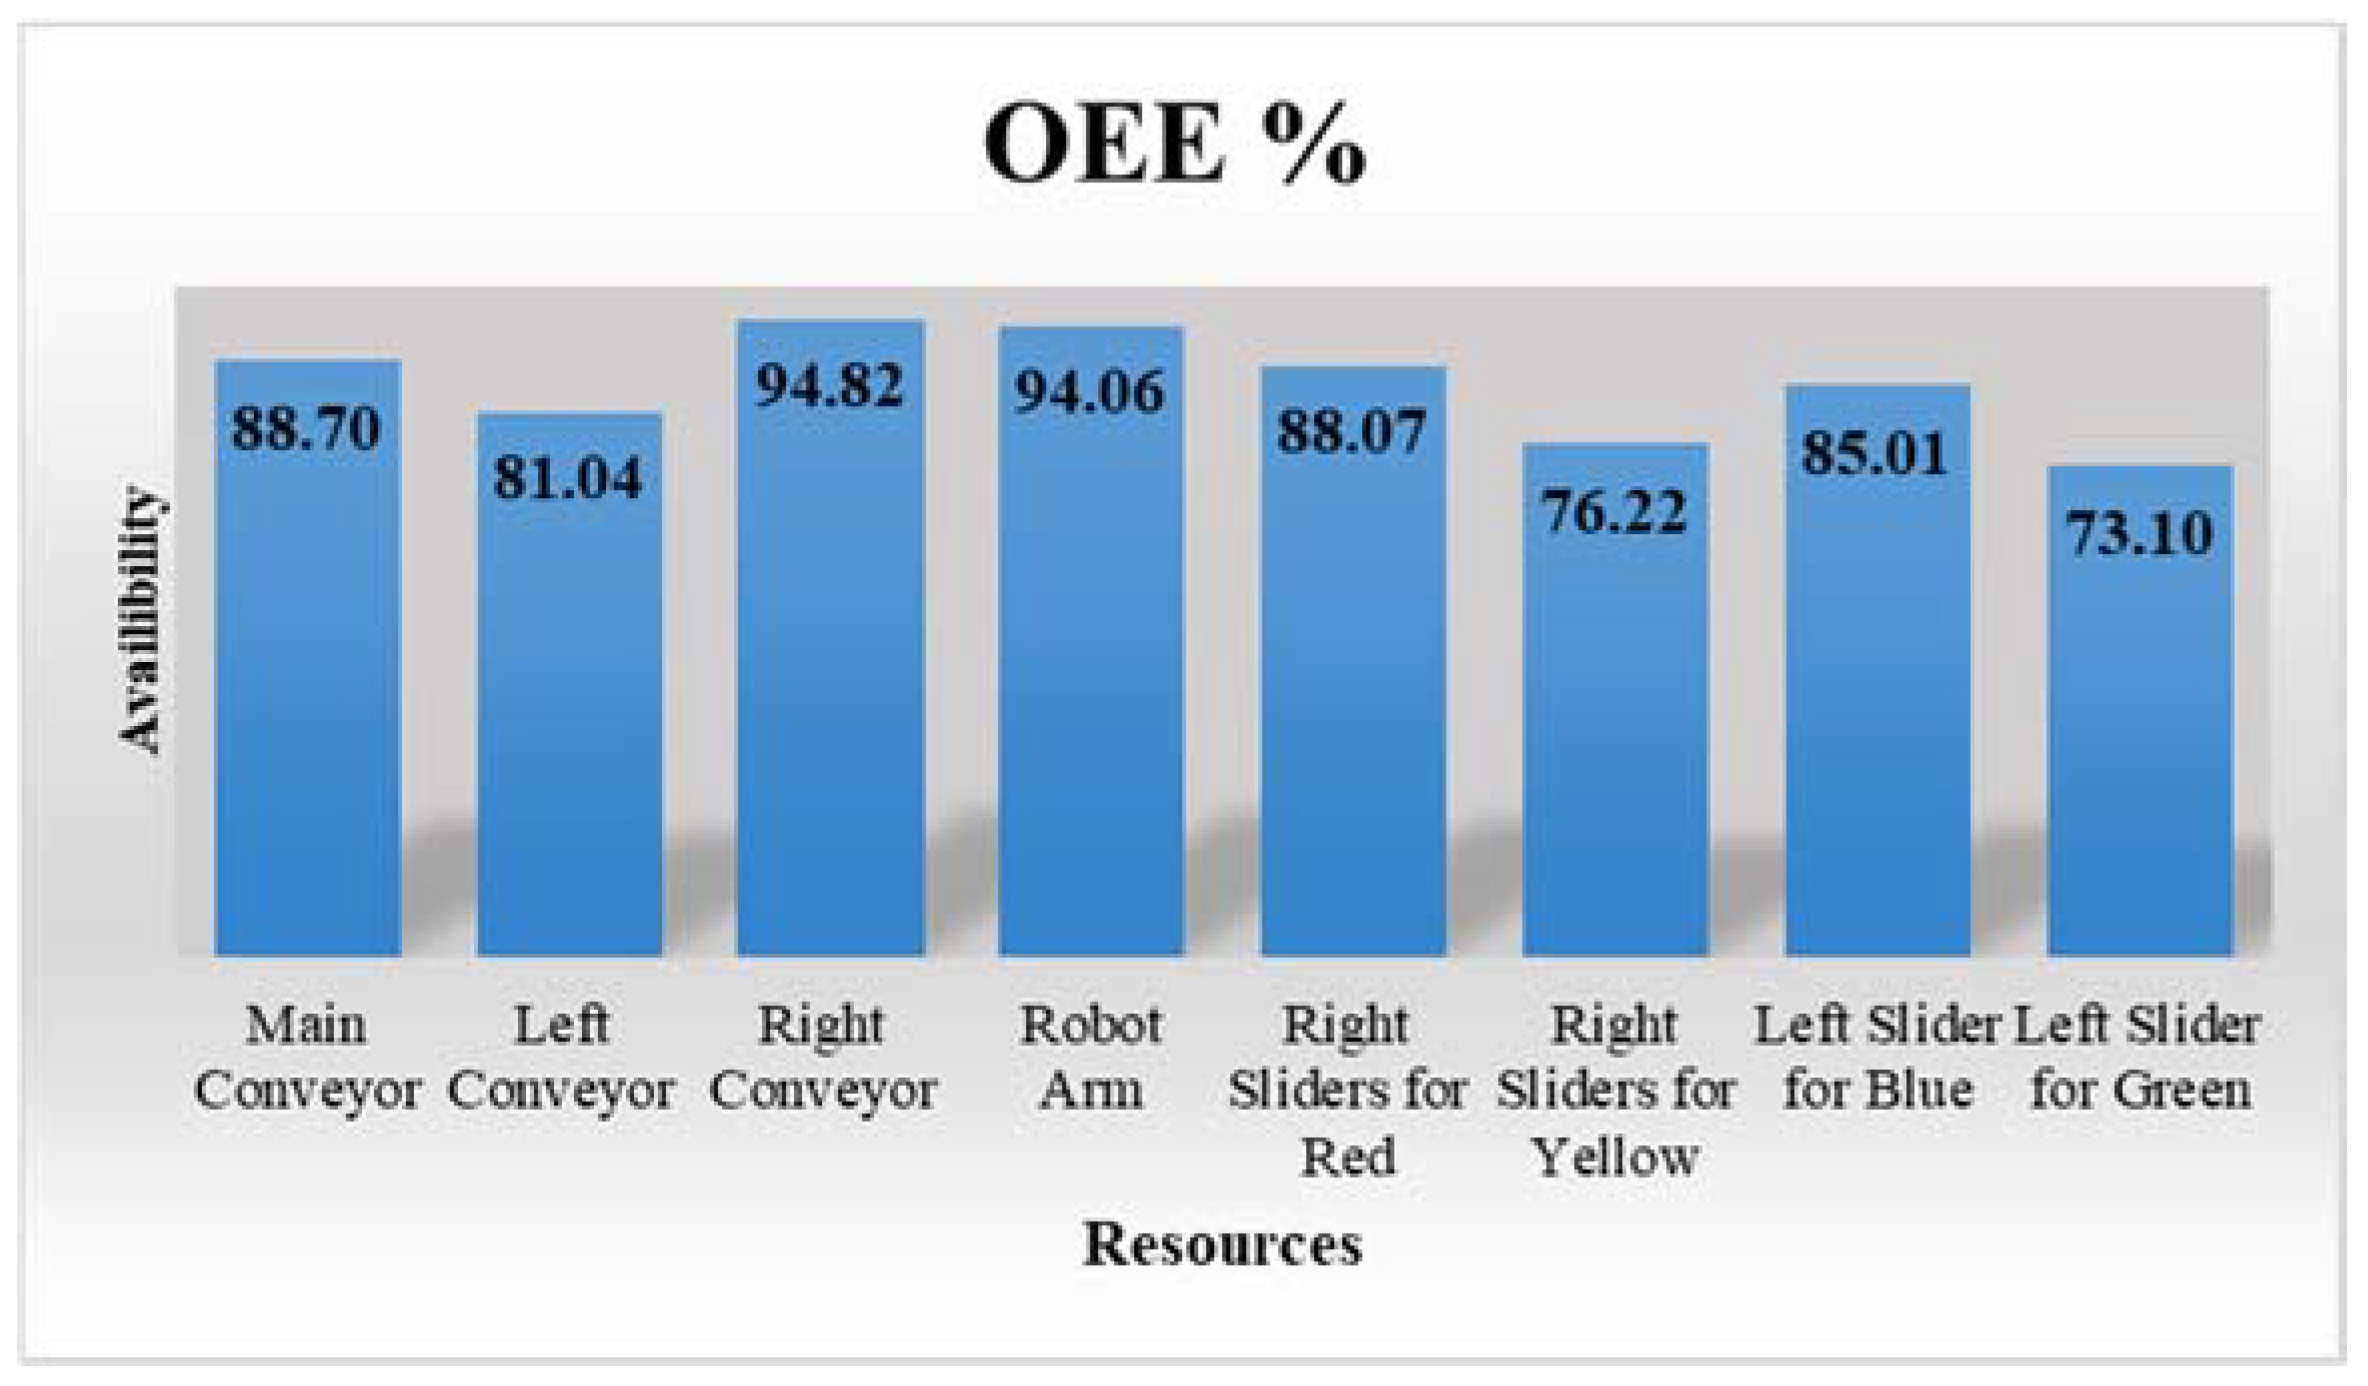
Figure 20 shows the OEE percentage of the resources individually. The effect of the mentioned issues and limitations of the system in
Table 10 is detectable on the OEE percentage of each resource. The problems occurred because rough motion of the parts and inflexibility of the conveyors to handle different shape of material and color detection limitation of the products have been neglected as a result of the assumption that all of the products are good quality products. As OEE is affected by availability and performance, its percentage is a proof of all of the identified issues and limitations by time study. This means that for an improvement and optimization idea on the system, OEE evaluation is an appropriate standard, besides time study.
As mentioned before, after analyzing the importance of timing in OEE, the sustainability of the system should be investigated. To reach to this goal, steps to evaluating the manufacturing sustainability will be explained accordingly. As the first step, the environmental impacts of the manufacturing system should be identified.
Table 12 shows that out of the main environmental impact related to the manufacturing sector, only energy consumption could be considered, and it is the only and highest priority. The reason for this selection is the type of energy resources used for the system equipment. As the source of electricity is not one of the common electricity resources, there would be no other impact other than energy intensity.
For the next step, the most useful and effective performance indicator should be selected. Because of a part of the objective of this research, time is the selected performance indicator and the other factors are neglectable because of the real selected manufacturing system (i.e., quality and quantity).
In the measurement layer of the investigation of manufacturing sustainability, the influence of the manufacturing system material and components on the selected environmental impact, which is energy consumption in this research, should be investigated.
Table 13 shows the effective material and component and their impact on energy intensity in the selected manufacturing system (
Table 13).
Considering the time effectiveness in OEE and the analytical methodology that has been utilized in this research, the relationship between time and energy consumption has been investigated.
As the result of the time study of the considered system, the efficiency of the system is time-dependent. This means that by optimizing the system from any point of view (hardware, software, and layout design optimizations methods), manufacturing times will be directly affected. On the other hand, energy consumption of the equipment or among the whole of the enterprise has a direct relationship with device utilization time (and even idle time in some cases). OEE results show, for a constant amount of good quality products in the target system, increasing the utilization time and decreasing the idle time increase the performance and the availability of the system consequently. Even if the utilization time of the equipment and devices will be kept constant without increasing, by optimizing the system, the idle time will be decreased, and energy consumption will be decreased accordingly.
According to OECD rules, the time is the only selected factor out of the other effective factors in manufacturing system performance for the target system. Electricity consumption is the only source of energy in energy intensity as the only category of factors with impact on manufacturing sustainability. In this case, in order to have more sustainable manufacturing, the amount of consumed electricity should be minimal (
Figure 21). The only way to reach this goal in the target system is reducing the idle times and increasing the utilization time.
As mentioned before, because of the property of the selected system (small-scale educational system) and the energy resource that has been used to power the system, the calculation of the energy consumption, and the possible difficulties that might occur to find the influence of the OEE percentage on manufacturing sustainability, need a proper industrial manufacturing system with a long period of functionality for time and energy consumption observation.
6. Conclusions
In this research, an intelligent material handling system for product or object differentiation has been designed and implemented. The developed system has been considered as an example of SMEs with a simple manufacturing system. A specific algorithm has been created to deploy an agent base control architecture across the system. By utilizing this control algorithm and intelligent components, the system approaches to Industry 4.0 manufacturing paradigm. To investigate the difficulties of implementation of Industry 4.0 for such a system as SMEs, for example, the system functionality has been evaluated concerning different manufacturing aspects. To evaluate the system, time has been focused on as the most effective factor between the other manufacturing aspects. OEE has been selected as the standard for measuring manufacturing productivity to highlight the influence of time. As time is the main variable on calculation of the availability, performance, and consequently OEE percentage, a proper time study has been performed on the system. The results of time study extract some issues and limitations in the system during the preforming. The time study result has been categorized to be utilized in calculation of availability, performance, and OEE of each device. The obtained result of the time study and OEE could be used to evaluate any change or optimization methods to improve the productivity. In general, reduction in the expenditure of over timing, deferment of investments of larger capital, reduction in downtime/idle time, and improvement in the performance of the operator are the benefits of OEE for SMEs. In addition, based on OECD rules, the relationship between OEE results and manufacturing sustainability described with selecting the time and consumed electricity as main effective factors for OEE and OECD, respectively. To sum up, this study has tried to provide a solution for SMEs to make smooth implementation of a sustainable, intelligent manufacturing system considering the Industry 4.0 preparation requirements. The only case study in this research is a small-scale educational manufacturing system. Because of this selection, the research and the proposed methodology have been conducted on a system that might have different properties and functionality in comparison with real industrial manufacturing systems. The case study system production time is limited to a short period. Furthermore, the system has been developed utilizing educational components, which is not correct to run the experiment repeatedly over a long period. Thus, investigation of the proposed method on more industrial manufacturing systems as the case study, and choosing the ones with ability to run the experiment for long times, are considered as the future work of this research.


