Article

Large-Scale Synthesis of Carbon Dots Driven by Schiff Base Reaction at Room Temperature

1
Key Laboratory for Advanced Materials, Shanghai Key Laboratory of Functional Materials Chemistry, Frontiers Science Center for Materiobiology & Dynamic Chemistry, School of Chemistry & Molecular Engineering, East China University of Science and Technology, Shanghai 200237, China
2
Hoffmann Institute of Advanced Materials, Shenzhen Polytechnic University, 7098 Liuxian Blvd, Nanshan District, Shenzhen 518055, China
3
School of Chemical and Environmental Engineering, Shanghai Institute of Technology, 100 Haiquan Road, Shanghai 201418, China
*
Authors to whom correspondence should be addressed.
Inorganics 2024, 12(12), 310; https://doi.org/10.3390/inorganics12120310
Submission received: 30 October 2024 / Revised: 22 November 2024 / Accepted: 25 November 2024 / Published: 27 November 2024
(This article belongs to the Special Issue Synthesis and Application of Luminescent Materials, 2nd Edition)

Abstract

:
Photoluminescent carbon dots (CDs) have received increasing attention because of their admirable photophysical performances. The current strategies for synthesizing CDs typically require high energy consumption levels, and the ability to synthesize CDs at ambient temperature would be highly desirable. Herein, we design an energy-efficient approach to synthesize CDs through a Schiff base crosslinking between 2,5-dihydroxy-1,4-benzoquinone and tetraethylenepentamine at room temperature. The obtained CDs possess maximum photoluminescence (PL) emissions of 492 nm. Moreover, the proposed CDs possess good stability and a concentration-dependent PL and their maximum emissions can redshift from 492 to 621 nm as the CDs concentration increases. Because of their good luminescent properties, the CDs can be employed as optical probes for doxorubicin detection using the inner filter effect. This study develops a powerful approach for the large-scale synthesis of CDs with a superior performance.

Graphical Abstract

1. Introduction

Carbon dots (CDs), a type of novel luminescent nanocarbon material, have received significant attention since their discovery in 2004 by Scrivens’s group [1]. Due to their low cost, ease of preparation, tunable photoluminescent properties, good water solubility, and excellent biocompatibility, CDs have shown tremendous promise in chemical sensing, drug delivery, photocatalysis, cancer treatment, optoelectronic devices, and cellular imaging [2,3,4,5]. Photoluminescent CDs, including a variety of spherical-like or multi-sheet carbon-based nanomaterials, are classified into carbon nanodots, carbon quantum dots, carbon nanoclusters, carbonized polymer dots, and graphene quantum dots based on their structural characteristics and properties [6].
Currently, various synthetic strategies are being developed to obtain CDs, including hydrothermal/solvothermal methods [7,8,9,10,11], the microwave-assisted method [12,13,14,15,16], laser irradiation [17,18], and chemical oxidation [19,20]. Among these strategies, hydrothermal/solvothermal methods and microwave-assisted synthesis are the most widely used due to their potential application to a wide range of raw materials [21]. However, several challenges remain, such as the need for specialized experimental equipment and the high energy consumption required due to the comparatively high temperatures that are used [22]. Additionally, such high temperatures often generate numerous by-products, complicating the subsequent purification of the CDs. Although chemical oxidation can synthesize CDs at room temperature, the process requires the introduction of a concentrated alkali or acid. The use of strong oxidizing agents (such as HNO3) not only increases the difficulty of post-treatment, but also leads to environmental issues and increases production costs. Therefore, developing a facile, sustainable, and energy-efficient method to fabricate CDs is desirable.
Given that the Schiff base reaction, involving the condensation of primary amine with a carbonyl compound, can proceed under mild conditions, we propose that this reaction is an ideal approach for synthesizing CDs at room temperature [23,24]. In this work, luminescent CDs are synthesized through a one-step Schiff base crosslinking at room temperature, using 2,5-dihydroxy-1,4-benzoquinone (DB) and tetraethylenepentamine (TEPA) as the raw materials (Scheme 1). This synthesis strategy does not require special equipment, additional energy, or the use of strong oxidants, allowing for the large-scale and sustainable synthesis of CDs. The proposed CDs display excitation-dependent photoluminescence (PL) emissions and their maximum emissions can reach 492 nm with an excitation at 410 nm. Additionally, the PL of CDs displays a significant red shift as the concentration increases. Because of the inner filter effect (IFE) between CDs and doxorubicin (DOX), nanosized CDs can serve as good optical probes for the determination of DOX.

2. Results and Discussion

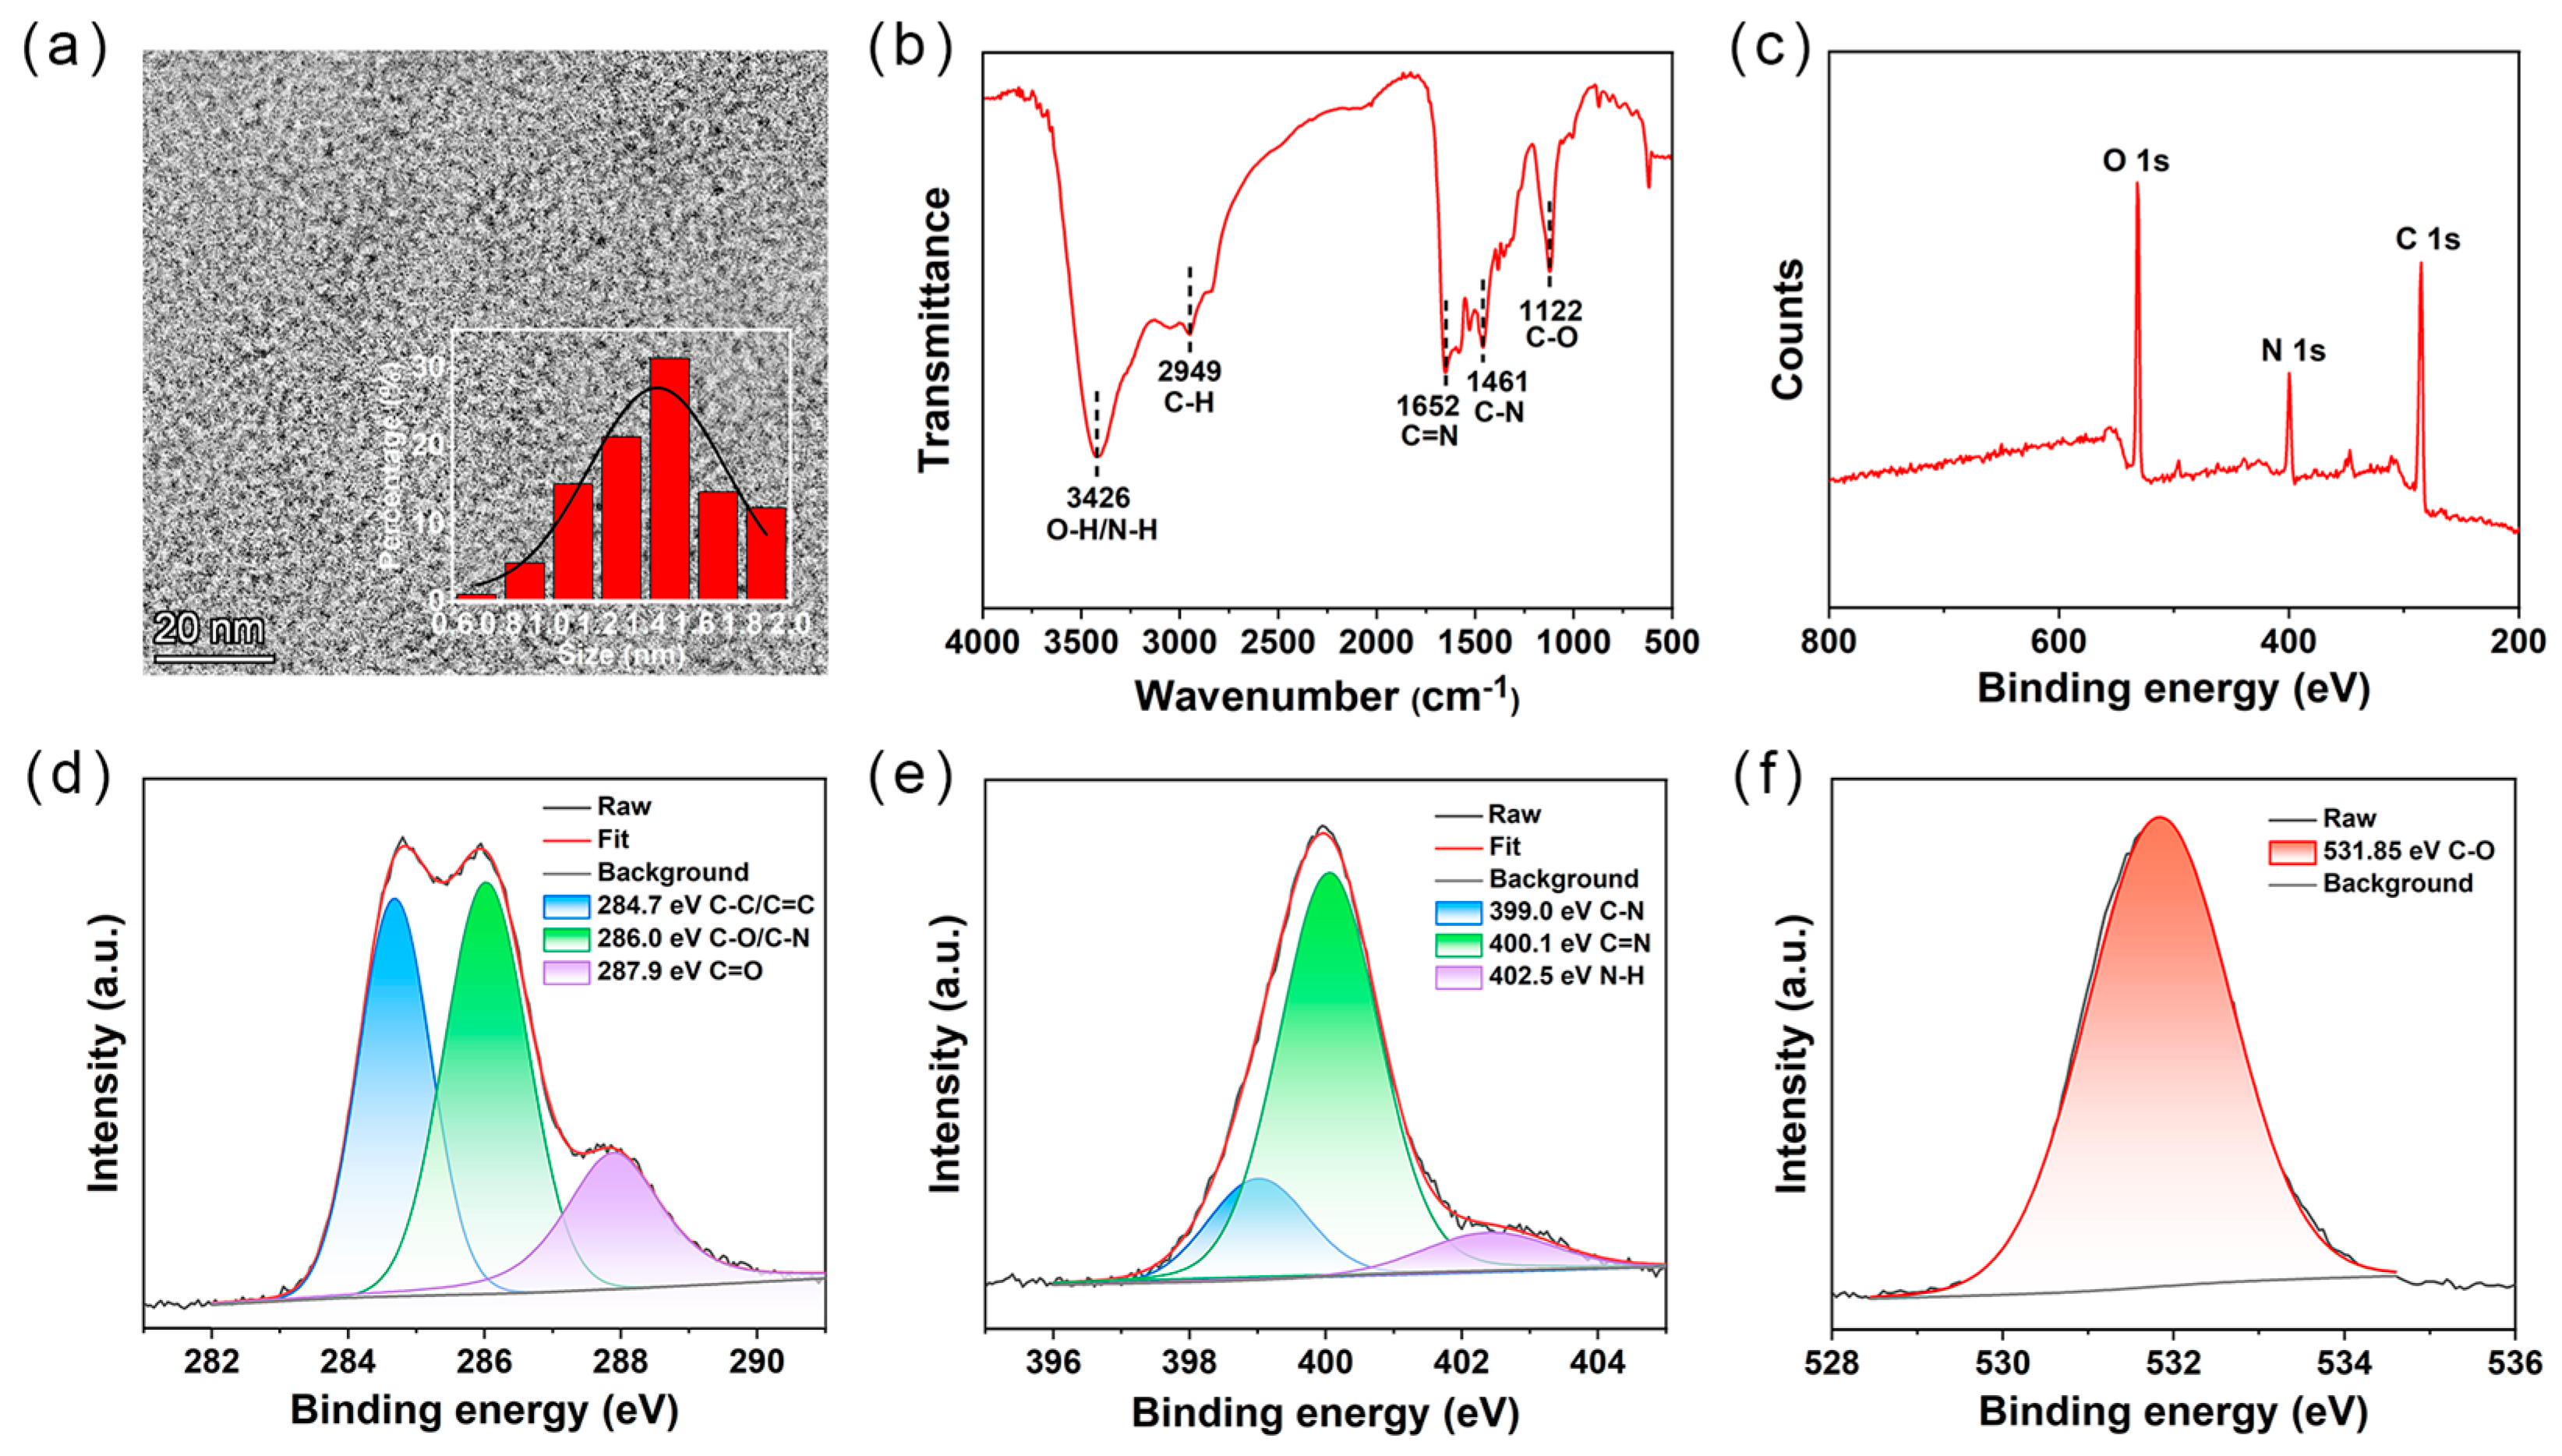
2.1. Formation and Structural Analysis of CDs

Photoluminescent CDs can be fabricated via a facile Schiff base crosslinking between TEPA and DB at room temperature, as described in the Experimental Section. As illustrated in Figure 1a, the transmission electron microscopy (TEM) image clearly exhibits that the obtained CDs are non-crystalline, displaying a disordered intrinsic structure. The proposed CDs have a size range from 0.6 to 2.2 nm according to the statistical analysis of particle size. The Raman spectrum (Figure S1) of CDs displays two sharp peaks at approximately 1567 cm−1 and 1300 cm−1, which belong to the G band (ordered sp2-hybridized carbon) and D band (disordered sp3-hybridized carbon), respectively. The high intensity ratio (ID/IG) of 3.82 indicates a significant degree of disorder in the CDs’ structure.
The structure of the CDs was further investigated using X-ray photoelectron spectrometer (XPS) and Fourier transform infrared (FT-IR) techniques. According to Figure 1b, the FT-IR results reveal the existence of O-H/N-H (3426 cm−1), C-H (2949 cm−1), C=N (1652 cm−1), C-N (1461 cm−1), and C-O (1122 cm−1) groups [25]. It should be noted that the existence of a C=N bond reveals that CDs can be formed via the Schiff base reaction between TEPA and DB. Additionally, the XPS spectrum (Figure 1c) shows that the CDs are composed of C, N, and O, with an atomic percentage of 60.0%, 15.3%, and 24.7%, respectively (Table S1). Furthermore, the results of the elemental analyzer show that the obtained CDs contain C (47.4%), N (23.3%), O (21.1%), and H (8.2%) elements (Table S2). Moreover, the high-resolution C1s spectrum shows the presence of C=C/C-C (284.7 eV), C-N/C-O (286.0 eV), and C=O (287.9 eV) groups (Figure 1d) [26]. The high-resolution N1s spectrum (Figure 1e) is deconvoluted into three peaks corresponding to C-N (399.0 eV), C=N (400.1 eV), and N-H (402.5 eV) [27]. Moreover, the peak in the high-resolution O1s spectrum (Figure 1f) at 531.85 eV indicates the presence of C-O groups [28]. Based on the above results, CDs are formed through a Schiff base crosslinking between DB and TEPA, and their surface contains abundant chemical groups, including amino and hydroxyl groups.

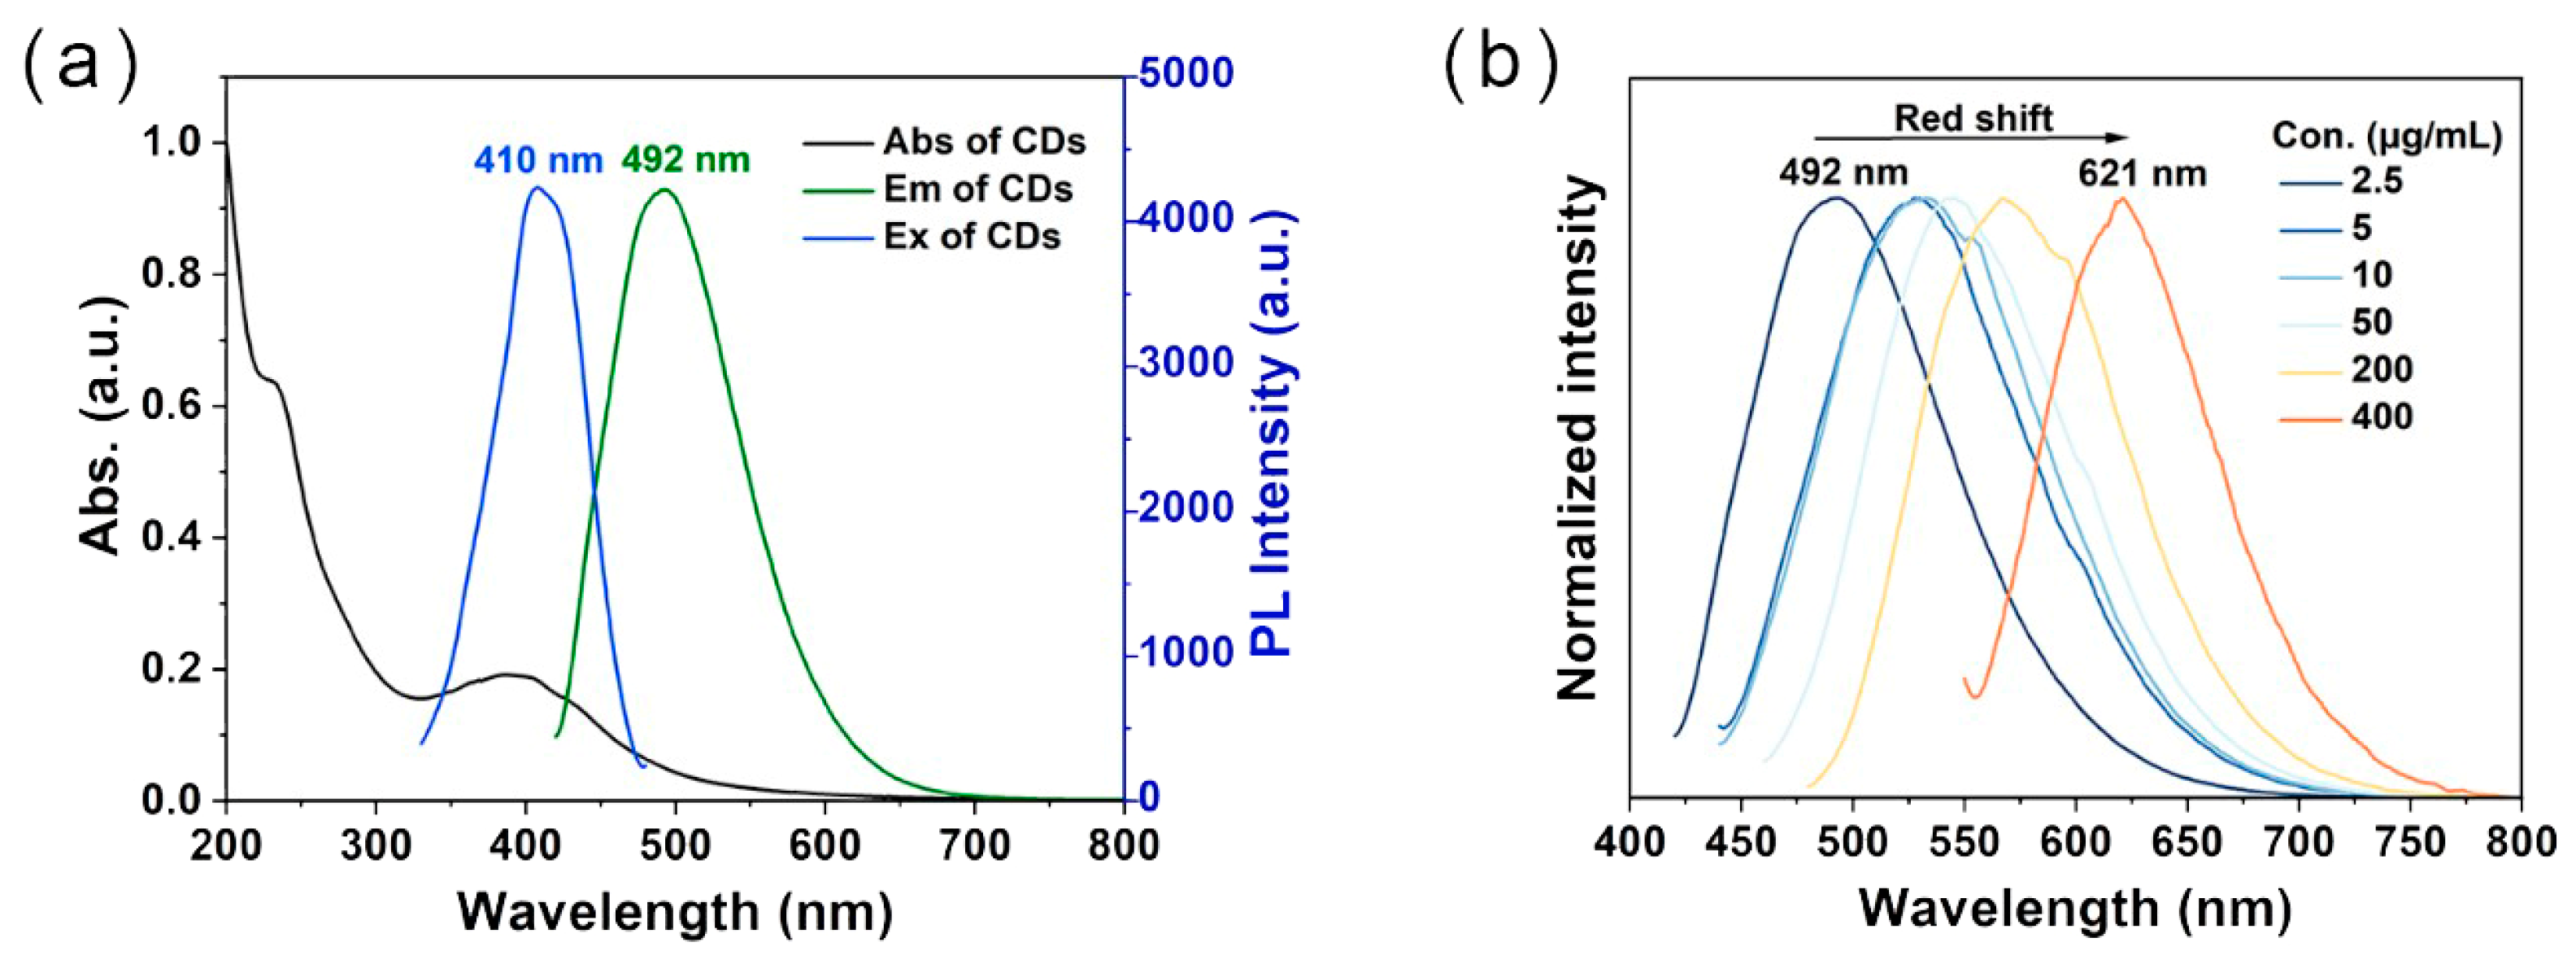
2.2. Photophysical Properties of the Prepared CDs

The photophysical performances of CDs were further studied. The UV–vis spectrum (Figure 2a) of the CDs displays two UV peaks at 250 and 400 nm, which are attributed to the C=C bond (originating from the π-π* transition) and C=N bond (from the n-π* transition), respectively [29]. The PL spectra indicate that the maximum excitation wavelength of CDs (2.5 µg/mL) is 410 nm, with a corresponding maximum emission wavelength of 492 nm. More interestingly, the resulting CDs were revealed to lead to concentration-dependent PL emissions. This reveals that the PL emissions of the CDs can be tuned using the change in the CDs’ concentration. As the concentration increases, the PL of the CDs can gradually redshift from 492 to 621 nm (Figure 2b). The maximum PL of the CDs shifted from 492 nm (2.5 μg/mL CDs in aqueous solution) to 532 nm (5.0 μg/mL), 536 nm (10.0 μg/mL), 545 nm (50.0 μg/mL), 582 nm (200.0 μg/mL), and 621 nm (400.0 μg/mL) (Figure S2). Additionally, the absorption spectra of the CDs at different concentrations show that as the concentration increases from 2.5 to 400 μg/mL, the maximum absorption peak of the CDs gradually redshifts to around 450 nm, and the absorption band extends to above 600 nm (Figure S3). Moreover, the results of the zeta potentials display that the proposed CDs are electrically neutral and minimally affected by concentration (Figure S4). The concentration-dependent emissions phenomenon was first observed on CDs synthesized at room temperature. The concentration-dependent emissions were attributed to the change in interparticle distance at different concentrations [30]. At low concentrations, the increase in the distance between CD particles reduces their interactions, resulting in a blue shift in the spectrum and an increase in PL intensity due to the radiation processes. However, at high concentrations, the decrease in the distance between CD particles increases their interactions, causing a spectral redshift and a decrease in PL intensity due to the self-absorption of CDs.

2.3. Stability Investigation of the Proposed CDs

Stability is a crucial aspect of the performance of CDs, preventing false-positive or false-negative results in chemical sensing [31]. First, the PL intensity of CDs was investigated at various pHs. The PL intensity of the CDs remained nearly constant in the pH range from 3.4 to 8.4 (Figure S5), with a slight decrease in intensity as the pH value increased from 8.4 to 10.6. Additionally, the stability of CDs was evaluated under different NaCl solution concentrations, with no significant change in PL intensity being observed even at NaCl concentrations of 4 M (Figure S6). Furthermore, the PL intensity of CDs showed only a slight decrease after exposure to high-power UV light for 120 min (Figure S7) and remained almost constant under low-power handheld UV lamps for 5 days (Figure S8), suggesting strong resistance to photobleaching. Collectively, these results suggest that the prepared CDs exhibit good chemical stability, making them highly suitable for chemical sensing applications.

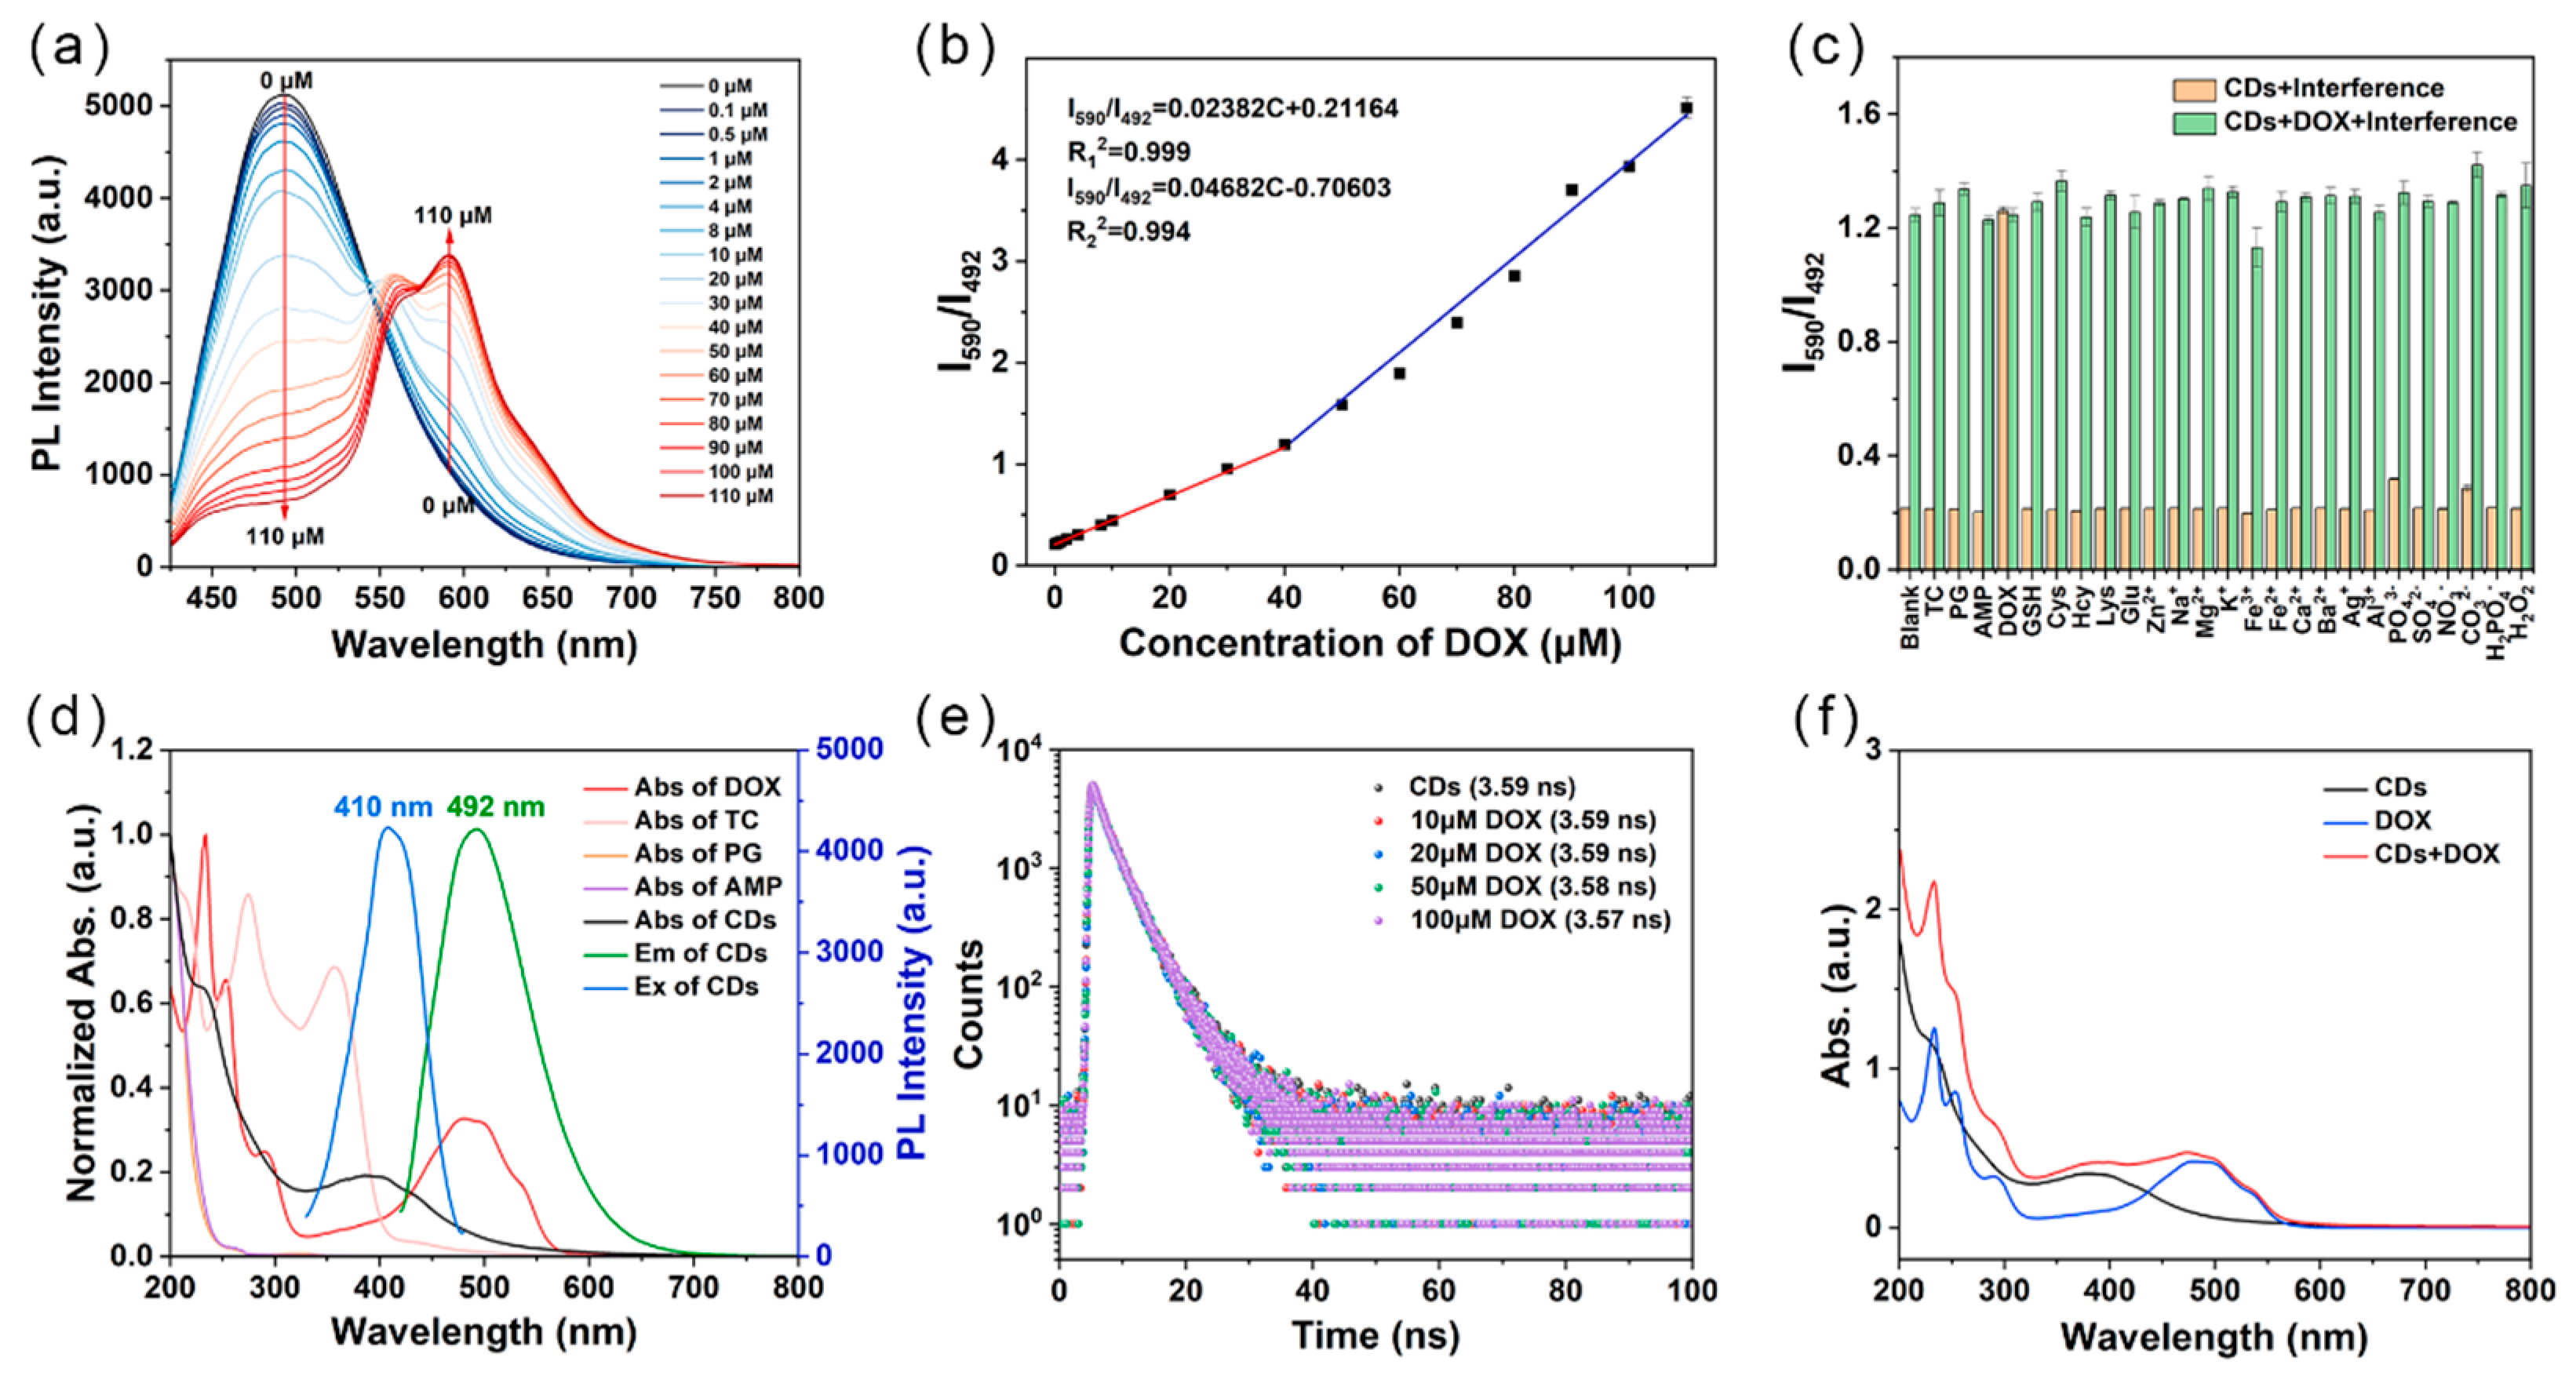
2.4. Detection of DOX by CDs

To investigate the sensing performance of CDs, DOX was used as a model analyte. The PL emissions of CDs can be quenched upon the addition of DOX solution. The CDs’ ability to detect DOX was further evaluated using PL spectroscopy. With an increase in DOX concentration, the PL intensity of CDs at 492 nm reduced, while the intensity of DOX increased at 590 nm (Figure 3a). As shown in Figure 3b, the intensity ratio of the two PL peaks (I590/I492) exhibits a good linear correlation with DOX concentration in the ranges of 0.1–40 μM and 40–110 μM. The limit of detection (LOD) was calculated to be 0.029 μM according to the 3σ/k. To assess the selectivity of CDs to DOX, the PL response of CDs to potential interferents was further investigated. As shown in Figure 3c, common antibiotics (tetracycline (TC), penicillin (PG), and ampicillin (AMP)), amino acids, ions, glutathione (GSH), glucose, and H2O2 had little effect on the PL intensity of CDs before and after adding DOX. These results indicate that CDs exhibit good selectivity and anti-interference capabilities for DOX detection, making them highly promising for use in complex samples.

2.5. Mechanism of the Detection of DOX

The specific response mechanism of DOX was further investigated. The IFE, a process of non-radiative energy conversion, was applied for the determination of analytes based on their competitive light absorption [32]. High-performance IFE normally requires an excellent spectral overlap (the excitation and/or emission peak of optical probes and the absorption peak of the tested substance). To assess this, the UV–vis spectra of DOX, CDs, and various antibiotics, such as TC, PG, and AMP, were measured. As shown in Figure 3d, only the UV–vis spectrum of DOX significantly overlapped with the emission bands of CDs, indicating that DOX efficiently absorbs the emissions from CDs, consistent with the IFE mechanism [33]. To further demonstrate the quenching mechanism, the PL lifetimes of CDs after traducing DOX were determined using a time-correlated single-photon counting (TCSPC) technology. Subsequently, the PL lifetime of the CDs was calculated using a double exponential fitting method. As shown in Figure 3e, in the presence of 10, 20, 50, and 100 μM DOX, the average lifetime remained consistent with that observed in the absence of DOX (3.59 ns) (Table S3). In addition, no new absorption bands appeared when CDs were mixed with DOX, indicating that the new complexes cannot form between CDs and DOX (Figure 3f). Taken together, these results strongly confirm that the IFE is responsible for the PL quenching of the CDs induced by DOX.

3. Materials and Methods

3.1. Reagents

TEPA and DB were obtained from Solarbio Life Science Co., Ltd. (Beijing, China). DOX, TC, PG, and AMP were purchased from Aladdin Reagent Co., Ltd. (Shanghai, China). Zinc chloride (ZnCl2), sodium chloride (NaCl), magnesium chloride (MgCl2), potassium chloride (KCl), ferrous chloride (FeCl2), ferric chloride (FeCl3), calcium chloride (CaCl2), barium chloride (BaCl2), silver chloride (AgCl), and aluminum chloride (AlCl3) were purchased from Titan Technology Co., Ltd. (Shanghai, China). Potassium phosphate (K3PO4), potassium nitrate (KNO3), potassium sulfate (K2SO4), sodium dihydrogen phosphate (NaH2PO4), and potassium carbonate (K2CO3) were obtained from Macklin Reagent Co., Ltd. (Shanghai, China). GSH, Cys, Hcy, Lys, Glu, and H2O2 were provided by Energy Chemical Co., Ltd. (Shanghai, China). All reagents were weighed using an analytical balance (ME 104, Mettler Toledo, Zurich, Switzerland).

3.2. Apparatus and Characterization

TEM images were obtained using a high-resolution transmission electron microscope (Talos F200X, Thermo Fisher, Waltham, MA, USA). The FT-IR study was conducted using an FT-IR spectrometer (FTIR-8400S, Hitachi, Tokyo, Japan). XPS analysis was conducted using an X-ray photoelectron spectrometer (Thermo Fisher, Waltham, MA, USA). UV–vis spectra were obtained using a UV spectrophotometer (F759S, Lengguang, Shanghai, China). PL spectra measurements were taken using a fluorescence spectrophotometer (F97pro, Lengguang, Shanghai, China). The PL lifetime was tested using a steady-state/transient spectrometer (FLS1000, Edinburgh Instruments, Livingston, Britain).

3.3. Preparation and Purification of CDs

A simple room-temperature method was proposed to synthesize CDs. Specifically, 10 mg of DB was dissolved in 4.8 mL of ultrapure water, followed by the introduction of 200 μL of TEPA. The solution was then ultrasonically treated for 30 min to ensure the uniform mixing of the reactants. After a thorough mixing, the solution was left undisturbed for three days to allow for CDs to form. The resulting CDs solution was dialyzed in a dialysis bag with a cut-off molecular weight of 100–500 Da for three days to remove small molecules. The solution was subsequently freeze-dried to obtain CDs powder, which was redispersed in ultrapure water.

3.4. Ratiometric Detection of DOX by CDs

Firstly, the CDs solution (0.05 mg/mL, 100 μL) was injected into 1.8 mL of ultrapure water and various concentrations of DOX (100 μL) were introduced. Subsequently, the solution was incubated (5 min). After that, the mixed solution was transferred to a quartz cuvette to further measure its PL intensity at a maximum excitation of 410 nm. Furthermore, the selectivity of CDs to DOX was investigated. Various interferents, such as antibiotic (TC, PG, AMP), amino acids (Cys, Hcy, Lys), different ions (ZnCl2, NaCl, MgCl2, KCl, FeCl2, FeCl3, CaCl2, BaCl2, AgCl, AlCl3, K3PO4, NaH2PO4, K2SO4, KNO3, K2CO3), GSH, Glu, and H2O2, were replaced with DOX at the high concentration of 100 μM. The PL spectra excitation was determined to be 410 nm and the PL intensities at 492 nm and 590 nm were recorded.

4. Conclusions

In conclusion, a new, simple approach was developed to synthesize CDs with tunable PL emissions at room temperature. This synthesis strategy, based on Schiff base crosslinking using DB and TEPA as precursors, is both energy-efficient and environmentally friendly. The resulting CDs exhibit excellent stability, making them highly suitable for chemical sensing. According to the IFE, CDs can serve as PL nanoprobes for the highly sensitive determination of DOX, showing a linear range from 0.1 to 110 μM and demonstrating great potential for the determination of DOX in complex samples.

Supplementary Materials

The following supporting information can be downloaded at: https://www.mdpi.com/article/10.3390/inorganics12120310/s1, Figure S1: Raman spectrum of the CDs; Table S1: Element composition of the CDs, measured using XPS spectrum; Table S2: Element composition of the CDs, measured using an elemental analyzer; Figure S2: PL spectra of CDs solution with different concentrations at different excitation wavelengths; Figure S3: The absorption spectra of CDs with different concentrations; Figure S4: The zeta potentials of CDs with different concentrations; Figure S5: Effect of pH on the PL intensity of the CDs; Figure S6: The stability of the CDs in different concentrations of salty medium; Figure S7: Photostability of the CDs (2.5 μg/mL) under continuous high-power UV irradiation using a fluorescence spectrophotometer; Figure S8: Photostability of the CDs (2.5 μg/mL) under continuous irradiation using low-power handheld UV lamps; Table S3: Lifetimes of the CDs after adding different concentrations of DOX solution.

Author Contributions

Data curation, J.S. and S.C.; formal analysis, J.S. and S.C.; funding acquisition, D.L.; methodology, J.S.; project administration, D.L.; software, Y.G. and J.L.; supervision, R.Q., B.C. and D.L.; validation, J.S.; visualization, S.C.; writing—original draft, J.S. and S.C.; writing—review and editing, B.C. and D.L. All authors have read and agreed to the published version of the manuscript.

Funding

The authors appreciate the financial support from the National Natural Science Foundation of China (22176058), Science and Technology Commission of Shanghai Municipality (22ZR1416800 and 23ZR1416100), the Program of Introducing Talents of Discipline to Universities (B16017), and the Fundamental Research Funds for the Central Universities (222201717003).

Data Availability Statement

The original contributions presented in this study are included in the article. Further inquiries can be directed to the corresponding author.

Acknowledgments

We thank the Research Center of Analysis and Test of East China University of Science and Technology for their help with the characterization.

Conflicts of Interest

The authors declare no conflicts of interest.

References

  1. Xu, X.Y.; Ray, R.; Gu, Y.L.; Ploehn, H.J.; Gearheart, L.; Raker, K.; Scrivens, W.A. Electrophoretic analysis and purification of fluorescent single-walled carbon nanotube fragments. J. Am. Chem. Soc. 2004, 126, 12736–12737. [Google Scholar] [CrossRef] [PubMed]
  2. Fattahi, Z.; Hasanzadeh, M. Nanotechnology-assisted microfluidic systems for chemical sensing, biosensing, and bioanalysis. Trac-Trends Anal. Chem. 2022, 152, 116637. [Google Scholar] [CrossRef]
  3. Döring, A.; Ushakova, E.; Rogach, A.L. Chiral carbon dots: Synthesis, optical properties, and emerging applications. Light-Sci. Appl. 2022, 11, 75. [Google Scholar] [CrossRef] [PubMed]
  4. Du, J.J.; Xu, N.; Fan, J.L.; Sun, W.; Peng, X.J. Carbon dots for in vivo bioimaging and theranostics. Small 2019, 15, 1805087. [Google Scholar] [CrossRef]
  5. Marković, Z.M.; Milivojević, D.D.; Kovač, J.; Todorović Marković, B.M. Phloroglucinol-based carbon quantum dots/polyurethane composite films: How structure of carbon quantum dots affects antibacterial and antibiofouling efficiency of composite films. Polymers 2024, 16, 1646. [Google Scholar] [CrossRef]
  6. Chen, B.-B.; Liu, M.-L.; Gao, Y.-T.; Chang, S.; Qian, R.-C.; Li, D.-W. Design and applications of carbon dots-based ratiometric fluorescent probes: A review. Nano Res. 2023, 16, 1064–1083. [Google Scholar] [CrossRef]
  7. Xian, Y.M.; Li, K. Hydrothermal synthesis of high-yield red fluorescent carbon dots with ultra-narrow emission by controlled O/N elements. Adv. Mater. 2022, 34, 2201031. [Google Scholar] [CrossRef]
  8. Tang, L.; Ai, L.; Song, Z.Q.; Sui, L.Z.; Yu, J.K.; Yang, X.; Song, H.Q.; Zhang, B.W.; Hu, Y.S.; Zhang, Y.Q.; et al. Acid-triggered aggregation of carbon dots shifted their emission to give unexpected deep-red lasing. Adv. Funct. Mater. 2023, 33, 2303363. [Google Scholar] [CrossRef]
  9. Liu, S.; He, Y.; Liu, Y.; Wang, S.; Jian, Y.; Li, B.; Xu, C. One-step hydrothermal synthesis of chiral carbon dots with high asymmetric catalytic activity for an enantioselective direct aldol reaction. Chem. Commun. 2021, 57, 3680–3683. [Google Scholar] [CrossRef]
  10. Ramírez-Barroso, S.; Jacobo-Martín, A.; Navarro-Baena, I.; Hernández, J.J.; Navio, C.; Rodríguez, I.; Wannemacher, R. On the nature of solvothermally synthesized carbon nanodots. J. Mater. Chem. C 2021, 9, 16935–16944. [Google Scholar] [CrossRef]
  11. Zhang, D.; Chao, D.; Yu, C.; Zhu, Q.; Zhou, S.; Tian, L.; Zhou, L. One-step green solvothermal synthesis of full-color carbon quantum dots based on a doping strategy. J. Phys. Chem. Lett. 2021, 12, 8939–8946. [Google Scholar] [CrossRef] [PubMed]
  12. Jiang, L.; Cai, H.; Zhou, W.W.; Li, Z.J.; Zhang, L.; Bi, H. RNA-targeting carbon dots for live-cell imaging of granule dynamics. Adv. Mater. 2023, 35, 2210776. [Google Scholar] [CrossRef] [PubMed]
  13. Dong, S.; Song, Y.L.; Fang, Y.Z.; Zhu, K.; Ye, K.; Gao, Y.Y.; Yan, J.; Wang, G.L.; Cao, D.A.X. Microwave-assisted synthesis of carbon dots modified graphene for full carbon-based potassium ion capacitors. Carbon 2021, 178, 1–9. [Google Scholar] [CrossRef]
  14. Ahmad, K.; Pal, A.; Pan, U.N.; Chattopadhyay, A.; Paul, A. Synthesis of single-particle level white-light-emitting carbon dots via a one-step microwave method. J. Mater. Chem. C 2018, 6, 6691–6697. [Google Scholar] [CrossRef]
  15. Hou, J.; Zhou, T.Y.; Wang, L.; Zhang, P.; Ding, L. Template-free microwave-assisted fabrication of carbon dots/Zn(OH)2 composites for separation and enhancing chemical sensing. Sens. Actuators B-Chem. 2016, 230, 615–622. [Google Scholar] [CrossRef]
  16. Che, Y.; Pang, H.; Li, H.; Yang, L.; Fu, X.; Liu, S.; Ding, L.; Hou, J. Microwave-assisted fabrication of copper-functionalized carbon quantum dots for sensitive detection of histidine. Talanta 2019, 196, 442–448. [Google Scholar] [CrossRef]
  17. Cui, Y.H.; Xue, S.H.; Wang, S.Y.; Chen, X.; Liu, S.J.; Ye, Q.; Zhou, F.; Liu, W.M. Fabrication of carbon dots intercalated MXene hybrids via laser treatment as oil-based additives for synergistic lubrication. Carbon 2023, 205, 373–382. [Google Scholar] [CrossRef]
  18. Zhu, Z.F.; Wang, S.D.; Chang, Y.J.; Yu, D.B.; Jiang, Y. Direct photodissociation of toluene molecules to photoluminescent carbon dots under pulsed laser irradiation. Carbon 2016, 105, 416–423. [Google Scholar] [CrossRef]
  19. Liu, M.L.; Xu, Y.H.; Niu, F.S.; Gooding, J.J.; Liu, J.Q. Carbon quantum dots directly generated from electrochemical oxidation of graphite electrodes in alkaline alcohols and the applications for specific ferric ion detection and cell imaging. Analyst 2016, 141, 2657–2664. [Google Scholar] [CrossRef]
  20. Qiao, Z.A.; Wang, Y.F.; Gao, Y.; Li, H.W.; Dai, T.Y.; Liu, Y.L.; Huo, Q.S. Commercially activated carbon as the source for producing multicolor photoluminescent carbon dots by chemical oxidation. Chem. Commun. 2010, 46, 8812–8814. [Google Scholar] [CrossRef]
  21. Dordevic, L.; Arcudi, F.; Cacioppo, M.; Prato, M. A multifunctional chemical toolbox to engineer carbon dots for biomedical and energy applications. Nat. Nanotechnol. 2022, 17, 112–130. [Google Scholar] [CrossRef] [PubMed]
  22. Li, Y.S.; Zhong, X.X.; Rider, A.E.; Furman, S.A.; Ostrikov, K. Fast, energy-efficient synthesis of luminescent carbon quantum dots. Green Chem. 2014, 16, 2566–2570. [Google Scholar] [CrossRef]
  23. Chen, B.B.; Chang, S.; Jiang, L.; Lv, J.; Gao, Y.T.; Wang, Y.; Qian, R.C.; Li, D.W.; Hafez, M.E. Reversible polymerization of carbon dots based on dynamic covalent imine bond. J. Colloid Interface Sci. 2022, 621, 464–469. [Google Scholar] [CrossRef] [PubMed]
  24. Chang, S.; Chen, B.B.; Gao, Y.T.; Zheng, Y.H.; Shi, J.F.; Qian, R.C.; Li, D.W. Carbon dots with hydrogen bond-controlled aggregation behavior. Analyst 2023, 148, 507–511. [Google Scholar] [CrossRef]
  25. Li, T.Z.; Shuang, E.; Wang, J.H.; Chen, X.W. Regulating the properties of carbon dots via a solvent-involved molecule fusion strategy for improved sensing selectivity. Anal. Chim. Acta 2019, 1088, 107–115. [Google Scholar] [CrossRef]
  26. Huang, X.S.; Liu, Z.K.; Huang, Y.Q.; Zong, Y.; Yang, X.Y.; Hu, Z.Q.; Zeng, C. One-pot room temperature synthesis of orange-emitting carbon dots for highly-sensitive vitamin B12 sensing. Spectrochim. Acta A 2022, 276, 121239. [Google Scholar] [CrossRef] [PubMed]
  27. Stevens, J.S.; de Luca, A.C.; Pelendritis, M.; Terenghi, G.; Downes, S.; Schroeder, S.L.M. Quantitative analysis of complex amino acids and RGD peptides by X-ray photoelectron spectroscopy (XPS). Surf. Interface Anal. 2013, 45, 1238–1246. [Google Scholar] [CrossRef]
  28. Kloprogge, J.T.; Duong, L.V.; Wood, B.J.; Frost, R.L. XPS study of the major minerals in bauxite: Gibbsite, bayerite and (pseudo-)boehmite. J. Colloid Interface Sci. 2006, 296, 572–576. [Google Scholar] [CrossRef]
  29. Bai, L.H.; Yan, H.X.; Feng, Y.B.; Feng, W.X.; Yuan, L.Y. Multi-excitation and single color emission carbon dots doped with silicon and nitrogen: Synthesis, emission mechanism, Fe3+ probe and cell imaging. Chem. Eng. J. 2019, 373, 963–972. [Google Scholar] [CrossRef]
  30. Wang, C.; Hu, T.T.; Wen, Z.q.; Zhou, J.D.; Wang, X.J.; Wu, Q.; Wang, C.X. Concentration-dependent color tunability of nitrogen-doped carbon dots and their application for iron(III) detection and multicolor bioimaging. J. Colloid Interface Sci. 2018, 521, 33–41. [Google Scholar] [CrossRef]
  31. Chang, S.; Chen, B.B.; Lv, J.; Fodjo, E.K.; Qian, R.C.; Li, D.W. Label-free chlorine and nitrogen-doped fluorescent carbon dots for target imaging of lysosomes in living cells. Microchim. Acta 2020, 187, 435. [Google Scholar] [CrossRef] [PubMed]
  32. Zhang, J.; Dong, L.; Yu, S.H. A selective sensor for cyanide ion (CN) based on the inner filter effect of metal nanoparticles with photoluminescent carbon dots as the fluorophore. Sci. Bull. 2015, 60, 785–791. [Google Scholar] [CrossRef]
  33. Chen, S.; Yu, Y.L.; Wang, J.H. Inner filter effect-based fluorescent sensing systems: A review. Anal. Chim. Acta 2018, 999, 13–26. [Google Scholar] [CrossRef] [PubMed]
Scheme 1. Illustration of the preparation of CDs using TEPA and DB and the ratiometric sensing of DOX.
Inorganics 12 00310 sch001
Figure 1. Structural analysis of CDs. (a) TEM image (inset: size statistical analysis), (b) FT-IR, (c) XPS, (d) C1s, (e) N1s, and (f) O1s spectra of the obtained CDs.
Inorganics 12 00310 g001
Figure 2. Photophysical performances of the obtained CDs. (a) PL and absorption spectra of CDs (2.5 µg/mL). (b) Concentration-dependent emissions of CDs.
Inorganics 12 00310 g002
Figure 3. Detection of DOX using CDs. (a) Emission spectra of the CDs (2.5 μg/mL) after introducing different concentrations of DOX (from up to down: 0, 0.1, 0.5, 1, 2, 4, 8, 10, 20, 30, 40, 50, 60, 70, 80, 90, 100, and 110 μM; excitation: 410 nm). (b) The linear relationship between the PL intensity ratio (I590/I492) and DOX concentration (0.1–40 and 40–110 μM). (c) The selectivity of CDs towards different interferents: TC, PG, AMP, GSH, cysteine (Cys), homocysteine (Hcy), lysine (Lys), glucose (Glu), Zn2+, Na+, Mg2+, K+, Fe3+, Fe2+, Ca2+, Ba2+, Ag+, Al3+, PO43−, SO42−, NO3, CO32−, H2PO4, and H2O2 (concentration: 100 μM). (d) Normalized absorption spectra of TC, PG, AMP, DOX, and CDs; excitation and emission spectra of CDs. (e) Lifetime of CDs after adding DOX (10, 20, 50, 100 μM). (f) UV–vis spectra of CDs, DOX, and the mixture of DOX and CDs.
Inorganics 12 00310 g003
Disclaimer/Publisher’s Note: The statements, opinions and data contained in all publications are solely those of the individual author(s) and contributor(s) and not of MDPI and/or the editor(s). MDPI and/or the editor(s) disclaim responsibility for any injury to people or property resulting from any ideas, methods, instructions or products referred to in the content.

