Article

Predicting Host-Interaction Traits in Probiotic Bacteria Using Machine Learning and Functional Data


by
Gabriela de Quadros da Luz
1,
Kristofer Stift Kappel
2,
Rafaella Sinnott Dias
1,
Fábio Pereira Leivas Leite
1 and
Frederico Schmitt Kremer
1,*
1
Center for Technological Development, Federal University of Pelotas, Pelotas 96160-000, RS, Brazil
2
Center for Computational Sciences (C3), Federal University of Rio Grande—FURG, Rio Grande 96203-900, RS, Brazil
*
Author to whom correspondence should be addressed.
J. Genome Biotechnol. Genet. 2026, 1(2), 12; https://doi.org/10.3390/jgbg1020012
Submission received: 23 May 2026 / Revised: 29 June 2026 / Accepted: 17 July 2026 / Published: 21 July 2026

Abstract

Identifying probiotic microorganisms requires linking genomic content to experimentally reported host-interaction traits. A machine-learning framework predicted seven probiotic phenotypes (acid resistance, bile resistance, adhesion, antimicrobial activity, immunomodulation, antioxidant activity, and antiproliferative potential) from functional COG categories and biosynthetic gene cluster annotations in 1183 genomes (780 probiotic and 403 non-probiotic). CatBoost, Random Forest, XGBoost, LightGBM, and Logistic Regression were evaluated with stratified cross-validation, leave-one-out cross-validation, and an 80:20 holdout split. Antioxidant and antiproliferative models performed best, with cross-validation F1-scores of 0.92 and 0.97 and holdout F1-scores of 0.70 and 0.72. SHAP analysis identified model-derived genomic associations rather than causal mechanisms, including an inverse association between T3PKS abundance and antioxidant classification and associations between lipid transport/metabolism features and antiproliferative classification. The framework supports high-throughput in silico prioritization of candidate probiotic strains for phenotype-specific validation. Interpretation remains limited by heterogeneous source annotations, label noise, and potential false negatives in the non-probiotic dataset.

1. Introduction

Probiotics are defined as “Live microorganisms that, when administered in adequate amounts, confer health benefits to the host” [1]. These microorganisms can be present in gastrointestinal and vaginal microbiota, as well as in foods and dietary supplements [2]. They can play a role in the production of vitamins, amino acids, and short-chain fatty acids, and in ion absorption, prophylaxis against various associated pathologies, the development of both local and systemic immunity, and in reducing inflammation by acting on various signaling pathways [3].
However, for a microorganism to exert its beneficial effects as a probiotic, it needs to be resistant to bile acid and gastric acid, and to adhere to, remain in place, and colonize the mucosa. Moreover, by remaining in the mucosa, it can exert its immunomodulatory effect, which is a major ally of the intestinal microbiota, as stimulating immune cells promotes modulation of the intestinal barrier, thereby maintaining its homeostasis [4]. The interaction between probiotics and the host is fundamental for maintaining the integrity of the intestinal barrier. This homeostatic process involves strengthening intercellular junctions and stimulating mucosal immune cells, thereby reducing intestinal permeability and preventing inflammatory processes [5]. The failure of these mechanisms is associated with pathologies such as cancer, allergies, intolerances, inflammatory diseases, diarrhea, and irritable bowel syndrome [6].
Interest in understanding the functions of probiotic microbial genes and their potential associations with human health has increased. Comparative genomic analysis is frequently used for this purpose [7]. However, genomic analysis based solely on sequence alignments and homology does not capture higher-order interactions among genomic components [8]. The transition to advanced computational models reflects the need to model multidimensional relationships among functional categories and biosynthetic gene clusters (BGCs), thereby improving the prediction of probiotic phenotypes prior to experimental validation. In this context, machine learning offers a scalable framework for large-scale genomic data analysis [9]. Machine learning algorithms can identify patterns in high-dimensional datasets and classify strains based on functional and metabolic profiles [10,11].
Understanding probiotic mechanisms remains important. In this context, machine-learning tools support in silico analyses by generating predictions from large experimental datasets [11,12]. However, a gap remains in integrating functional genomic data to predict multiple biological properties simultaneously. The present study addresses this gap by developing computational models that classify microorganisms and estimate which genomic features contribute most strongly to model outputs for probiotic activities.
Genome-based identification of probiotic strains remains limited by the scarcity of large, experimentally validated phenotype datasets. Reliable links between genomic features and complex probiotic properties are also difficult to establish because most existing frameworks reduce prediction to a binary probiotic/non-probiotic label. That approach lacks the resolution needed for trait-specific prediction. This study addresses those limits by integrating functional genomics with secondary-metabolite biosynthetic gene cluster (BGC) data. Its main contribution is the simultaneous prediction of seven host-interaction phenotypes, coupled with SHAP-based interpretation of model output. The target phenotypes (acid resistance, bile resistance, adhesion capacity, antimicrobial activity, immunomodulatory activity, antioxidant activity, and antiproliferative activity) were selected because they are central to host–microbiome interactions. Acid and bile resistance relate to gastrointestinal survival and adhesion capacity to mucosal colonization, and the remaining traits to pathogen inhibition and cellular homeostasis.

2. Materials and Methods

2.1. Data Acquisition

Probiotic and non-probiotic genomes were retrieved from the National Center for Biotechnology Information (NCBI) Datasets platform (https://www.ncbi.nlm.nih.gov/datasets/ (accessed on 30 January 2025)) in GenBank (.gbk) and FASTA formats. Assemblies were linked to strains using NCBI Assembly accession numbers via the Entrez API available in BioPython (https://biopython.org/) (version 1.87). The final dataset comprised 1183 genomes: 780 probiotics and 403 non-probiotics.
Positive instances came from Probio-Ichnos v1.0 (October 2025), which catalogs microorganisms with experimentally reported in vitro probiotic properties [13]. Each phenotype was modeled independently rather than requiring strains to express all seven traits. Therefore, seven binary classification datasets were built for acid resistance, bile resistance, adhesion, antimicrobial activity, immunomodulation, antioxidant activity, and antiproliferative potential. Additionally, because Probio-Ichnos aggregates labels from heterogeneous studies, no single assay protocol, cutoff, or endpoint was consistently available across strains. The curated phenotype assignments were therefore used without reanalyzing the original experiments.
Negative instances came from the iProbiotics (version 20240904) negative example dataset (July 2026), which includes strains without documented probiotic annotations or associated experimental evidence [11]. Strains present in the positive dataset were removed. This reduced direct overlap but did not remove label uncertainty. Lack of documented probiotic activity does not prove the absence of individual probiotic-associated traits, so the negative dataset likely contains false negatives. Therefore, this label noise can lower model performance and destabilize feature attribution; it cannot confirm a negative biological status.
Based on the initial genome datasets, assembly quality was assessed with BUSCO [14] and CheckM2 [15], and assemblies with <90% completeness or >5% contamination were excluded. These thresholds were necessary because incomplete assemblies truncate coding sequences and reduce functional annotation coverage, potentially affecting downstream analysis.

2.2. Functional and Metabolic Annotation

Protein-coding sequences were annotated with COGClassifier (version 1.0.5) (https://github.com/moshi4/COGclassifier (accessed on 12 February 2025)) using the Clusters of Orthologous Genes (COG) database to assign functional categories [16]. Biosynthetic gene clusters were identified using AntiSMASH (version 7.0.0) [17]. COGClassifier results were encoded as the relative abundance of each COG category, while AntiSMASH outputs were encoded as genome-level binary presence/absence variables and combined into the training feature matrix. Preprocessing and modeling were implemented in Python using scikit-learn (version 1.6.1), Pandas (version 2.2.2), NumPy (version 2.0.2), CatBoost (version 1.2.3), XGBoost (version 3.2.0), and LightGBM (version 4.6.0), along with other standard machine-learning classification models available in scikit-learn. Explicit feature selection and dimensionality reduction were intentionally omitted to retain the complete biologically annotated feature space for model training and interpretation. This choice preserved functional context for downstream SHAP analysis and avoided adding an algorithm-specific optimization step, allowing all models to be compared using the same input space. Most evaluated algorithms, particularly tree-based methods such as Random Forest, XGBoost, LightGBM, and CatBoost, perform implicit feature selection during training by preferentially selecting informative variables for splitting while reducing the influence of weak or uninformative features through their internal learning procedures.

2.3. Model Selection and Validation Strategies

Table 1 summarizes class composition for the seven phenotype-specific datasets. Performance was evaluated using three complementary validation schemes to provide a broader assessment than any single metric or partition alone. First, 5-fold stratified cross-validation estimated average predictive performance while preserving class proportions across folds. Second, leave-one-out cross-validation (LOOCV) maximized training size in each iteration and evaluated sensitivity to individual observations. Third, an 80:20 holdout split was used to estimate generalization to previously unseen genomes. These schemes capture different aspects of robustness: stratified cross-validation emphasizes average performance across partitions, LOOCV emphasizes sensitivity to minimal data removal, and holdout testing emphasizes one independent train-test partition.
Model explainability analysis was performed using SHAP (Shapley Additive exPlanations) [18] with the final model obtained from the train-test split. This framework was selected because it produces a single fitted model and an independent test set, thereby avoiding fold-specific variation in feature attribution. SHAP values quantify the contribution of genomic features to model output, and were used to explain model decisions and generate biologically plausible hypotheses for downstream validation, rather than to define a minimal biomarker set.

3. Results

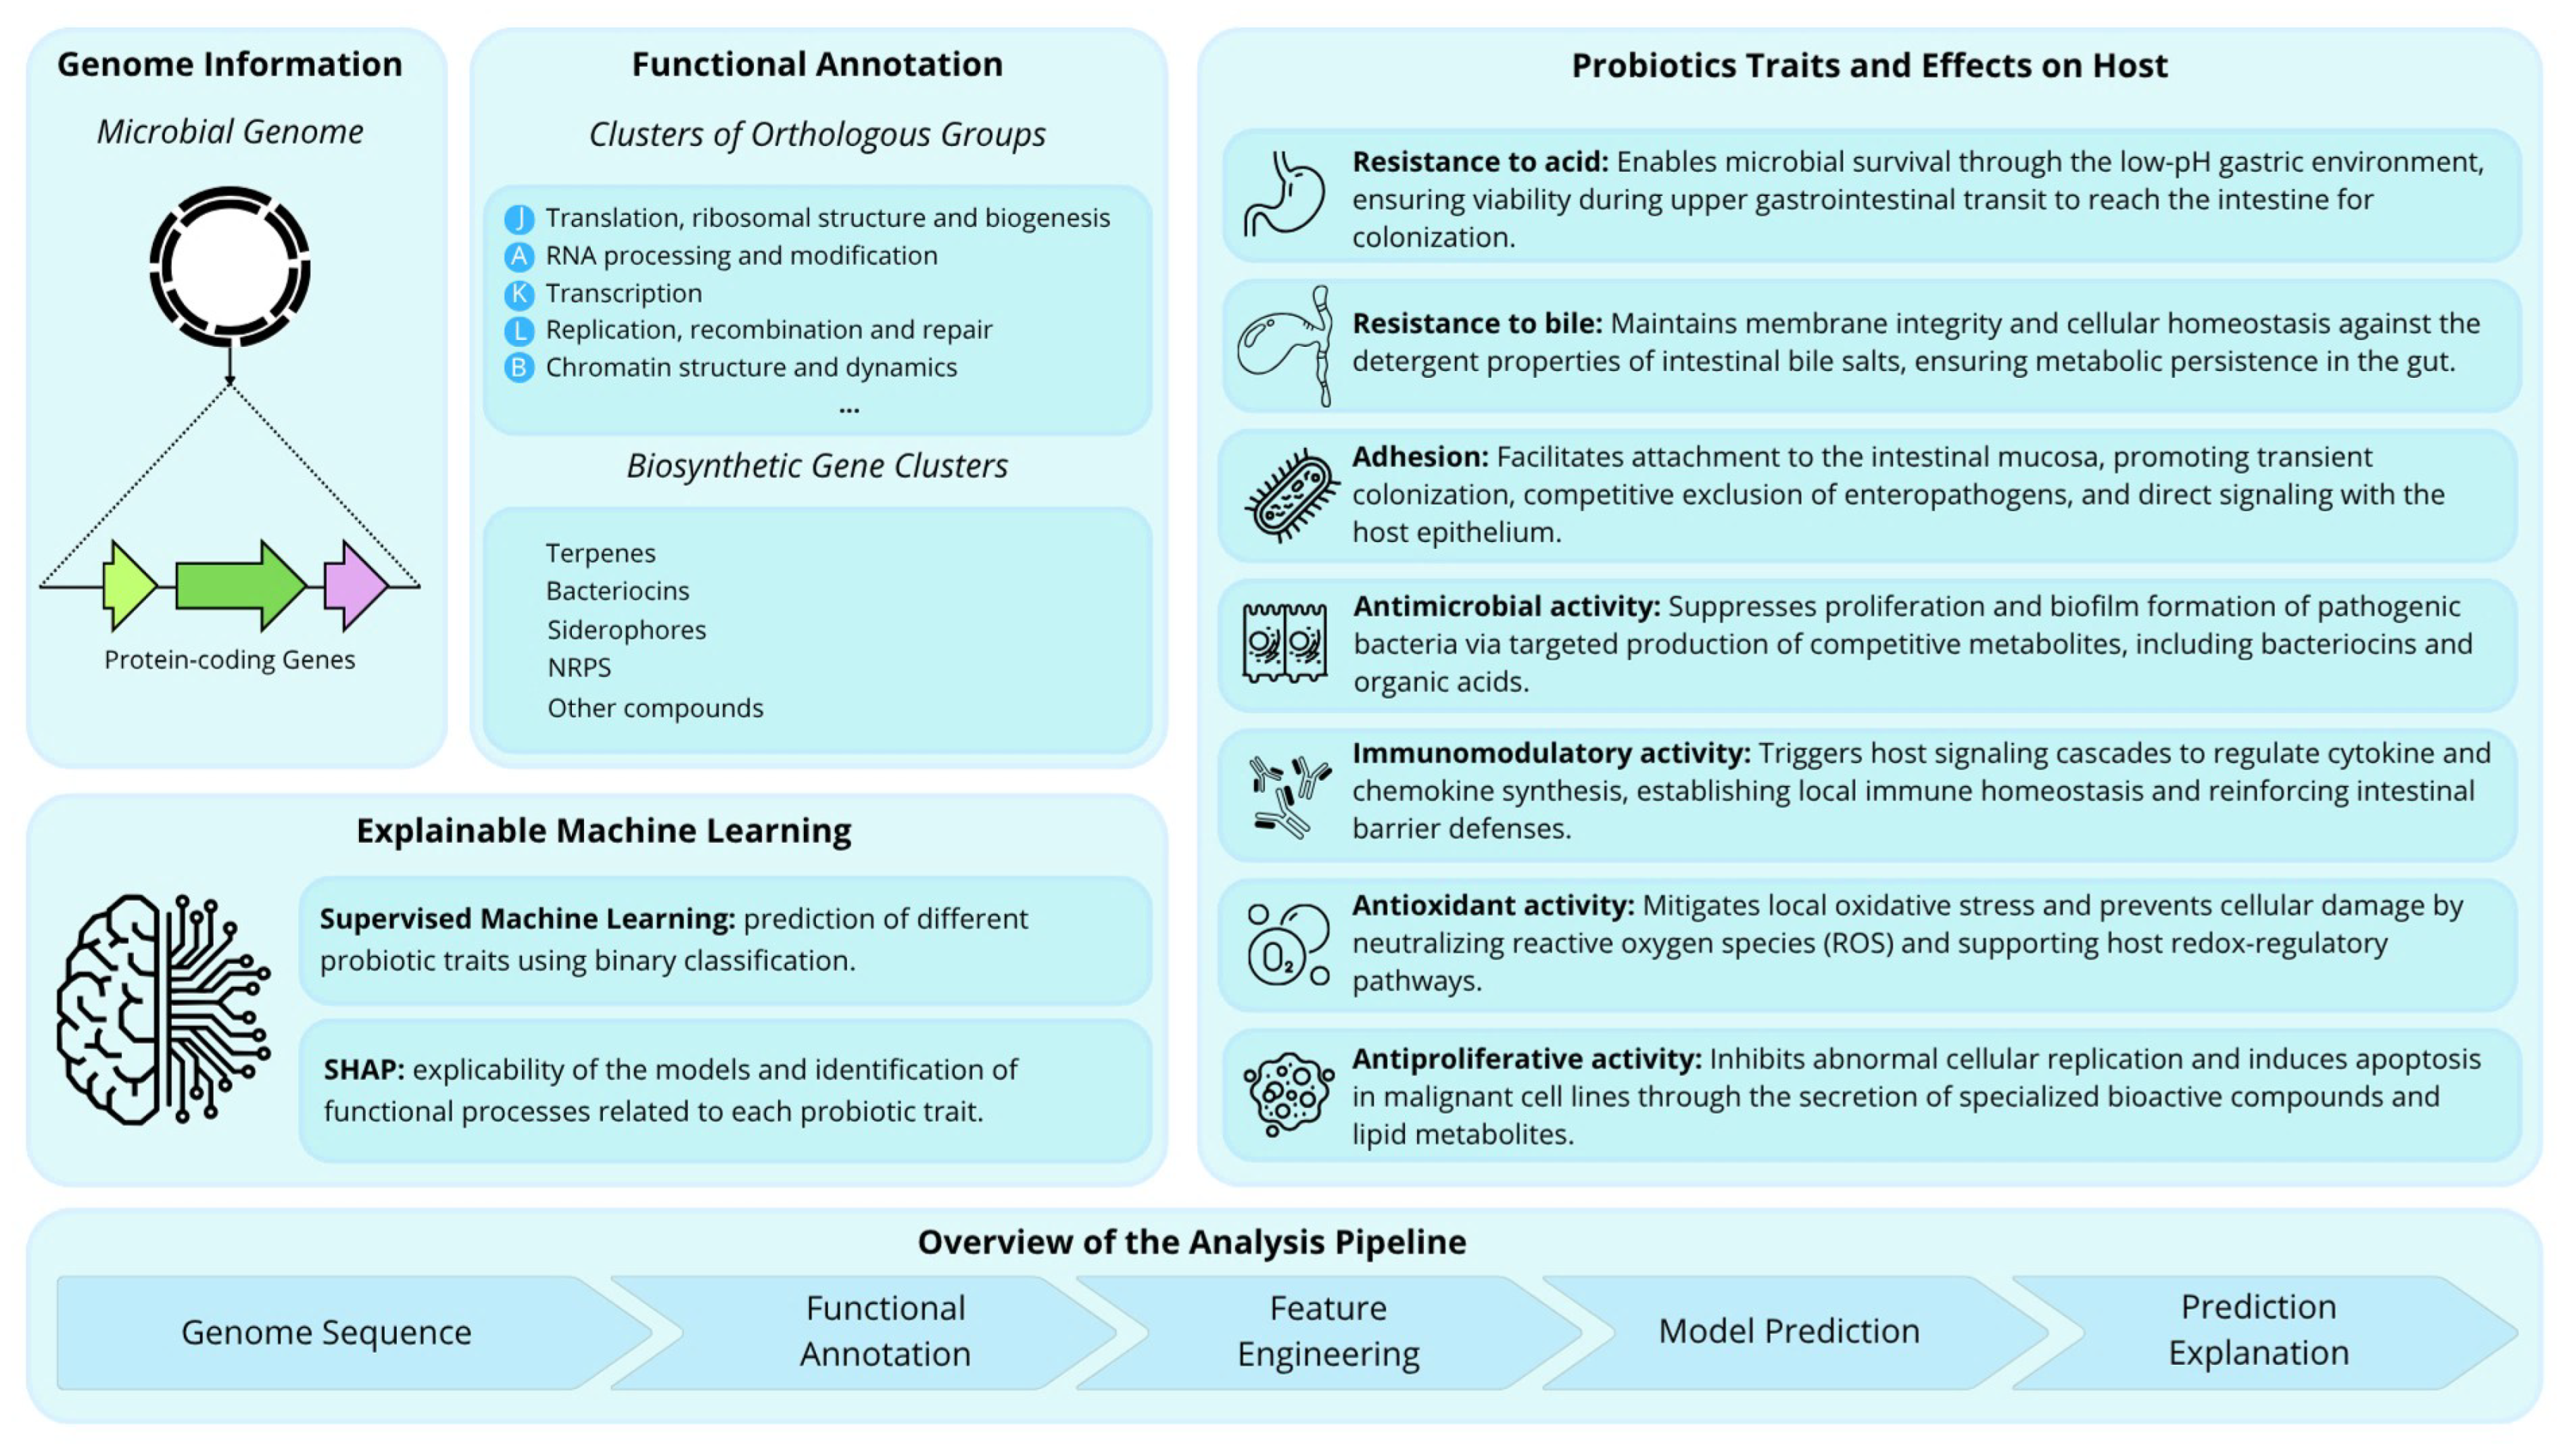
The genomes selected for model training after quality control are presented in Supplementary Data S1. The analytical pipeline executed for this study processes microbial genomic data through four sequential stages to predict and explain probiotic host-interaction traits (Figure 1). Initially, complete microbial genomes undergo functional annotation to identify clusters of orthologous groups (COGs) and biosynthetic gene clusters (BGCs). These functional annotations are engineered into numerical features in a tabular format. Supervised machine learning algorithms are subsequently trained on these matrices to perform binary classification across seven target probiotic phenotypes. The final stage applies SHAP (Shapley Additive exPlanations) to deconstruct the predictive models, isolating the functional genomic drivers determining each trait. The following subsections detail the predictive performance across the three validation schemes and interpret the resulting phenotype-specific explainability signals.
This section summarizes model performance across the three evaluation schemes and then interprets the strongest phenotype-specific SHAP signals. Table 2, Table 3 and Table 4 report the best-performing model and balancing strategy for each phenotype under 5-fold cross-validation, LOOCV, and holdout evaluation. Performance varied across phenotypes and validation schemes, showing that class imbalance, sample size, and label heterogeneity affected predictive stability.
Under 5-fold cross-validation, antioxidant and antiproliferative prediction achieved the highest performance. The antioxidant model (XGBoost with SMOTE + Tomek Links) reached an accuracy of 0.92 ± 0.02 and an F1-score of 0.92 ± 0.02. The antiproliferative model (Random Forest with SMOTE + Oversampling) reached an accuracy of 0.97 ± 0.01 and an F1-score of 0.97 ± 0.01. Acid resistance, bile resistance, adhesion, and antimicrobial activity exhibited intermediate performance, with accuracy values ranging from 0.74 to 0.77. Immunomodulation reached an accuracy of 0.82 ± 0.01 and an F1-score of 0.82 ± 0.01. These results show that phenotype-specific predictive difficulty differed substantially across tasks.
LOOCV produced lower F1-scores than 5-fold cross-validation for all phenotypes. Antioxidant and antiproliferative remained the strongest tasks, with accuracies of 0.94 and 0.97 and F1-scores of 0.47 and 0.49, respectively. Acid resistance, bile resistance, adhesion, and antimicrobial activity yielded F1-scores from 0.38 to 0.41, and immunomodulation reached 0.42. This decline is consistent with LOOCV sensitivity to single-sample perturbation and with dataset features such as limited positive counts, class imbalance, and heterogeneous labels. Lower LOOCV performance is also expected in highly imbalanced datasets because each iteration evaluates a single observation, increasing the variance of performance estimates. The LOOCV results, therefore, indicate reduced stability under minimal training-set changes rather than failure of the underlying models.
In the holdout evaluation, LightGBM achieved the strongest results for the two most imbalanced phenotypes. It reached an accuracy of 0.89 and an F1-score of 0.70 for antioxidant prediction with SMOTE + Tomek Links and an accuracy of 0.96 and an F1-score of 0.72 for antiproliferative prediction without balancing. Acid resistance, bile resistance, adhesion, antimicrobial activity, and immunomodulation produced holdout F1-scores of 0.70, 0.76, 0.69, 0.76, and 0.65, respectively. Unlike cross-validation, several holdout-optimal models used no balancing, indicating that the specific train-test partition altered the effective class structure seen during training and evaluation.
Table 1 contextualizes these differences. Antioxidant and antiproliferative were the most imbalanced tasks, with positive class prevalences of 12.6% and 4.4%, respectively. Their dependence on SMOTE-based balancing in cross-validation is therefore expected. Their strong performance despite severe imbalance indicates that the feature space captures a predictive structure for these phenotypes. However, the class imbalance also increases the risk that performance estimates depend on the resampling strategy and dataset composition.
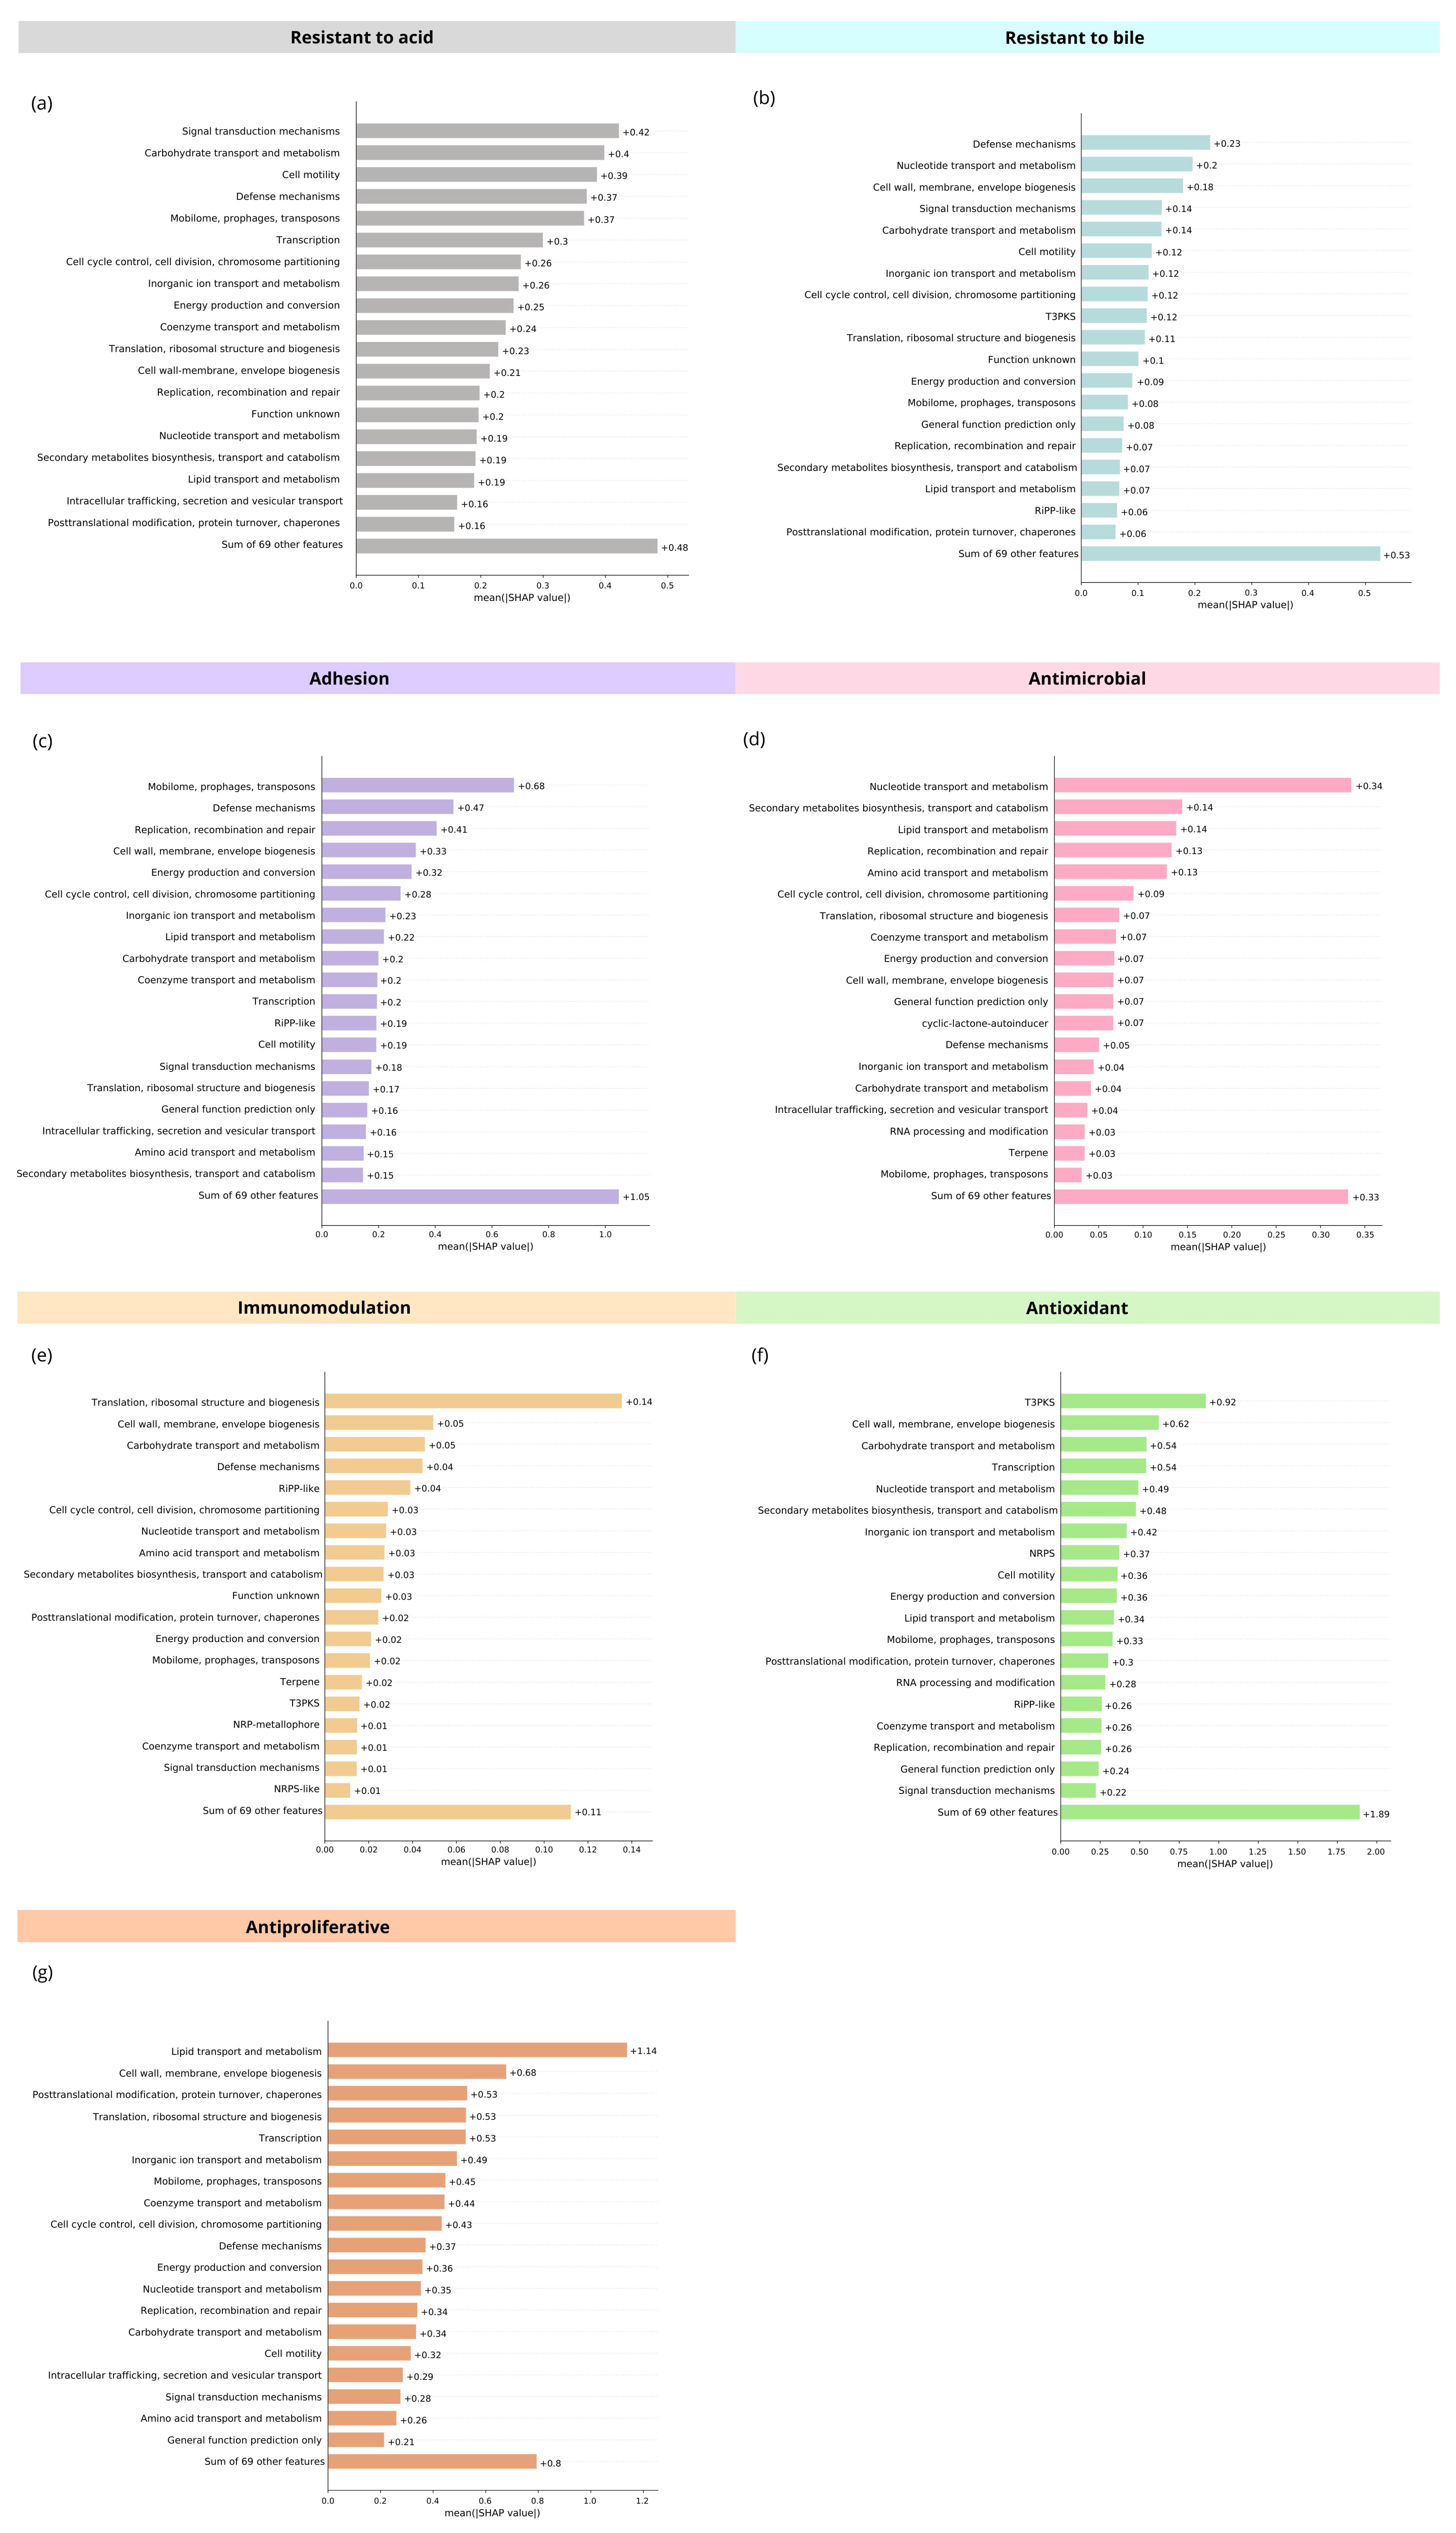
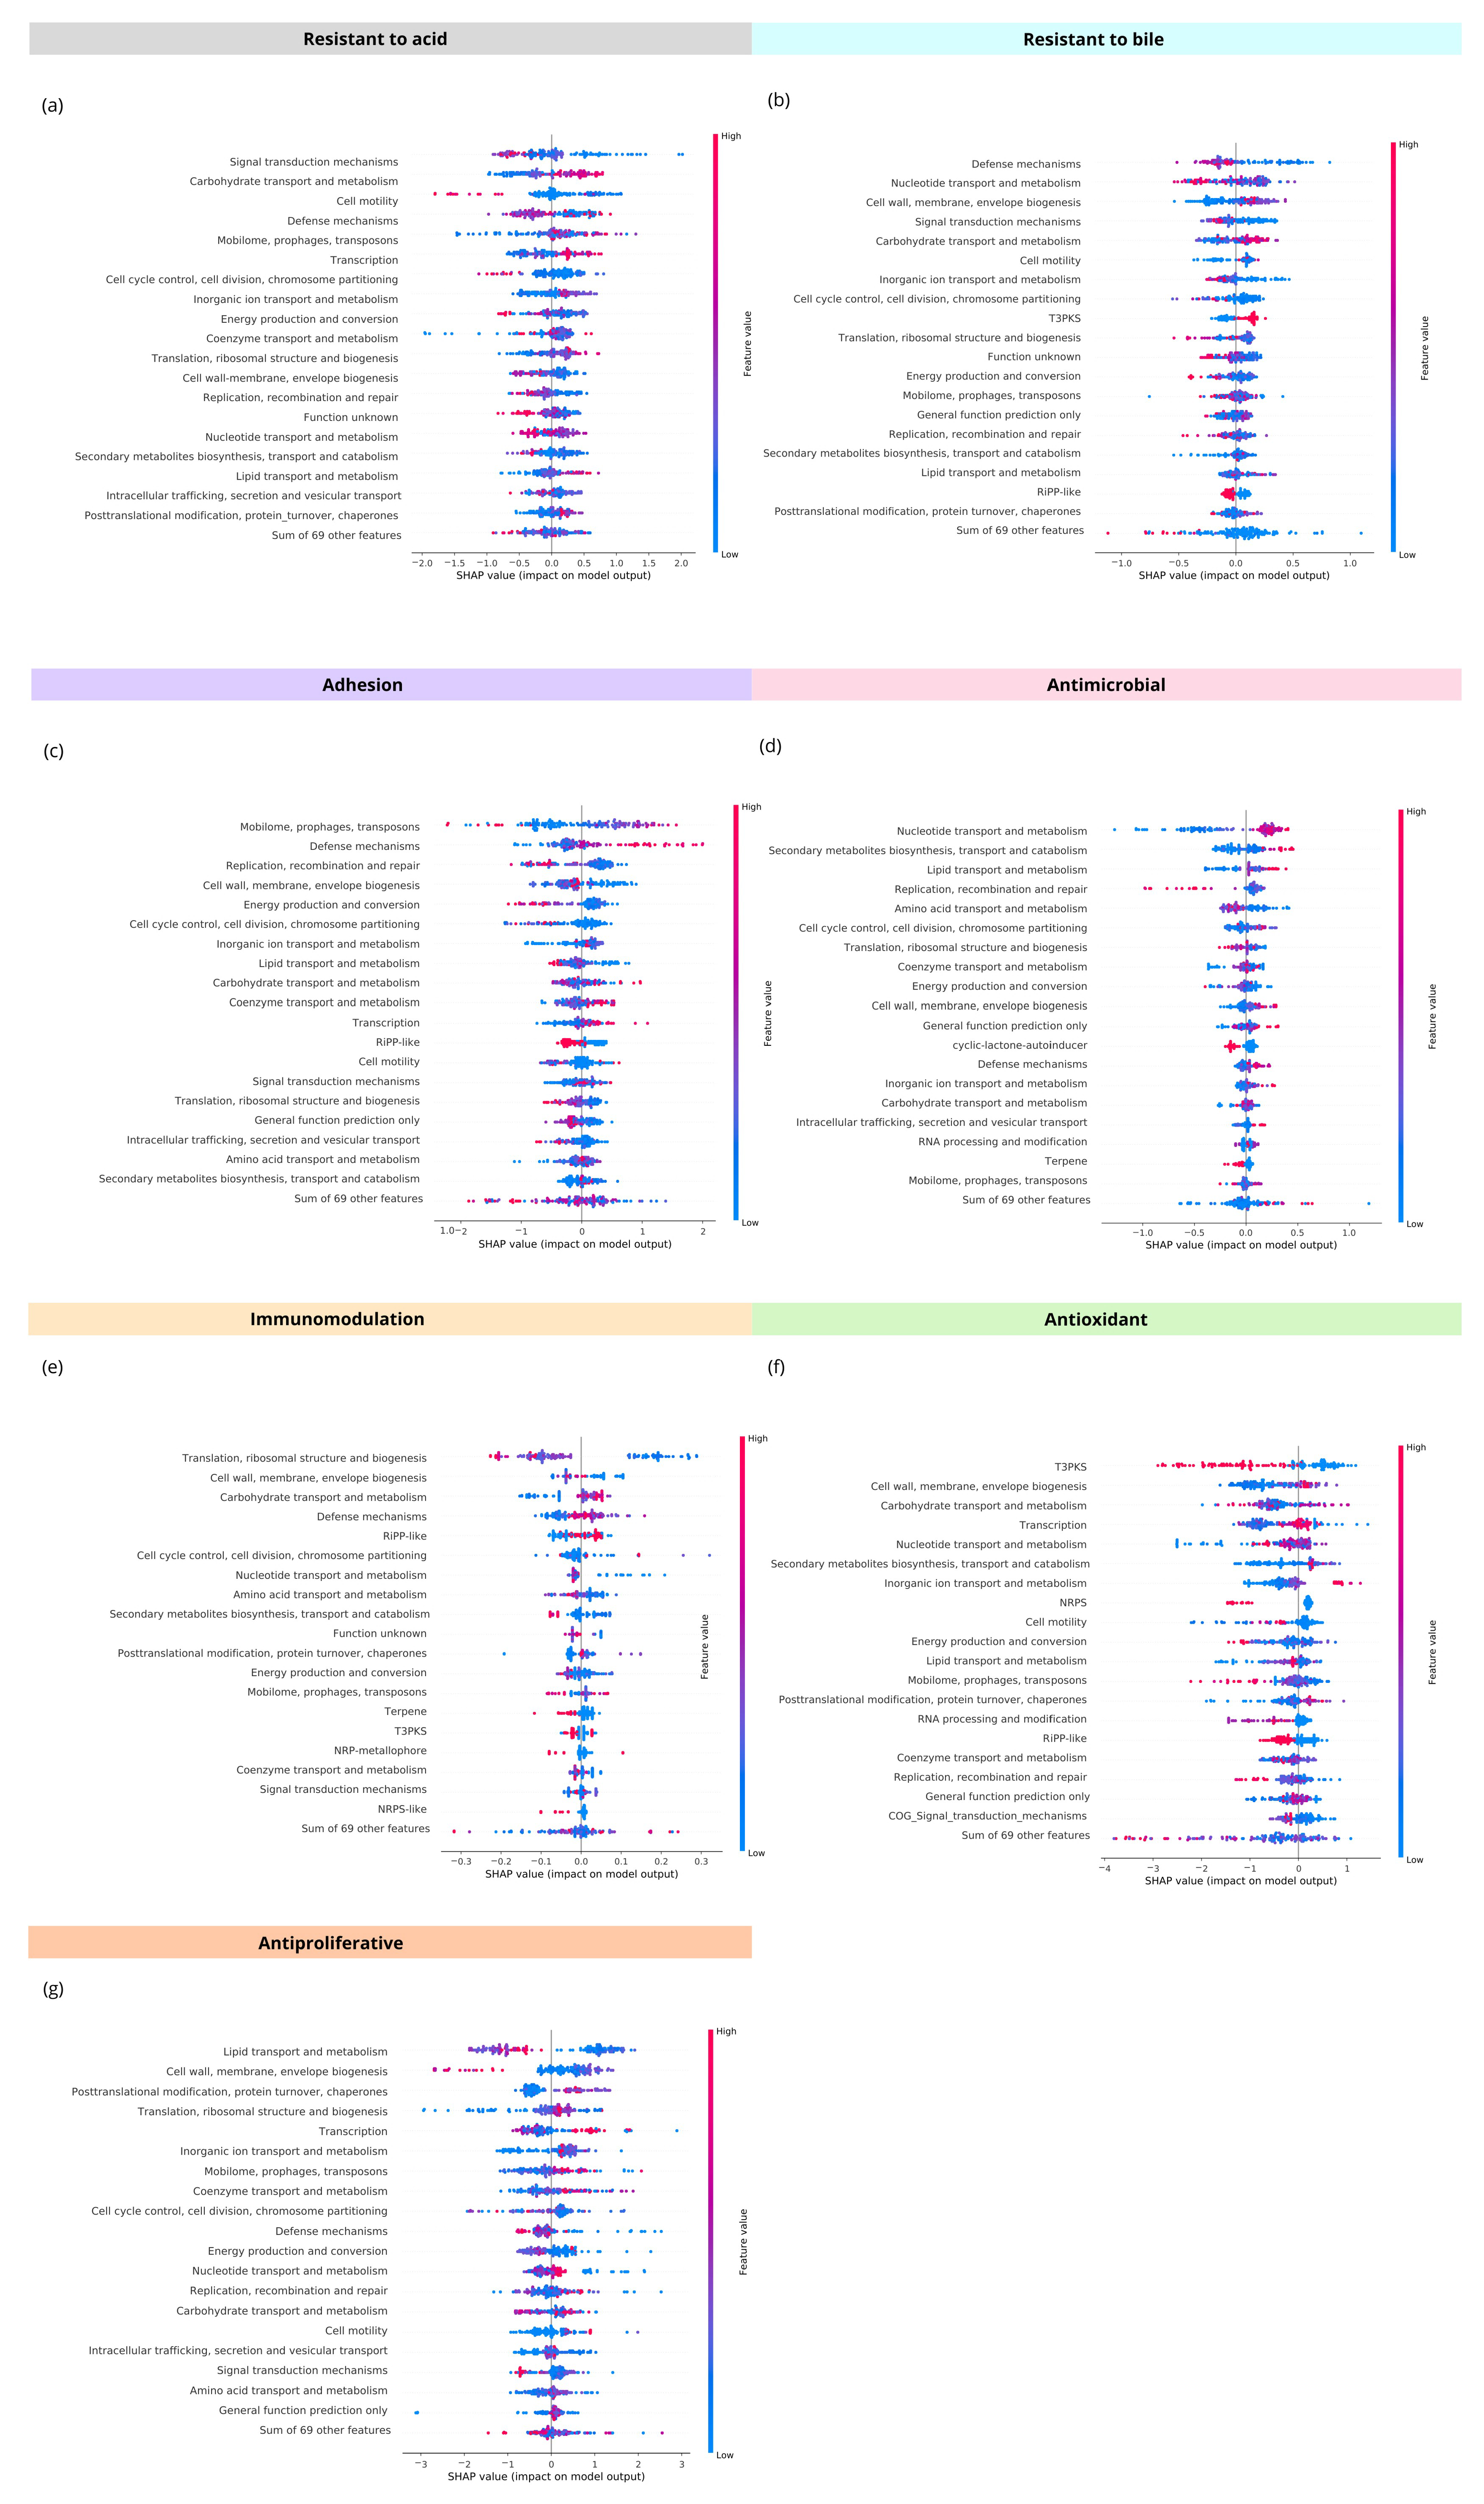
SHAP was used to quantify how COG categories and BGC annotations contributed to model output in the train-test split models. Figure 2 ranks the features by mean absolute SHAP value, and Figure 3 shows the direction and distribution of feature effects across genomes. These results identify model-derived genomic associations that can guide biologically plausible, phenotype-specific hypotheses for experimental follow-up.
For acid resistance, the highest SHAP contributions came from signal transduction mechanisms, carbohydrate transport and metabolism, cell motility, defense mechanisms, and transcription-related functions (Figure 2a and Figure 3a). In the fitted model, signal transduction and carbohydrate metabolism showed positive associations with acid-resistance classification, whereas a higher abundance of motility-related genes showed an inverse association. Defense and transcription-related features also contributed positively. These patterns describe the model’s decision structure; they do not demonstrate direct acid-tolerance mechanisms.
For bile resistance, defense mechanisms, nucleotide transport and metabolism, and cell wall/membrane/envelope biogenesis had the largest SHAP contributions (Figure 2b and Figure 3b). In the model, a low abundance of defense-related genes was associated with a positive bile-resistance classification, whereas cell-envelope biogenesis showed a positive association. Nucleotide transport and metabolism displayed a non-monotonic pattern: lower abundance tended to support positive classification, whereas higher abundance tended to support negative classification.
For adhesion, mobilome-associated genes, defense mechanisms, cell-envelope biogenesis, and replication/recombination/repair were the dominant SHAP features (Figure 2c and Figure 3c). Mobilome-associated features appeared in many genomes, but their local effects varied across samples. Defense-related and structural features showed positive associations with adhesion classification, indicating that the model used a combination of genomic plasticity and surface-associated functions to separate classes.
For antimicrobial activity, the model relied primarily on nucleotide transport and metabolism, secondary metabolite biosynthesis/transport/catabolism, lipid transport and metabolism, and replication/repair functions (Figure 2d and Figure 3d). A higher abundance of nucleotide metabolism features was associated with a positive classification. Secondary-metabolite features also contributed positively, whereas a low abundance of lipid-metabolism and replication/repair features was associated with a lower antimicrobial classification. These associations are model-derived and should not be interpreted as direct antimicrobial mechanisms.
For immunomodulation, the largest SHAP contributions came from translation/ribosomal structure/biogenesis, cellular structure, carbohydrate transport and metabolism, and defense mechanisms (Figure 2e and Figure 3e). A lower abundance of ribosomal features was associated with a positive classification, whereas a higher abundance of carbohydrate-metabolism features supported immunomodulatory classification. Given the lower holdout and LOOCV stability for this task, these associations should be treated as hypothesis-generating rather than definitive.
For antioxidant activity, T3PKS showed the largest mean absolute SHAP value, followed by cell wall/membrane/envelope biogenesis, carbohydrate transport and metabolism, and transcription-related functions (Figure 2f and Figure 3f). SHAP dependence indicated an inverse association between T3PKS abundance and antioxidant classification: lower T3PKS abundance increased the probability of a positive classification, whereas a higher abundance decreased it. The model also associated higher nucleotide-metabolism and transcription-related values with positive classifications. These results identify statistically derived signatures rather than direct antioxidant mechanisms.
For antiproliferative activity, lipid transport and metabolism had the highest SHAP contribution (Figure 2g and Figure 3g). The model associated a lower abundance of lipid metabolism genes with a positive antiproliferative classification. A lower abundance of cell-structure-related features and the presence of mobilome-associated functions also supported positive classification. Because this task contains only 35 positive genomes, these associations should be interpreted cautiously despite the strong reported metrics.

4. Discussion

The results indicate that probiotic host-interaction prediction is organized at the systems level rather than around single dominant markers. Across all tasks, the models relied on combinations of stress-response functions, cell-envelope processes, metabolic pathways, and specialized metabolite annotations. The primary objective of this framework is predictive prioritization of candidate probiotic strains, not mechanistic discovery. SHAP was therefore used to explain the model’s decisions and to generate biologically testable hypotheses for downstream validation. Validation performance depended strongly on dataset structure: LOOCV consistently reduced F1-scores relative to 5-fold cross-validation, with the largest declines in immunomodulation (0.42) and antioxidant activity (0.47). This instability reflects the interplay among class imbalance, limited positive counts, heterogeneous definitions of phenotypes, and sensitivity to single-sample perturbations.
This interpretation aligns with the biological complexity of probiotic classification. Probiotic functionality extends beyond the presence of specific genomic sequences and depends on viable microorganisms that confer health benefits to the host when administered in adequate amounts. Supervised machine learning can help identify genomic signatures associated with probiotic phenotypes, but the multifactorial nature of these traits limits direct mechanistic inference [19,20]. In this context, functional annotations increase biological interpretability by connecting sequence-derived information to broader cellular processes [12]. Because probiotic activity depends on multiple capabilities, including resistance to gastric acid and bile salts, adhesion to the intestinal epithelium, antimicrobial activity, immunomodulation, antioxidant capacity, and antiproliferative effects, integrating genomic and functional information provides a more meaningful basis for phenotype-resolved prediction [21,22,23]. The following sections discuss each predicted trait within this systems-level framework.

4.1. Acid Resistance

Within this framework, acid resistance prediction was driven primarily by signal transduction, carbohydrate metabolism, defense functions, transcription, and cell motility. This pattern is consistent with acid tolerance as a coordinated stress-response state rather than a single-gene trait. The inverse association with motility should be treated as a model-derived genomic contrast, not as evidence of an ecological trade-off or direct acid-survival mechanism.
This interpretation is supported by published work on Gram-positive acid adaptation, which highlights roles for proton homeostasis, membrane remodeling, stress proteins, and regulatory pathways [24,25,26]. Previous SHAP-based studies also show that complex microbial phenotypes are typically explained by combinations of multiple moderately important features rather than by a single dominant predictor [27]. In the present analysis, the model used broad COG categories and BGC annotations rather than direct assays of these mechanisms. The acid-resistance signature, therefore, provides a biologically plausible, hypothesis-generating profile for future validation.

4.2. Bile Resistance

A related stress-response pattern appeared for bile resistance. Bile-resistance classification showed its strongest associations with defense functions, nucleotide transport and metabolism, and cell-envelope biogenesis. This profile fits the general requirement for maintaining membrane integrity and stress tolerance during bile exposure. Previous studies show that bile acids disrupt bacterial membranes and metabolism, requiring coordinated responses involving membrane repair, cellular regulation, and stress adaptation [28,29,30,31,32]. Bile tolerance is also a fundamental requirement for probiotic survival during gastrointestinal transit [26,27,28]. The model, therefore, highlights biologically relevant functional categories for future validation, even though it does not isolate bile salt hydrolase activity or another single mechanism.

4.3. Adhesion

The transition from survival traits to host interaction is reflected in the adhesion model. Adhesion-related classification emphasized mobilome-associated functions, defense mechanisms, replication/recombination/repair, and cell-envelope biogenesis. This combination supports a broad association between host-interaction classification and both genomic plasticity and surface-structure-related functions. Experimental literature associates probiotic adhesion with mucus-binding proteins, S-layer proteins, extracellular polysaccharides, pili, and specialized adhesins [33]. In this context, the enrichment of cell-envelope biogenesis and mobilome-associated functions provides a biologically plausible profile for prioritizing strains and hypotheses, while remaining consistent with the model-derived nature of the analysis.

4.4. Antimicrobial Activity

Beyond survival and adhesion, antimicrobial activity reflected a functional profile enriched in nucleotide metabolism, secondary metabolite biosynthesis/transport/catabolism, lipid metabolism, and replication/repair functions. This pattern is compatible with a metabolically active genomic background with biosynthetic capacity. Published models of probiotic-mediated pathogen inhibition have associated antimicrobial activity with bacteriocins, organic acids, hydrogen peroxide, reuterin-like compounds, and other bioactive metabolites that can alter the microbial community structure and suppress pathogen growth [34,35,36]. In the present model, the prominence of secondary-metabolite biosynthesis pathways and nucleotide-metabolism functions provides a biologically plausible hypothesis for future testing. At the same time, the contribution of replication-related functions may also reflect broader biosynthetic activity or lineage structure.

4.5. Immunomodulation

The SHAP analysis of immunomodulation highlighted the role of factors associated with ribosomal biogenesis, cellular structure, carbohydrate metabolism and transport, and defense mechanisms. This finding is consistent with the scientific literature, as probiotic-induced immunomodulation relies on the synthesis of structural components and the secretion of bioactive compounds [37]. These act as effectors in communication with the host, triggering signaling cascades that culminate in the modulation of cytokine synthesis and release by immune cells, thus establishing the profile of gastrointestinal immunomodulation. These effectors communicate with the host, initiating signaling cascades that modulate cytokine synthesis and release by immune cells. This process consequently determines the profile of gastrointestinal immunomodulation [38]. In addition, cell movement and the presence of specialized organelles are crucial for host–microorganism interactions, and this biological basis is consistent with the trait importance analysis conducted in this study. Specifically, the analysis in the split train-test scenario reveals a marked dominance (average SHAP value +0.14) of the category “Translation, ribosomal structure and biogenesis”. This suggests that this characteristic contributed almost exclusively to the model’s prediction of this class (Figure 2e). However, this concentration of importance demonstrates a specific sensitivity of the model to this scenario and data distribution, which affects its performance. This is evidenced by the fact that, compared with the other evaluations studied, the best model selected to predict this label, using a train-test split, yielded low values across the evaluated metrics (Table 4). However, when analyzing the metric values achieved by the best models, it is evident that applying cross-validation to the model proved more effective, reaching an F1-score of 0.82 (Table 2). Using leave-one-out, the value dropped to 0.42 (Table 3).

4.6. Antioxidant Activity

The antioxidant model showed its strongest SHAP signal for Type III Polyketide Synthases (T3PKS). However, the direction of the association was inverse: lower T3PKS abundance increased the probability of antioxidant classification, whereas higher abundance decreased it (Figure 2f). This pattern should not be interpreted as evidence that T3PKS is a positive biological driver of antioxidant activity. The most parsimonious explanation is that T3PKS captures lineage-specific genomic background or correlated biosynthetic profiles within the training data, consistent with reports that biosynthetic gene clusters are unevenly distributed across bacterial taxa and shaped by genomic context [39]. Alternative explanations, including indirect association with other genomic traits or competition among biosynthetic signatures, remain possible but secondary. Features such as cell wall/membrane/envelope biogenesis, carbohydrate transport and metabolism, nucleotide metabolism, and transcription-related functions also contributed to the model, supporting a systems-level antioxidant signature rather than a single causal marker. These SHAP results identify statistical associations in the fitted model, not direct antioxidant mechanisms. The antioxidant task nevertheless showed comparatively strong predictive performance, with F1-scores of 0.70 in the train-test split and 0.92 under cross-validation, supporting its use for candidate prioritization followed by phenotype-specific validation.

4.7. Antiproliferative Potential

For the antiproliferative label, the feature importance analysis revealed one of the most stable profiles among all the labels evaluated. In the category “Lipid transport and metabolism”, it played an absolute leading role, suggesting a link between lipid composition and/or the ability to secrete derived metabolites and the inhibition of cell proliferation (Figure 2g). This indication aligns with the literature, which demonstrates that the conversion of dietary fatty acids into conjugated linoleic acid (CLA) by probiotic bacteria is a primary mechanism for inducing apoptosis and cell-cycle arrest in cancerous cells. This effect is also achieved through modulation of lipid transport, in which probiotics and their derivatives regulate lipid accumulation in the membranes of tumor cells and pathogenic microorganisms [40]. Furthermore, the antiproliferative response can be achieved using structural or intracellular components, such as cytoplasmic and cell wall extracts (Figure 3g) [41], reinforcing the compatibility of the most important categories presented by the models with the literature. In general, SHAP results showed stable importance distributions across categories. However, despite maintaining logic across the selected categories, there was a discrepancy in the importance value for the lipid transport and metabolism category, indicating potential sensitivity of the model in this scenario (Figure 2g). It is worth noting that among the labels studied in this article, antiproliferative activity was the most imbalanced, with only 4.4% of the data as true (Table 1), and that the best model for the train-test split was selected without balancing (Table 4). In other words, since there was no balance between the classes, the hypothesis is that the model identified this characteristic as a robust predictor capable of recognizing the minority class without the need to expand the data synthetically.

4.8. Comparison with Existing Probiotic Prediction Frameworks

Taken together, the phenotype-specific analyses show why comparison with existing probiotic prediction frameworks must focus on task design rather than on headline accuracy alone. Existing computational systems, such as iProbiotics [11], ProbML [42], and Pato [12], mainly predict overall probiotic status and are presented in Table 5. Differences in published performance metrics should not be interpreted as direct evidence of superiority or inferiority, as the available methods were developed on different datasets, with different phenotype definitions, feature representations, and validation protocols. In addition, the task here is different and more complex: seven independent, phenotype-specific classifications with different prevalences, effective sample sizes, and heterogeneous phenotype labels. The relevant comparison is therefore architectural and analytical rather than based solely on performance metrics.
From this perspective, the present framework adds phenotype-level resolution, interpretable functional features, and evaluation under different validation strategies. The use of functional features and model explainability, already explored in previous work on the Pato model, also distinguishes this method from iProbiotics and ProbML. A fair quantitative benchmark would require retraining all methods on an identical reference dataset using a unified annotation and evaluation pipeline. Such benchmarking is valuable future work, but is beyond the scope of the present study. These additions improve analytical granularity but also expose instability that binary probiotic/non-probiotic frameworks can mask. The value of this approach lies in prioritizing strains for phenotype-specific testing, not in replacing broad binary screening or experimental confirmation. This comparison clarifies the contribution and the boundaries of the proposed framework. Its value lies less in maximizing a single headline metric than in resolving phenotype-specific prediction tasks while exposing where performance remains unstable. In that sense, the systems-level convergence observed across tasks is more informative than any individual feature ranking. At the same time, the framework identifies statistical regularities in annotated genomes rather than causal genotype–phenotype links.

4.9. Limitations

These boundaries lead directly to four main limitations. First, the labels are heterogeneous because the source databases combine results from different studies, assays, thresholds, and endpoints. The models, therefore, learn across inconsistent definitions of phenotype. Second, the negative dataset is structurally uncertain. A strain classified here as non-probiotic lacks documented evidence of probiotic activity but has not been experimentally shown to lack any of the target phenotypes. False negatives are therefore likely. Third, class imbalance is severe for the antioxidant (12.6% positive) and antiproliferative (4.4% positive) predictions, increasing sensitivity to resampling strategies and amplifying the effect of small positive subsets. Fourth, the study lacks an external validation cohort generated independently from the source databases and annotation workflow. Such a cohort could not be assembled because no publicly available dataset currently provides standardized annotations for all seven evaluated probiotic phenotypes. These constraints limit transportability and biological interpretation and restrict SHAP outputs to statistically derived associations within this dataset. Future work will evaluate the stability of SHAP feature importance across repeated cross-validation folds and external datasets.

4.10. Practical Deployment and Future Perspectives

Addressing the raised limitations will define the next steps in this line of research. First, training labels should be rebuilt using standardized curation rules that record assay type, cutoff, and experimental context for each strain. Second, an external benchmark should be assembled from independently curated genomes, and the full annotation and prediction workflow should then be rerun without reusing source labels. Third, alternative negative-set definitions, including uncertainty-aware labeling, should be tested to measure the effect of false negatives on model calibration and SHAP rankings. Fourth, phenotype-specific wet-lab validation should prioritize the strongest and most uncertain signals, including low-T3PKS antioxidant candidates and lipid-metabolism-linked antiproliferative candidates. Fifth, the feature space should be expanded with orthogonal omics layers only after external genomic validation establishes baseline transferability. In practice, this framework should be used as a ranking tool for candidate selection, not as a substitute for phenotype assays.

5. Conclusions

This study presents a phenotype-resolved machine-learning framework that predicts seven probiotic host-interaction traits from COG functional categories and biosynthetic gene cluster annotations. Antioxidant and antiproliferative prediction achieved the strongest cross-validation performance, with F1-scores of 0.92 and 0.97, respectively. Across all tasks, the models relied on combined regulatory, structural, metabolic, and biosynthetic signals rather than on single dominant markers. SHAP analysis identified model-derived associations, including an inverse association between T3PKS abundance and antioxidant classification and an association between lipid transport/metabolism features and antiproliferative classification. These associations provide biologically plausible hypotheses for downstream testing while reflecting model behavior, rather than direct genotype–phenotype mechanisms. The framework, therefore, supports high-throughput in silico prioritization of candidate probiotic strains for phenotype-specific experimental validation rather than replacing laboratory assays. Its current interpretability and transportability remain limited by heterogeneous source labels, likely false negatives in the negative dataset, class imbalance in key phenotypes, and the lack of external validation. Data and code are available at Zenodo (https://zenodo.org/records/20787108, accessed on 22 May 2026).

Supplementary Materials

The following supporting information can be downloaded at: https://www.mdpi.com/article/10.3390/jgbg1020012/s1, Supplementary Data S1: Genomic records selected for functional annotation and model training after quality control using BUSCO and CheckM2.

Author Contributions

Conceptualization, G.d.Q.d.L. and F.S.K.; methodology, F.S.K.; software, G.d.Q.d.L. and K.S.K.; validation, G.d.Q.d.L., K.S.K., and F.S.K.; resources, F.S.K.; writing—original draft preparation, G.d.Q.d.L. and R.S.D.; writing—review and editing, G.d.Q.d.L., K.S.K., R.S.D., F.P.L.L., and F.S.K.; supervision, F.P.L.L. and F.S.K. All authors have read and agreed to the published version of the manuscript.

Funding

This research was funded by Coordenação de Aperfeiçoamento de Pessoal de Nível Superior (CAPES, Brazil).

Institutional Review Board Statement

Not applicable.

Informed Consent Statement

Not applicable.

Data Availability Statement

The original contributions presented in this study are included in the article/Supplementary Materials. Further inquiries can be directed to the corresponding author.

Acknowledgments

The authors used Google Gemini, OpenAI ChatGPT, and Grammarly solely for language editing, including improvements to grammar, spelling, punctuation, and readability. The authors reviewed and edited all suggested changes and take full responsibility for the scientific content, analyses, interpretations, and conclusions presented in this manuscript.

Conflicts of Interest

The authors declare no conflicts of interest.

References

  1. FAO. Joint FAO/WHO Expert Consultation on Evaluation of Health and Nutritional Properties of Probiotics in Food Including Powder Milk with Live Lactic Acid Bacteria. In Report of a Joint FAO/WHO Expert Consultation on Evaluation of Health and Nutritional Properties of Probiotics in Food Including Powder Milk with Live Lactic Acid Bacteria; FAO: Rome, Italy, 2002. [Google Scholar]
  2. Latif, A.; Shehzad, A.; Niazi, S.; Zahid, A.; Ashraf, W.; Iqbal, M.W.; Rehman, A.; Riaz, T.; Aadil, R.M.; Khan, I.M.; et al. Probiotics: Mechanism of Action, Health Benefits and Their Application in Food Industries. Front. Microbiol. 2023, 14, 1216674. [Google Scholar] [CrossRef] [PubMed]
  3. Sepehr, A.; Miri, S.T.; Aghamohammad, S.; Rahimirad, N.; Milani, M.; Pourshafie, M.-R.; Rohani, M. Health Benefits, Antimicrobial Activities, and Potential Applications of Probiotics: A Review. Medicine 2024, 103, e32412. [Google Scholar] [CrossRef] [PubMed]
  4. Mazziotta, C.; Tognon, M.; Martini, F.; Torreggiani, E.; Rotondo, J.C. Probiotics Mechanism of Action on Immune Cells and Beneficial Effects on Human Health. Cells 2023, 12, 184. [Google Scholar] [CrossRef] [PubMed]
  5. Mercado-Monroy, J.; Falfán-Cortés, R.N.; Muñóz-Pérez, V.M.; Gómez-Aldapa, C.A.; Castro-Rosas, J. Probiotics as Modulators of Intestinal Barrier Integrity and Immune Homeostasis: A Comprehensive Review. J. Sci. Food Agric. 2026, 106, 2578–2590. [Google Scholar] [CrossRef] [PubMed]
  6. Grom, L.C.; Rocha, R.S.; Balthazar, C.F.; Guimarães, J.T.; Coutinho, N.M.; Barros, C.P.; Pimentel, T.C.; Venâncio, E.L.; Collopy Junior, I.; Maciel, P.M.C.; et al. Postprandial Glycemia in Healthy Subjects: Which Probiotic Dairy Food Is More Adequate? J. Dairy Sci. 2020, 103, 1110–1119. [Google Scholar] [CrossRef] [PubMed]
  7. Petraro, S.; Tarracchini, C.; Lugli, G.A.; Mancabelli, L.; Fontana, F.; Turroni, F.; Ventura, M.; Milani, C. Comparative Genome Analysis of Microbial Strains Marketed for Probiotic Interventions: An Extension of the Integrated Probiotic Database. Microbiome Res. Rep. 2024, 3, 45. [Google Scholar] [CrossRef] [PubMed]
  8. Churin, A.A.; Sokolyanskaya, L.O.; Lukina, A.P.; Karnachuk, O.V. Current Concepts in Probiotic Safety and Efficacy. Nutrients 2026, 18, 696. [Google Scholar] [CrossRef] [PubMed]
  9. Abavisani, M.; Khoshrou, A.; Foroushan, S.K.; Ebadpour, N.; Sahebkar, A. Deciphering the Gut Microbiome: The Revolution of Artificial Intelligence in Microbiota Analysis and Intervention. Curr. Res. Biotechnol. 2024, 7, 100211. [Google Scholar] [CrossRef]
  10. Galal, A.; Talal, M.; Moustafa, A. Applications of Machine Learning in Metabolomics: Disease Modeling and Classification. Front. Genet. 2022, 13, 1017340. [Google Scholar] [CrossRef] [PubMed]
  11. Sun, Y.; Li, H.; Zheng, L.; Li, J.; Hong, Y.; Liang, P.; Kwok, L.-Y.; Zuo, Y.; Zhang, W.; Zhang, H. iProbiotics: A Machine Learning Platform for Rapid Identification of Probiotic Properties from Whole-Genome Primary Sequences. Brief. Bioinform. 2022, 23, bbab477. [Google Scholar] [CrossRef] [PubMed]
  12. Dias, R.S.; Martinez, D.P.; Leite, F.P.L.; de Avila, L.F.d.C.; Kremer, F.S. Pato: Prediction of Probiotic Bacteria Using Metabolic Features. Braz. J. Microbiol. 2025, 56, 1169–1178. [Google Scholar] [CrossRef] [PubMed]
  13. Tsifintaris, M.; Kiousi, D.E.; Repanas, P.; Kamarinou, C.S.; Kavakiotis, I.; Galanis, A. Probio-Ichnos: A Database of Microorganisms with In Vitro Probiotic Properties. Microorganisms 2024, 12, 1955. [Google Scholar] [CrossRef] [PubMed]
  14. Seppey, M.; Manni, M.; Zdobnov, E.M. BUSCO: Assessing Genome Assembly and Annotation Completeness. Methods Mol. Biol. 2019, 1962, 227–245. [Google Scholar] [CrossRef] [PubMed]
  15. Chklovski, A.; Parks, D.H.; Woodcroft, B.J.; Tyson, G.W. CheckM2: A Rapid, Scalable and Accurate Tool for Assessing Microbial Genome Quality Using Machine Learning. Nat. Methods 2023, 20, 1203–1212. [Google Scholar] [CrossRef] [PubMed]
  16. Galperin, M.Y.; Vera Alvarez, R.; Karamycheva, S.; Makarova, K.S.; Wolf, Y.I.; Landsman, D.; Koonin, E.V. COG Database Update 2024. Nucleic Acids Res. 2025, 53, D356–D363. [Google Scholar] [CrossRef] [PubMed]
  17. Blin, K.; Wolf, T.; Chevrette, M.G.; Lu, X.; Schwalen, C.J.; Kautsar, S.A.; Duran, H.G.S.; Santos, E.L.C.d.L.; Kim, H.U.; Nave, M.; et al. antiSMASH 4.0-Improvements in Chemistry Prediction and Gene Cluster Boundary Identification. Nucleic Acids Res. 2017, 45, W36–W41. [Google Scholar] [CrossRef] [PubMed]
  18. Lundberg, S.; Lee, S.-I. A Unified Approach to Interpreting Model Predictions. In Proceedings of the 31st International Conference on Neural Information Processing Systems, Long Beach, CA, USA, 4–9 December 2017; pp. 4766–4775. [Google Scholar]
  19. Vorapreeda, T.; Rampai, T.; Chamkhuy, W.; Nopgasorn, R.; Wannawilai, S.; Laoteng, K. Genomic Insights into the Probiotic Functionality and Safety of Lactiplantibacillus Pentosus Strain TBRC 20328 for Future Food Innovation. Foods 2025, 14, 2973. [Google Scholar] [CrossRef] [PubMed]
  20. Jo, D.-M.; Ko, S.-C.; Kim, K.W.; Yang, D.; Kim, J.-Y.; Oh, G.-W.; Choi, G.; Lee, D.-S.; Tabassum, N.; Kim, Y.-M.; et al. Artificial Intelligence-Driven Strategies to Enhance the Application of Lactic Acid Bacteria as Functional Probiotics: Health Promotion and Optimization for Industrial Applications. Trends Food Sci. Technol. 2025, 165, 105309. [Google Scholar] [CrossRef]
  21. Khoo, S.C.; Chin, K.W.; Ting, T.Z.; Luang-In, V.; Chi-Wei Lan, J.; Ma, N.L. Stress Tolerance and Metabolism Profiling of Selected Functional Probiotic Strains. Food Biosci. 2025, 64, 105919. [Google Scholar] [CrossRef]
  22. Fijan, S. Probiotics and Their Antimicrobial Effect. Microorganisms 2023, 11, 528. [Google Scholar] [CrossRef] [PubMed]
  23. Caliman-Sturdza, O.A.; Vaz, J.A.; Lupaescu, A.V.; Lobiuc, A.; Bran, C.; Gheorghita, R.E. Antioxidant and Anti-Inflammatory Activities of Probiotic Strains. Int. J. Mol. Sci. 2026, 27, 1079. [Google Scholar] [CrossRef] [PubMed]
  24. Bernatek, M.; Żukiewicz-Sobczak, W.; Lachowicz-Wiśniewska, S.; Piątek, J. Factors Determining Effective Probiotic Activity: Evaluation of Survival and Antibacterial Activity of Selected Probiotic Products Using an “In Vitro” Study. Nutrients 2022, 14, 3323. [Google Scholar] [CrossRef] [PubMed]
  25. Guo, P.; Wang, W.; Xiang, Q.; Pan, C.; Qiu, Y.; Li, T.; Wang, D.; Ouyang, J.; Jia, R.; Shi, M.; et al. Engineered Probiotic Ameliorates Ulcerative Colitis by Restoring Gut Microbiota and Redox Homeostasis. Cell Host Microbe 2024, 32, 1502–1518.e9. [Google Scholar] [CrossRef] [PubMed]
  26. Fuochi, V.; Petronio, G.P.; Lissandrello, E.; Furneri, P.M. Evaluation of Resistance to Low pH and Bile Salts of Human Lactobacillus Spp. Isolates. Int. J. Immunopathol. Pharmacol. 2015, 28, 426–433. [Google Scholar] [CrossRef] [PubMed]
  27. Wu, H.; Li, Y.; Jiang, Y.; Li, X.; Wang, S.; Zhao, C.; Yang, X.; Chang, B.; Yang, J.; Qiao, J. Machine Learning Prediction of Obesity-Associated Gut Microbiota: Identifying Bifidobacterium pseudocatenulatum as a Potential Therapeutic Target. Front. Microbiol. 2025, 15, 1488656. [Google Scholar] [CrossRef] [PubMed]
  28. Cao, Y.; Hu, X.; Guo, J.; Fang, T. Machine Learning-Based Prediction of Recurrent Extrahepatic Bile Duct Stones after Common Bile Duct Exploration: A Comparative Study of Models and SHAP-Driven Interpretability Analysis. Front. Med. 2025, 12, 1691519. [Google Scholar] [CrossRef] [PubMed]
  29. Kiriyama, Y.; Nochi, H. Physiological Role of Bile Acids Modified by the Gut Microbiome. Microorganisms 2021, 10, 68. [Google Scholar] [CrossRef] [PubMed]
  30. Liu, W.; Li, Z.; Ze, X.; Deng, C.; Xu, S.; Ye, F. Multispecies Probiotics Complex Improves Bile Acids and Gut Microbiota Metabolism Status in an in Vitro Fermentation Model. Front. Microbiol. 2024, 15, 1314528. [Google Scholar] [CrossRef] [PubMed]
  31. Ruiz, L.; Margolles, A.; Sánchez, B. Bile Resistance Mechanisms in Lactobacillus and Bifidobacterium. Front. Microbiol. 2013, 4, 396. [Google Scholar] [CrossRef] [PubMed]
  32. Contreas, L.; Hook, A.L.; Winkler, D.A.; Figueredo, G.; Williams, P.; Laughton, C.A.; Alexander, M.R.; Williams, P.M. Linear Binary Classifier to Predict Bacterial Biofilm Formation on Polyacrylates. ACS Appl. Mater. Interfaces 2023, 15, 14155–14163. [Google Scholar] [CrossRef] [PubMed]
  33. Plaza-Diaz, J.; Ruiz-Ojeda, F.J.; Gil-Campos, M.; Gil, A. Mechanisms of Action of Probiotics. Adv. Nutr. 2019, 10, S49–S66. [Google Scholar] [CrossRef] [PubMed]
  34. Dobson, A.; Cotter, P.D.; Ross, R.P.; Hill, C. Bacteriocin Production: A Probiotic Trait? Appl. Environ. Microbiol. 2012, 78, 1–6. [Google Scholar] [CrossRef] [PubMed]
  35. O’Callaghan, A.; van Sinderen, D. Bifidobacteria and Their Role as Members of the Human Gut Microbiota. Front. Microbiol. 2016, 7, 925. [Google Scholar] [CrossRef] [PubMed]
  36. Abriouel, H.; Caballero Gómez, N.; Manetsberger, J.; Benomar, N. Dual Effects of a Bacteriocin-Producing Lactiplantibacillus Pentosus CF-6HA, Isolated from Fermented Aloreña Table Olives, as Potential Probiotic and Antimicrobial Agent. Heliyon 2024, 10, e28408. [Google Scholar] [CrossRef] [PubMed]
  37. Thoda, C.; Touraki, M. Immunomodulatory Properties of Probiotics and Their Derived Bioactive Compounds. Appl. Sci. 2023, 13, 4726. [Google Scholar] [CrossRef]
  38. Adejumo, S.A.; Oli, A.N.; Rowaiye, A.B.; Igbokwe, N.H.; Ezejiegu, C.K.; Yahaya, Z.S. Immunomodulatory Benefits of Probiotic Bacteria: A Review of Evidence. OBM Genet. 2023, 7, 206. [Google Scholar] [CrossRef]
  39. Beck, M.L.; Song, S.; Shuster, I.E.; Miharia, A.; Walker, A.S. Diversity and Taxonomic Distribution of Bacterial Biosynthetic Gene Clusters Predicted to Produce Compounds with Therapeutically Relevant Bioactivities. J. Ind. Microbiol. Biotechnol. 2023, 50, kuad024. [Google Scholar] [CrossRef] [PubMed]
  40. Pattapulavar, V.; Ramanujam, S.; Kini, B.; Christopher, J.G. Probiotic-Derived Postbiotics: A Perspective on next-Generation Therapeutics. Front. Nutr. 2025, 12, 1624539. [Google Scholar] [CrossRef] [PubMed]
  41. Chuah, L.-O.; Foo, H.L.; Loh, T.C.; Mohammed Alitheen, N.B.; Yeap, S.K.; Abdul Mutalib, N.E.; Abdul Rahim, R.; Yusoff, K. Postbiotic Metabolites Produced by Lactobacillus Plantarum Strains Exert Selective Cytotoxicity Effects on Cancer Cells. BMC Complement. Altern. Med. 2019, 19, 114. [Google Scholar] [CrossRef] [PubMed]
  42. Orkkatteri Krishnan, A.; Mudgal, L.N.; Soni, V.; Prakash, T. ProbML: A Machine Learning-Based Genome Classifier for Identifying Probiotic Organisms. Mol. Nutr. Food Res. 2025, 69, e70025. [Google Scholar] [CrossRef] [PubMed]
Figure 1. Schematic layout of the functional genomic profiling pipeline for probiotic characterization. The workflow is divided into four main sections. Left panel (Genome Information): Extraction of protein-coding genes from complete microbial genomes. Middle panel (Functional Annotation and Explainable Machine Learning): Genomic features are categorized using clusters of orthologous groups (COGs) and biosynthetic gene clusters (BGCs). These high-dimensional features serve as inputs to supervised machine learning models for binary classification of probiotic traits. SHAP (Shapley Additive exPlanations) is subsequently applied to identify and explain the specific functional processes driving each predictive outcome. Right panel (Probiotic Traits and Effects on Host): The seven target phenotypes predicted by the models, detailed alongside their corresponding biological mechanisms and health benefits in the host gastrointestinal environment. Bottom panel (Overview of the Analysis Pipeline): A sequential summary of the overarching methodology, progressing from raw genome sequences to functional annotation, feature engineering, predictive modeling, and final prediction explanation.
Jgbg 01 00012 g001
Figure 2. SHAP interpretability analysis using bar plots for seven phenotype-specific models. The bar plots show the average model-derived contribution (mean absolute SHAP value) of the most relevant COG functional categories and BGC annotations to class prediction. Subfigures detail the target phenotypes: (a) acid resistance, (b) bile resistance, (c) adhesion, (d) antimicrobial activity, (e) immunomodulation, (f) antioxidant activity, and (g) antiproliferative potential.
Jgbg 01 00012 g002
Figure 3. SHAP interpretability analysis using beeswarm plots for seven phenotype-specific models. Each point represents an observation (genome), and its position on the x-axis indicates the SHAP value for that feature in the fitted model. Points to the right indicate a positive contribution to class prediction; points to the left indicate a negative contribution. The color scale denotes relative feature values, with red indicating higher abundance and blue indicating lower abundance. The vertical spread shows the density of genomes at each SHAP contribution level. Subfigures detail the target phenotypes: (a) acid resistance, (b) bile resistance, (c) adhesion, (d) antimicrobial activity, (e) immunomodulation, (f) antioxidant activity, and (g) antiproliferative potential.
Jgbg 01 00012 g003
Table 1. Target labels and class distribution within the genomic dataset. This table lists the seven probiotic phenotypes selected as prediction targets: acid resistance, bile resistance, adhesion, antimicrobial activity, immunomodulation, antioxidant, and antiproliferative potential.
LabelsClassesSamplePercentage (%)
Resistant to acidTrue32141.1
False46058.9
Resistant to bileTrue35845.8
False42354.2
AdhesionTrue27234.8
False50965.2
AntimicrobialTrue42854.8
False35245.2
ImmunomodulationTrue24030.7
False54169.3
AntioxidantTrue9912.6
False68287.4
AntiproliferativeTrue354.4
False74695.6
Table 2. Optimal model performance metrics achieved through cross-validation (CV). Results are presented for the best-performing machine learning algorithm and class-balancing strategy for each probiotic label during k-fold cross-validation. Metrics include Accuracy, Precision, Recall, and F1-score, which reflect the models’ ability to generalize across partitioned training data. CB = CatBoost; RF = Random Forest; XGB = XGBoost.
LabelBest ModelBalancingAccuracyPrecisionRecallF1-Score
Resistance to acidCBSMOTE + Tomek Links0.77 ± 0.020.75 ± 0.030.77 ± 0.040.76 ± 0.02
Resistance to bileCBSMOTE + Tomek Links0.75 ± 0.040.73 ± 0.060.73 ± 0.020.73 ± 0.04
AdhesionRFSMOTE + Tomek Links0.77 ± 0.030.76 ± 0.030.78 ± 0.020.77 ± 0.02
AntimicrobialCBSMOTE + Tomek Links0.74 ± 0.020.72 ± 0.030.70 ± 0.020.71 ± 0.02
ImmunomodulationRFSMOTE + Tomek Links0.82 ± 0.010.81 ± 0.010.84 ± 0.020.82 ± 0.01
AntioxidantXGBSMOTE + Tomek Links0.92 ± 0.020.89 ± 0.010.94 ± 0.030.92 ± 0.02
AntiproliferativeRFSMOTE + Oversampling0.97 ± 0.010.96 ± 0.020.97 ± 0.010.97 ± 0.01
Table 3. Model performance evaluation using Leave-One-Out (LOO) validation. This table presents the metrics obtained when each sample is used as the test set, with the remaining samples serving as the training set. Metrics include Accuracy, Precision, Recall, and F1-score, which reflect the models’ ability to generalize to new observations. CB = CatBoost; LR = Logistic Regression; XGB = XGBoost.
LabelBest ModelBalancingAccuracyPrecisionRecallF1-Score
Resistance to acidCBSMOTE + Oversampling0.720.380.380.38
Resistance to bileLRTomek Links + Undersampling0.680.390.390.39
AdhesionCBSMOTE + Oversampling0.760.400.400.40
AntimicrobialGBWithout Balancing0.670.410.410.41
ImmunomodulationCBSMOTE + Oversampling0.810.420.420.42
AntioxidantXGBSMOTE + Tomek Links0.940.470.470.47
AntiproliferativeXGBSMOTE + Oversampling0.970.490.490.49
Table 4. Performance metrics for the best models in the train-test split scenario. The results summarized here correspond to a traditional random split of the data into training and testing sets. Metrics include Accuracy, Precision, Recall, and F1-score, reflecting the models’ ability to generalize beyond the training dataset, for a test (holdout) set. LGBM = LightGBM; CB = Catboost.
LabelBest ModelBalancingAccuracyPrecisionRecallF1-Score
Resistance to acidLGBMWithout Balancing0.710.700.700.70
Resistance to bileCBWithout Balancing0.760.760.760.76
AdhesionCBSMOTE + Tomek Links0.730.710.690.69
AntimicrobialCBWithout Balancing0.770.770.760.76
ImmunomodulationCBTomek Links + Undersampling0.680.650.670.65
AntioxidantLGBMSMOTE + Tomek Links0.890.770.660.70
AntiproliferativeLGBMWithout Balancing0.960.740.700.72
Table 5. Horizontal comparison of representative probiotic prediction frameworks.
SoftwareObjectiveInputReference
iProbioticsBinary classificationk-mer composition[11]
ProbMLBinary classificationk-mer composition[42]
PatoBinary classificationFunctional Features[12]
Present studySeven phenotype-specific prediction tasksFunctional Features
Disclaimer/Publisher’s Note: The statements, opinions and data contained in all publications are solely those of the individual author(s) and contributor(s) and not of MDPI and/or the editor(s). MDPI and/or the editor(s) disclaim responsibility for any injury to people or property resulting from any ideas, methods, instructions or products referred to in the content.