
Article

Flooding-Induced Mobilization of Heavy Metals in Surface Soils and Associated Carcinogenic and Non-Carcinogenic Health Risks: A Screening-Level Risk Assessment


Department of Biology, Juniata College, Huntingdon, PA 16652, USA
*
Author to whom correspondence should be addressed.
Int. J. Environ. Med. 2026, 1(2), 6; https://doi.org/10.3390/ijem1020006
Submission received: 27 February 2026 / Revised: 5 April 2026 / Accepted: 8 April 2026 / Published: 10 April 2026

Abstract

Flooding is an increasingly frequent climate hazard with the potential to mobilize environmental contaminants and elevate human health risks. In this study, we assessed heavy metals and metalloids across five sites arranged along a flood-risk gradient from low to high. Six replicate samples per site (n = 30 per contaminant) were collected in a single sampling event. Contaminants were evaluated using the US Environmental Protection Agency (EPA) risk assessment framework to calculate chronic daily intake (CDI), hazard quotients (HQs), and lifetime cancer risk. Arsenic, chromium, and nickel emerged as the most concerning cancer drivers, with nickel cancer risk consistently exceeding 1 × 10⁻³ (equivalent to one additional cancer case per 1000 exposed individuals) and arsenic at 4.4 × 10⁻⁴ (about 1 in 2250). Lead posed non-cancer risks (HQ = 0.912, near the threshold of concern), while cobalt demonstrated a significant decreasing gradient with increasing flood-risk (p = 0.018). Arsenic and thallium more than doubled in concentration at high-flood sites relative to low-flood sites, while cadmium, cobalt, and nickel decreased. These findings suggest flooding may mobilize arsenic, lead, and thallium, while diluting or displacing other metals such as cadmium, cobalt, and nickel. Organs of concern include the liver and kidneys for arsenic, cadmium, nickel, and cobalt, the brain and bones for lead, and the lungs and liver for chromium. Although statistical significance was limited by the small sample size, effect sizes and fold-changes indicate meaningful flood-related differences. This study highlights the importance of considering flood-risk in contaminant hazard assessments and the need for flood-adaptive risk management strategies in vulnerable communities.

1. Introduction

Climate change has increased the frequency of heatwaves, wildfires, hurricanes, tropical storms, and floods [1,2]. These weather hazards affect health by increasing the risk of death from noncommunicable or infectious diseases, magnifying respiratory distress, driving water-and-food borne illness, reducing accessibility to medical care, and restricting the capacity of the health workforce [3,4]. Exposure to these conditions is disproportionately felt by vulnerable communities, including ethnic minorities, women, children, migrants, those with underlying health conditions, low-income or impoverished populations, and older individuals [2]. These disparities are influenced by differences in environmental exposure, infrastructure resilience, and access to resources.
The World Health Organization estimates that vector-borne diseases already account for approximately 700,000 deaths annually and projects that this burden will increase under changing climate conditions [5]. Heat-related deaths induced by climate change in those over 65 have been observed to have increased by 70% in the last two decades [3]. The WHO predicts 250,000 more deaths annually from the exacerbated spread of malaria from flooding [5].
Pollution mobilized by extreme weather events infiltrates air, water, and soil systems [6,7]. This redistribution of contaminants alters exposure pathways and increases the likelihood of human contact with contaminated media. Studies published by the Lancet Commission approximate premature deaths attributed to exposure to toxins in soil at 500,000 annually [3]. Contaminants of concern in soil include per- and polyfluoroalkyl substances, heavy metals, organic chemicals, micro- and nanoplastics, pharmaceuticals, viruses, and other pathogens [8,9]. Individuals may be exposed to polluted soils through direct skin contact or inhalation [10]. Children in particular may be exposed to contaminated soils through incidental ingestion during outdoor activities, such as playing in parks or playgrounds [10]. The degree of exposure is influenced by proximity to pollutants and soil conditions [6].
Agricultural activities involving the use of pesticides and fertilizers, wastewater and sewage systems, and mining operations are major sources of heavy metal contamination in soil and water systems [11,12]. Contaminants are typically transported by surface run-off to streams where they percolate into groundwater [6]. Cities that are densely populated are at higher risk of flooding, as materials used to construct buildings, highways, and driveways are impermeable, preventing water from entering the ground and increasing surface runoff [13]. Communities without sufficient economic resources to implement efficient stormwater management and technologies are also at higher risk [14]. Flooding after heavy rain events serves as a mechanism for transporting contaminants and altering the chemical environment of soil by redistributing sediment at the bottom of riverbeds and activating the release of chemicals in soil through oxygen depletion [7,15].
Heavy metals that can be found in soil include arsenic, nickel, lead, chromium, cobalt, and cadmium [8,10]. The health implications for exposure to these heavy metals include damage to the nervous, cardiovascular, renal, hepatic, respiratory, immune, and hematopoietic systems [9].
Toxicologically, arsenic is highly reactive and penetrates cells easily [16,17]. One of its primary mechanisms is binding to sulfhydryl groups in proteins, especially enzymes critical for energy metabolism [16]. This disrupts ATP production and leads to mitochondrial dysfunction [18]. Arsenic also substitutes for phosphate in biochemical reactions, forming unstable arsenate esters that collapse during ATP synthesis, further depleting cellular energy [18]. Additionally, exposure increases reactive oxygen species generation, overwhelming antioxidant defenses like glutathione and superoxide dismutase [19]. This leads to lipid peroxidation, protein misfolding, and DNA damage, which are precursors to carcinogenesis [20].
One of nickel’s primary toxic mechanisms is the induction of oxidative stress [9]. Nickel catalyzes the formation of reactive oxygen species, including superoxide anions and hydroxyl radicals, which damage lipids, proteins, and nucleic acids [8]. This oxidative damage leads to lipid peroxidation, protein carbonylation, and DNA strand breaks, all of which compromise cellular integrity and function [9].
Lead competes with calcium, iron, and zinc, displacing them from critical binding sites in enzymes and structural proteins [10]. This substitution impairs the function of calcium-dependent signaling pathways, particularly in neurons, where lead interferes with synaptic transmission, neurotransmitter release, and neuronal plasticity [8].
Chromium penetrates cell membranes via sulfate transporters, where it is reduced into Cr(III) [8]. This reduction process generates reactive intermediates and reactive oxygen species that cause oxidative stress [10].
Cobalt substitutes iron and zinc in metalloproteins and enzymes that regulate oxygen transport and cellular respiration [16]. This displacement disrupts iron homeostasis and impairs the activity of iron-dependent enzymes.
Cadmium binds strongly to sulfhydryl groups in proteins, altering their structure and inactivating enzymes involved in antioxidant defense [21].
Thallium mimics potassium due to its similar ionic radius and charge [10]. Once within the cells, thallium disrupts potassium-dependent processes and mitochondrial respiration [8].
Over the past several decades, Pennsylvania has experienced a measurable increase in the frequency and intensity of precipitation events, particularly in the Northeast and Appalachian regions [1,13]. While the hydrological impacts of flooding in Pennsylvania have been well documented [6,7,14], the role of flooding in mobilizing heavy metal contamination from soils into surrounding environments, and the resulting implications for human exposure, remains insufficiently characterized at the county level [6,14]. The extent to which recurrent flood events in rural counties such as Huntingdon County alter soil redox chemistry and redistribute contaminated sediments is not well established in the current literature [6,14,22,23,24].
This study aims to evaluate potential associations between flood exposure and heavy metal contamination and mobilization in soil and to assess the potential implications for human health in Huntingdon County.

2. Methods

2.1. Study Design

Five sampling sites were selected to represent a gradient of flooding exposure, with Site 1 classified as the lowest exposure and Site 5 as the highest. Six replicate surface soil samples were collected at each site on a single day, resulting in a total of 30 soil samples across all five sites. Site 1 was designated as the lowest exposure reference condition, as it is located outside mapped flood hazard zones and lacks direct hydrological connectivity to the river system. This site served as a baseline for comparison across increasing levels of flooding exposure. Each sample was subsequently analyzed for multiple heavy metals and metalloids.
Site selection and classification were based on spatial relationships to FEMA Flood Insurance Rate Maps (FIRM) and proximity to the Juniata River and its associated floodplain. Site 1 (40.581280° N, 78.150685° W)was classified as low exposure, as it is located outside mapped flood hazard zones and not directly adjacent to the main river channel. Site 2 (40.561213° N, −78.106032° W) was classified as low to moderate exposure, as it is situated near the floodplain boundary but outside the primary Special Flood Hazard Area. Site 3 (40.487672° N, −78.017081° W) was classified as moderate exposure due to partial overlap with the floodplain and proximity to secondary water channels. Site 4 (40.497080° N, −78.014259° W) was classified as moderate to high exposure, as it lies within the mapped floodplain and in close proximity to the river channel. Site 5 (40.482817° N, −78.014193° W) was classified as high exposure, as it is located within the Special Flood Hazard Area and directly adjacent to the primary river channel, indicating a high likelihood of inundation during flood events. Site classifications were confirmed through visual inspection of mapped flood extents, river proximity, and floodplain boundaries to ensure consistency with FEMA designations.

2.2. Sample Collection

Surface soil samples were collected from each site using a standardized protocol to ensure consistency across locations. At each site, six replicate samples were obtained within a defined sampling area of approximately 10–15 m to capture local spatial variability. Samples were collected from the topsoil layer (0–12 cm depth) using a clean stainless-steel hand auger. Sampling equipment was cleaned between sites using deionized water to prevent cross-contamination. Each sample was placed into pre-labeled, acid-washed polyethylene containers and transported on ice to the laboratory. Visible debris, including plant material and stones, was removed prior to analysis, and samples were homogenized before storage at 4 °C until processing. All samples were collected on the same day to minimize temporal variability.

2.3. Laboratory Analysis

Soil samples were prepared for heavy metal analysis using a standardized acid digestion protocol. Following collection, samples were dried at 60 °C for 24 h on acid-washed plastic trays and allowed to cool to room temperature. Dried samples were sieved through a 2 mm mesh to remove debris and ensure homogeneity. Approximately 1.00 g of sieved soil was transferred into a 50 mL borosilicate digestion tube.
Samples were digested using 10 mL of 70% trace-metal-grade nitric acid (HNO3; Carolina Biological Supply Company, Burlington, NC, USA). A pre-digestion step was performed at room temperature for 30 min, followed by heating at 95 °C for 1–2 h with caps loosely placed to allow venting. After digestion, samples were cooled to room temperature and filtered using a 0.45 µm syringe filter (Carolina Biological Supply Company, Burlington, NC, USA).
Filtered digests were diluted to a final volume of 50 mL using ultrapure water (Thermo Fisher Scientific, Waltham, MA, USA) to achieve a 2% nitric acid matrix. Sample pH was verified to be within the range of 0.9–1.2 to ensure analytical stability.
Metal concentrations were quantified using inductively coupled plasma mass spectrometry (ICP-MS; Thermo Fisher Scientific, Waltham, MA, USA). Calibration was performed using multi-element standard solutions, and quality control procedures included method blanks, replicate samples, and acid-washed equipment to minimize contamination (Carolina Biological Supply Company, Burlington, NC, USA). Target analytes included arsenic, cadmium, chromium, cobalt, copper, iron, lead, lithium, nickel, phosphorus, thallium, and zinc. Concentrations were reported in parts per billion (ppb) following application of dilution factors.

2.4. Risk Assessment Framework

Chronic daily intake (CDI) was calculated as:
CDI = (C × IR × EF × ED) ÷ (BW × AT), where C represents the measured concentration of each heavy metal or metalloid in the soil samples (mg/L, with 1 ppb = 0.001 mg/L), IR is the ingestion rate (2 L/day), EF is the exposure frequency (350 days/year), ED is the exposure duration (30 years), BW is body weight (70 kg), and AT is the averaging time (non-cancer: ED × 365; cancer: 70 years × 365).
HQ was calculated as HQ = CDI ÷ RfD, where RfD (Reference Dose) represents the estimated daily exposure level for a contaminant that is not expected to cause adverse health effects over a lifetime, as defined by the U.S. Environmental Protection Agency (EPA). HQ ≥ 1 indicates potential non-carcinogenic risk [25,26].
Lifetime cancer risk was calculated as Risk = CDI × SF. EPA considers risks between 1 × 10⁻⁶ and 1 × 10⁻⁴ acceptable. Risks > 1 × 10⁻⁴ indicate elevated concern.

2.5. Statistical Analysis

Descriptive statistics (mean, SD) were computed by site. Fold-change was calculated for each site relative to the low-exposure reference condition (Site 1) to quantify effect sizes across the flooding gradient. Mann–Whitney U tests compared low (Sites 1–2) versus high (Sites 4–5) flooding categories. Jonckheere–Terpstra tests were used to assess monotonic trends across ordered flooding exposure levels. Spearman correlation coefficients were also computed to evaluate associations between flood exposure and metal concentrations. Statistical significance was defined as p < 0.05. All statistical analyses were performed using R software version 4.5.2 (R Foundation for Statistical Computing, Vienna, Austria).

3. Results

3.1. Mean Concentrations

Mean concentrations (±standard deviation) of all analyzed heavy metals and metalloids were calculated for each site based on six replicate surface soil samples. These site-specific values represent the primary dataset used to derive CDI, HQ, and lifetime cancer risk estimates. Table 1 presents mean ± SD concentrations for each analyte across Sites 1–5, while Table 2 summarizes overall mean concentrations and derived risk metrics across all sites.
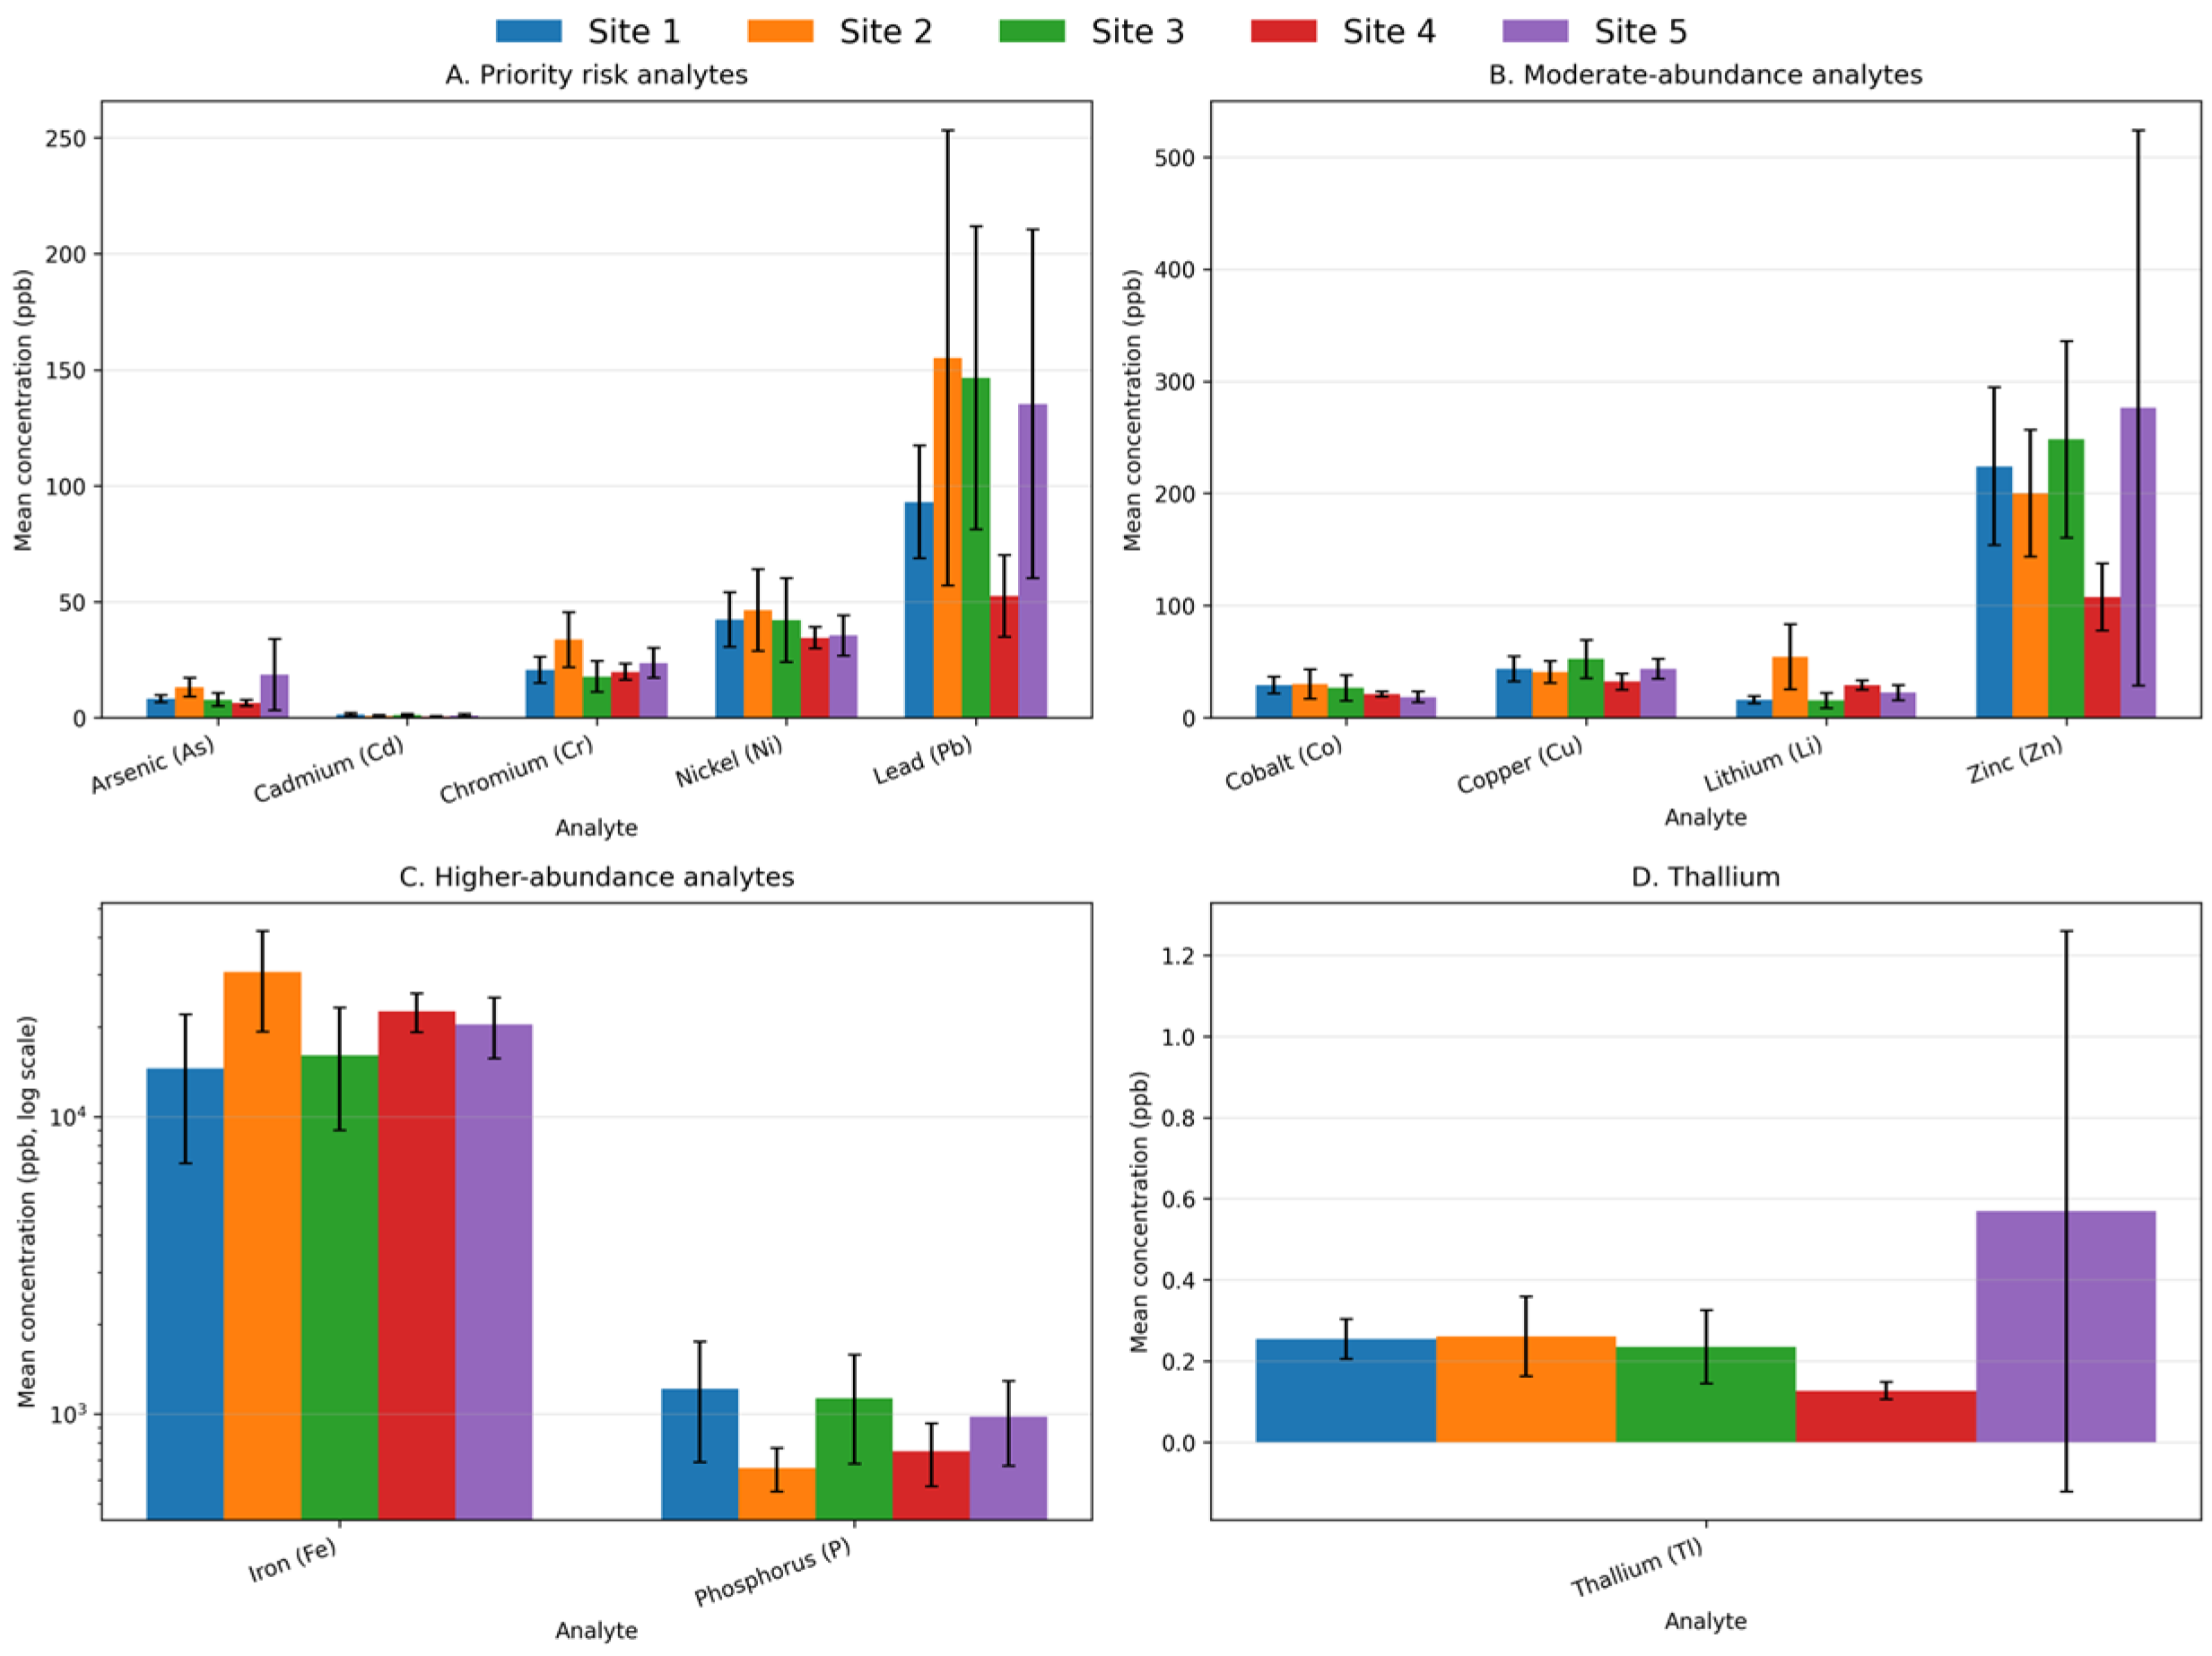
Across sites (Table 1), arsenic concentrations increased with flooding exposure, rising from 8.18 ± 1.52 ppb at Site 1 to 18.52 ± 15.41 ppb at Site 5. Lead concentrations showed substantial variability, with higher values observed at Site 2 (155.13 ± 98.12 ppb) and Site 5 (135.31 ± 75.25 ppb) compared to Site 4 (52.48 ± 17.73 ppb). Nickel concentrations remained relatively consistent across sites (34.45–46.43 ppb).
In contrast, cobalt and cadmium concentrations decreased with increasing flooding exposure, declining from 29.01 ± 7.54 ppb to 18.56 ± 5.06 ppb and from 1.504 ± 0.540 ppb to 1.018 ± 0.508 ppb, respectively. Chromium, copper, and zinc exhibited moderate variability across sites without a consistent monotonic pattern.
Iron and phosphorus showed the highest concentrations among all analytes, consistent with their natural abundance in soil. Thallium concentrations remained low across all sites but demonstrated increased variability at higher exposure levels.

3.2. Hazard Data

Arsenic had HQ = 0.986 and cancer risk = 4.4 × 10⁻⁴ (1 in 2250), exceeding EPA’s target range. Chromium (Cr) risk was 2.3 × 10⁻⁴ (1 in 4300). Nickel posed the highest cancer risk at 1.0 × 10⁻³ (1 in 1000). Lead had HQ = 0.912, near the non-cancer threshold, with cancer risk = 2.7 × 10⁻⁵ (1 in 37,000). Cadmium’s risk was 1.0 × 10⁻⁵ (1 in 97,000). Other metals lacked EPA toxicity values.

3.3. Flood-Related Differences

Fold-change analysis relative to the low-exposure reference site (Site 1) showed that arsenic (2.26×), thallium (2.24×), and lead (1.45×) increased at higher flooding exposure sites. In contrast, cadmium (0.68×), cobalt (0.64×), and nickel (0.84×) decreased across the flooding gradient (Table 3).
Mann–Whitney U tests indicated a statistically significant difference for cobalt (p = 0.023), while cadmium, nickel, and zinc approached significance. Jonckheere–Terpstra tests confirmed a significant monotonic decrease for cobalt (p = 0.018), with cadmium showing borderline significance (p = 0.074). Arsenic and lead exhibited substantial fold-changes but did not demonstrate statistically significant trends, likely due to limited sample size (Table 4).

3.4. Graphical Interpretation

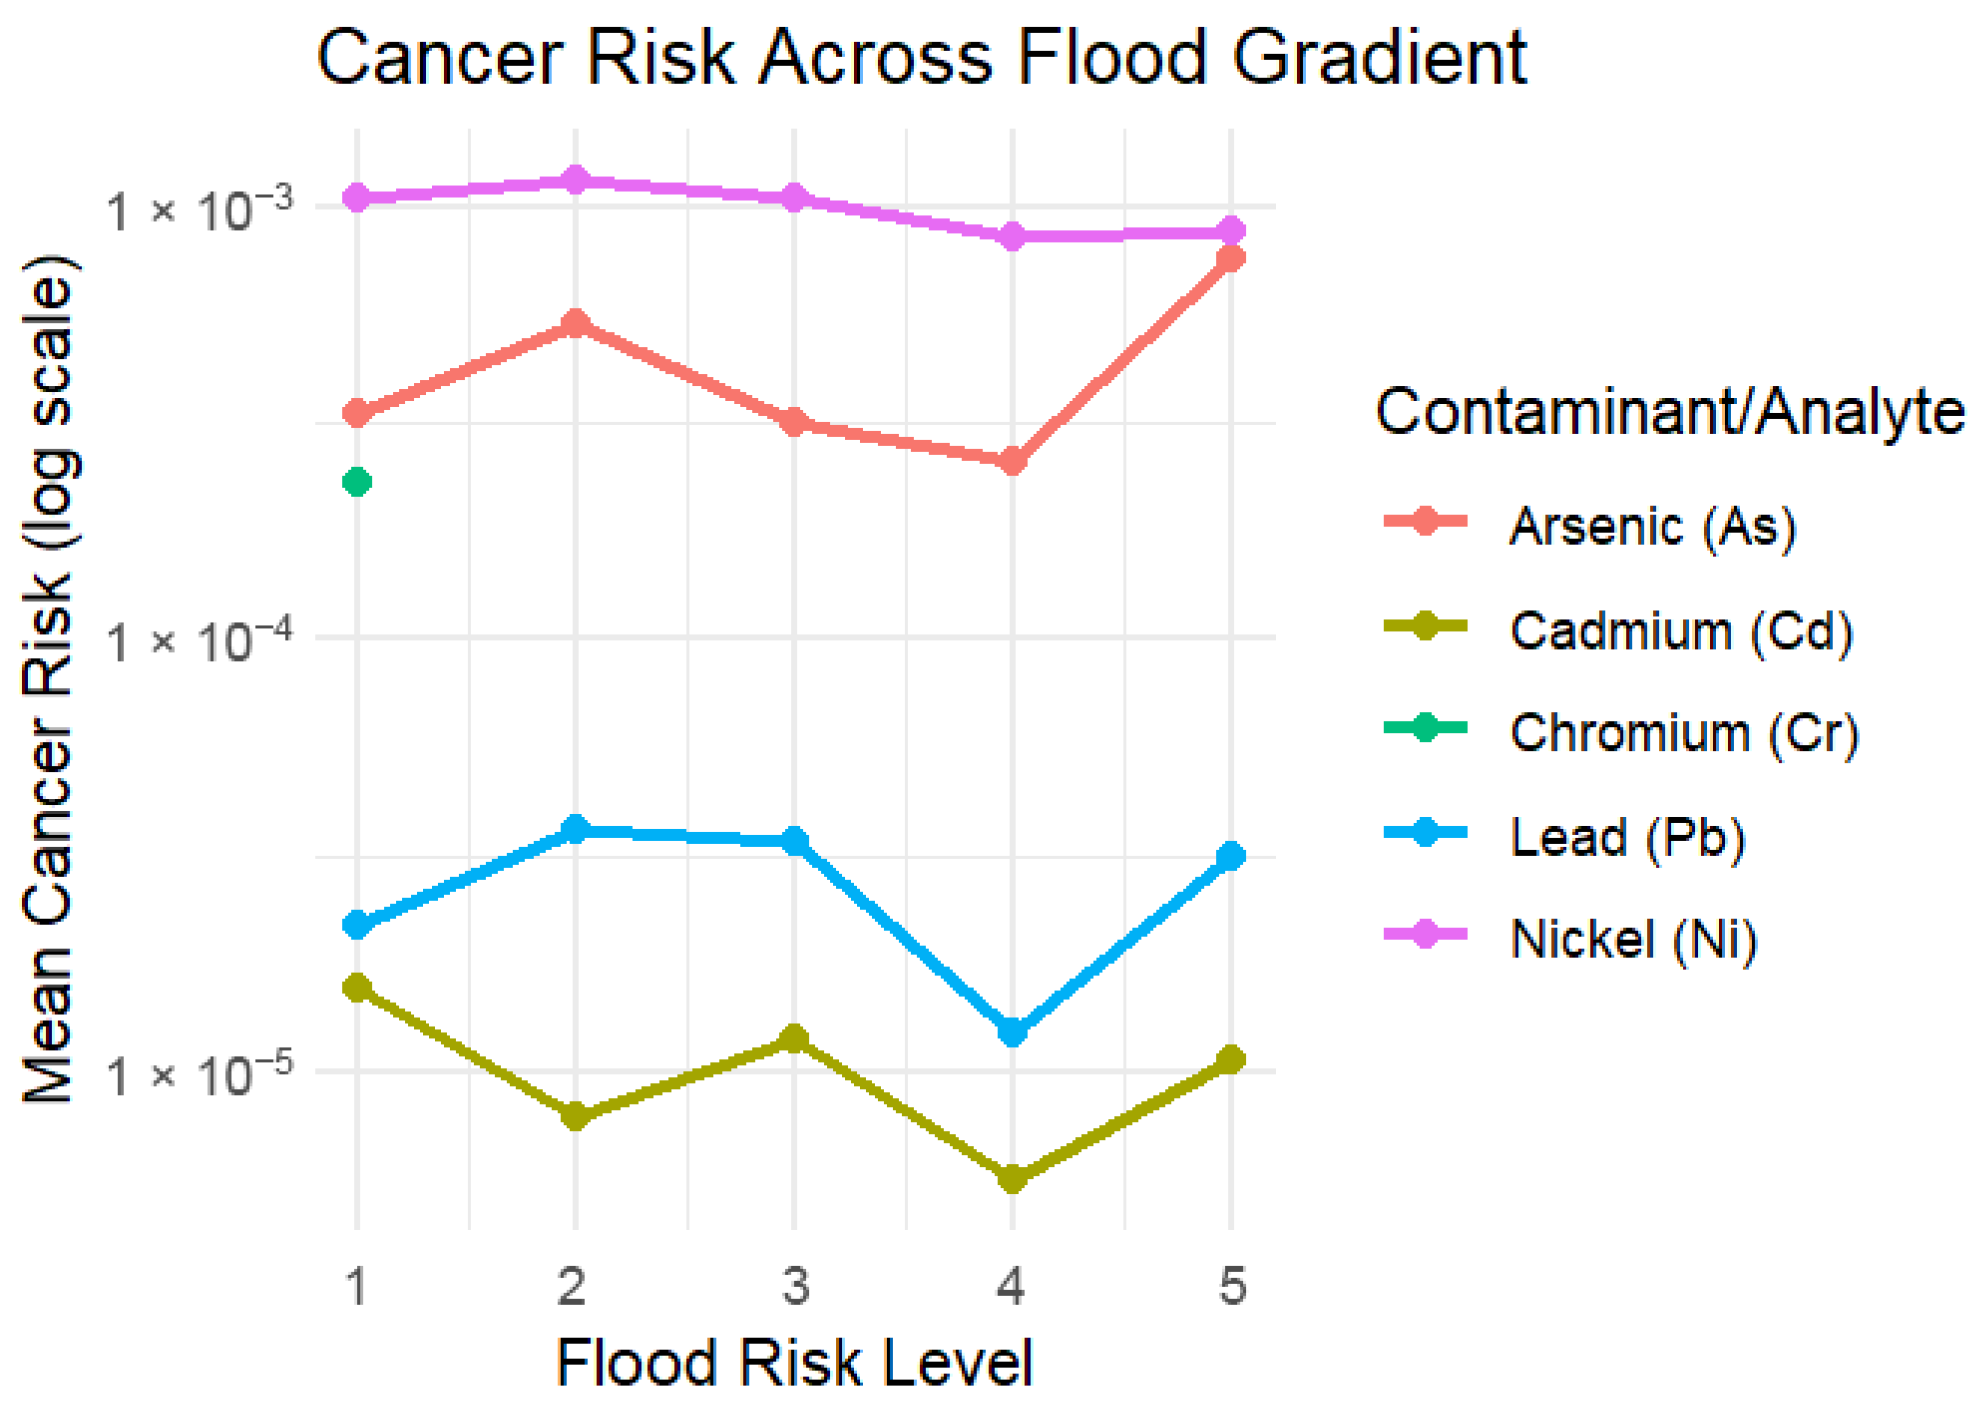
HQ values indicated that arsenic exceeded 1 at higher flooding exposure sites, with lead approaching the threshold of concern (Figure 1 and Figure 2). Nickel HQ values remained below 1 across all sites; however, cancer risk estimates indicated that nickel consistently exceeded 1 in 1000, while arsenic approached this level at higher exposure sites. Lead and cadmium cancer risks remained lower, at approximately 1 in 37,000 and 1 in 97,000, respectively.
Concentration data (Table 1 and Figure 3) showed that arsenic, lead, and thallium were elevated at higher flooding exposure sites, whereas cobalt and cadmium decreased across the gradient, and nickel exhibited a modest decline.

4. Discussion

Using the EPA risk assessment framework, this study identified arsenic, nickel, and chromium as the primary contributors to cancer risk. Lead and arsenic approached threshold levels for non-cancer risk. EPA screening levels are intended to provide conservative human health benchmarks and should not be interpreted as representative of natural or regional background concentrations in soil. Across the five sampling sites, lead, thallium, and arsenic concentrations increased with flood-risk, whereas cobalt, nickel, and cadmium concentrations decreased. Nonparametric statistical analyses reveal that these patterns are systematic rather than random, suggesting that flooding may influence metal mobility in floodplain soils.
The Mann–Whitney U test revealed significant differences in metal concentrations between low- and high-flood-risk sites, indicating that hydrological conditions alter soil geochemistry. The use of nonparametric statistics is appropriate for comparing concentrations across a limited sample size, as spatial variability is accounted for [14]. The Jonckheere–Terpstra test identified monotonic trends for cobalt and cadmium across increasing flood-risk categories, indicating that metal concentrations did not exhibit stochastic variation. Despite the constrained statistical power of a limited sample size, effect size estimates revealed meaningful differences across flood-risk categories, suggesting that flooding produces shifts in metal concentrations even when statistical significance is not consistently observed.
The positive relationship between flood-risk and concentrations of arsenic, lead, and thallium aligns with established models of redox-driven metal mobilization in floodplain soils. Flooding induces anaerobic conditions that destabilize iron oxyhydroxide minerals, releasing arsenic into soil porewater [27,28]. The reduction of arsenate (As(V)) to arsenite (As(III)) increases both arsenic solubility and bioavailability [22]. Similar patterns have been documented in floodplain soils affected by anthropogenic contamination, where periodic inundation enhances the release of arsenic [12]. Consistent with these findings, arsenic bioaccessibility in river floodplain soils has been shown to increase under changing redox conditions, further supporting the environmental relevance of these observations [29,30]. Oscillating redox conditions regulate arsenic mobility by alternating processes of immobilization and release contingent on microbial conditions [22]. Reviews of floodplain systems demonstrate that increased flooding frequency associated with climate change will amplify arsenic mobilization and risk of exposure [14].
Lead and thallium exhibited comparable trends, likely due to their affinity for iron oxide phases. Periodic flooding has been shown to increase the release of thallium through redox-controlled transformations within soil matrices [31]. Seasonal wetting and drying cycles mobilize lead in contaminated floodplains through destabilization of metal-binding phases [30]. The alignment of these geochemical explanations with the trends observed in this study supports the interpretation that flooding increases the mobility of arsenic, lead, and thallium rather than producing site-specific anomalies.
In contrast, cobalt, nickel, and cadmium concentrations decreased as flood-risk increased. The Mann–Whitney and Jonckheere–Terpstra results indicate that these negative trends suggest that flooding can promote metal immobilization through redox-dependent pathways. The decline in cobalt concentrations across higher flood-risk sites may be attributed to its association with manganese oxides in aerobic soils. Under oxygen-rich conditions, cobalt is stabilized through adsorption to manganese minerals, whereas redox oscillations associated with flooding redistribute cobalt and reduce localized accumulation [14].
Cadmium behavior in flooded soils is similar. Flooding reduces cadmium mobility through sulfide mineral formation and iron-mediated immobilization processes, particularly under fluctuating redox and pH conditions [12]. Mesocosm experiments demonstrate that flooding can decrease cadmium release in contaminated soils [22]. Studies of flooded soils further show that iron and sulfur dynamics regulate cadmium immobilization and mobility under changing redox conditions [14]. Comparable patterns have been reported in contaminated floodplain soil profiles, where redox-driven processes influence the mobilization and partitioning of cadmium, lead, and nickel under fluctuating hydrological conditions [32,33].
The estimated lifetime cancer risk for nickel and arsenic exceeded EPA thresholds, highlighting the potential public health relevance of flood-driven metal mobilization even in rural, non-industrial contexts. While much of the existing literature focuses on occupational exposure, this study extends risk assessment to environmental exposure over a 70-year lifetime. Health risk assessments conducted in floodplain environments have similarly identified potentially toxic elements in soils as contributors to long-term exposure risk, supporting the use of screening-level risk frameworks in these systems [32].
By demonstrating statistically supported relationships between flood-risk and metal concentrations, this study suggests that hydrological change may systematically alter exposure pathways in flood-prone communities. These findings are consistent with prior floodplain studies demonstrating that hydrological variability can systematically alter contaminant mobility and exposure potential in soil systems [31,32]. The presence of monotonic trends further implies that projected increases in flooding frequency may lead to predictable shifts in environmental risk rather than isolated contamination events [14].
Several limitations must be considered when interpreting these findings. The absence of pre-flood soil samples prevented direct comparison of metal concentrations before and after rainfall events, limiting the ability to quantify temporal changes. Because this study is based on a single sampling event, observed differences should be interpreted as spatial associations rather than temporally validated effects of flooding. Although Site 1 functioned as a low-exposure reference condition, the study did not include a fully independent non-flooding control site with identical environmental characteristics. Additionally, the analysis of total metal concentrations rather than specific chemical species constrained assessment of compound-specific toxicity. The risk calculations are based on standard exposure assumptions, including ingestion rate, exposure duration, and body weight, which are intended to represent general population exposure rather than site-specific conditions and do not account for child-specific exposure scenarios. Nevertheless, the risk calculations employed conservative EPA thresholds, ensuring that potential health risks were not underestimated.
These results suggest that future studies should incorporate larger sample sizes, temporal monitoring across flood cycles, and speciation analysis to refine understanding of metal behavior in floodplain soils. Such approaches are increasingly recommended in floodplain geochemistry research, where redox oscillations and hydrological variability complicate predictions of metal transport and bioavailability [14].
Flooding patterns in Huntingdon, Pennsylvania, are projected to increase in the coming decade. Reports indicate that 3828 miles of Pennsylvania’s rivers and streams do not meet water quality standards. As runoff increases, the dissolution of metals retained in sediment is expected to increase, thereby enhancing their mobility and proximity to community infrastructure. Current flood management practices remain largely reactive. The Multi-Jurisdictional Hazard Mitigation Plan does not identify site-specific projects to improve levees, channels, or floodwalls, and available planning documents do not appear to reflect current or projected precipitation patterns. Limited funding for climate mitigation in rural regions such as Huntingdon County further constrains proactive management. These findings highlight the need for incorporating environmental contamination risks into flood management and public health planning.

5. Conclusions

Flooding may contribute to increased hazard for specific contaminants, particularly arsenic, lead, and thallium, elevating potential health risks in flood-prone regions. In contrast, cobalt, cadmium, and nickel demonstrated decreasing trends with increasing flooding exposure, indicating that flooding can also promote metal immobilization depending on geochemical conditions.
Arsenic and nickel were identified as the primary contributors to cancer risk, with estimated lifetime cancer risks exceeding EPA thresholds, while lead approached levels of concern for non-carcinogenic effects. These findings highlight that flood-driven changes in soil chemistry can influence both contaminant mobility and long-term exposure risk, even in rural and non-industrial environments.
The results of this study demonstrate that flooding is not solely a physical hazard but also an environmental process capable of altering contaminant distribution and exposure pathways. As flooding frequency and intensity are projected to increase, these shifts may lead to cumulative changes in environmental risk profiles over time.
These findings emphasize the need for flood-adaptive environmental health strategies, including targeted monitoring of high-risk contaminants such as arsenic and lead in flood-prone areas, particularly during and following flood events. Future research should incorporate temporal sampling across flood cycles, larger sample sizes, and metal speciation analyses to further characterize contaminant dynamics and improve risk prediction.

Author Contributions

T.W. and N.M.P.; Methodology, T.W.; Software, T.W.; Validation, T.W. and N.M.P.; Formal Analysis, T.W.; Investigation, N.M.P.; Resources, T.W.; Data Curation, T.W.; Writing—Original Draft, N.M.P. and T.W.; Writing—Review & Editing, N.M.P. and T.W.; Visualization, T.W.; Supervision, T.W.; Project Administration, T.W.; Funding Acquisition, T.W. All authors have read and agreed to the published version of the manuscript.

Funding

This research received no external funding.

Institutional Review Board Statement

Not applicable. The study not involving humans or animals.

Informed Consent Statement

Not applicable. The study not involving humans or animals.

Data Availability Statement

The data supporting the reported results are publicly available on Figshare at: https://doi.org/10.6084/m9.figshare.31969920 (accessed on 1 March 2026).

Acknowledgments

The authors gratefully acknowledge the Juniata College Biology Department for providing laboratory space and materials that supported this work. The authors also thank Ryan D. Mathur for conducting the ICP-MS analysis and for providing technical expertise essential to this study.

Conflicts of Interest

The authors declare no conflicts of interest.

Abbreviations

The following abbreviations are used in this manuscript:
CDIChronic Daily Intake
HQHazard Quotient
IRIngestion Rate
BWBody Weight
RfDReference Dose
SFSlope Factor

References

  1. Pörtner, H.-O.; Roberts, D.C.; Tignor, M.; Poloczanska, E.S.; Mintenbeck, K.; Alegría, A.; Craig, M.; Langsdorf, S.; Löschke, S.; Möller, V.; et al. (Eds.) Climate Change 2022: Impacts, Adaptation and Vulnerability; Contribution of Working Group II to the Sixth Assessment Report of the Intergovernmental Panel on Climate Change; Cambridge University Press: Cambridge, UK; New York, NY, USA, 2022; 3056p. [Google Scholar] [CrossRef]
  2. Romanello, M.; Di Napoli, C.; Green, C.; Kennard, H.; Lampard, P.; Scamman, D.; Walawender, M.; Ali, Z.; Ameli, N.; Ayeb-Karlsson, S.; et al. The 2023 report of the Lancet Countdown on health and climate change: The imperative for a health-centred response in a world facing irreversible harms. Lancet 2023, 402, 2346–2394. [Google Scholar] [CrossRef]
  3. Romanello, M.; McGushin, A.; Di Napoli, C.; Drummond, P.; Hughes, N.; Jamart, L.; Kennard, H.; Lampard, P.; Rodriguez, B.S.; Arnell, N.; et al. The 2021 report of the Lancet Countdown on health and climate change: Code red for a healthy future. Lancet 2021, 398, 1619–1662. [Google Scholar] [CrossRef]
  4. Mora, C.; McKenzie, T.; Gaw, I.M.; Dean, J.M.; von Hammerstein, H.; Knudson, T.A.; Setter, R.O.; Smith, C.Z.; Webster, K.M.; Patz, J.A.; et al. Over half of known human pathogenic diseases can be aggravated by climate change. Nat. Clim. Change 2022, 12, 869–875. [Google Scholar] [CrossRef]
  5. Caminade, C.; Kovats, S.; Rocklöv, J.; Tompkins, A.M.; Morse, A.P.; Colón-González, F.J.; Stenlund, H.; Martens, P.; Lloyd, S.J. Impact of climate change on global malaria distribution. Proc. Natl. Acad. Sci. USA 2014, 111, 3286–3291. [Google Scholar] [CrossRef] [PubMed]
  6. Ciszewski, D.; Grygar, T.M. A review of flood-related storage and remobilization of heavy metal pollutants in river systems. Water Air Soil Pollut. 2016, 227, 239. [Google Scholar] [CrossRef]
  7. Eggleton, J.; Thomas, K.V. A review of factors affecting the release and bioavailability of contaminants during sediment disturbance events. Environ. Int. 2004, 30, 973–980. [Google Scholar] [CrossRef]
  8. Tchounwou, P.B.; Yedjou, C.G.; Patlolla, A.K.; Sutton, D.J. Heavy Metal Toxicity and the Environment. In Molecular, Clinical and Environmental Toxicology; Experientia Supplementum; Springer: Basel, Switzerland, 2012; Volume 101, pp. 133–164. [Google Scholar] [CrossRef]
  9. Jomova, K.; Alomar, S.Y.; Nepovimova, E.; Kuca, K.; Valko, M. Heavy metals: Toxicity and human health effects. Arch. Toxicol. 2025, 99, 153–209. [Google Scholar] [CrossRef]
  10. Jaishankar, M.; Tseten, T.; Anbalagan, N.; Mathew, B.B.; Beeregowda, K.N. Toxicity, mechanism and health effects of some heavy metals. Interdiscip. Toxicol. 2014, 7, 60–72. [Google Scholar] [CrossRef] [PubMed]
  11. Punshon, T.; Jackson, B.P.; Meharg, A.A.; Warczack, T.; Scheckel, K.; Guerinot, M.L. Understanding arsenic dynamics in agronomic systems to predict and prevent uptake by crop plants. Sci. Total Environ. 2017, 581–582, 209–220. [Google Scholar] [CrossRef]
  12. Urango-Cárdenas, I.; Enamorado-Montes, G.; Burgos-Nuñez, S.; Marrugo-Madrid, S.; Paternina-Uribe, R.; Marrugo-Negrete, J.; Díez, S. Unravelling arsenic bioavailability in floodplain soils impacted by mining activities. Sci. Total Environ. 2024, 947, 174193. [Google Scholar] [CrossRef] [PubMed]
  13. Davis Todd, C.E.; Harbor, J.M.; Tyner, B. Increasing magnitudes and frequencies of extreme precipitation events used for hydraulic analysis in the Midwest. J. Soil Water Conserv. 2006, 61, 179–184. [Google Scholar] [CrossRef]
  14. Ponting, J.; Kelly, T.J.; Verhoef, A.; Watts, M.J.; Sizmur, T. The impact of increased flooding occurrence on the mobility of potentially toxic elements in floodplain soil—A review. Sci. Total Environ. 2021, 754, 142040. [Google Scholar] [CrossRef] [PubMed]
  15. Hansen, D.J.; Horne, A.J. The effect of drying/re-flooding on trace metal, As and Se fluxes in a treatment wetland: Addressing growing environmental concerns. Biology 2022, 11, 188. [Google Scholar] [CrossRef]
  16. Agency for Toxic Substances and Disease Registry (ATSDR). How Does Arsenic Induce Pathogenic Change? Available online: https://archive.cdc.gov/www_atsdr_cdc_gov/csem/arsenic/arsenic_pathogen.html (accessed on 1 March 2026).
  17. Ratnaike, R. Acute and chronic arsenic toxicity. Postgrad. Med. J. 2003, 79, 391–396. [Google Scholar] [CrossRef]
  18. Sun, H.-J.; Rathinasabapathi, B.; Wu, B.; Luo, J.; Pu, L.-P.; Ma, L.Q. Arsenic and selenium toxicity and their interactive effects in humans. Environ. Int. 2014, 69, 148–158. [Google Scholar] [CrossRef]
  19. Flora, S.J. Arsenic-induced oxidative stress and its reversibility following combined administration of N-acetylcysteine and meso 2,3-dimercaptosuccinic acid in rats. Clin. Exp. Pharmacol. Physiol. 1999, 26, 865–869. [Google Scholar] [CrossRef]
  20. Rahman, M.A.; Hannan, M.A.; Uddin, M.J.; Rahman, M.S.; Rashid, M.M.; Kim, B. Exposure to environmental arsenic and emerging risk of Alzheimer’s disease: Perspective mechanisms, management strategy, and future directions. Toxics 2021, 9, 188. [Google Scholar] [CrossRef] [PubMed]
  21. Davidova, S.; Milushev, V.; Satchanska, G. The mechanisms of cadmium toxicity in living organisms. Toxics 2024, 12, 875. [Google Scholar] [CrossRef] [PubMed]
  22. Parsons, C.T.; Couture, R.-M.; Omoregie, E.O.; Bardelli, F.; Greneche, J.-M.; Roman-Ross, G.; Charlet, L. The impact of oscillating redox conditions: Arsenic immobilisation in contaminated calcareous floodplain soils. Environ. Pollut. 2013, 178, 254–263. [Google Scholar] [CrossRef]
  23. Burton, E.D.; Johnston, S.G.; Kocar, B.D. Arsenic mobility during flooding of contaminated soil: The effect of microbial sulfate reduction. Environ. Sci. Technol. 2014, 48, 13660–13667. [Google Scholar] [CrossRef]
  24. Antić-Mladenović, S.; Frohne, T.; Kresović, M.; Stärk, H.-J.; Savić, D.; Ličina, V.; Rinklebe, J. Redox-controlled release dynamics of thallium in periodically flooded arable soil. Chemosphere 2017, 178, 268–276. [Google Scholar] [CrossRef]
  25. U.S. Environmental Protection Agency (EPA). Risk Assessment Guidance for Superfund (RAGS), Volume I: Human Health Evaluation Manual (Part A); EPA/540/1-89/002; Office of Emergency and Remedial Response: Washington, DC, USA, 1989.
  26. U.S. Environmental Protection Agency (EPA). Regional Screening Levels (RSLs)—User’s Guide. Available online: https://www.epa.gov/risk/regional-screening-levels-rsls-users-guide (accessed on 1 March 2026).
  27. Wade, A.M.; Eckley, C.S.; Noerpel, M.; Goetz, J.; Leptich, D.; Prestbo, K.; Van de Riet, D.; Sluka, S.; Wilkin, R.; Luxton, T.P. Mobilization of porewater Pb and Zn in response to seasonal wetting and drying within contaminated floodplains. Sci. Total Environ. 2025, 958, 178053. [Google Scholar] [CrossRef] [PubMed]
  28. Wang, Z.; Liu, X.; Liang, X.; Dai, L.; Li, Z.; Liu, R.; Zhao, Y. Flooding-drainage regulate the availability and mobility process of Fe, Mn, Cd, and As at paddy soil. Sci. Total Environ. 2022, 817, 152898. [Google Scholar] [CrossRef] [PubMed]
  29. Qin, L.; Wang, L.; Zhao, S.; Sun, X.; Yu, L.; Wang, M.; Chen, S. A new insight into Cd reduction by flooding in paddy soil: The different dominant roles of Fe and S on Cd immobilization under fluctuant pe + pH conditions. Sci. Total Environ. 2022, 847, 157604. [Google Scholar] [CrossRef]
  30. Padoan, E.; Hernandez Kath, A.; Vahl, L.C.; Ajmone-Marsan, F. Potential release of zinc and cadmium from mine-affected soils under flooding, a mesocosm study. Arch. Environ. Contam. Toxicol. 2020, 79, 421–434. [Google Scholar] [CrossRef] [PubMed]
  31. Rinklebe, J.; Shaheen, S.M. Assessing the Mobilization of Cadmium, Lead, and Nickel Using a Seven-Step Sequential Extraction Technique in Contaminated Floodplain Soil Profiles Along the Central Elbe River, Germany. Water Air Soil Pollut. 2014, 225, 2039. [Google Scholar] [CrossRef]
  32. Rinklebe, J.; Antoniadis, V.; Shaheen, S.M.; Rosche, O.; Altermann, M. Health risk assessment of potentially toxic elements in soils along the Central Elbe River, Germany. Environ. Int. 2019, 126, 398–406. [Google Scholar] [CrossRef]
  33. Mikutta, C.; Mandaliev, P.N.; Mahler, N.; Kotsev, T.; Kretzschmar, R. Bioaccessibility of arsenic in mining-impacted circumneutral river floodplain soils. Environ. Sci. Technol. 2014, 48, 13468–13477. [Google Scholar] [CrossRef]
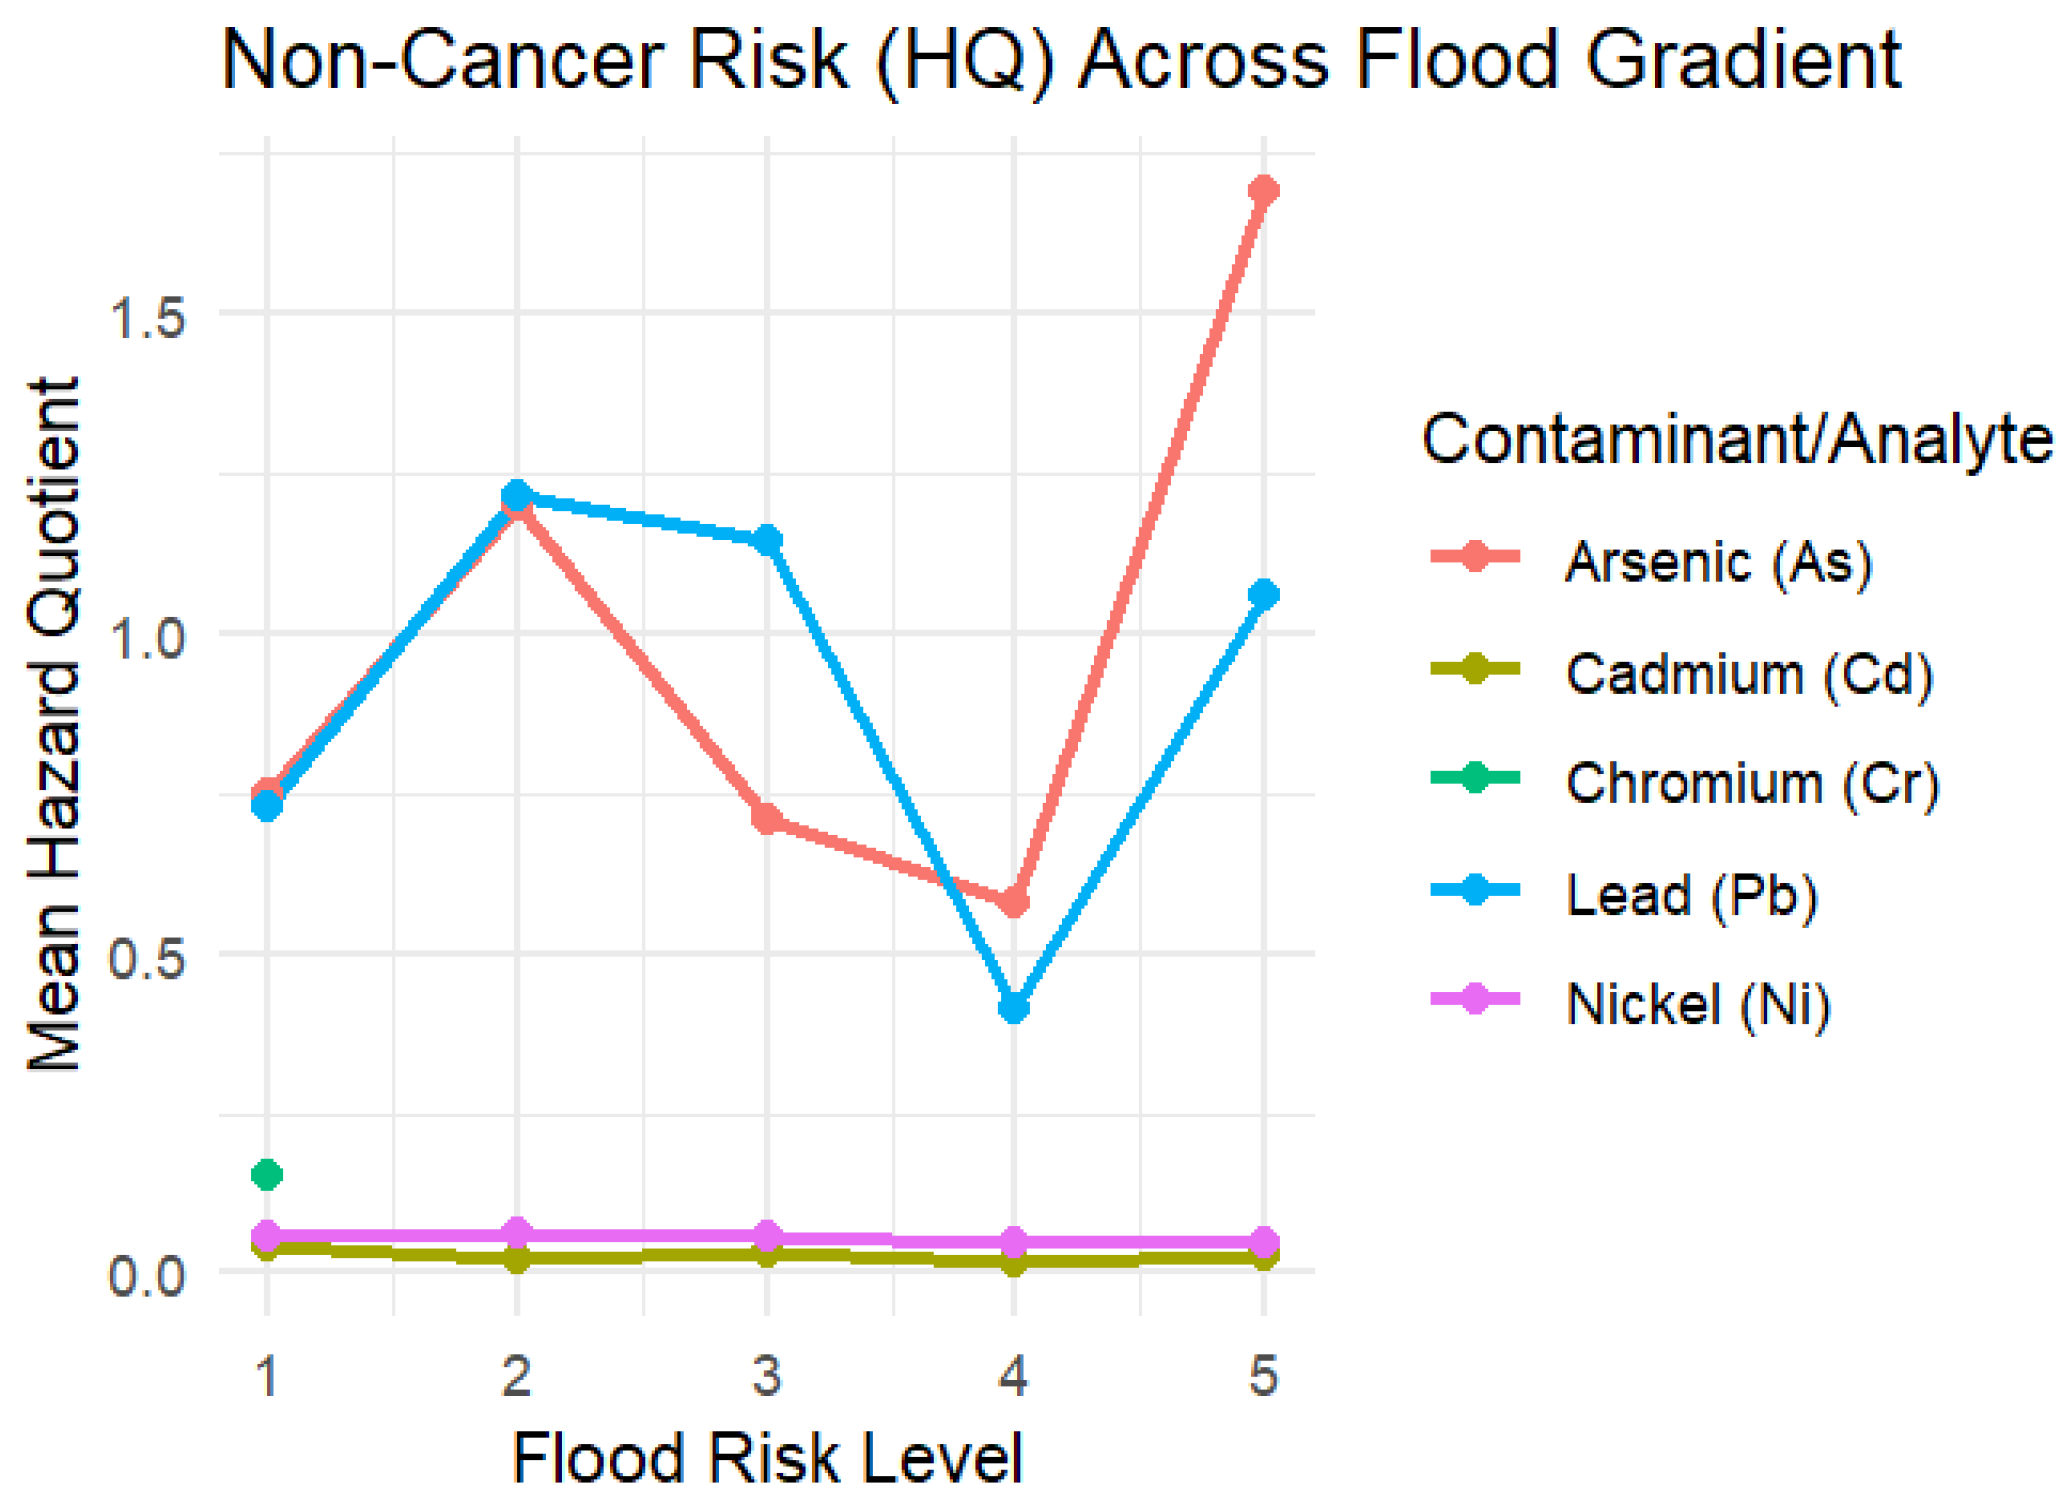
Figure 1. Mean non-carcinogenic HQs across flood-risk levels (1 = low, 5 = high).
Ijem 01 00006 g001
Figure 2. Mean lifetime excess cancer risk across flood-risk levels (1 = low, 5 = high).
Ijem 01 00006 g002
Figure 3. Site-specific mean concentrations (±SD) of heavy metals across flooding exposure levels (Sites 1–5): (A) priority risk analytes, (B) moderate-abundance analytes, (C) higher-abundance analytes, and (D) thallium.
Ijem 01 00006 g003
Table 1. Site-specific mean (±SD) concentrations (ppb) of analyzed heavy metals and metalloids across sampling sites (n = 6 per site), with EPA screening levels.
ContaminantSite 1Site 2Site 3Site 4Site 5EPA Screening Level
Arsenic (As)8.18 ± 1.5213.17 ± 4.067.78 ± 2.796.31 ± 1.3418.52 ± 15.41770
Cadmium (Cd)1.504 ± 0.5400.745 ± 0.4471.133 ± 0.4420.533 ± 0.1191.018 ± 0.508780
Chromium (Cr)20.65 ± 5.6733.62 ± 11.8117.77 ± 6.7619.78 ± 3.4823.61 ± 6.44960
Cobalt (Co)29.01 ± 7.5430.17 ± 13.1426.61 ± 11.4321.31 ± 2.3818.56 ± 5.062300
Copper (Cu)43.67 ± 11.0840.93 ± 9.8252.27 ± 16.9432.18 ± 7.4143.71 ± 8.89310,000
Iron (Fe)14,508.18 ± 7547.0330,692.86 ± 11,423.4516,103.67 ± 7126.3622,608.45 ± 3356.0520,413.33 ± 4704.775,500,000
Lead (Pb)93.00 ± 24.29155.13 ± 98.12146.51 ± 65.4252.48 ± 17.73135.31 ± 75.25400,000
Lithium (Li)15.91 ± 3.1854.45 ± 29.0015.37 ± 6.6429.04 ± 4.0222.35 ± 6.7916,000
Nickel (Ni)42.27 ± 11.7446.43 ± 17.6142.12 ± 18.0634.45 ± 4.6735.47 ± 8.67410
Phosphorus (P)1218.60 ± 530.88658.19 ± 109.721132.10 ± 450.34751.02 ± 178.81980.57 ± 309.75160
Thallium (Tl)0.254 ± 0.0490.261 ± 0.0980.235 ± 0.0900.127 ± 0.0210.569 ± 0.69178
Zinc (Zn)224.25 ± 70.16200.16 ± 56.66248.22 ± 87.66107.48 ± 30.00276.25 ± 247.612300
Note: Values represent mean ± standard deviation (n = 6 replicate soil samples per site). EPA screening levels correspond to U.S. Environmental Protection Agency Regional Screening Levels (RSLs) for residential soil exposure [25,26]. EPA screening levels are provided as human health risk benchmarks and do not represent environmental background concentrations. Target organs were identified based on established toxicological literature and EPA guidance [25,26].
Table 2. Overall mean concentrations and screening-level risk metrics for analyzed metals across all sites.
ContaminantMean Concentration (ppb)Mean HQMean Cancer RiskTarget OrganRisk Flag
Arsenic (As)10.80.9860.000444Liver, KidneyCancer risk
Cadmium (Cd)0.9860.0271.03 × 10−5Liver, KidneyAcceptable
Chromium (Cr)23.3nannannanAcceptable
Chromium (Cr)16.80.1530.00023Liver, LungsCancer risk
Cobalt (Co)25.1nannanBlood, LiverAcceptable
Copper (Cu)42.6nannanLiverAcceptable
Iron (Fe)2.09 × 10⁴nannanLiver, BoneAcceptable
Lead (Pb)1160.9122.71 × 10−5Bone, Brain, KidneyAcceptable
Lithium (Li)27.4nannanKidneyAcceptable
Nickel (Ni)40.10.0550.001Liver, KidneyCancer risk
Phosphorus (P)948nannanBlood, LiverAcceptable
Thallium (Tl)0.289nannanBrain, KidneyAcceptable
Zinc (Zn)211nannanBlood, LiverAcceptable
Note: nan indicates that no RfD or slope factor (SF) is available from the U.S. Environmental Protection Agency for the specified contaminant.
Table 3. Fold change in concentrations and derived risk metrics relative to the low-exposure reference site (Site 1).
ContaminantFold Change (Concentration)Fold Change (HQ)Fold Change (Cancer Risk)
Arsenic (As)2.262.262.26
Cadmium (Cd)0.680.680.68
Cobalt (Co)0.64nannan
Lead (Pb)1.451.451.45
Nickel (Ni)0.840.840.84
Thallium (Tl)2.24nannan
Zinc (Zn)1.23nannan
Note: nan indicates that no RfD or SF is available for the specified contaminant or exposure pathway.
Table 4. Nonparametric test results comparing low vs. high flooding exposure (Mann–Whitney U) and monotonic trends across ordered flooding levels (Jonckheere–Terpstra).
ContaminantMW p (Concentration)MW p (HQ)MW p (Cancer Risk)JT p (Concentration)JT p (HQ)JT p (Cancer Risk)
Arsenic (As)0.5440.5440.5440.7060.7450.723
Cadmium (Cd)0.0890.0890.0890.0740.0670.069
Cobalt (Co)0.023nannan0.018nannan
Lead (Pb)0.1120.1120.1120.6720.6900.674
Nickel (Ni)0.1000.1000.1000.1690.1590.186
Zinc (Zn)0.061nannan0.212nannan
Note: nan indicates that no RfD or SF is available for the specified contaminant or exposure pathway.
Disclaimer/Publisher’s Note: The statements, opinions and data contained in all publications are solely those of the individual author(s) and contributor(s) and not of MDPI and/or the editor(s). MDPI and/or the editor(s) disclaim responsibility for any injury to people or property resulting from any ideas, methods, instructions or products referred to in the content.