Article

Explainable Artificial Intelligence for Predicting Gastrointestinal Adverse Effects of GLP-1 Receptor Agonists


by
Tadesse M. Abegaz
1,*,
Gabriel Frietze
1 and
Anindya Bijoy Das
2
1
School of Pharmacy, University of Texas at El Paso, 500 W University Ave, El Paso, TX 79968, USA
2
Department of Electrical and Computer Engineering, University of Akron, 302 E Buchtel Ave, Akron, OH 44325, USA
*
Author to whom correspondence should be addressed.
AI Med. 2026, 1(3), 19; https://doi.org/10.3390/aimed1030019
Submission received: 23 May 2026 / Revised: 13 July 2026 / Accepted: 16 July 2026 / Published: 24 July 2026
(This article belongs to the Special Issue Machine Learning Applications for Risk Stratification in Healthcare)

Abstract

Gastrointestinal (GI) adverse drug reactions (ADRs) are common among glucagon-like peptide-1 receptor agonist (GLP-1 RA) users and frequently contribute to treatment discontinuation and reduced therapeutic benefit. This retrospective study aimed to develop and validate an explainable artificial intelligence (XAI) model to predict GI ADR risk among GLP-1 RA users using real-world clinical data from the NIH All of Us Research Program. Adults prescribed GLP-1 RAs were identified and classified according to the occurrence of GI ADRs following treatment initiation. Multiple supervised machine learning models, including logistic regression, random forest, extreme gradient boosting (XGBoost), support vector machine, neural network, LightGBM, and CatBoost, were evaluated using demographic, socioeconomic, clinical, medication, and laboratory variables. Model performance was assessed using area under the receiver operating characteristic curve (AUC), accuracy, precision, recall, and F1-score. A total of 8697 participants were included, of whom 59.1% experienced GI ADRs. All models demonstrated reasonable predictive performance, with AUC values ranging from 0.82 to 0.84. The XGBoost achieved discrimination of (AUC: 0.84 ± 0.01). SHapley Additive exPlanations (SHAP) identified gastroesophageal reflux disease, hemorrhoids, and elevated HbA1c as important predictors of GI ADR risk. These findings demonstrate the potential utility of explainable machine learning approaches for predicting the safety of GLP-1 RA therapy.

1. Introduction

Glucagon-like peptide-1 receptor agonists (GLP-1 RAs) are widely used for the management of type 2 diabetes mellitus and obesity due to their demonstrated benefits in glycemic control, weight reduction, and cardiovascular risk reduction [1]. However, their real-world effectiveness is frequently limited by gastrointestinal (GI) adverse drug reactions (ADRs), including nausea, vomiting, diarrhea, constipation, and abdominal discomfort [2]. It was found that use of GLP-1 RA was associated with increased risk of pancreatitis, gastroparesis, and bowel obstruction [3]. These adverse effects are reported in more than half of treated individuals and represent a major barrier to long-term treatment adherence [4]. Discontinuation rates of GLP-1 RA therapy are substantial, with nearly two-thirds of patients stopping treatment within the first year, often due to intolerable GI ADRs [4]. Early discontinuation undermines the sustained metabolic benefits of therapy and is associated with adverse clinical consequences, including weight regain and deterioration of glycemic control [5,6].
Despite the clinical importance of these adverse effects, there remains considerable inter-individual variability in susceptibility to GI ADRs, which is not well understood [7]. This problem is challenging because GI ADR risk is influenced by complex, non-linear interactions among demographic, clinical, behavioral, and treatment-related factors that are difficult to capture using traditional statistical approaches. Moreover, prior studies have largely relied on limited clinical variables or have focused on population-level associations rather than individualized risk prediction. Identifying patients at high risk of adverse effects prior to treatment initiation could support more personalized prescribing, improve adherence, and optimize clinical outcomes. Advances in artificial intelligence (AI) and machine learning (ML) offer an opportunity to address this gap by leveraging high-dimensional real-world data to develop predictive models [8]. In particular, explainable artificial intelligence (XAI) approaches enable not only accurate prediction but also interpretation of model outputs, allowing for identification of key clinical and biological drivers of ADRs [9,10].
Therefore, this study aimed to develop and validate XAI to predict the risk of gastrointestinal ADRs among GLP-1 RA users using real-world data from the NIH All of Us Research Program. In addition, we sought to identify the important factors of GI ADR risk to support personalized treatment strategies and improve medication safety. A clear understanding of the varying risk profiles of GLP-1 RAs enables clinicians to make informed treatment decisions that weigh clinical benefits against potential adverse effects [11].

2. Materials and Methods

2.1. Study Design

We conducted a retrospective observational study that integrated predictive modeling using XAI techniques to predict the risk of GI ADRs associated with GLP-1 RA therapy.

2.2. Study Population

Eligible participants included adults aged ≥18 years with documented exposure to GLP-1 RA therapy within the All of Us dataset. The study cohort consisted of individuals who developed gastrointestinal adverse drug reactions following treatment initiation. Cases were defined as participants with documented GI ADRs, including abdominal pain, nausea, vomiting, diarrhea, constipation, gastroparesis, or pancreatitis occurring after GLP-1 RA initiation. Controls were defined as GLP-1 RA users without any recorded or reported GI ADRs. Participants with evidence of GI ADRs prior to initiation of GLP-1 RA therapy were excluded to ensure temporal alignment between exposure and outcome. GLP-1 receptor agonist exposure was identified from the OMOP Drug Exposure domain using standardized drug concept identifiers mapped to RxNorm concepts. Gastrointestinal adverse drug reactions were identified from the OMOP Condition Occurrence domain using standardized clinical diagnostic concepts mapped to the OMOP Common Data Model (primarily SNOMED concepts harmonized from source ICD-9/ICD-10 coding systems). Outcome ascertainment was based on the first recorded occurrence of predefined gastrointestinal conditions after the initial documented GLP-1 receptor agonist exposure. Gastrointestinal adverse drug reactions were not restricted to a predefined follow-up period; rather, the first documented GI ADR occurring at any time after treatment initiation during the available observation period within the NIH All of Us Research Program was considered the study outcome. This approach was selected because GI ADRs associated with GLP-1 RA may occur shortly after treatment initiation or later during treatment. Because this was a retrospective observational study using routinely collected clinical data, the occurrence of GI events after treatment initiation was interpreted as a temporal association with GLP-1 RA exposure rather than definitive evidence of causality.

2.3. Data Source

Data for this study were obtained from the National Institutes of Health (NIH) All of Us Research Program, a large, longitudinal, and diverse research database designed to advance precision medicine. The dataset includes de-identified participant-level information derived from multiple sources, including electronic health records, participant surveys, physical measurements, biospecimens, and genomic sequencing. For this study, data were accessed through the Controlled Tier of the All of Us Researcher Workbench. Multiple data domains were utilized, including clinical conditions capturing ADRs, drug exposure records identifying GLP-1 RA use, demographic variables such as age, sex, race/ethnicity, socioeconomic characteristics, as well as laboratory and measurement data encompassing clinical and anthropometric variables. This comprehensive dataset enables evaluation of clinical and demographic predictors of GI ADRs and enhances the generalizability of findings across diverse populations [12,13,14].

2.4. Data Processing

All data processing and analyses were conducted within the All of Us Researcher Workbench using Python (version 3.10). Participant-level data were extracted using structured SQL queries executed in the Controlled Tier environment. Following data extraction, datasets were merged using unique participant identifiers to construct the analytic dataset. Data cleaning procedures included removal of duplicate records, and harmonization of variable formats across domains. For demographic variables, categorical recording was performed to facilitate modeling. Specifically, gender was recoded into three categories (male, female, other), race into four categories (White, Black, Asian, and other), and ethnicity into three categories (Hispanic, non-Hispanic, and other). Duplicate observations were removed by retaining the first occurrence per participant to ensure a single record per individual. Missing data were handled using a complete-case analysis.
Feature engineering was conducted to derive clinically meaningful predictors from raw data, including demographic characteristics, comorbid conditions, medication exposures, and laboratory measures. All preprocessing steps were implemented within machine learning pipelines to ensure that transformations were learned exclusively from the training data and applied to the test data, thereby preventing information leakage.

2.5. Machine Learning Model Development, Training, and Validation

Multiple supervised machine learning algorithms were developed and evaluated, including logistic regression (LR), Random Forest (RF), extreme gradient boosting (XGBoost), support vector machine (SVM), neural network (NN), LightGBM, and CatBoost. These models were selected to capture a range of analytical approaches, encompassing linear, nonlinear, and ensemble-based methods capable of modeling complex relationships and higher-order interactions among predictors.
Hyperparameters for each model were optimized using cross-validation-based tuning procedures. Specifically, grid search strategies were implemented within a stratified 10-fold cross-validation framework to identify optimal parameter combinations that maximized predictive performance [15]. For tree-based models (random forest, XGBoost, LightGBM, and CatBoost), key parameters such as the number of trees/iterations, maximum tree depth, and learning rate were varied. For support vector machine models, kernel type and regularization parameters were explored, while neural network models were tuned by adjusting architecture-related parameters including the number of hidden layers, number of neurons, and learning rate (Supplementary Table S1).
To develop and internally validate the machine learning models, we employed stratified 10-fold cross-validation, which preserves the distribution of gastrointestinal adverse drug reactions across all folds. In this approach, the analytic dataset was partitioned into ten approximately equal subsets. During each iteration, one subset served as the validation set while the remaining nine subsets were used for model training. Model performance metrics were averaged across the ten folds to provide better estimates of predictive performance, assess model stability and generalizability, and reduce the risk of overfitting. Because both the training and testing datasets originated from the same NIH All of Us Research Program cohort, this evaluation constitutes solely internal validation.

2.6. Model Performance Evaluation

Model performance was assessed using stratified 10-fold cross-validation. Performance was evaluated using multiple complementary metrics, including the area under the receiver operating characteristic curve (AUC), accuracy, precision, recall (sensitivity), and F1-score. These metrics collectively provide a comprehensive assessment of model discrimination and classification performance, capturing the balance between correctly identifying individuals with GI ADRs and minimizing false-positive predictions [16]. SHapley Additive exPlanations (SHAP) were applied to enhance interpretability of model outputs [16]. SHAP values identified the most influential clinical, demographic, and treatment-related factors associated with GI ADR risk. SHAP values were calculated from the final XGBoost model using the TreeExplainer algorithm to quantify the contribution of each predictor to the predicted probability of GI-ADRs.

2.7. Features

The machine learning models were developed using a comprehensive set of predictor variables selected based on their clinical relevance and previously reported associations with GI ADRs among GLP-1 RA users. Candidate predictors include demographic characteristics, socioeconomic factors, clinical comorbidities, medication exposures, and laboratory and anthropometric measurements. Demographic variables included age, sex, race, and ethnicity. Socioeconomic variables comprised educational attainment, annual household income, employment status, health insurance coverage, and marital status. Clinical variables included pre-existing gastrointestinal and metabolic comorbidities that may influence susceptibility to GI ADRs, including gastroesophageal reflux disease (GERD), irritable bowel syndrome (IBS), hemorrhoids, liver disease, ulcerative colitis, and Crohn’s disease. Medication-related variables captured concomitant use of drugs known to affect gastrointestinal function or interact with GLP-1 RA, including opioids, proton pump inhibitors, nonsteroidal anti-inflammatory drugs (NSAIDs), antihistamines, corticosteroids, anticholinergic agents, and antidepressants. Continuous clinical variables included glycated hemoglobin (HbA1c) as a measure of glycemic control and body mass index (BMI) as an indicator of adiposity. Categorical variables were encoded using one-hot encoding, while continuous variables were standardized prior to model training where appropriate. Binary variables (e.g., GERD, IBS, ulcerative colitis, medication use, employment, insurance, and marital status) were coded as 0 = No and 1 = Yes. Demographic variables were initially encoded according to the predefined classifications available in the NIH All of Us Research Program. All predictor variables were ascertained using information available before the occurrence of the first documented gastrointestinal adverse drug reaction. Predictors recorded after the occurrence of GI ADRs were not included in model development to minimize information leakage and reverse causation.

3. Results

3.1. Characteristics of the Study Participants

The study included 8697 participants, of whom 59.1% experienced gastrointestinal (GI) adverse drug reactions (ADRs). The majority of participants were female (61.8%), with a mean age of 56.87 ± 12.91 years. Most participants were White (54.5%) and non-Hispanic (79.7%). Regarding socioeconomic characteristics, 40.8% had a college or advanced degree, while 36.5% had lower educational attainment. A large proportion of participants (95.7%) had health insurance coverage. In terms of clinical characteristics, gastroesophageal reflux disease (GERD) was present in 48.4% of participants, followed by hemorrhoids (22.7%), liver disease (9.4%), and irritable bowel syndrome (IBS) (8.6%). Ulcerative colitis (0.9%) and Crohn’s disease (1.0%) were relatively uncommon. Medication use was widespread, including opioids (89.6%), proton pump inhibitors (58.5%), nonsteroidal anti-inflammatory drugs (NSAIDs) (51.8%), antihistamines (65.1%), steroids (46.9%), anticholinergics (37.7%), and antidepressants (63.3%). The mean BMI was 36.44 ± 9.35 kg/m2, and the mean HbA1c was 7.68 ± 2.41%. Additional details are provided in Table 1.

3.2. Performance of ML Models for Predicting Gastrointestinal Adverse Drug Reactions

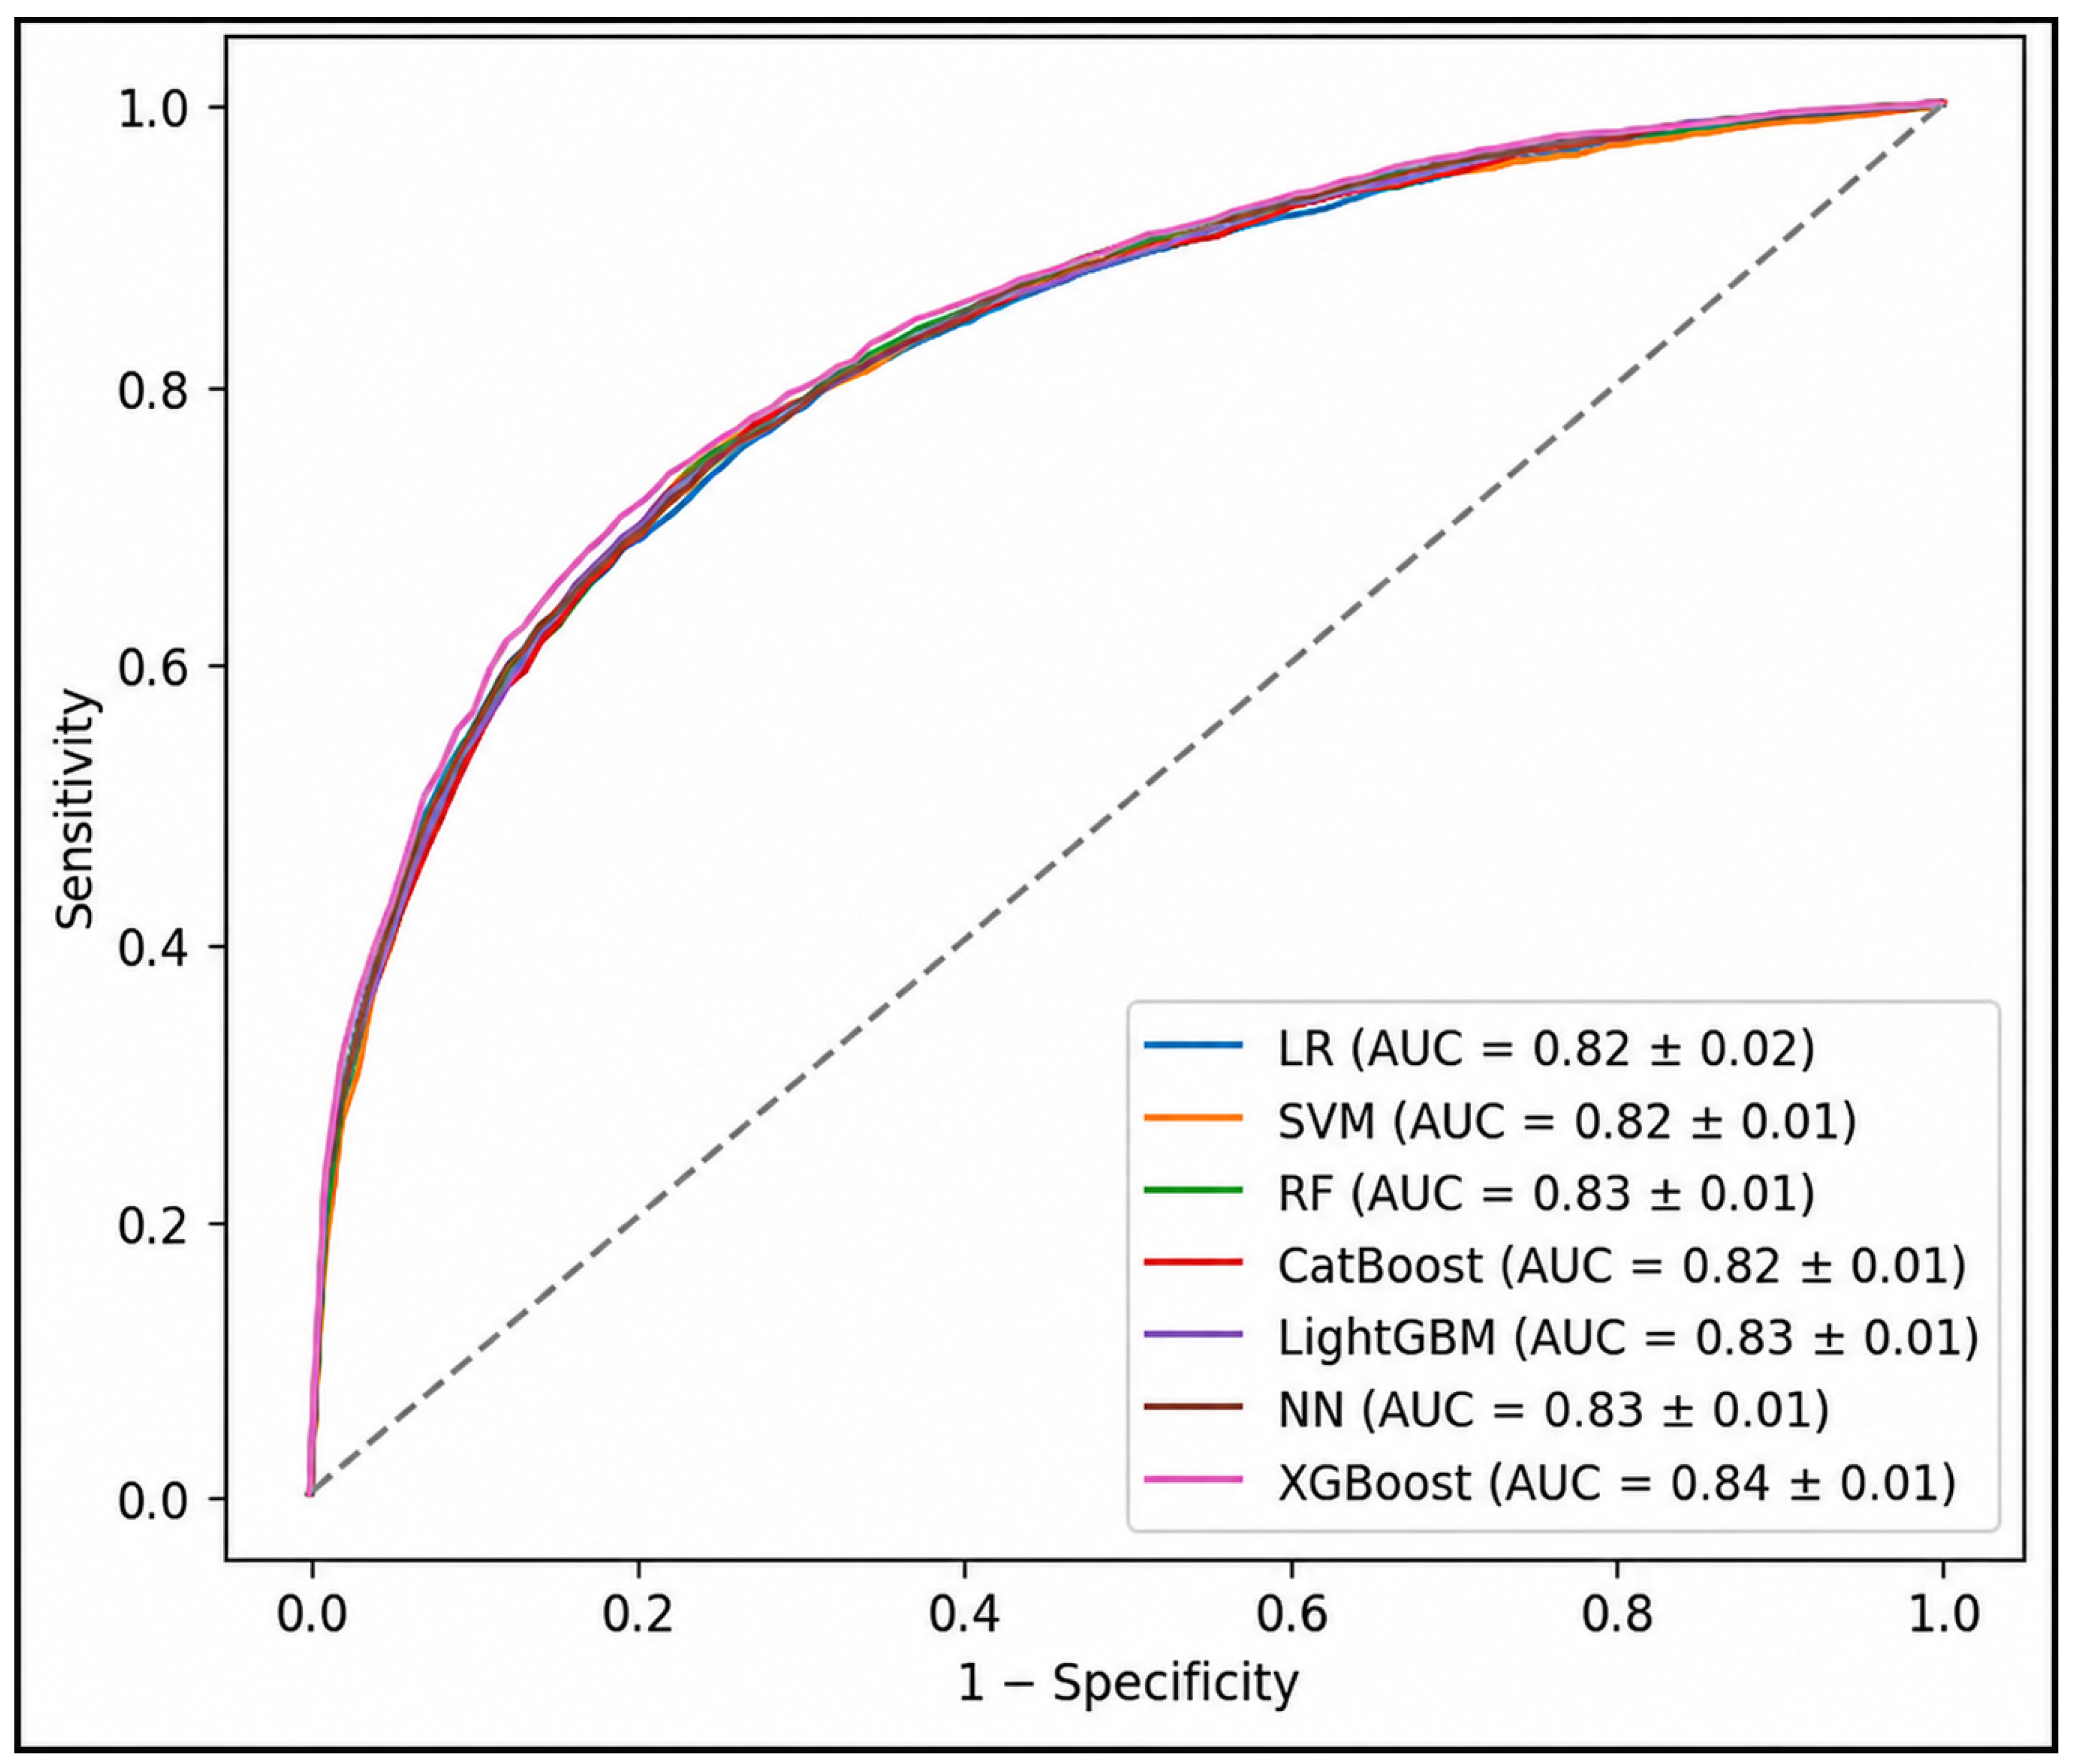
Overall, all machine learning models demonstrated consistent predictive performance, with low variability across cross-validation folds, indicating good generalizability and minimal overfitting. Across models, discriminative performance was comparable, with AUC values ranging from 0.82 to 0.84. Among the evaluated models, XGBoost achieved a slightly higher overall performance, with an AUC of 0.84 ± 0.01 and classification metrics, including an accuracy of 0.76 ± 0.01, recall of 0.80 ± 0.02, and F1-score of 0.80 ± 0.01. The RF and NN models demonstrated similar performance, each achieving an AUC of 0.83 ± 0.01 and balanced precision and recall (both approximately 0.79–0.80), indicating stable and reliable classification across ADR outcomes. The SVM model achieved the highest precision (0.83 ± 0.02) among all models, indicating better ability to minimize false-positive predictions (Table 2 & Figure 1).
The calibration analyses demonstrated good agreement between predicted and observed probabilities across all evaluated machine learning models. Among the evaluated algorithms, the XGBoost model exhibited a better calibration performance, with the Brier score (0.1636), a calibration intercept closest to zero (0.0058), and an almost ideal calibration slope (1.0003), indicating agreement between predicted and observed risks. The RF model also demonstrated good calibration (Brier score = 0.1688, calibration intercept = 0.1235, calibration slope = 1.0488). Overall, the calibration metrics indicated the reliability of the predicted probabilities generated by the proposed models (Supplementary Table S2).

3.3. Precision–Recall Curve for Prediction of Gastrointestinal ADRs of GLP-1 RA

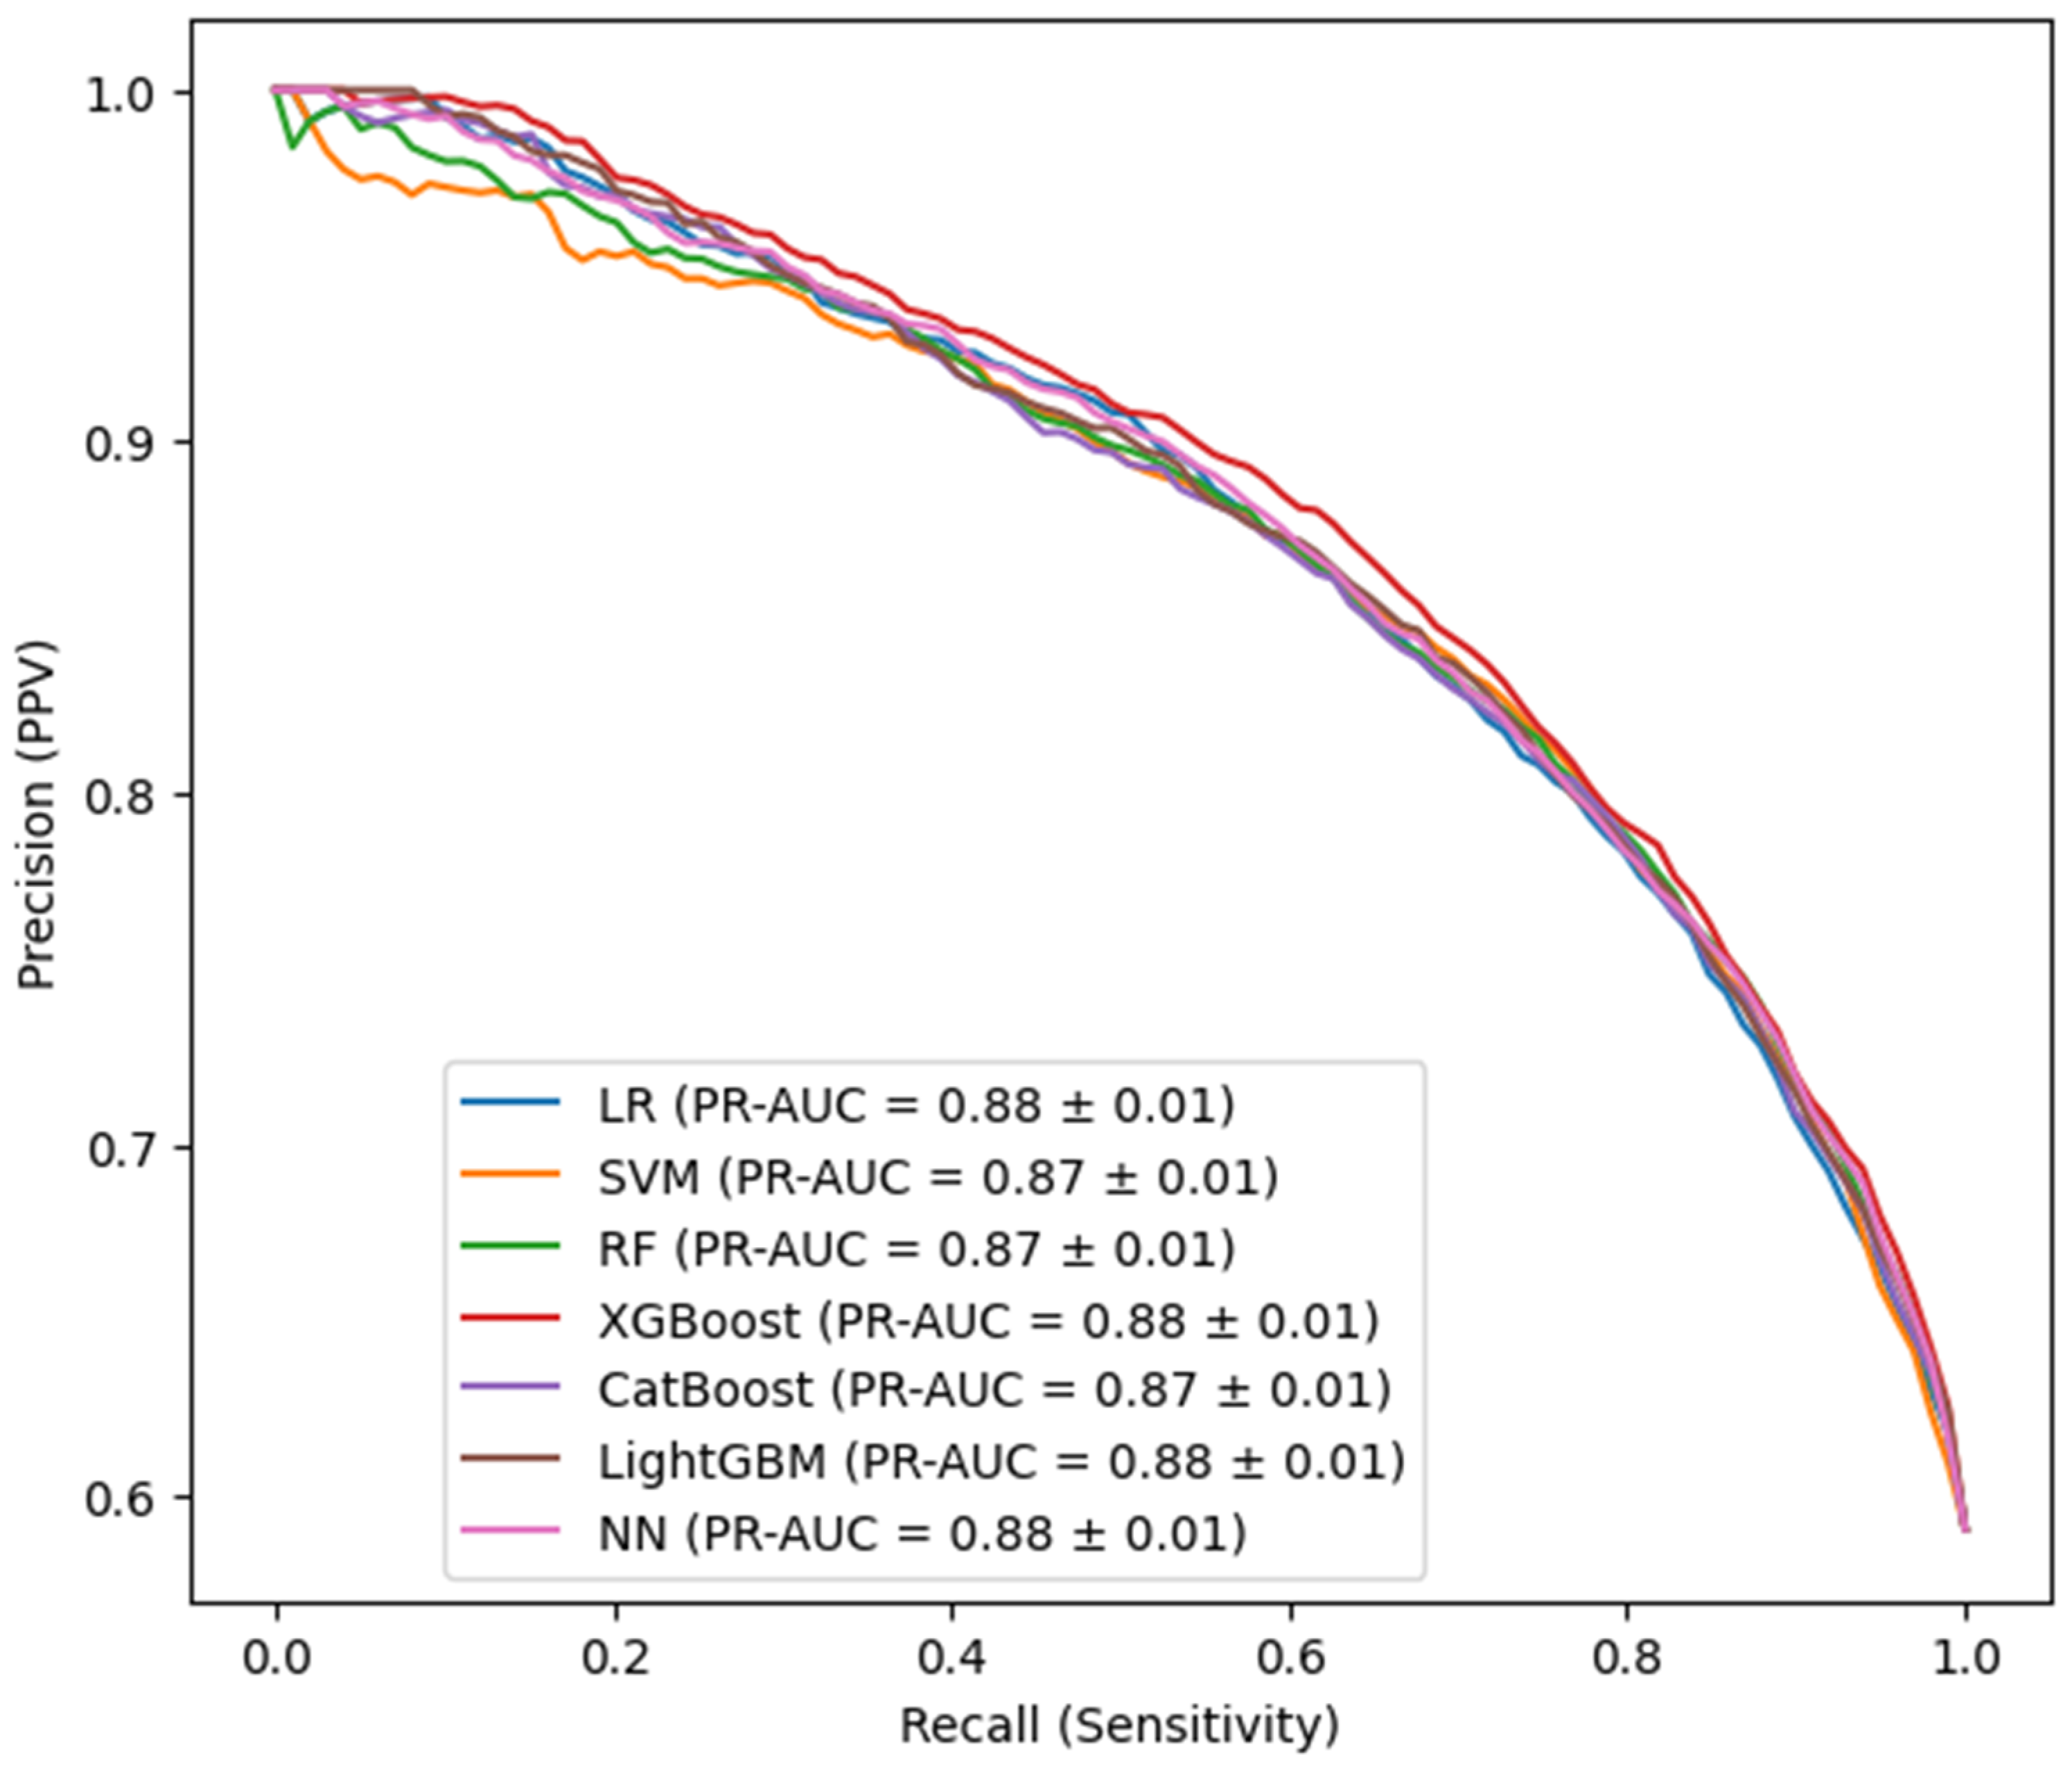
The precision–recall (PR) curve demonstrated consistent predictive performance across all machine learning models for identifying gastrointestinal ADRs following GLP-1 RA therapy (Figure 2). Overall, model performance was comparable, with PR-AUC values ranging from approximately 0.87 to 0.88 across algorithms, indicating better classification performance. Ensemble tree-based models, including XGBoost, LightGBM, and Random Forest, exhibited slightly higher and more stable precision across a wide range of recall values, suggesting improved ability to correctly identify ADR cases while minimizing false-positive predictions (Figure 2).

3.4. Explainable ML Identification of Predictors of Gastrointestinal ADRs of GLP-1 RA

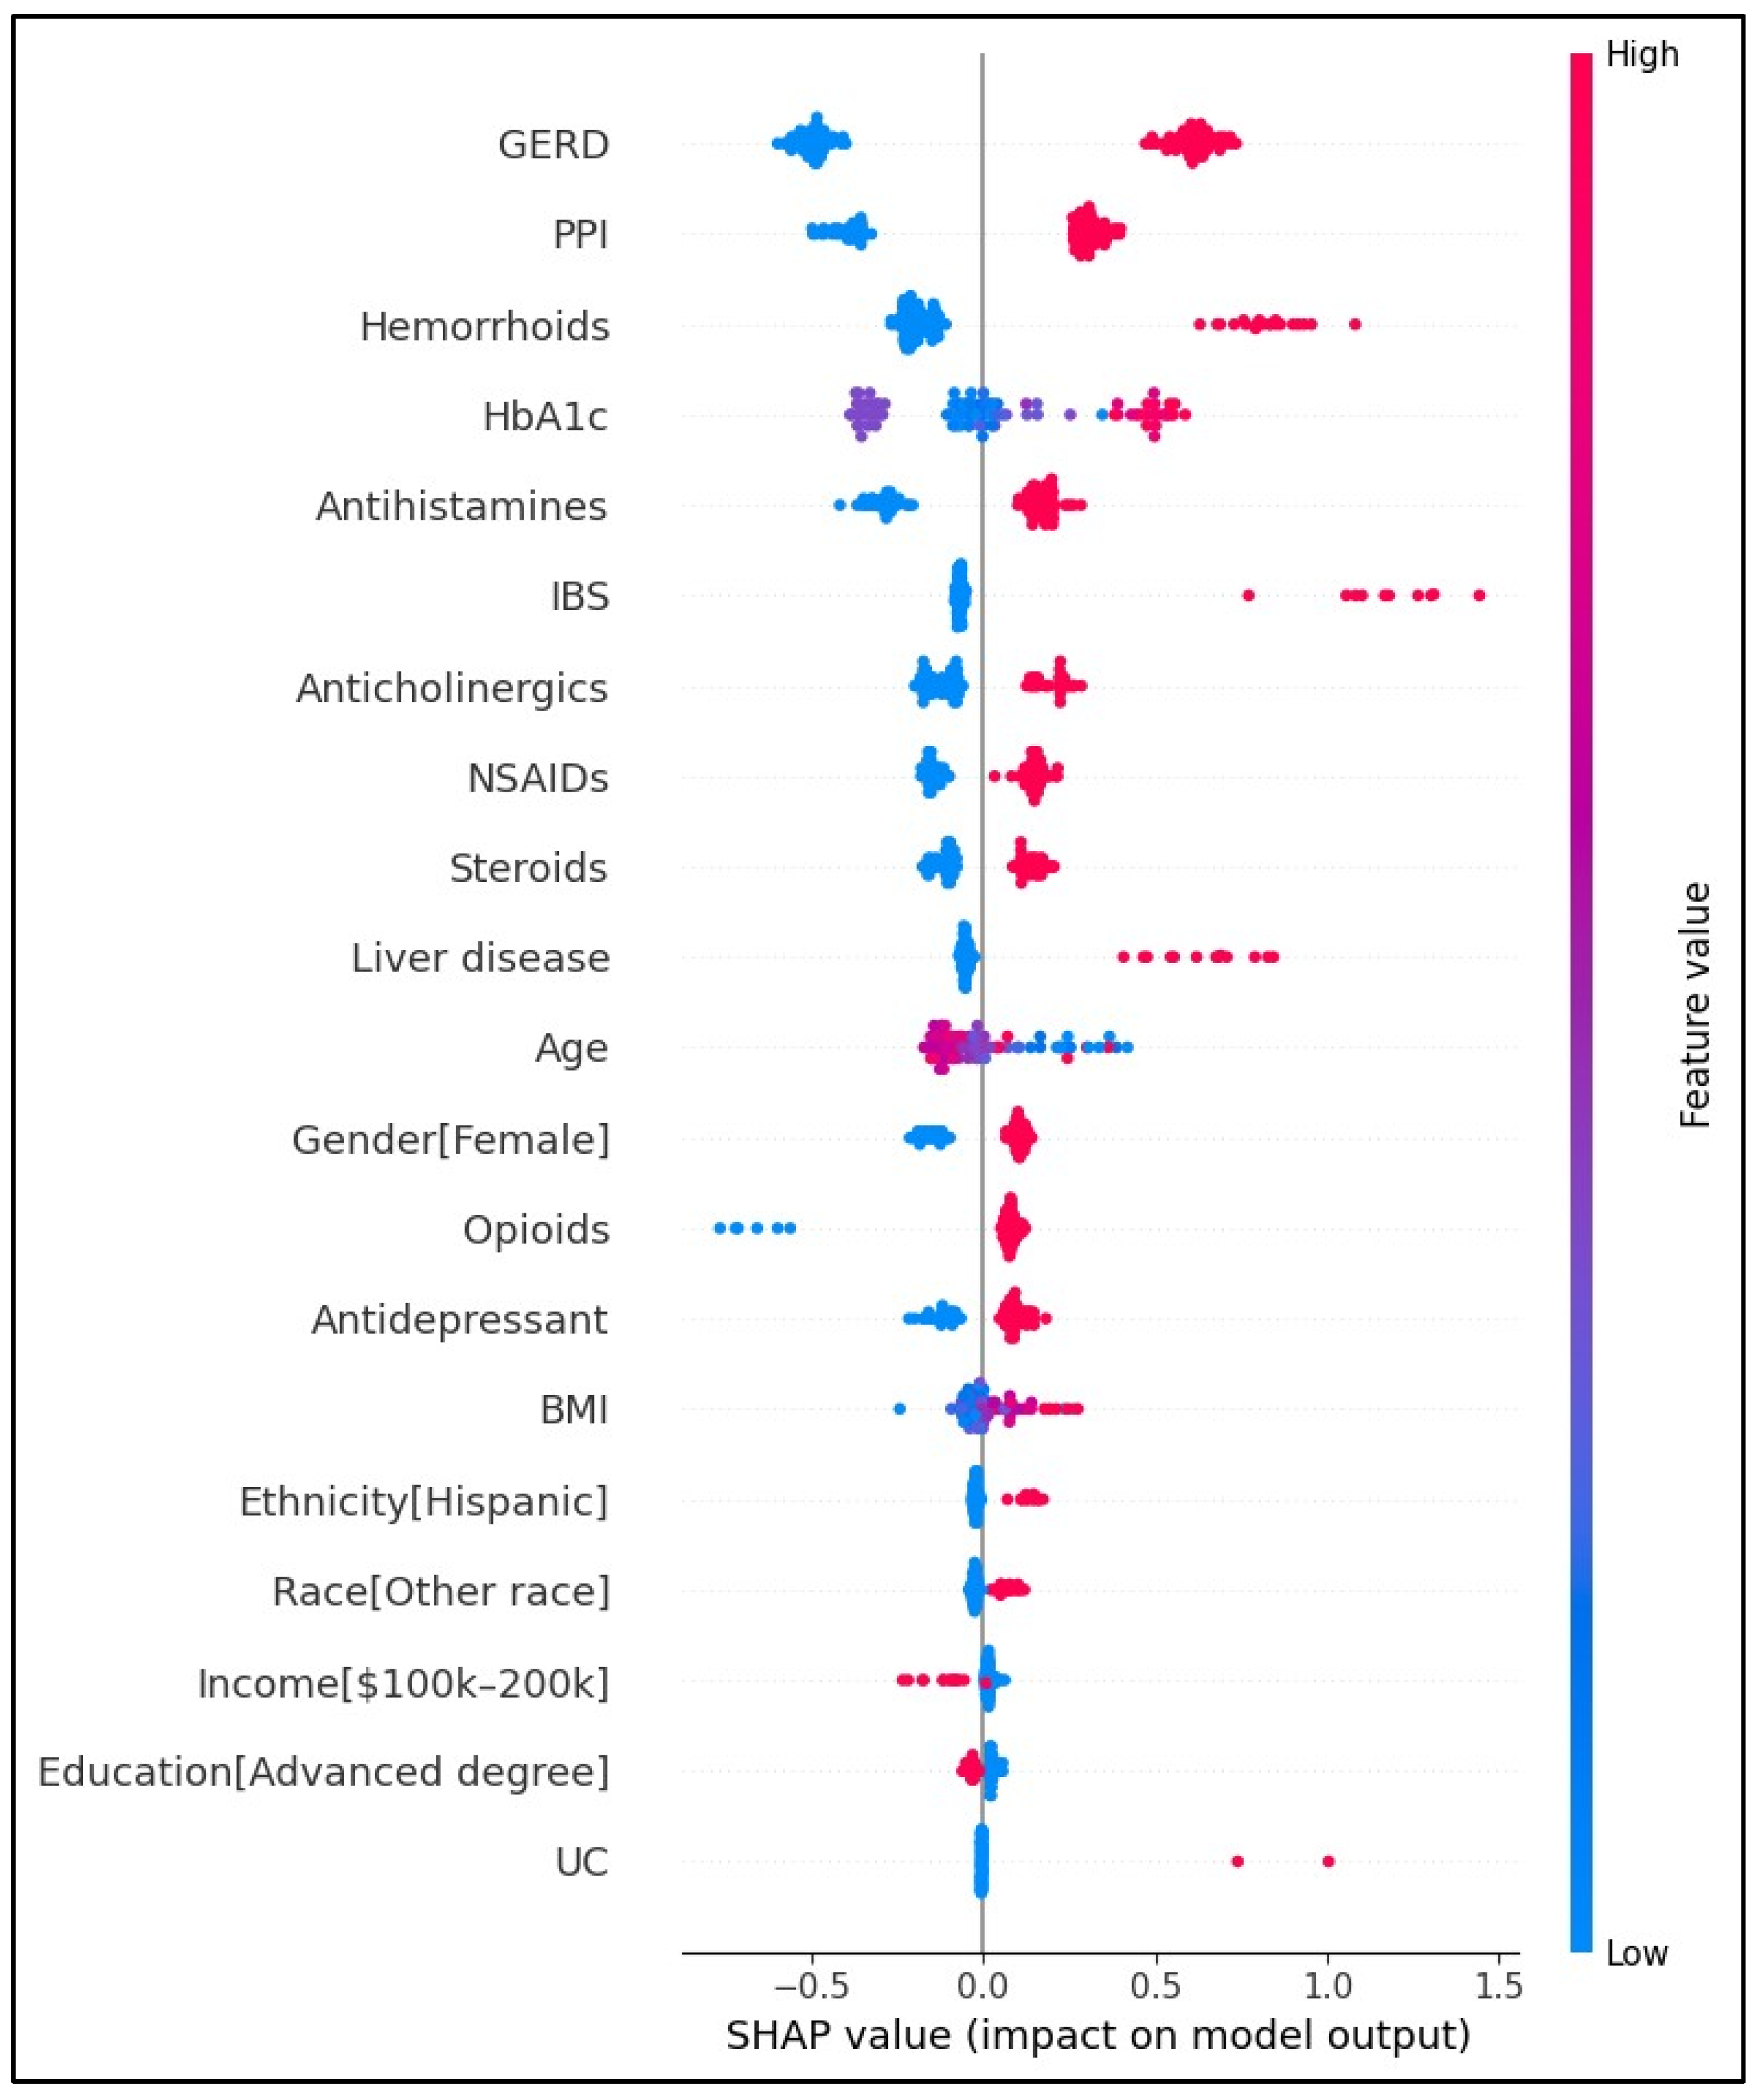
Figure 3 presents the SHAP summary plot generated from the XGBoost model, illustrating the overall importance of each predictor and its contribution to the prediction of GI-ADRs. Features are ranked from top to bottom according to their mean absolute SHAP values, with variables at the top exerting the greatest overall influence on model predictions. Each point represents an individual participant. The horizontal position of each point corresponds to its SHAP value, where positive SHAP values indicate that the feature increases the predicted probability of GI-ADRs, whereas negative SHAP values indicate that the feature decreases the predicted probability. The color of each point reflects the feature value, with red indicating higher feature values and blue indicating lower feature values.
Among all predictors, gastrointestinal-related comorbidities and concomitant medications were the most influential determinants of GI-ADR risk. The presence of GERD, hemorrhoids, IBS, liver disease, and ulcerative colitis, as well as the use of PPIs, anticholinergics, NSAIDs, steroids, opioids, antidepressants, and antihistamines, were generally associated with positive SHAP values, indicating an increased predicted probability of GI-ADRs. In contrast, lower values of several continuous variables, including age, HbA1c, and BMI, were associated with reduced predicted risk, whereas higher values tended to shift predictions toward increased risk. The broad horizontal dispersion of SHAP values for several predictors demonstrates substantial inter-individual variability in their effects, suggesting heterogeneity in susceptibility to GI-ADRs among GLP-1 receptor agonist users (Figure 3).

4. Discussion

Our study evaluated multiple supervised machine learning algorithms to predict GI-ADRs associated with GLP-1 RAs. Overall, all models demonstrated consistent predictive performance, with minimal variability across cross-validation folds. Among the evaluated models, XGBoost achieved a slightly higher discriminative performance, while the other models demonstrated comparable performance. In addition, precision–recall curve analysis indicated that ensemble tree-based models maintained higher and more stable precision across a broad range of recall values.
Our findings are consistent with prior literature demonstrating the utility of machine learning, particularly ensemble approaches, in predicting ADRs; however, challenges such as class imbalance and limited external validation remain barriers to widespread clinical implementation [17]. Given the rapidly increasing use of GLP-1 RAs for both diabetes and obesity management, concerns regarding their safety profile have become increasingly prominent. Gastrointestinal ADRs remain a leading cause of treatment discontinuation and therapeutic failure, contributing to increased healthcare utilization and costs, particularly in cases involving severe complications such as gastroparesis [18]. These risks may be further exacerbated in individuals with underlying metabolic conditions such as diabetes and obesity. In this context, the ability of machine learning models to identify individuals at high risk of GI-ADRs prior to treatment initiation represents a significant advancement in clinical care. Early risk stratification may enable clinicians to individualize treatment strategies, including dose titration, regimen modification, or selection of alternative therapies. Importantly, a subset of GLP-1 RA-induced ADRs is potentially preventable at the time of prescribing, highlighting the clinical value of predictive models in improving medication safety and adherence [19,20].
Beyond their clinical utility, machine learning approaches can facilitate earlier identification of safety signals, improve toxicity prediction, and reduce reliance on traditional, resource-intensive preclinical models during drug development [21]. In drug development pipelines, AI-driven approaches can accelerate the identification of safer drug candidates, reduce late-stage failures, and optimize cost-efficiency [22]. Furthermore, integrating drug–target interaction data with interpretable machine learning represents a promising approach for advancing predictive pharmacovigilance. By linking molecular targets to adverse clinical outcomes, such frameworks can improve prediction accuracy and provide mechanistic insights into ADR development. These insights can support safer and more efficient drug design [23].
Additionally, the SHAP analysis provided important insights into the clinical factors associated with GI-ADRs. Notably, GERD and hemorrhoids emerged as among the most influential features, consistently associated with increased SHAP values, indicating a greater likelihood of GI-ADR occurrence. This finding suggests that pre-existing gastrointestinal conditions may substantially amplify susceptibility to GLP-1 RA-induced adverse effects. The association between GERD and increased GI-ADR risk is biologically plausible and aligns with the known pharmacologic effects of GLP-1 RAs. These agents delay gastric emptying and modulate gastrointestinal motility, which may exacerbate upper gastrointestinal symptoms such as nausea, bloating, and reflux [24]. In individuals with underlying GERD, impaired esophageal clearance and lower esophageal sphincter dysfunction may further predispose patients to worsening reflux symptoms when exposed to GLP-1 RAs [25]. The SHAP results reinforce this interaction by demonstrating a consistent positive contribution of GERD to model predictions [26].
Similarly, hemorrhoids were identified as a significant feature to predict GI-ADR risk. Although hemorrhoids are not traditionally considered in pharmacovigilance studies of GLP-1 RAs, their prominence in the SHAP analysis may reflect underlying alterations in bowel habits, particularly constipation and straining, which are well-documented adverse effects of GLP-1 RA therapy [27]. Reduced gastrointestinal motility and delayed transit time may increase intrarectal pressure, thereby exacerbating hemorrhoidal symptoms [28]. The observed positive SHAP values associated with hemorrhoids suggest that these patients may be particularly vulnerable to lower gastrointestinal complications during treatment.
Importantly, these findings highlight the role of baseline gastrointestinal health in shaping individual responses to GLP-1 RA therapy. GERD and hemorrhoid gastrointestinal conditions contribute to predicting ADR risk through distinct but complementary pathways. These results underscore the importance of incorporating pre-existing gastrointestinal comorbidities into clinical decision-making and risk stratification prior to GLP-1 RA initiation. From a clinical perspective, these findings suggest that patients with GERD or hemorrhoids may benefit from closer monitoring, dose titration strategies, or adjunctive therapies to mitigate adverse effects. Further research should explore these associations using prospective designs and investigate whether targeted interventions in these high-risk groups can improve treatment adherence and outcomes.
In addition to gastrointestinal comorbidities, elevated hemoglobin A1c (HbA1c) emerged as an important predictor of GI-ADRs in the SHAP analysis, with higher HbA1c values consistently associated with increased likelihood of ADR occurrence. This finding suggests that poor glycemic control may play an important role in modulating patient susceptibility to GLP-1 RA-related gastrointestinal intolerance. The association between higher HbA1c and increased GI-ADR risk is biologically plausible and may reflect underlying diabetes-related gastrointestinal dysfunction. Chronic hyperglycemia has been linked to autonomic neuropathy, which can impair gastrointestinal motility and lead to conditions such as delayed gastric emptying (gastroparesis), altered intestinal transit, and visceral hypersensitivity [29]. In this context, the pharmacologic effects of GLP-1 RAs—particularly their known action of slowing gastric emptying—may further exacerbate pre-existing motility disturbances, resulting in a higher burden of gastrointestinal symptoms such as nausea, vomiting, and abdominal discomfort [30,31]. Moreover, higher HbA1c levels may serve as a proxy for more advanced or poorly controlled diabetes, which is often associated with greater disease severity, longer disease duration, and increased comorbidity burden. Additionally, individuals with poor glycemic control may have altered gut hormone responses and impaired neurohormonal regulation, potentially amplifying the gastrointestinal effects of GLP-1 RA therapy [32,33]. From a clinical perspective, these findings highlight the importance of considering baseline glycemic status when initiating GLP-1 RA therapy. Patients with elevated HbA1c may benefit from more gradual dose titration, closer monitoring for gastrointestinal symptoms, and proactive management strategies to improve tolerability. Furthermore, the SHAP-based interpretation underscores the value of integrating metabolic and gastrointestinal risk factors into personalized treatment approaches.

4.1. Strengths and Limitations of the Study

This study has several important strengths. First, we leveraged a large and diverse real-world dataset from the All of Us Research Program, enhancing the generalizability of our findings across heterogeneous populations. Second, we applied multiple machine learning algorithms and performed rigorous model validation using stratified 10-fold cross-validation, ensuring reliable performance estimates. Third, the incorporation of explainable artificial intelligence through SHAP analysis represents a major strength, as it enabled clinically interpretable identification of key risk factors for gastrointestinal adverse drug reactions.
Despite these strengths, several limitations should be acknowledged. First, although genomic data were available within the All of Us dataset, genetic features were not incorporated into the current analysis. Given emerging evidence that genetic variation in drug target pathways may influence both efficacy and adverse effects of GLP-1 RA, omission of these factors may limit the ability to fully capture predictive performance and explainability of the ML models [34]. Second, important treatment-related variables, including medication dose, duration of therapy, and adherence patterns, were not included in the models. These factors are clinically relevant, as temporary discontinuation and reinitiation of GLP-1 RA therapy are common in response to adverse effects and may influence ADR occurrence [19]. Third, the use of concomitant medications or supportive treatments (e.g., laxatives or antiemetics) was not fully captured, which may have modified the observed associations. Fourth, the adverse events were identified from routinely collected clinical diagnoses rather than formal pharmacovigilance adjudication. Therefore, a causal relationship between GLP-1 RA therapy and the observed gastrointestinal events cannot be definitively established. Finally, external validation in independent cohorts is still required before these models can be considered for widespread clinical implementation. Such validation will help establish their generalizability across different patient populations, healthcare systems, and clinical practice settings.

4.2. Future Directions

Future research should focus on enhancing the predictive performance and clinical utility of machine learning models for adverse drug reaction prediction. Incorporating genomic data, including pharmacogenomic variants and polygenic risk scores, may further improve risk prediction. In addition, integrating longitudinal treatment data—such as medication dose, duration, and adherence—could enable dynamic risk prediction and better reflect real-world treatment trajectories. Furthermore, combining structured clinical data with unstructured data sources, such as clinical notes and patient-reported outcomes, may enhance model performance and capture nuanced predictors of adverse events. From a translational perspective, expanding these approaches to drug development pipelines represents a promising direction. Integration of interpretable machine learning with drug–target interaction data and preclinical models may facilitate earlier identification of toxicity signals and improve the safety profile of emerging therapies. Ultimately, these efforts may contribute to the development of precision pharmacovigilance frameworks that optimize both GLP-1 RA safety and therapeutic effectiveness.

5. Conclusions

In conclusion, machine learning models demonstrated consistent performance in predicting gastrointestinal adverse drug reactions among GLP-1 RA users. Ensemble tree-based models achieved better predictive performance, while explainable AI methods identified key clinical drivers of ADR risk, including underlying gastrointestinal conditions and metabolic factors such as elevated HbA1c. The application of explainable machine learning provides a powerful framework for both prediction and interpretation, supporting improved clinical decision-making, enhanced medication safety, and more targeted pharmacovigilance.

Supplementary Materials

The following supporting information can be downloaded at: https://www.mdpi.com/article/10.3390/aimed1030019/s1, Table S1: Hyperparameter values used for each machine learning model; Table S2: Overall model calibration comparison.

Author Contributions

Conceptualization, T.M.A.; methodology, T.M.A.; software, T.M.A.; validation, T.M.A., A.B.D. and G.F.; formal analysis, T.M.A.; investigation, T.M.A.; resources, T.M.A.; data curation, T.M.A.; writing—original draft preparation, T.M.A.; writing—review and editing, T.M.A., A.B.D. and G.F.; visualization, T.M.A.; supervision, A.B.D. and G.F.; project administration, T.M.A.; funding acquisition, T.M.A. All authors have read and agreed to the published version of the manuscript.

Funding

The research reported in this poster/abstract was supported by AIM-AHEAD Coordinating Center at the University of North Texas Health Science Center at Fort Worth. This research was, in part, funded by the National Institutes of Health (NIH) Agreement No. 1OT2OD032581. The views and conclusions contained in this document are those of the authors and should not be interpreted as representing the official policies, either expressed or implied, of the NIH.

Institutional Review Board Statement

This study was approved by the Institutional Review Board (IRB) of The University of Texas at El Paso (IRBNet ID: 2376417-1) on 13 October 2025.

Informed Consent Statement

The analysis was conducted using de-identified data from the All of Us Research Program, and all participants provided informed consent at the time of enrollment in the program. The requirement for additional informed consent for this study was waived due to the use of de-identified data. All methods were carried out in accordance with relevant guidelines and regulations.

Data Availability Statement

The original contributions presented in the study are included in article and the Supplementary Materials. Further inquiries can be directed to the corresponding author.

Acknowledgments

The authors would like to thank the University of Texas EL Paso for overall support. We also extend our gratitude to the All of Us Research Program for providing access to the data used in this study. “The All of Us Research Program is supported by the National Institutes of Health, Office of the Director: Regional Medical Centers: 1 OT2 OD026549; 1 OT2 OD026554; 1 OT2 OD026557; 1 OT2 OD026556; 1 OT2 OD026550; 1 OT2 OD 026552; 1 OT2 OD026553; 1 OT2 OD026548; 1 OT2 OD026551; 1 OT2 OD026555; IAA #: AOD 16037; Federally Qualified Health Centers: HHSN 263201600085U; Data and Research Center: 5 U2C OD023196; Biobank: 1 U24 OD023121; The Participant Center: U24 OD023176; Participant Technology Systems Center: 1 U24 OD023163; Communications and Engagement: 3 OT2 OD023205; 3 OT2 OD023206; and Community Partners: 1 OT2 OD025277; 3 OT2 OD025315; 1 OT2 OD025337; 1 OT2 OD025276. In addition, the All of Us Research Program would not be possible without the partnership of its participants.” This study was supported by the AIM-AHEAD Coordinating Center at the University of North Texas Health Science Center at Fort Worth and the authors acknowledge AIM-AHEAD’s support of this research project.

Conflicts of Interest

The authors declare no conflicts of interest. The funders had no role in the design of the study; in the collection, analyses, or interpretation of data; in the writing of the manuscript; or in the decision to publish the results.

Abbreviations

The following abbreviations are used in this manuscript:
ADRAdverse Drug Reaction
AIArtificial Intelligence
AUCArea Under the Receiver Operating Characteristic Curve
BMIBody Mass Index
CatBoostCategorical Boosting
CDCrohn’s Disease
F1-scoreHarmonic Mean of Precision and Recall
GERDGastroesophageal Reflux Disease
GIGastrointestinal
GLP-1 RAGlucagon-Like Peptide-1 Receptor Agonist
HbA1cHemoglobin A1c
IBSIrritable Bowel Syndrome
LRLogistic Regression
MLMachine Learning
NNNeural Network
NSAIDsNonsteroidal Anti-Inflammatory Drugs
PPIProton Pump Inhibitor
PRPrecision–Recall
RFRandom Forest
SHAPSHapley Additive exPlanations
SVMSupport Vector Machine
UCUlcerative Colitis
XAIExplainable Artificial Intelligence
XGBoostExtreme Gradient Boosting

References

  1. Collins, L.; Costello, R.A. Glucagon-like peptide-1 receptor agonists. In StatPearls [Internet]; StatPearls Publishing: St. Petersburg, FL, USA, 2024. [Google Scholar]
  2. Chiang, C.-H.; Jaroenlapnopparat, A.; Colak, S.C.; Yu, C.-C.; Xanthavanij, N.; Wang, T.-H.; See, X.Y.; Lo, S.-W.; Ko, A.; Chang, Y.-C. Glucagon-like peptide-1 receptor agonists and gastrointestinal adverse events: A systematic review and meta-analysis. Gastroenterology 2025, 169, 1268–1281. [Google Scholar] [CrossRef] [PubMed]
  3. Sodhi, M.; Rezaeianzadeh, R.; Kezouh, A.; Etminan, M. Risk of gastrointestinal adverse events associated with glucagon-like peptide-1 receptor agonists for weight loss. JAMA 2023, 330, 1795–1797. [Google Scholar] [CrossRef] [PubMed]
  4. Rodriguez, P.J.; Zhang, V.; Gratzl, S.; Do, D.; Goodwin Cartwright, B.; Baker, C.; Gluckman, T.J.; Stucky, N.; Emanuel, E.J. Discontinuation and reinitiation of dual-labeled GLP-1 receptor agonists among US adults with overweight or obesity. JAMA Netw. Open 2025, 8, e2457349. [Google Scholar] [CrossRef] [PubMed]
  5. Tzang, C.-C.; Wu, P.-H.; Luo, C.-A.; Chen, Z.-T.; Lee, Y.-T.; Huang, E.S.; Kang, Y.-F.; Lin, W.-C.; Tzang, B.-S.; Hsu, T.-C. Metabolic rebound after GLP-1 receptor agonist discontinuation: A systematic review and meta-analysis. eClinicalMedicine 2025, 90, 103680. [Google Scholar] [CrossRef] [PubMed]
  6. West, S.; Scragg, J.; Aveyard, P.; Oke, J.L.; Willis, L.; Haffner, S.J.; Knight, H.; Wang, D.; Morrow, S.; Heath, L. Weight regain after cessation of medication for weight management: Systematic review and meta-analysis. BMJ 2026, 392, e085304. [Google Scholar] [CrossRef] [PubMed]
  7. Xie, X.; Yang, S.; Deng, S.; Liu, Y.; Xu, Z.; He, B. Comparative gastrointestinal adverse effects of GLP-1 receptor agonists and multi-target analogs in type 2 diabetes: A Bayesian network meta-analysis. Front. Pharmacol. 2025, 16, 1613610. [Google Scholar] [CrossRef] [PubMed]
  8. Johnson, K.B.; Wei, W.Q.; Weeraratne, D.; Frisse, M.E.; Misulis, K.; Rhee, K.; Zhao, J.; Snowdon, J.L. Precision medicine, AI, and the future of personalized health care. Clin. Transl. Sci. 2021, 14, 86–93. [Google Scholar] [PubMed]
  9. Alkhanbouli, R.; Matar Abdulla Almadhaani, H.; Alhosani, F.; Simsekler, M.C.E. The role of explainable artificial intelligence in disease prediction: A systematic literature review and future research directions. BMC Med. Inform. Decis. Mak. 2025, 25, 110. [Google Scholar] [CrossRef] [PubMed]
  10. Sakib, S.K.; Das, A.B. Explainable vertical federated learning for healthcare: Ensuring privacy and optimal accuracy. In Proceedings of the 2024 IEEE International Conference on Big Data (BigData); IEEE: New York, NY, USA, 2024; pp. 5068–5077. [Google Scholar]
  11. Ismaiel, A.; Scarlata, G.G.M.; Boitos, I.; Leucuta, D.-C.; Popa, S.-L.; Al Srouji, N.; Abenavoli, L.; Dumitrascu, D.L. Gastrointestinal adverse events associated with GLP-1 RA in non-diabetic patients with overweight or obesity: A systematic review and network meta-analysis: Clinical Research. Int. J. Obes. 2025, 49, 1946–1957. [Google Scholar] [CrossRef]
  12. The All of Us Research Program Genomics Investigators. Genomic data in the all of us research program. Nature 2024, 627, 340–346. [Google Scholar] [CrossRef] [PubMed]
  13. Ramirez, A.H.; Sulieman, L.; Schlueter, D.J.; Halvorson, A.; Qian, J.; Ratsimbazafy, F.; Loperena, R.; Mayo, K.; Basford, M.; Deflaux, N. The All of Us Research Program: Data quality, utility, and diversity. Patterns 2022, 3, 100570. [Google Scholar] [CrossRef] [PubMed]
  14. The All of Us Research Program Investigators. The “All of Us” research program. N. Engl. J. Med. 2019, 381, 668–676. [Google Scholar] [CrossRef] [PubMed]
  15. Wu, J.; Chen, X.-Y.; Zhang, H.; Xiong, L.-D.; Lei, H.; Deng, S.-H. Hyperparameter optimization for machine learning models based on Bayesian optimization. J. Electron. Sci. Technol. 2019, 17, 26–40. [Google Scholar]
  16. Lundberg, S.M.; Lee, S.-I. A unified approach to interpreting model predictions. Adv. Neural Inf. Process. Syst. 2017, 30. [Google Scholar]
  17. Chalabianloo, N.; Ahmadi, F.; Omrani, M.A.; Abdullah, S.S.; Rostamzadeh, N.; Jafari, A.; Izzedin, L.; Sedig, K.; Muanda, F.T. Machine learning methods for predicting adverse drug events: A systematic review. Br. J. Clin. Pharmacol. 2026, 92, 422–444. [Google Scholar] [PubMed]
  18. Singhal, R.; Sachdeva, D.; Wortman, K., II; Lall, R. Unmasking semaglutide-induced gastroparesis: The dangers of rapid dose escalation in a diabetic patient. Cureus 2025, 17, e91679. [Google Scholar] [CrossRef] [PubMed]
  19. Gorgojo-Martínez, J.J.; Mezquita-Raya, P.; Carretero-Gómez, J.; Castro, A.; Cebrián-Cuenca, A.; de Torres-Sánchez, A.; García-de-Lucas, M.D.; Núñez, J.; Obaya, J.C.; Soler, M.J. Clinical recommendations to manage gastrointestinal adverse events in patients treated with Glp-1 receptor agonists: A multidisciplinary expert consensus. J. Clin. Med. 2022, 12, 145. [Google Scholar] [CrossRef] [PubMed]
  20. Wolff, P.; Ríos, S.A.; Gonzáles, C. Machine learning methods for predicting adverse drug reactions in hospitalized patients. Procedia Comput. Sci. 2023, 225, 22–31. [Google Scholar] [CrossRef]
  21. Toni, E.; Ayatollahi, H.; Abbaszadeh, R.; Fotuhi Siahpirani, A. Machine learning techniques for predicting drug-related side effects: A scoping review. Pharmaceuticals 2024, 17, 795. [Google Scholar] [CrossRef] [PubMed]
  22. Ajisafe, O.M.; Adekunle, Y.A.; Egbon, E.; Ogbonna, C.E.; Olawade, D.B. The role of machine learning in predictive toxicology: A review of current trends and future perspectives. Life Sci. 2025, 378, 123821. [Google Scholar] [CrossRef] [PubMed]
  23. Roberts-Nuttall, J.; Jones, A.M.; Castellani, M.; Pham, D. An interpretable machine learning framework for adverse drug reaction prediction from drug-target interactions. PLoS ONE 2026, 21, e0340900. [Google Scholar] [CrossRef] [PubMed]
  24. Noh, Y.; Yin, H.; Yu, O.H.; Bitton, A.; Azoulay, L. Glucagon-like peptide-1 receptor agonists and risk for gastroesophageal reflux disease in patients with type 2 diabetes: A population-based cohort study. Ann. Intern. Med. 2025, 178, 1268–1278. [Google Scholar] [CrossRef] [PubMed]
  25. Liu, B.D.; Udemba, S.C.; Liang, K.; Tarabichi, Y.; Hill, H.; Fass, R.; Song, G. Shorter-acting glucagon-like peptide-1 receptor agonists are associated with increased development of gastro-oesophageal reflux disease and its complications in patients with type 2 diabetes mellitus: A population-level retrospective matched cohort study. Gut 2024, 73, 246–254. [Google Scholar] [PubMed]
  26. Noguchi, Y.; Katsuno, H.; Ueno, A.; Otsubo, M.; Yoshida, A.; Kanematsu, Y.; Sugita, I.; Esaki, H.; Tachi, T.; Tsuchiya, T. Signals of gastroesophageal reflux disease caused by incretin-based drugs: A disproportionality analysis using the Japanese adverse drug event report database. J. Pharm. Health Care Sci. 2018, 4, 15. [Google Scholar] [CrossRef] [PubMed]
  27. Aldhaleei, W.A.; Abegaz, T.M.; Bhagavathula, A.S. Glucagon-like peptide-1 receptor agonists associated gastrointestinal adverse events: A cross-sectional analysis of the national institutes of health all of us cohort. Pharmaceuticals 2024, 17, 199. [Google Scholar] [CrossRef] [PubMed]
  28. Andrews, C.N.; Storr, M. The pathophysiology of chronic constipation. Can. J. Gastroenterol. Hepatol. 2011, 25, 16B–21B. [Google Scholar] [CrossRef]
  29. Abdalla, M.M.I. Enteric neuropathy in diabetes: Implications for gastrointestinal function. World J. Gastroenterol. 2024, 30, 2852. [Google Scholar] [CrossRef] [PubMed]
  30. Jalleh, R.J.; Plummer, M.P.; Marathe, C.S.; Umapathysivam, M.M.; Quast, D.R.; Rayner, C.K.; Jones, K.L.; Wu, T.; Horowitz, M.; Nauck, M.A. Clinical consequences of delayed gastric emptying with GLP-1 receptor agonists and tirzepatide. J. Clin. Endocrinol. Metab. 2025, 110, 1–15. [Google Scholar] [CrossRef]
  31. Shankar, A.; Sharma, A.; Vinas, A.; Chilton, R.J. GLP-1 receptor agonists and delayed gastric emptying: Implications for invasive cardiac interventions and surgery. Cardiovasc. Endocrinol. Metab. 2025, 14, e00321. [Google Scholar] [PubMed]
  32. Holliday, A.; Horner, K.; Johnson, K.O.; Dagbasi, A.; Crabtree, D.R. Appetite-related gut hormone responses to feeding across the life course. J. Endocr. Soc. 2025, 9, bvae223. [Google Scholar] [CrossRef] [PubMed]
  33. Richards, P.; Thornberry, N.A.; Pinto, S. The gut–brain axis: Identifying new therapeutic approaches for type 2 diabetes, obesity, and related disorders. Mol. Metab. 2021, 46, 101175. [Google Scholar] [CrossRef] [PubMed]
  34. Su, Q.J.; Ashenhurst, J.R.; Xu, W.; Tran, V.; Ryanne Wu, R.; Weldon, C.H.; Shi, J.; Hicks, B.; Abul-Husn, N.S.; Aslibekyan, S. Genetic predictors of GLP1 receptor agonist weight loss and side effects. Nature 2026, 653, 770–775. [Google Scholar] [CrossRef] [PubMed]
Figure 1. Receiver Operating Characteristic Curves for Predicting ADRs of GLP-1 RA. Receiver operating characteristic curves illustrating the predictive performance of multiple machine learning models for identifying gastrointestinal ADRs among GLP-1 RA users. The x-axis represents the false positive rate (1 − specificity), and the y-axis represents the true positive rate (sensitivity). Model performance was evaluated using stratified 10-fold cross-validation.
Aimed 01 00019 g001
Figure 2. Precision–Recall Curves for Predicting Gastrointestinal ADRs of GLP-1 RA. Precision–recall (PR) curves illustrating the predictive performance of multiple machine learning models for identifying gastrointestinal ADRs among GLP-1 RA users. The x-axis represents recall (sensitivity), and the y-axis represents precision (positive predictive value). Model performance was evaluated using stratified 10-fold cross-validation, and the curves represent the mean performance across folds.
Aimed 01 00019 g002
Figure 3. SHAP Plot of Important Features for the Prediction of Gastrointestinal ADRs Following GLP-1 RA Therapy. Abbreviations: BMI, body mass index; GERD, gastroesophageal reflux disease; HbA1c, hemoglobin A1c; IBS, irritable bowel syndrome; NSAIDs, nonsteroidal anti-inflammatory drugs; PPI, proton pump inhibitor; UC, ulcerative colitis. SHAP summary illustrates the global importance and direction of association of predictors in the machine learning model for GI-ADRs among GLP-1 RA users. The displayed categories represent the encoded category relative to the reference category. The reference categories were Male for gender, White for race, non-Hispanic for ethnicity, no high school diploma for education, and <$25,000 for household income. Positive SHAP values indicate an increased predicted probability of the outcome, whereas negative SHAP values indicate a decreased predicted probability.
Aimed 01 00019 g003
Table 1. Demographics and Clinical Characteristics of the Study Participants.
VariableNo ADR (n = 3558)ADR (n = 5139)Total (N = 8697)ADR (%)
Age (years)56.16 ± 12.9857.36 ± 12.8356.87 ± 12.91
Gender
Female2000 (23.0%)3376 (38.8%)5376 (61.8%)62.8
Male1498 (17.2%)1679 (19.3%)3177 (36.5%)52.8
Other60 (0.7%)84 (1.0%)144 (1.7%)58.3
Race
White2008 (23.1%)2730 (31.4%)4738 (54.5%)57.6
Black668 (7.7%)1036 (11.9%)1704 (19.6%)60.8
Asian88 (1.0%)71 (0.8%)159 (1.8%)44.7
Other794 (9.1%)1302 (15.0%)2096 (24.1%)62.1
Ethnicity
Non-Hispanic2903 (33.4%)4028 (46.3%)6931 (79.7%)58.1
Hispanic568 (6.5%)940 (10.8%)1508 (17.3%)62.3
Other87 (1.0%)171 (2.0%)258 (3.0%)66.3
Education
College and above1664 (19.1%)1881 (21.6%)3545 (40.8%)53.1
High school693 (8.0%)1283 (14.7%)1976 (22.7%)64.9
No high school1201 (13.8%)1975 (22.7%)3176 (36.5%)62.2
Employment (Employed)1531 (17.6%)1684 (19.4%)3215 (37.0%)52.4
Income
<25 k773 (8.9%)1473 (16.9%)2246 (25.8%)65.6
25–50 k566 (6.5%)878 (10.1%)1444 (16.6%)60.8
50–100 k780 (9.0%)1015 (11.7%)1795 (20.6%)56.5
100–200 k667 (7.7%)633 (7.3%)1300 (14.9%)48.7
>200 k772 (8.9%)1140 (13.1%)1912 (22.0%)59.6
Insured3393 (39.0%)4926 (56.6%)8319 (95.7%)59.2
Married1706 (19.6%)2222 (25.6%)3928 (45.2%)56.6
Clinical Conditions
GERD822 (9.5%)3385 (38.9%)4207 (48.4%)80.5
IBS56 (0.6%)689 (7.9%)745 (8.6%)92.5
Hemorrhoids353 (4.1%)1623 (18.7%)1976 (22.7%)82.1
Liver disease132 (1.5%)686 (7.9%)818 (9.4%)83.9
UC7 (0.1%)74 (0.9%)81 (0.9%)91.4
CD10 (0.1%)79 (0.9%)89 (1.0%)88.8
Medications
Opioid2827 (32.5%)4962 (57.1%)7789 (89.6%)63.7
Anticholinergics783 (9.0%)2493 (28.7%)3276 (37.7%)76.1
PPI1252 (14.4%)3834 (44.1%)5086 (58.5%)75.4
NSAIDs1336 (15.4%)3172 (36.5%)4508 (51.8%)70.4
Antihistamines1690 (19.4%)3973 (45.7%)5663 (65.1%)70.2
Steroid1134 (13.0%)2947 (33.9%)4081 (46.9%)72.2
Antidepressant1777 (20.4%)3727 (42.9%)5504 (63.3%)67.7
HbA1c (%)7.44 ± 2.117.85 ± 2.597.68 ± 2.41
BMI (kg/m2)35.87 ± 8.1736.84 ± 10.0736.44 ± 9.35
Note: Percentages are calculated based on the total study population. ADR (%) was calculated as the number of participants with gastrointestinal adverse drug reactions divided by the total number of participants within each category. Abbreviations: ADR, adverse drug reaction; BMI, body mass index; CD, Crohn’s disease; GERD, gastroesophageal reflux disease; HbA1c, hemoglobin A1c; IBS, irritable bowel syndrome; NSAIDs, nonsteroidal anti-inflammatory drugs; PPI, proton pump inhibitor; UC, ulcerative colitis.
Table 2. Performance of different ML Models Using 10-Fold Cross-Validation (Mean ± SD).
ModelAUCAccuracyPrecisionRecallF1-Score
LR0.82 ± 0.010.74 ± 0.010.81 ± 0.010.74 ± 0.010.77 ± 0.01
RF0.83 ± 0.010.75 ± 0.010.79 ± 0.010.79 ± 0.020.79 ± 0.01
XGBoost0.84 ± 0.010.76 ± 0.010.79 ± 0.010.80 ± 0.020.80 ± 0.01
SVM0.82 ± 0.010.75 ± 0.010.83 ± 0.020.73 ± 0.020.77 ± 0.01
NN0.83 ± 0.010.75 ± 0.010.79 ± 0.010.80 ± 0.010.79 ± 0.01
LightGBM0.83 ± 0.010.75 ± 0.010.82 ± 0.020.74 ± 0.020.78 ± 0.01
CatBoost0.82 ± 0.010.75 ± 0.010.81 ± 0.010.74 ± 0.020.78 ± 0.01
Abbreviations: AUC, area under the receiver operating characteristic curve; CatBoost, categorical boosting; F1-score, harmonic mean of precision and recall; LightGBM, light gradient boosting machine; LR, logistic regression; NN, neural network; Precision, positive predictive value; Recall, sensitivity; RF, random forest; SVM, support vector machine; XGBoost, extreme gradient boosting.
Disclaimer/Publisher’s Note: The statements, opinions and data contained in all publications are solely those of the individual author(s) and contributor(s) and not of MDPI and/or the editor(s). MDPI and/or the editor(s) disclaim responsibility for any injury to people or property resulting from any ideas, methods, instructions or products referred to in the content.