Article

Dependence of the Molecular Interactions Between Cyanoacrylate and Native Copper Surfaces on the Process Atmosphere

by
Philipp Moritz
,
Lienhard Wegewitz
* and
Wolfgang Maus-Friedrichs
Clausthal Center for Materials Technology, Clausthal University of Technology, Agricolastrasse 2, 38678 Clausthal-Zellerfeld, Germany
*
Author to whom correspondence should be addressed.
Adhesives 2025, 1(1), 1; https://doi.org/10.3390/adhesives1010001
Submission received: 3 October 2024 / Revised: 5 December 2024 / Accepted: 9 December 2024 / Published: 24 December 2024

Abstract

:
Cyanoacrylates, known for their rapid polymerization and strong bonding capabilities, are widely used in industrial and medical applications. This study investigates the impacts of different process atmospheres with varying water and oxygen contents—air, argon, and argon/silane—on the curing and adhesion mechanisms of cyanoacrylate adhesives on oxidized copper substrates. Raman spectroscopy indicated that the curing process in argon and argon/silane atmospheres was slower compared to ambient air, likely due to the reduced moisture content of the atmosphere. However, the degree of curing and the inter- and intramolecular interactions within the adhesive volume showed no significant differences across atmospheres. X-ray photoelectron spectroscopy (XPS) and infrared reflection absorption spectroscopy (IRRAS) revealed that strong ionic interactions between cyanoacrylate and the copper surface oxide were absent in the low-moisture argon atmosphere. The introduction of silane resulted in the formation of silicon oxides and other silane-derived compounds, which probably contributed to the formation of these ionic interactions, similar to those observed in air. This study highlights the critical influence of the surrounding atmosphere on the adhesive properties of cyanoacrylates, with implications for optimizing bonding processes in various environments.

1. Introduction

Cyanoacrylates, a class of fast-curing adhesives, have become essential in various industrial and medical applications since their discovery in the 1940s. These adhesives rapidly polymerize through an anionic mechanism upon exposure to moisture, forming strong bonds across a wide range of materials, including metals, plastics, and biological tissues [1]. The moisture (hydroxide ions) required for curing originates either from the surface to be bonded or from the surrounding process atmosphere. The ability of cyanoacrylates to cure quickly at room temperature and create durable bonds makes them invaluable, particularly in household and medical applications [2,3,4].
In an earlier study [5] on the bonding mechanism of cyanoacrylates with metal oxides, it was already shown that water not only plays a decisive role in the curing of the adhesive, but also contributes to the formation of strong ionic interactions between the cyanoacrylate and the oxidized metal surface. Water leads to the hydrolysis and deprotonation of certain functional groups of the polymer, which can result in a strong interaction that gives the bond its strength, among other things.
There are a number of publications that address the relationship between the atmosphere and the mechanical properties of cyanoacrylate bonds, by evaluating the influence of the atmosphere during service life and aging of the bond [6,7].
In addition, the mechanical strength of an adhesive bond with a cyanoacrylate depends on the surrounding process atmosphere during bonding and curing. Existing research is mostly concerned with the influence of moisture content. Since water serves as an initiator of polymerization, humidity influences the curing process, and thus the properties of the polymer chains [1,8]. The condensation and curing of the cyanoacrylate in the direct vicinity of the bond, known as “blooming”, is also prevented or facilitated depending on the humidity in the environment [9,10]. For special applications of cyanoacrylate adhesives, like making latent fingermarks accessible in forensics, the influences of different process atmospheres, like varying humidity and vacuum fuming, have been investigated [11,12]. Due to the nature of the application, no information regarding the influence of the process atmosphere on mechanical strength is available from this field.
Reactive components are frequently used as additives in order to control the polymerization in a targeted manner. However, this concerns the formulation of the (often commercially used) adhesive, and does not include the surrounding gas atmosphere. In another previous study [13], however, it was shown that the atmosphere in which this process takes place has an influence on the mechanical strength of the cyanoacrylate. In this study, different tensile strengths were achieved when bonding oxidized aluminum with cyanoacrylate, depending on whether the adhesive cured in air, an inert argon gas atmosphere, or an oxygen-free argon/silane atmosphere. Why the process atmosphere influences the cyanoacrylate bond strength, and how this effect can be explained at the molecular level, will be examined in more detail in this article. Our aim is to distinguish between cohesive and adhesive effects.
In our study, Raman spectroscopy, X-ray photoelectron spectroscopy (XPS), and infrared reflection absorption spectroscopy (IRRAS) were used to investigate both the curing of cyanoacrylate, and the molecular interactions at its interface with oxidized copper. The same process atmospheres (air, argon and argon/silane) were investigated as in the previously described studies, to represent different moisture and oxygen contents.

2. Materials and Methods

2.1. Materials and Sample Preparation

The cyanoacrylate adhesive used in this experiment was pure ethyl 2-cyanoacrylate (ECA, Sigma-Aldrich, Taufkirchen, Germany), applied to polished metal oxide substrates with a commercial spin coater (SCI-30, Novocontrol, Montabaur, Germany). The uncured ECA was dissolved in anisole (>99.7% anhydrous, Sigma-Aldrich, Taufkirchen, Germany) at concentrations varying from 0.05 wt.% to 6 wt.%. For each sample, 40 μL of the solution was deposited onto the stationary substrate, which was then spun up to 5000 rpm within approx. 2 s. The spin coating process continued for another 60 s, allowing the adhesive to cure and the anisole to evaporate.
Copper substrates measuring 10 × 10 × 1 mm3 (99.995+% purity, MaTecK GmbH, Jülich, Germany) were used in this study. The samples were carefully ground with silicon carbide sandpaper with increasingly fine grits (180, 220, 400, 800, and 1200 grit sizes), and then polished several times with diamond suspensions (5 µm, 3 µm, and 1 µm) using a wool cloth, to obtain a mirror-smooth surface. Following the polishing process, the samples were ultrasonically cleaned in ethanol and left to air dry. Prior to coating and spectroscopic analysis, the samples were stored in ambient air for a few hours, to allow the formation of a native oxide layer a few nanometers thick. The oxide layer formed natively in air consists primarily of Cu(I) oxide (Cu2O), and has small amounts of hydroxides, as has been shown by several spectroscopic measurements [5,14].
For the experiments in the argon and argon/silane atmospheres, the coating process was performed in a glove box with the corresponding atmosphere. For this purpose, a commercial glove box (OMNI-Lab, Vacuum Atmospheres Company, Hawthorne, CA, USA) was filled with argon 5.0 (>99.999% purity, Westfalen, Germany). The oxygen partial pressure in the box was measured with a lambda probe, and amounted to approx. 10 ppm. The water partial pressure was determined with a commercial sensor (Aquatrace ATT520V, DKS GmbH, Großröhrsdorf, Germany), and was approx. 20 ppm. In comparison, the water content, for the measurements in air at room temperature in the laboratory, was approx. 30–40% relative humidity.
To further reduce the oxygen content, a gas mixture of argon 5.0 with 1.5 vol.% silane 4.0 (>99.99% purity, Linde, Germany) was added. The silane, as a very reactive gaseous component, reacts with the remaining oxygen in the argon atmosphere, whereby solid amorphous silicon dioxide is also formed. The oxygen sensor indicated when the oxygen partial pressure in the glove box had dropped to a value of approx. 10−16 ppm. As the silane and oxygen react in a stoichiometric ratio of 1:1, only a correspondingly small amount of silane was required to minimize the oxygen content of approx. 10 ppm measured in the pure argon atmosphere. The theoretical background to this reaction and its application is summarized in a review [15]. The water partial pressure remained unchanged.
The copper samples were placed in the glove box in the respective atmosphere for preparation and analysis, and coated with the cyanoacrylate within a few minutes.

2.2. Characterization Techniques

2.2.1. Atomic Force Microscopy (AFM)

A commercial atomic force microscope (Dimension 3100, Veeco Instruments, Santa Barbara, CA, USA) was used to examine the homogeneity and surface structure of cyanoacrylate films. Measurements were conducted in air using the tapping mode technique, using silicon cantilevers with an aluminum coating (NSC15/Al BS, Micromasch, Wetzlar, Germany). Imaging was performed at a sampling rate of 0.5 Hz, with a resolution of 512 lines per frame. Image processing, including tilt correction, was carried out using SPIP 6.1.1 software (Image Metrology). To determine the film thickness, a scratch was introduced into the cyanoacrylate film using a plastic pipette needle, ensuring the underlying oxidized copper substrate remained undamaged. The layer thickness of the spin-coated film could then be determined from the resulting step height.

2.2.2. Raman Microscopy

A Raman microscope was used to measure the curing process (Senterra II, Bruker, Etlingen, Germany). A special sample box was constructed to allow measurements to be carried out in different process atmospheres, as shown in Figure 1a. The sample holder consisted of a DN 40 CF blind flange, to which the polished copper sample was secured with a double-sided carbon adhesive pad. Exactly 40 µL of the pure cyanoacrylate was then dripped onto the copper surface, in air or in argon or argon/silane in the glove box. A second DN 40 CF flange, with a view port made of Kodial glass, was then used to create a closed volume with a constant atmosphere in which the adhesive could begin to cure. The glass was translucent to the laser of the Raman microscope, and therefore did not affect the measurement. After sealing the sample box with a copper gasket, it was brought to the Raman microscope, and the measurement was started. A 532 nm laser with a power of 20 mW was used. For each measurement point, a wavelength range from 40 cm−1 to 3710 cm−1 was measured twice, with an integration time of 70 s, and the intensities were averaged.

2.2.3. X-Ray Photoelectron Spectroscopy (XPS)

The experiments were conducted in an ultra-high vacuum (UHV) setup, with a base pressure below 5 × 10⁻¹⁰ mbar. For all XPS measurements, a commercial X-ray source of the type RS40B1 (Prevac, Rogów, Poland) was utilized, which emitted non-monochromatic AlKα radiation at 1486.6 eV. The X-rays struck the surface at an angle of 80° to the sample normal, while the emitted photoelectrons were detected at a 10° angle to the sample normal using a hemispherical analyzer. To minimize radiation damage to the polymer film, high-resolution detail spectra were first recorded with a pass energy of 40 eV, followed by a survey spectrum at 80 eV. Both quantitative and qualitative analyses of the spectra were carried out using CasaXPS software (Version 2.3.23). A Shirley background and a mixed Gauss–Lorentz peak shape were applied for the detailed peak evaluations, with peak fitting performed using the Levenberg–Marquardt algorithm. Any charging effects caused by the insulating cyanoacrylate film were corrected by referencing the spectra to aliphatic carbon at 285.0 eV.
The thicknesses of the spin-coated PECA films were estimated by measuring the attenuation of the Cu 2p3/2 XPS peak signals, respectively. A comparison with microscopic measurements of the film thickness in previous studies shows that this procedure provides reliable values for thin PECA films [16,17]. For this calculation, the peak intensity Ix was compared with the peak intensity I0 of the uncoated reference spin-coated with pure anisole only, as shown in Equation (1) [18]:
d = λ ( E ) · c o s   ( α ) · l n I 0 I x
Due to the lack of values from the literature for the inelastic mean free path λ in PECA, values for the chemically similar polymer PMMA were used instead. For a kinetic energy of the Cu 2p3/2 electrons of 554 eV, this resulted in a value of 2.13 nm [19]. The angle α between the detection direction and the sample normal was 10° for the system.
For the XPS measurements, a transfer system consisting of several CF flange components was constructed, as shown in Figure 1b, in order to be able to measure samples from different process atmospheres. The sample coated in the respective atmosphere was mounted on a sample holder in the glove box, and placed on a small transfer rod. The system could be closed via a gate valve and transported to the UHV system described above. There, the transfer system was evacuated, and the sample could be measured without intermediate air contact.

2.2.4. Infrared Reflection Adsorption Spectroscopy (IRRAS)

IRRAS measurements were performed using a commercial A513Q variable angle reflection accessory, attached to a VERTEX 70V FT-IR spectrometer (Bruker). Each sample was measured across a spectral range from 600 cm−1 to 4200 cm−1, with a resolution of 2 cm−1. To enhance surface sensitivity, the measurements were performed under grazing incidence at 80° to the surface normal, using fully p-polarized IR light. A total of 100 spectra were recorded and averaged for each sample. Before taking the actual measurements, a background measurement was conducted on a clean copper substrate under the same conditions. Like the coated samples, the reference sample was cleaned in ethanol using an ultrasonic bath, followed by the application of pure anisole using a spin coater, and drying in air.
For the IRRAS experiments, it was not possible to carry out measurements without interrupting the atmosphere, due to the nature of the device. The coated samples from the argon or argon/silane atmosphere were brought to the FTIR spectrometer in the sealed sample box described above for the Raman experiments in the respective process atmosphere, and briefly exposed to air, before the FTIR spectrometer was evacuated again.

3. Results and Discussion

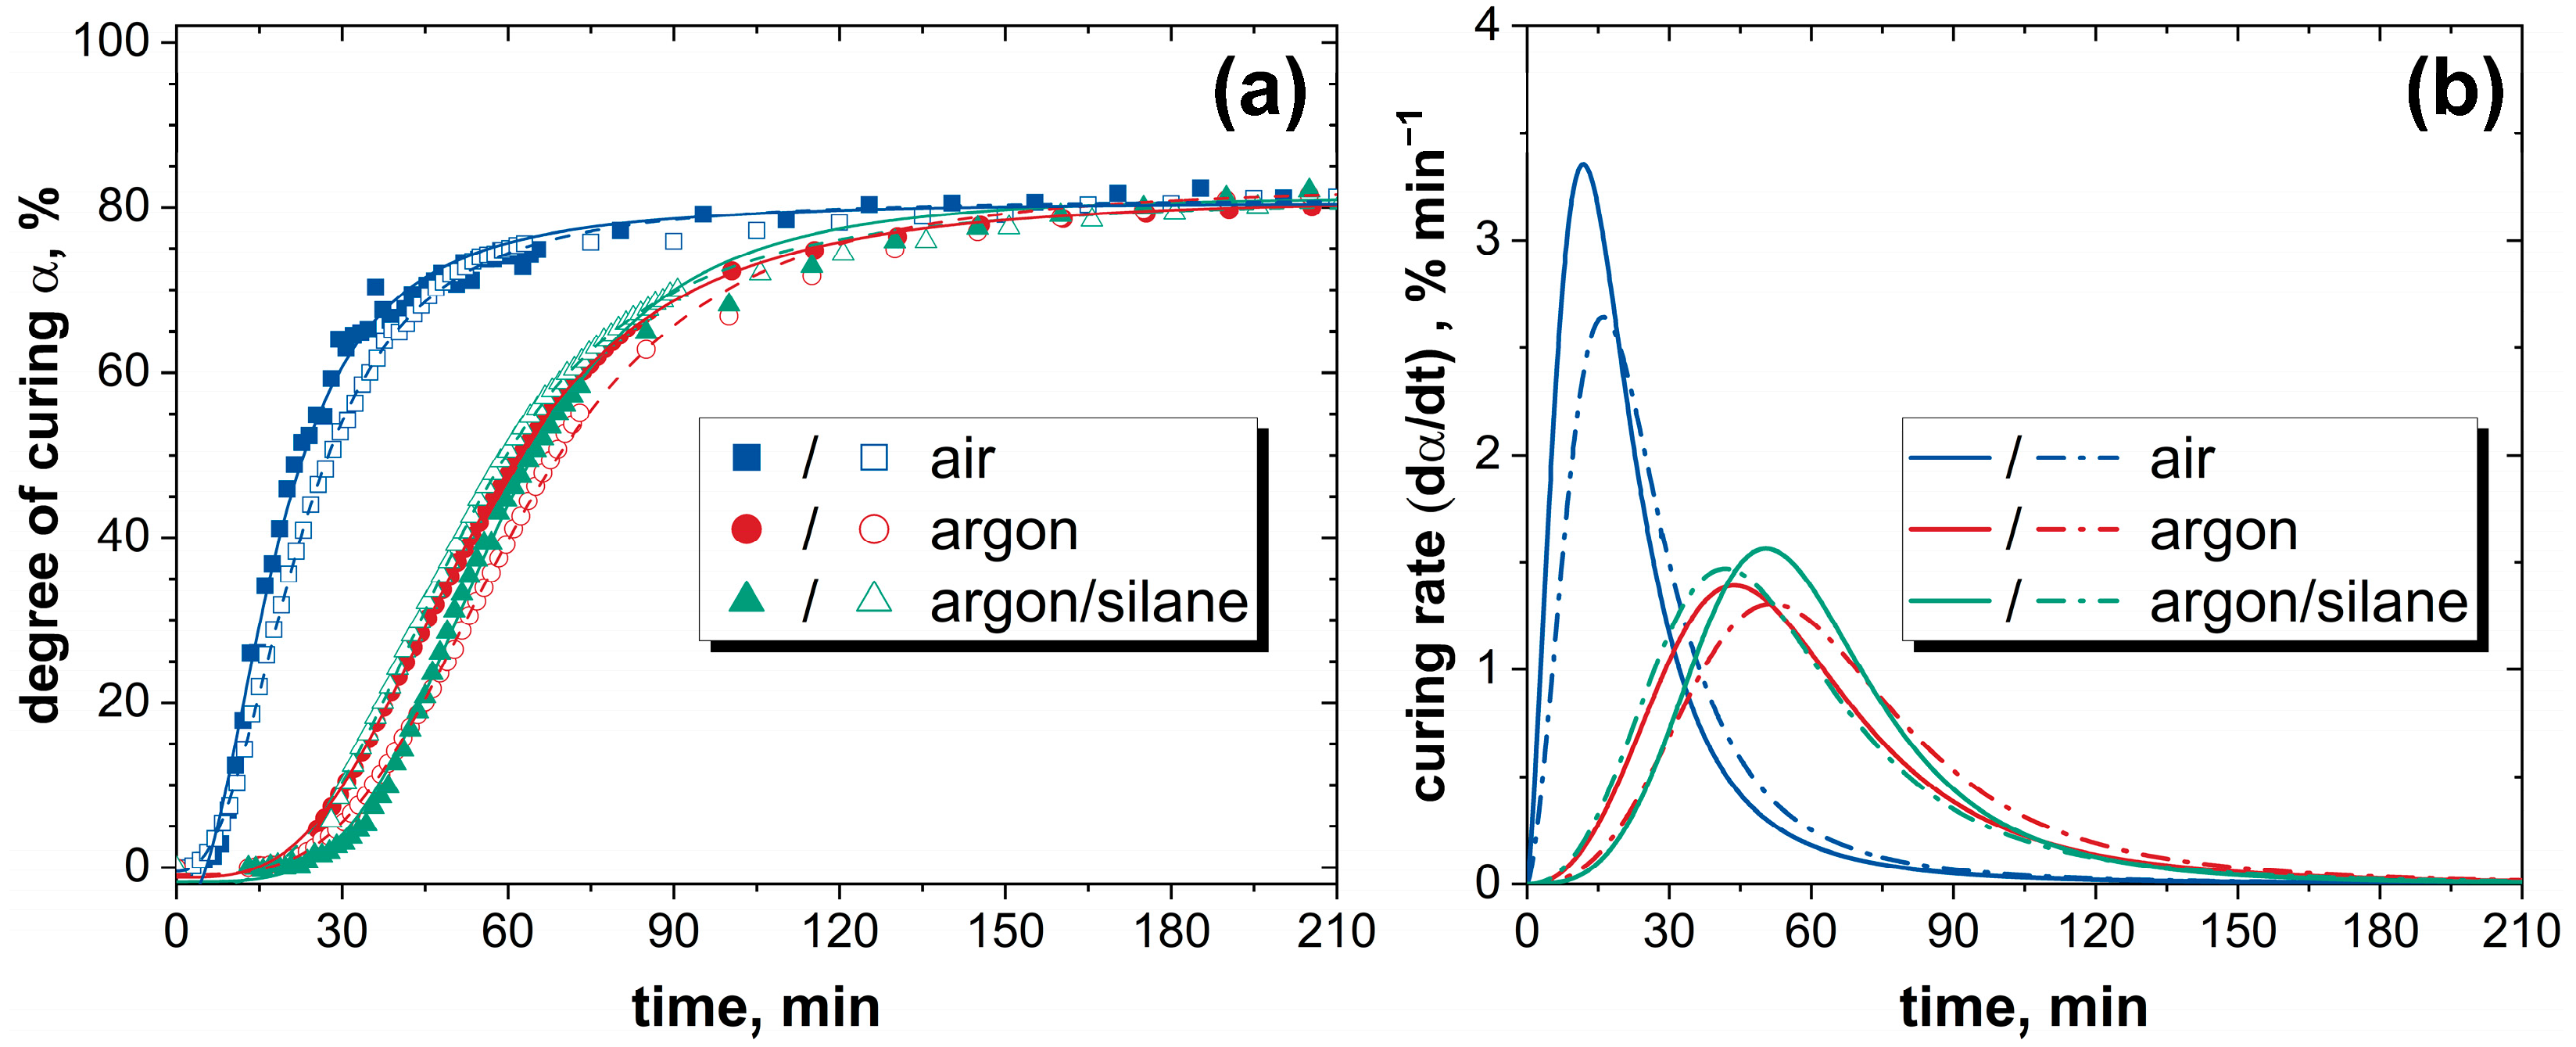
3.1. Influence of the Atmosphere on Curing

The experimental setup described in Section 2.2.2 allowed for in situ monitoring of the curing process over time in different process atmospheres of air, argon, and argon/silane. Raman spectroscopy was employed to record spectra of the cyanoacrylate at specific time intervals throughout the curing process. Figure 2 shows spectra of two key spectral regions, ranging from 3200 to 2700 cm−1 and 1900 to 1300 cm−1, observed at various time points between the start and completion of a measurement in air. Additionally, Figure S1 in the Supporting Information displays the full spectrum captured at the beginning and end of the experiment. In a previous study [13], similar measurements were conducted using a commercial cyanoacrylate adhesive on a rough, oxidized aluminum surface, leading to qualitatively comparable results.
It is noticeable that the intensities of the different bands decrease over time, remain constant, or even increase. Additionally, both the shape and width of the signals evolve throughout the measurement. The most significant reduction in intensity can be observed in the C=C stretching vibration at 1617 cm–1. This decrease also influences related signals, such as the ν(C=CH2) stretching vibrations at 3034 cm−1 and 3128 cm−1, as well as the δ(C=CH2) deformation vibration at 1388 cm⁻1. The decline in intensity can be attributed to the opening of the C=C bond during polymerization, leading to the formation of a C-C single bond, which in turn causes an increase in the ν(C-C) intensity at 2941 cm−1 as the reaction progresses. Other molecular vibrations, like the CH2 stretching vibration at 1454 cm−1, are almost unaffected by the polymerization, and thus show little variation in peak intensity and width.
The observed changes in peak intensities varied depending on the surrounding atmosphere, and this variation was utilized to assess the degree of cyanoacrylate curing over time, as seen in similar studies [20,21]. After performing a linear background subtraction, the peak intensities of It(C=C) at 1617 cm−1 and It(CH2) at 1454 cm−1 (highlighted in gray in Figure 2) were determined at each time t and set in relation to each other. For complete curing, the C=C bond’s signal should disappear entirely, while the CH2 bond’s signal, which remains constant, serves as a reference. By comparing with the corresponding intensity ratio at the beginning (t = 0) of the measurement as an internal standard, the degree of curing α can be determined using the following Equation (2):
α = 1 I t ( C = C ) / I t ( C H 2 ) I 0 ( C = C ) / I 0 ( C H 2 ) · 100 %
Due to working with the glove box, the measurements in the argon and argon/silane atmospheres were started later than in air. To provide a reference, the cyanoacrylate in air was therefore dripped on directly under the Raman microscope, and a measurement was carried out immediately. A faster characterization of the instant adhesive was not feasible. The intensity ratio from this initial measurement serves as the reference point at time t = 0. For each of the three different atmospheres (air, argon, and argon/silane), two long-term measurements were performed using Raman spectroscopy, and the degree of curing was calculated using Equation (2). The results are displayed in Figure 3a. Due to the high reactivity of the cyanoacrylate, measurements were taken every 80 s during the first 60 min. Thereafter, measurements were taken at longer intervals of 15 min in order to determine the final degree of curing. The measurements in the argon and argon/silane atmospheres start with a slight time delay, due to working with the glove box and the longer transport route.
Various approaches exist for modeling reaction kinetics and curing measurements to describe the steps involved in anionic polymerization. In similar studies, the data have been modeled using a logistic function [22], sectional cubic splines [21], or an asymmetric sigmoidal function known as the Gompertz function [23]. For this study, a logistic function was chosen to model the curing process in different atmospheres, minimizing the quadratic deviations. The regression analysis resulted in a coefficient of determination R2 greater than 0.99 in all cases. The interpolated curves are shown alongside the measured data in Figure 3a. The first time derivative of these functions, representing the curing rate, is illustrated in Figure 3b. Notably, the maximum curing rate in air, approximately 3%/min, is about twice as high as that in argon or argon/silane, and is achieved three to four times faster in air than in the other two atmospheres. This difference is likely due to the much lower water content in the argon-based atmospheres. During the measurements in air at room temperature, the relative humidity in the laboratory was 30–40%. As the water content of approx. 20 ppm in the argon and argon/silane atmosphere does not differ, curing is delayed to a similar extent. The low water content still corresponds to several billion water molecules in the surrounding atmosphere, which can presumably initiate polymerization. Compared to air, however, they are rarer and therefore influence the reaction kinetics. The additional silane does not appear to have any effect on the reaction rate. Furthermore, it cannot be ruled out that adsorbed water on the surface also contributes to the polymerization reaction. A curing study by Raheem et al. suggests that the surface condition and the distance of the measuring point to the surface also play a role in the curing investigation [21]. However, as the surfaces were only briefly exposed to the protective argon or argon/silane atmospheres as described in Section 2.1, and the cyanoacrylate was then applied as a “protective layer”, the water from the surrounding atmosphere is probably more responsible for the differences in the curing shown in Figure 3.
A Raman spectrum from the end of the measurements for each atmosphere is provided in Figure S2 in the Supporting Information. There are no additional or missing peaks due to the argon or silane, and the intensity ratios do not differ significantly. The carbonyl and cyano group signals in argon and argon/silane display the same shifts in wavenumber and peak width as in air, indicating that the anhydrous or oxygen-free conditions did not significantly affect the functional groups within the volume of cyanoacrylate or the inter- and intramolecular interactions. Moreover, the final degree of curing was approximately 80% across all atmospheres tested, with complete curing not achieved in any measurement. Even in comparable Raman studies, no complete degree of curing was achieved, which is probably due to the point of measurement in the volume of the cyanoacrylate, and the different progression of polymerization between surface and volume, which could also have an influence on the diffusion of water [21,24].
Overall, the Raman measurements suggest that while the surrounding process atmosphere influences the curing kinetics, it does not alter the inter- or intramolecular interactions within the cyanoacrylate.

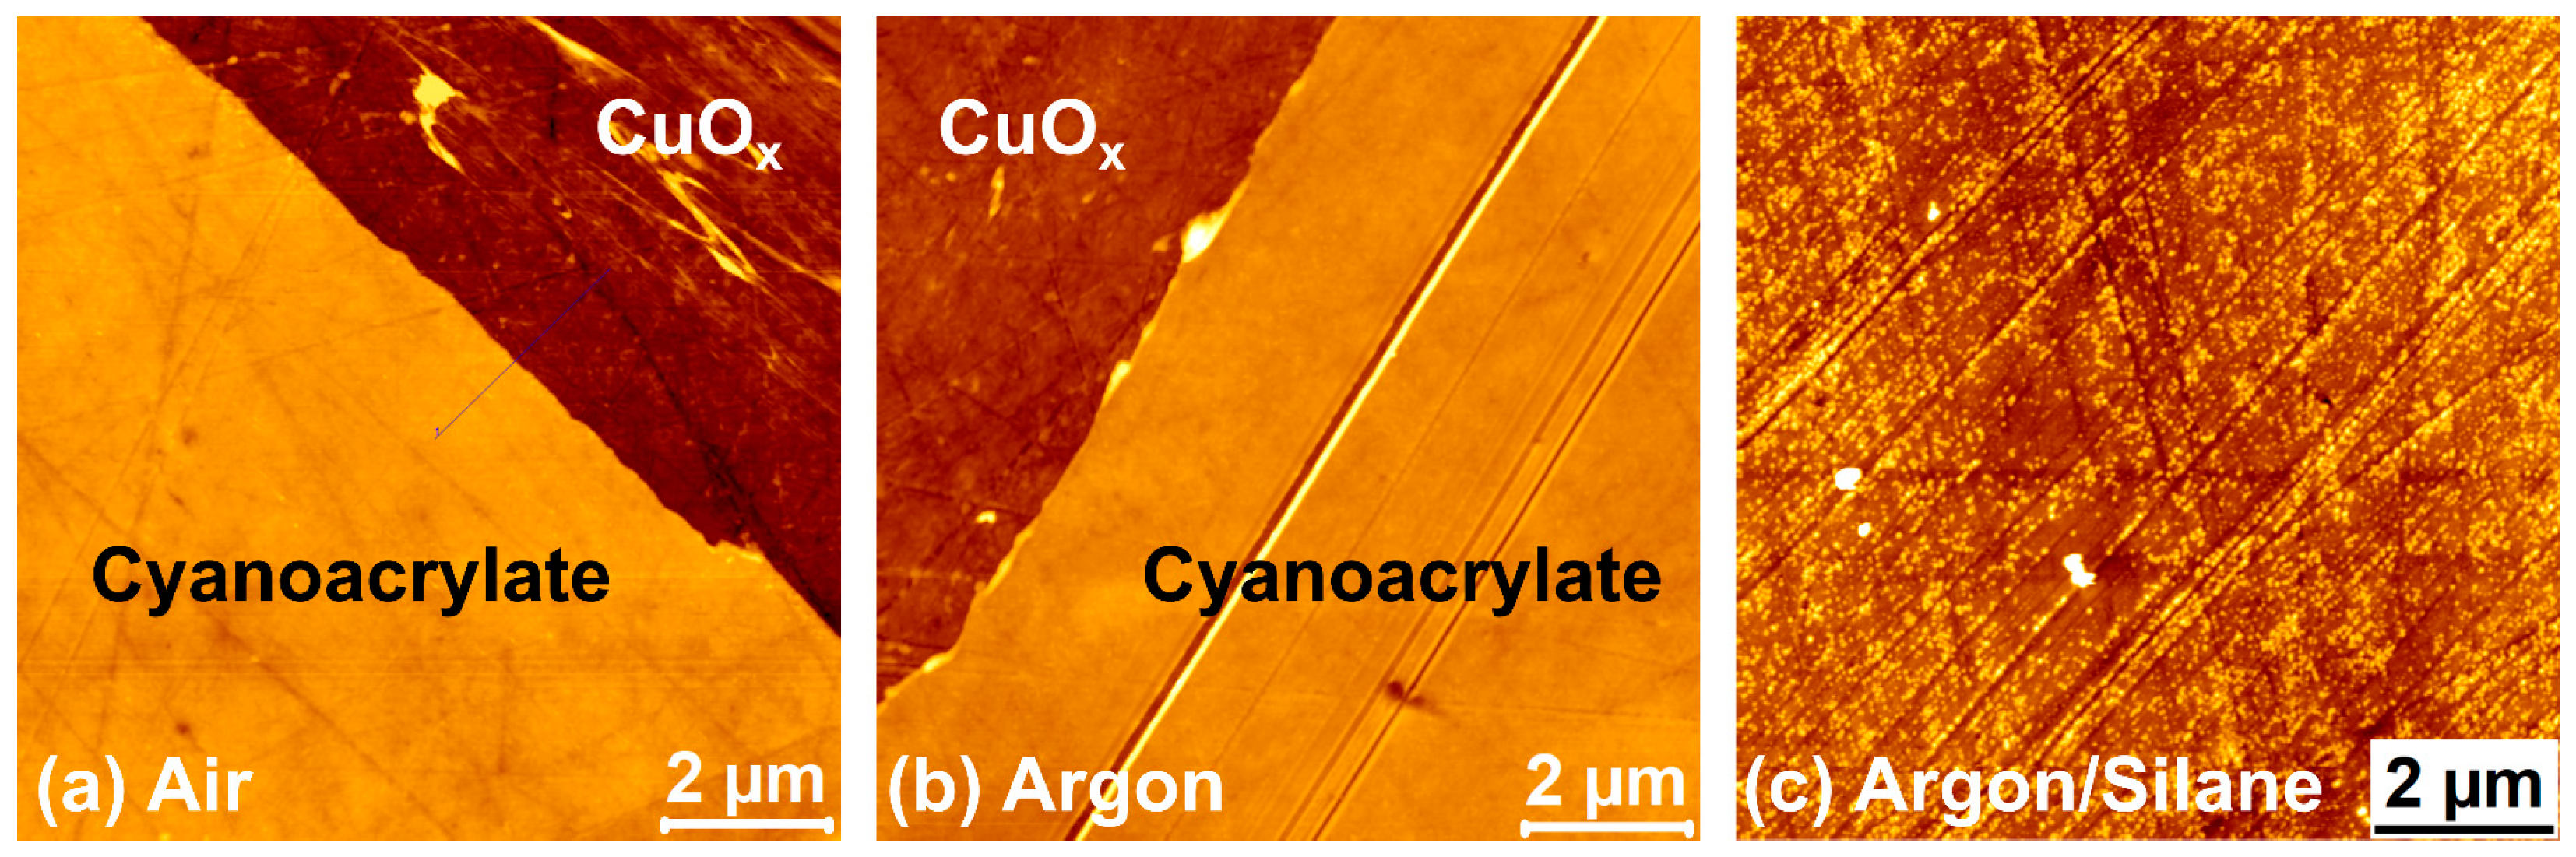
3.2. Topography of Thin Cyanoacrylate Films

Figure 4 shows three 10 × 10 µm2 AFM images of thin PECA films (less than 10 nm) that were deposited on the oxidized copper substrate in different process atmospheres, and subsequently analyzed microscopically in air.
In both air and argon environments, uniform and continuous PECA films were produced, which could be partially removed to expose the copper substrate underneath. This indicates that the coating process functioned effectively within the glove box under pure argon. When silane was introduced to the argon atmosphere, numerous nanometer-sized particles were observed across the entire surface of the sample. These particles are likely silicon oxide, formed due to the reaction between silane and residual oxygen in the glove box, gradually settling on the sample and throughout the chamber. These particles complicate further spectroscopic analysis of the interface, as they introduce additional signals in the spectra, some of which overlap with other significant signals from the cyanoacrylate.

3.3. Spectroscopic Analysis of the Interface

In order to understand the adhesion behavior at the interface between the cyanoacrylate and the oxidized copper surface, it is necessary to use very surface-sensitive spectroscopy methods. XPS offers the possibility to detect the bonding states of the cyanoacrylate and possible changes due to molecular interactions. In particular, the detail spectra of carbon (C 1s peak) provide information on whether new bonds or interactions with the organic molecule occur.
Figure 5 shows the C 1s detail spectra of PECA films of different thicknesses on CuOx in argon and argon/silane atmosphere. Due to the interfering influence of the silicon oxide particles, no reliable film thickness could be determined with XPS in the measurements in the argon/silane atmosphere, so the concentrations used during the spin coating were specified equivalently, which also corresponded to a gradient in the film thickness. Analogous spectra in air can be found in an earlier publication [5], in which a detailed description of the peak fit and binding species is also given. The investigations in air revealed changes in the peak structure that could be attributed to interactions at the interface. Hydrogen bonds were found between OH groups on the surface and the C=O group of the cyanoacrylate. In addition, there was an ionic interaction between a carboxylate ion of the adhesive and positively charged ions on the metal surface. However, as a basic description, regardless of the atmosphere, the binding states of the cyanoacrylate polymer have a characteristic binding energy that can be assigned in the C 1s spectrum. This assignment is also shown graphically with lines in Figure 5.
In both the air and argon environments, uniform and continuous PECA films were produced, which could be partially removed to expose the copper substrate underneath. This indicated that the coating process functioned effectively within the glove box under pure argon. When silane was introduced to the argon atmosphere, numerous nanometer-sized particles were observed across the entire surface of the sample. These particles were likely silicon oxide, formed due to the reaction between silane and the residual oxygen in the glove box, gradually settling on the sample and throughout the chamber. These particles complicated further spectroscopic analysis of the interface, as they introduced additional signals in the spectra, some of which overlapped with other significant signals from the cyanoacrylate.
When comparing the spectra of films of different thicknesses, two effects become visible:
  • The binding energy of the O-C=O species shifts to higher values with decreasing PECA film thickness or concentration. Regardless of the surrounding process atmosphere, there is a shift of approximately 0.2 to 0.3 eV, which is indicated by a slanted dashed line in Figure 5. The higher chemical shift indicates a molecular interaction. The effect can be attributed to hydrogen bonding between the carbonyl oxygen and OH groups on the surface, which is also observed in other studies for comparable polymer/metal oxide interfaces [5,16,25,26]. The change from air to an argon or argon/silane atmosphere presumably does not change the OH groups present on the surface of the oxidized copper, so that the hydrogen bonds can form independently of the process atmosphere.
  • As the concentration decreases, there is a change in the structure of the C 1s signal, which indicates a change in the functional groups or an interaction. The dip in the peak in the range between 288.3 and 288.5 eV is clearly visible in the case of larger film thicknesses or concentrations, in both of the atmospheres shown. In the case of argon, this structure remains approximately the same, even at low film thicknesses. In the measurements in the argon/silane atmosphere, this dip is filled in, and a plateau tends to form. This indicates that an additional binding species is formed in this energy range. Comparable interface studies assign a carboxylate ion (COO-) here, which leads to a stronger ionic interaction between the cyanoacrylate and the oxidized metal surface [5,25,26,27,28]. In an earlier study, a model was established to show how this ionic interaction can develop under the influence of moisture [5]: after forming the hydrogen bonds, the acrylate group (-O-C=O) is hydrolyzed by water, so that, in the case of ethyl cyanoacrylate, a carboxyl group (COOH) is formed with the elimination of ethanol. This carboxyl group is then deprotonated by further influence of water, so that a carboxylate ion (COO-) is formed, which can then undergo a strong ionic interaction with the surface. There is an interaction between the negative ion of the polymer and a positive ion on the metal (oxide) surface. A more detailed description of this mechanism and a graphical representation of the process can be found in the previous study mentioned above [5]. The emergence of carboxylate ions at polymer/oxide interfaces has also been described by Pletincx et al. and Fockaert et al. for other systems [26,27,29].
It is interesting to note that the interaction did not appear to form in argon, presumably due to the lack of moisture. The addition of silane did not measurably change the water content in the atmosphere, but again presumably led to the formation of the ionic interaction.
In order to investigate this difference, which is only slightly pronounced in the XPS spectra, additional IRRAS measurements were carried out on PECA films in the argon and argon/silane atmospheres. For these measurements, new films were prepared on CuOx substrates in both the argon and argon/silane environments. Due to the greater depth of information provided by IRRAS, higher concentrations of the monomer were used during spin coating. The recorded spectra of samples exposed to the argon atmosphere for 24 h are shown in Figure 6a,b. In the enlarged wavenumber range of 1200–2000 cm−1 in Figure 6b, the intensities are normalized to the stretching vibration of the carbonyl group.
The most prominent signals of the cyanoacrylate originate from the carbonyl group at 1755 cm−1 and the C-O stretching vibration at 1254 cm−1. Additionally, peaks from the CH2 and CH3 bending vibrations can be detected between 1300 and 1500 cm−1 [30,31]. There are no OH bands in the 3000–3600 cm−1 wavenumber range, which would indicate additional adsorbed water compared to the reference measurement. When the PECA layer thickness is reduced by lowering the concentration, the intensity of all bands decreases uniformly, and the signal-to-noise ratio deteriorates accordingly.
No signals are present on the uncoated sample, indicating that no additional functional groups formed on the surface during brief contact with air right before the IRRAS measurement. Since no new or altered signals appear in the spectra, it can be assumed that no strong interactions or molecular interactions other than those already described existed at the interface between the cyanoacrylate and the oxidized copper surface. However, it cannot be ruled out that other weak interactions, such as van der Waals forces or other dispersion forces, existed that are not visible or not visible strongly enough in the spectroscopic measurements.
Similarly, IRRAS measurements were conducted on PECA films prepared in the argon/silane atmosphere. The uncoated copper substrate, stored solely in the argon/silane atmosphere, shows numerous new signals compared to the freshly cleaned copper sample. Figure 7 shows the IRRAS spectrum of this reference sample.
In comparison with IR measurements on silicon dioxide particles and other silane compounds, the clearly pronounced bands in the spectrum can be assigned to different Si compounds: other species such as Si-O, Si-OH, and Si-H bonds can be detected [32,33,34]. These compounds were also identified in another study examining the gas-phase reaction of silane with oxygen [35]. Therefore, in the glove box, not only fully oxidized SiO2 nanoparticles were formed, but also various intermediate products like silanols. As a result, the applied PECA film not only came into contact with the oxidized copper surface, but also with numerous other potentially reactive Si compounds.
After depositing the nm-thin PECA films in the argon-silane atmosphere, IRRAS measurements were carried out, as shown in Figure 8.
The full spectra in Figure 8a again reveal signals from the SiO2 particles and other Si compounds. However, peaks from the cyanoacrylate can also be detected. In the enlarged wavenumber range from 1200 to 2000 cm−1 in Figure 8b, the signals of the carbonyl group (1755 cm−1), the C-O group (1254 cm−1), and the peaks of the CH2 and CH3 bending vibrations (1300–1500 cm−1) are evident at the highest PECA concentration of 6 wt.% [30,31].
At lower concentrations or reduced layer thicknesses, new signals emerge between 1450 and 1720 cm−1. Consistent with other studies [25,26,27,28], the stretching vibrations of the carboxyl group (1705 cm−1) and the carboxylate group (1610 cm−1 and 1490 cm−1) can be seen here. This correlates with the XPS measurements, which also show a carboxylate species only in the argon/silane atmosphere.
This shows that the addition of silane to argon creates new reactive species which, similarly to water in air, lead to the formation of stronger ionic interactions. This correlates with the mechanical tensile test from an earlier study [13], in which high mechanical tensile strengths were found in air and in argon/silane. In argon, on the other hand, lower strengths were found, which is presumably due to the less pronounced molecular interaction at the adhesive/metal oxide interface.

4. Conclusions

The effect of different process atmospheres on the curing and bonding mechanism of cyanoacrylate adhesives was investigated using various spectroscopic and microscopic techniques. Previous studies [5,13] have indicated that the strength and curing of a bond with cyanoacrylates depend on the surrounding process atmosphere.
Using Raman spectroscopy, it was shown that the curing of the adhesive in argon and argon/silane atmospheres is slower than in air, presumably due to the lower water content of the atmosphere. However, no evidence of a different degree of curing, or deviating inter- and intramolecular interactions in the volume of the adhesive, could be observed. The mechanical properties are therefore more likely to be dependent on differences in adhesive behavior at the interface.
The low water content in the argon atmosphere means that no strong ionic interactions can form between the cyanoacrylate and the oxidized copper surface, which would otherwise be evident in the XPS and IRRAS measurements.
The addition of silane to the argon leads to the formation of silicon oxides and other silane compounds, which are both present in the atmosphere and deposited on the adhesive film. This leads to clear signals in the XPS and IRRAS spectra. Both spectroscopic measurements show evidence of an ionic interaction between the adhesive and the surface, as was also observed in air.
At this point, it remains unclear how the silane or the reactive silane compounds contribute to the formation of this strong molecular interaction. The formation of the silicon oxide particles is of particular interest, as a new large interface to the cyanoacrylate is created, which presumably has a significant influence on the bonding. The formation and influence of these particles will therefore be characterized in more detail in future studies.

Supplementary Materials

The following supporting information can be downloaded at https://www.mdpi.com/article/10.3390/adhesives1010001/s1. Figure S1: Raman spectra at the start and at the end of the measurement; Figure S2: Full Raman spectra at the end of the measurement in air, argon, and argon/silane.

Author Contributions

Conceptualization, P.M. and L.W.; methodology, P.M.; formal analysis, P.M.; investigation, P.M.; resources, W.M.-F.; writing—original draft preparation, P.M.; writing—review and editing, P.M. and L.W.; visualization, P.M.; project administration, L.W. and W.M.-F.; funding acquisition, L.W. and W.M.-F. All authors have read and agreed to the published version of the manuscript.

Funding

This research has been funded by the Deutsche Forschungsgemeinschaft (DFG, German Research Foundation)—Project-ID 394563137—SFB 1368.

Institutional Review Board Statement

Not applicable.

Informed Consent Statement

Not applicable.

Data Availability Statement

The research data are available upon request under 10.5281/zenodo.13845541.

Acknowledgments

The authors sincerely thank K. Bode from the institute for inorganic chemistry (IAAC) for support with the Raman and IRRAS measurements, and thankfully acknowledge the provision of the AFM by W. Daum.

Conflicts of Interest

The authors declare no conflicts of interest. The funders had no role in the design of the study; in the collection, analyses, or interpretation of data; in the writing of the manuscript; or in the decision to publish the results.

References

  1. Klemarczyk, P.; Guthrie, J. Advances in Anaerobic and Cyanoacrylate Adhesives. In Advances in Structural Adhesive Bonding; Elsevier: Amsterdam, The Netherlands, 2010; pp. 96–131. ISBN 978-1-84569-435-7. [Google Scholar]
  2. Korde, J.M.; Kandasubramanian, B. Biocompatible Alkyl Cyanoacrylates and Their Derivatives as Bio-Adhesives. Biomater. Sci. 2018, 6, 1691–1711. [Google Scholar] [CrossRef]
  3. Bhat, Y.M.; Banerjee, S.; Barth, B.A.; Chauhan, S.S.; Gottlieb, K.T.; Konda, V.; Maple, J.T.; Murad, F.M.; Pfau, P.R.; Pleskow, D.K.; et al. Tissue Adhesives: Cyanoacrylate Glue and Fibrin Sealant. Gastrointest. Endosc. 2013, 78, 209–215. [Google Scholar] [CrossRef] [PubMed]
  4. Pantelakis, S.; Tserpes, K.I. Adhesive Bonding of Composite Aircraft Structures: Challenges and Recent Developments. Sci China Phys. Mech. Astron. 2014, 57, 2–11. [Google Scholar] [CrossRef]
  5. Moritz, P.; Höfft, O.; Wegewitz, L.; Maus-Friedrichs, W. Interaction of Cyanoacrylate with Metal Oxide Surfaces (Cu, Al). ChemPhysChem 2023, 24, e202300076. [Google Scholar] [CrossRef]
  6. Fifo, O.; Ryan, K.; Basu, B. Investigations on the Effectiveness of Cyanoacrylate Adhesive for Repair of Fibre-Reinforced Polymer Laminates under Different Environmental Conditions. J. Compos. Mater. 2014, 48, 2657–2668. [Google Scholar] [CrossRef]
  7. Drain, K.F.; Guthrie, J.; Leung, C.L.; Martin, F.R.; Otterburn, M.S. The Effect of Moisture on the Strength of Steel-Steel Cyanoacrylate Adhesive Bonds. J. Adhes. 1984, 17, 71–81. [Google Scholar] [CrossRef]
  8. Estan-Cerezo, G.; Alonso, D.A.; Martín-Martínez, J.M. Structural and Adhesion Properties of Poly(Ethyl 2-Cyanoacrylate) Post-Cured at Different Temperatures and Times. J. Adhes. Sci. Technol. 2019, 33, 329–345. [Google Scholar] [CrossRef]
  9. Hartshorn, S.R. Structural Adhesives: Chemistry and Technology, 1st ed.; Topics in Applied Chemistry Ser; Springer: New York, NY, USA, 1986; ISBN 978-1-4684-7781-8. [Google Scholar]
  10. Habenicht, G. Kleben: Grundlagen, Technologien, Anwendungen, 6th ed.; VDI-Buch; Springer: Berlin/Heidelberg, Germany, 2009; ISBN 978-3-540-85266-7. [Google Scholar]
  11. Paine, M.; Bandey, H.L.; Bleay, S.M.; Willson, H. The Effect of Relative Humidity on the Effectiveness of the Cyanoacrylate Fuming Process for Fingermark Development and on the Microstructure of the Developed Marks. Forensic Sci. Int. 2011, 212, 130–142. [Google Scholar] [CrossRef] [PubMed]
  12. Farrugia, K.J.; Fraser, J.; Friel, L.; Adams, D.; Attard-Montalto, N.; Deacon, P. A Comparison between Atmospheric/Humidity and Vacuum Cyanoacrylate Fuming of Latent Fingermarks. Forensic Sci. Int. 2015, 257, 54–70. [Google Scholar] [CrossRef] [PubMed]
  13. Moritz, P.; Gerland, S.; Wegewitz, L.; Raatz, A.; Maus-Friedrichs, W. Influence of Different Processing Atmospheres on Curing and Adhesive Strength of Cyanoacrylates. Int. J. Adhes. Adhes. 2023, 124, 103386. [Google Scholar] [CrossRef]
  14. Udachin, V.; Wegewitz, L.; Dahle, S.; Maus-Friedrichs, W. Reduction of Copper Surface Oxide Using a Sub-Atmospheric Dielectric Barrier Discharge Plasma. Appl. Surf. Sci. 2022, 573, 151568. [Google Scholar] [CrossRef]
  15. Wegewitz, L.; Maus-Friedrichs, W.; Gustus, R.; Maier, H.J.; Herbst, S. Oxygen-Free Production—From Vision to Application. Adv. Eng. Mater. 2023, 25, 2201819. [Google Scholar] [CrossRef]
  16. Moritz, P.; Bürger, F.; Höfft, O.; Wegewitz, L.; Maus-Friedrichs, W. Bonding Mechanism of Cyanoacrylates on SiO2 and Au: Spectroscopic Studies of the Interface. J. Phys. Chem. C 2021, 125, 23409–23417. [Google Scholar] [CrossRef]
  17. Moritz, P.; Bürger, F.; Wegewitz, L.; Maus-Friedrichs, W. Preparation Techniques of Thin Cyanoacrylate Adhesive Films for Interface Analysis. J. Adhes. 2022, 98, 963–978. [Google Scholar] [CrossRef]
  18. Powell, C.J.; Jablonski, A. Progress in Quantitative Surface Analysis by X-Ray Photoelectron Spectroscopy: Current Status and Perspectives. J. Electron Spectrosc. Relat. Phenom. 2010, 178–179, 331–346. [Google Scholar] [CrossRef]
  19. Powell, C.J.; Jablonski, A. NIST Electron Inelastic-Mean-Free-Path Database, Version 1.2; National Institute of Standards and Technology: Gaithersburg, MD, USA, 2010. [Google Scholar]
  20. Li, Y.; Xiao, L.; Wang, Z.; Chen, K.; Xue, C.; Yu, M.; Wang, Y.; Kong, F.; Liu, K.; Qin, K. Raman Spectroscopic Characterization of Polymerization Kinetics of Cyanoacrylate Embolic Glues for Vascular Embolization. Polymers 2021, 13, 3362. [Google Scholar] [CrossRef]
  21. Raheem, K.; Cassidy, J.; Betts, A.; Ryan, B. Use of Confocal Raman Microscopy to Characterise Ethyl Cyanoacrylate Adhesive Depth Curing. Phys. Chem. Chem. Phys. 2020, 22, 23899–23907. [Google Scholar] [CrossRef]
  22. Dillman, B.; Jessop, J.L.P. Chain Transfer Agents in Cationic Photopolymerization of a Bis-cycloaliphatic Epoxide Monomer: Kinetic and Physical Property Effects. J. Polym. Sci. A Polym. Chem. 2013, 51, 2058–2067. [Google Scholar] [CrossRef]
  23. Schmitt, M.; Schulze-Pillot, R.; Hempelmann, R. Kinetics of Bulk Polymerisation and Gompertz’s Law. Phys. Chem. Chem. Phys. 2011, 13, 690–695. [Google Scholar] [CrossRef]
  24. Edwards, H.G.M.; Day, J.S. Fourier Transform Raman Spectroscopic Studies of the Curing of Cyanoacrylate Glue. J. Raman Spectrosc. 2004, 35, 555–560. [Google Scholar] [CrossRef]
  25. Cavezza, F.; Pletincx, S.; Revilla, R.I.; Weaytens, J.; Boehm, M.; Terryn, H.; Hauffman, T. Probing the Metal Oxide/Polymer Molecular Hybrid Interfaces with Nanoscale Resolution Using AFM-IR. J. Phys. Chem. C 2019, 123, 26178–26184. [Google Scholar] [CrossRef]
  26. Pletincx, S.; Marcoen, K.; Trotochaud, L.; Fockaert, L.-L.; Mol, J.M.C.; Head, A.R.; Karslioğlu, O.; Bluhm, H.; Terryn, H.; Hauffman, T. Unravelling the Chemical Influence of Water on the PMMA/Aluminum Oxide Hybrid Interface in Situ. Sci. Rep. 2017, 7, 13341. [Google Scholar] [CrossRef] [PubMed]
  27. Pletincx, S.; Trotochaud, L.; Fockaert, L.-L.; Mol, J.M.C.; Head, A.R.; Karslıoğlu, O.; Bluhm, H.; Terryn, H.; Hauffman, T. In Situ Characterization of the Initial Effect of Water on Molecular Interactions at the Interface of Organic/Inorganic Hybrid Systems. Sci. Rep. 2017, 7, 45123. [Google Scholar] [CrossRef] [PubMed]
  28. Pletincx, S.; Fockaert, L.-L.I.; Meeusen, M.; Mol, J.M.C.; Terryn, H.; Hauffman, T. In Situ Methanol Adsorption on Aluminum Oxide Monitored by a Combined ORP-EIS and ATR-FTIR Kretschmann Setup. J. Phys. Chem. C 2018, 122, 21963–21973. [Google Scholar] [CrossRef]
  29. Fockaert, L.-L.I.; Ganzinga-Jurg, D.; Versluis, J.; Boelen, B.; Bakker, H.J.; Terryn, H.; Mol, J.M.C. Studying Chemisorption at Metal–Polymer Interfaces by Complementary Use of Attenuated Total Reflection–Fourier Transform Infrared Spectroscopy (ATR-FTIR) in the Kretschmann Geometry and Visible–Infrared Sum-Frequency Generation Spectroscopy (SFG). J. Phys. Chem. C 2020, 124, 7127–7138. [Google Scholar] [CrossRef]
  30. Vouvoudi, E.C.; Morfis, P.D.; Verros, G.D.; Achilias, D.S. Polymerisation Kinetics on FT-IR and Colorimetric Changes under UV Irradiation for a Commercial Polycyanoacrylate Adhesive, Addressed to Glass Restoration. Coatings 2022, 12, 490. [Google Scholar] [CrossRef]
  31. Sain, S.; Ray, D.; Mukhopadhyay, A.; Sengupta, S.; Kar, T.; Ennis, C.J.; Rahman, P.K.S.M. Synthesis and Characterization of PMMA-cellulose Nanocomposites by in Situ Polymerization Technique. J. Appl. Polym. Sci 2012, 126 (Suppl. S1), E127–E134. [Google Scholar] [CrossRef]
  32. Socrates, G. Infrared and Raman Characteristic Group Frequencies: Tables and Charts, 3rd ed.; Wiley: Chichester, UK, 2010; ISBN 978-0-470-09307-8. [Google Scholar]
  33. Suffner, J.; Schechner, G.; Sieger, H.; Hahn, H. In-Situ Coating of Silica Nanoparticles with Acrylate-Based Polymers. Chem. Vap. Depos. 2007, 13, 459–464. [Google Scholar] [CrossRef]
  34. Burunkova, J.A.; Denisyuk, I.Y.; Arefieva, N.N.; Semina, S.A. Influence of SiO2 Nanoaddition on the Self-Organization via UV-Polymerization of Acrylate Nanocomposites. Mol. Cryst. Liq. Cryst. 2011, 536, 242–248. [Google Scholar] [CrossRef]
  35. Szafarska, M.; Olszok, V.; Holländer, U.; Gustus, R.; Weber, A.P.; Maus-Friedrichs, W. Gas Phase Reaction of Silane with Water at Different Temperatures and Supported by Plasma. ACS Omega 2023, 8, 8388–8396. [Google Scholar] [CrossRef]
Figure 1. (a) Closed sample box for in situ monitoring of the curing with Raman spectroscopy; (b) transfer system for transporting coated samples in argon or argon/silane atmosphere from the glove box to the UHV system, without contact with air.
Adhesives 01 00001 g001
Figure 2. Raman spectra of cyanoacrylate on oxidized copper in air at different times between the start and end of the measurement.
Adhesives 01 00001 g002
Figure 3. (a) The determined degrees of curing and (b) the curing rates of the cyanoacrylate in the various process atmospheres of air (blue), argon (red), and argon/silane (green).
Adhesives 01 00001 g003
Figure 4. 10 × 10 µm2 AFM images of PECA films on oxidized copper (CuOx) substrate. The samples were prepared in (a) air, (b) argon, and (c) argon/silane. In the case of (a,b), the film was partially removed with a plastic pipette to expose the underlying substrate and measure the film thickness. The height information is represented by the color: light colors represent higher areas, dark colors mark lower areas. Due to the different topographies, it is not feasible to provide uniform height information.
Adhesives 01 00001 g004
Figure 5. XPS C 1s detail spectra of PECA on CuOx substrate in argon (a) and argon/silane (b). Different film thicknesses or concentrations are shown. Additionally, an uncoated substrate is shown as a reference.
Adhesives 01 00001 g005
Figure 6. IRRAS spectra of different PECA films on oxidized copper substrate. Shown are the complete survey spectrum (a) and an enlarged spectral range (b) between 1200–2000 cm−1 with a normalization to the intensity of the stretching vibration of the carbonyl group. The films were prepared in argon atmosphere in a glove box, and the thickness was varied by the given concentration.
Adhesives 01 00001 g006
Figure 7. IRRAS spectrum of the uncoated oxidized copper substrate after contact with the argon/silane atmosphere in the glove box.
Adhesives 01 00001 g007
Figure 8. IRRAS spectra of different PECA films on oxidized copper substrate. Shown are the complete survey spectrum (a) and an enlarged spectral range (b) between 1200–2000 cm−1 with a normalization to the intensity of the stretching vibration of the carbonyl group. The films were prepared in an argon/silane atmosphere in a glove box, and the thickness was varied by the given concentration.
Adhesives 01 00001 g008
Disclaimer/Publisher’s Note: The statements, opinions and data contained in all publications are solely those of the individual author(s) and contributor(s) and not of MDPI and/or the editor(s). MDPI and/or the editor(s) disclaim responsibility for any injury to people or property resulting from any ideas, methods, instructions or products referred to in the content.

