


Abstract
Standard protection zones and uniform maintenance along linear infrastructure, especially railways, do not reliably capture spatial variability in a real landscape matrix. A more suitable approach is segment-based corridor evaluation grounded in local hazard and exposure assessment. In a model railway corridor in Central Europe, a screening workflow is developed to combine fuel and vertical structure, terrain-driven spread amplifiers, weather, fuel-moisture conditions, and a provisional infrastructure exposure/sensitivity layer. In addition to these environmental layers, geocoded fire and response records are used to build an event layer for segment profiling and historical plausibility checking. The railway corridor was divided into analytical segments, and an environmental and incident profile was compiled for each segment. The pilot application shows observed concentrations of fire incidents in short-track sections and provides a framework for segment typology based on fuel, topography, moisture, weather, and operational factors. The analysis supports targeted vegetation management, future detection-node planning, and a scalable decision chain for other linear critical infrastructure elements. The proposed workflow should be understood as a corridor-scale screening and prioritization framework, not as a statistically validated hotspot model or a component-specific infrastructure risk score.
1. Introduction
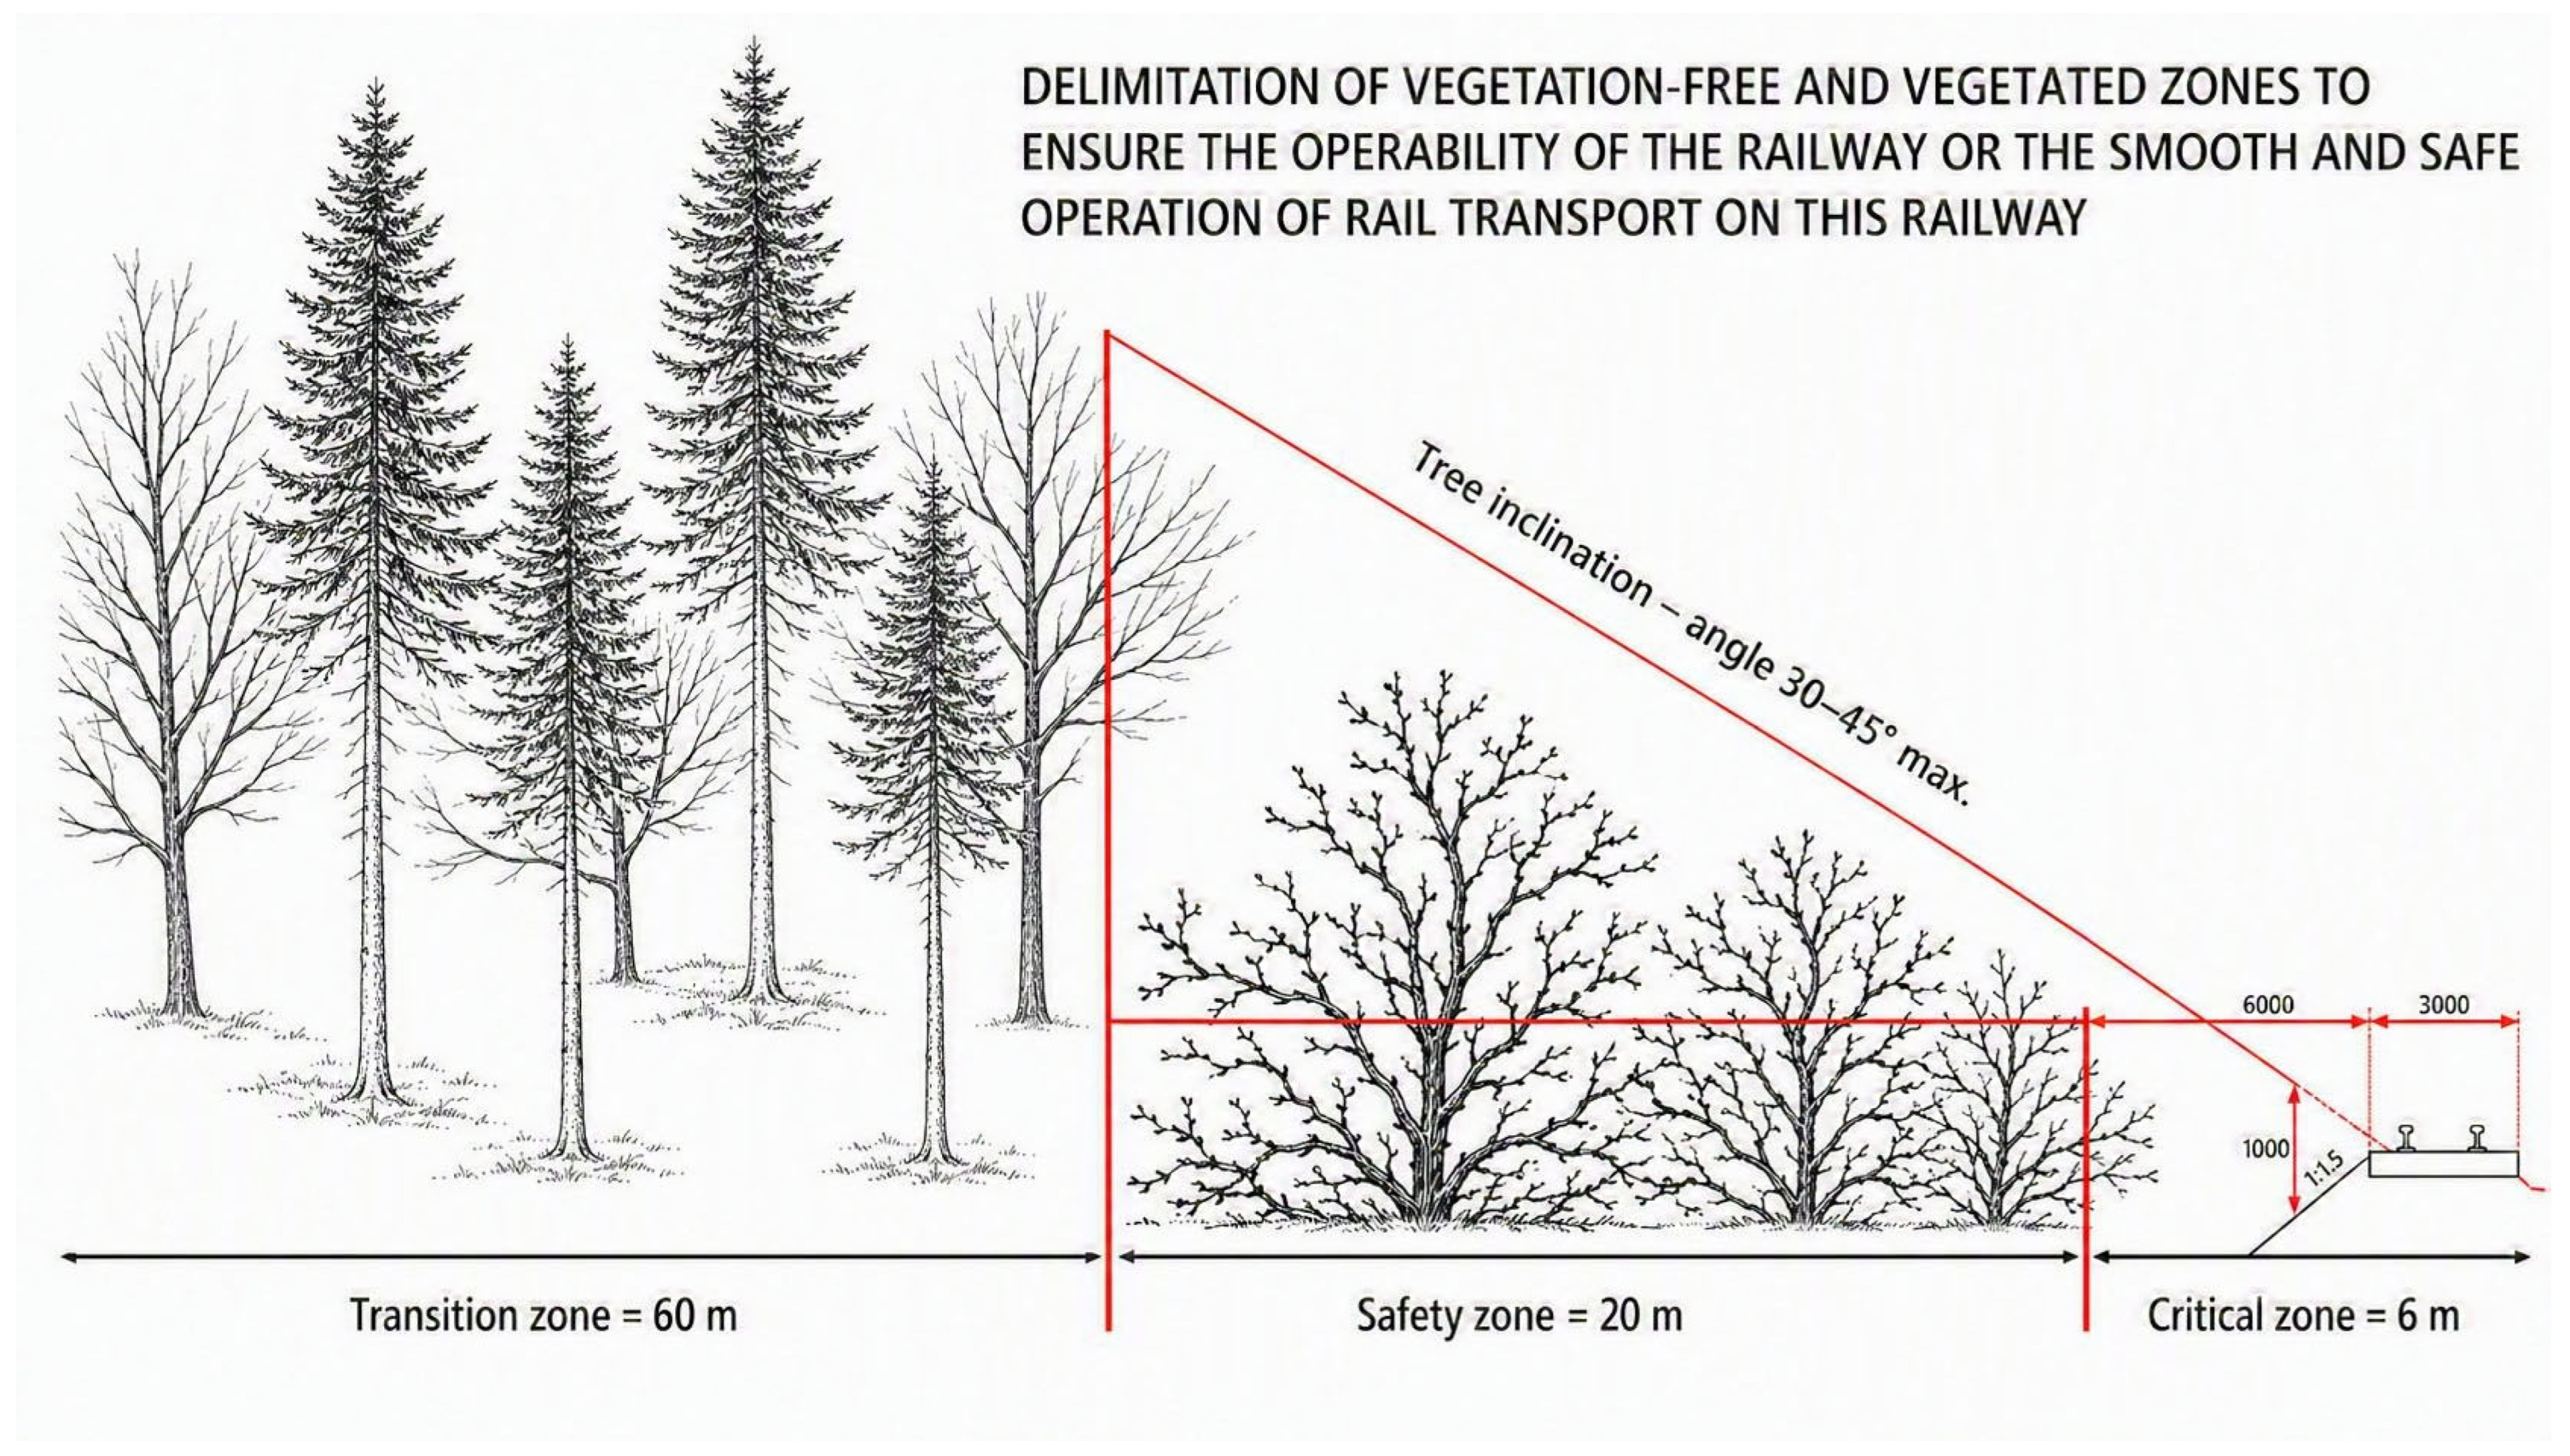
Critical infrastructure, such as railways, power grids, pipelines, and telecommunications networks, is essential to services, human activities, and the economy; its disruption has significant safety and socioeconomic consequences. Wildland fires increasingly threaten these assets, particularly during periods of drought, high temperatures, and wind events that elevate ignition risk and facilitate fire propagation [1,2]. Fires have led to service disruptions, exemplified by the summer fires of 2025 and the week-long closure of the Madrid–Galicia high-speed line [3]. Infrastructure corridors are susceptible: landscape fires can jeopardize assets, and infrastructure itself can serve as a source of ignition [4]. Vegetation, land use, and landscape features influence ignition probabilities and fire behavior. Trackside vegetation management affects fire risk: improper mowing practices or leaving biomass can generate fuels conducive to rapid fire spread, as illustrated in Figure 1 [5]. Given the variability in fuels, terrain, and weather conditions, broad management strategies are difficult to justify; instead, targeted, segment-specific management approaches are more appropriate, particularly where historical records indicate recurring concentrations of incidents [6]. Utilizing a model railway system in Central Europe, this study investigates the issue. It proposes spatial hazard and exposure assessments along railway lines to facilitate targeted prevention during periods of elevated risk.
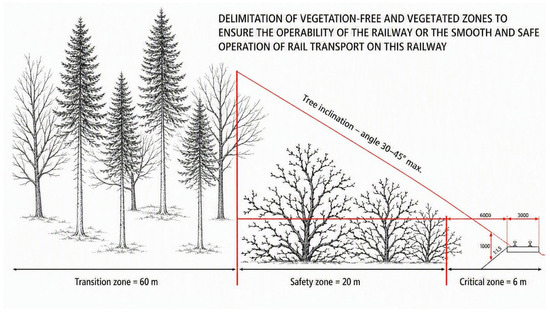
Figure 1.
Prescribed vegetation-management zones along a railway corridor include a 60 m transition zone, 20 m safety zone, and 6 m critical zone to ensure railway operability and safety. There is a typical fuel cascade with vegetation in the transition zone, with tree inclination limited to 30–45° [7].
2. Materials and Methods
2.1. Wildfire Risk as an Interaction of Factors and GIS Segmentation
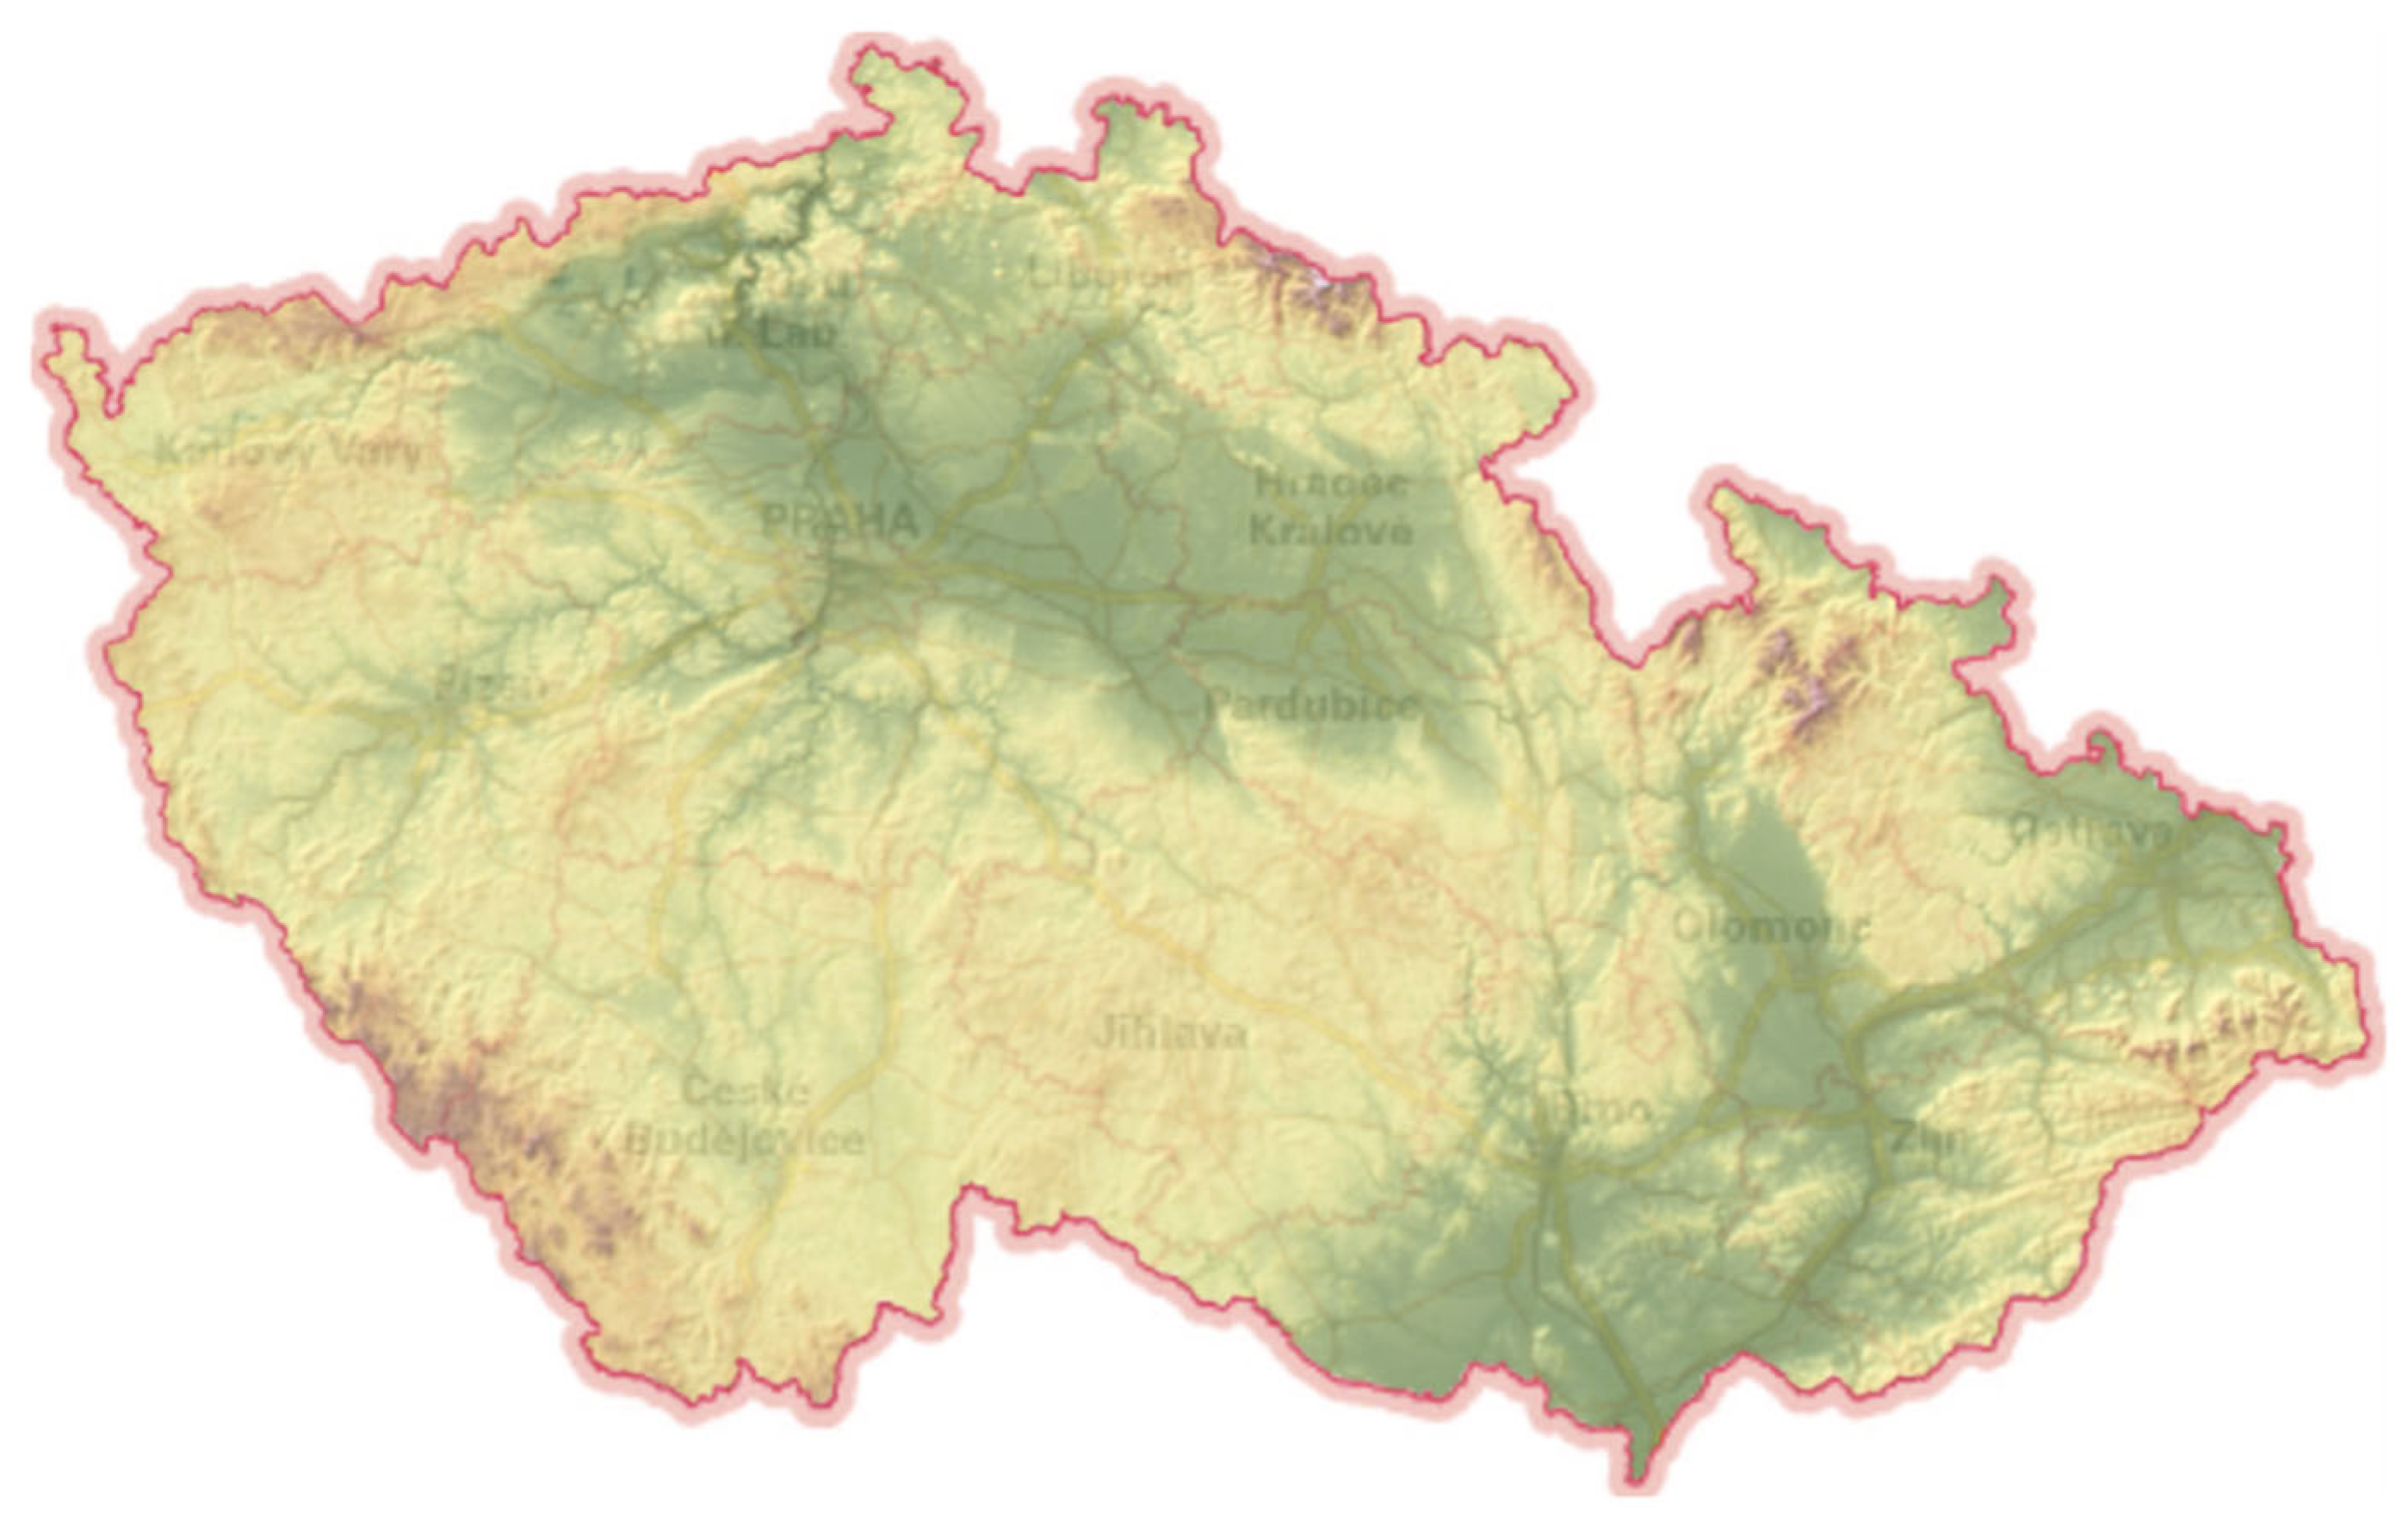
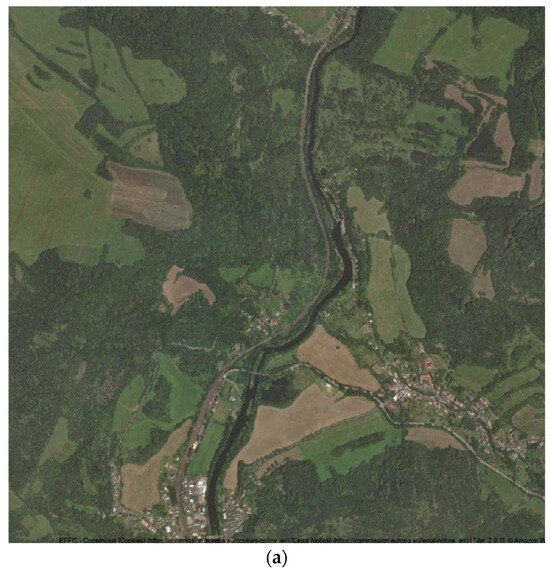
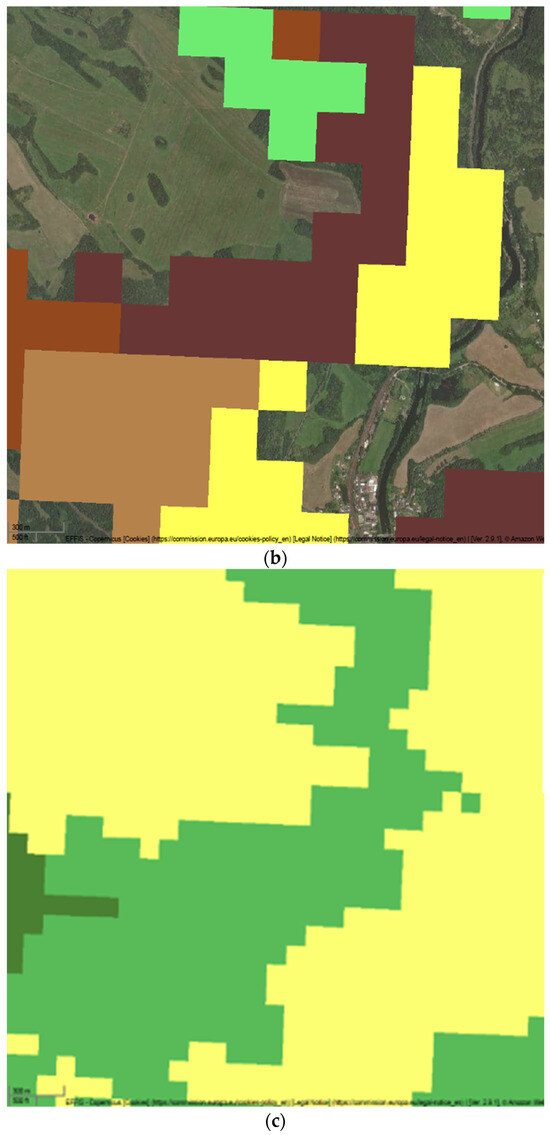
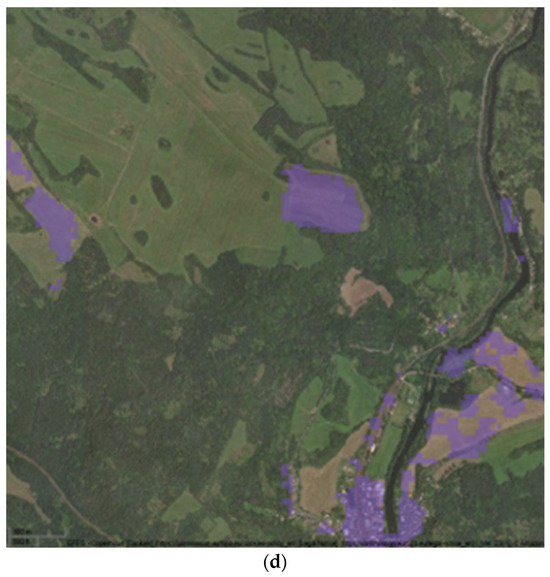
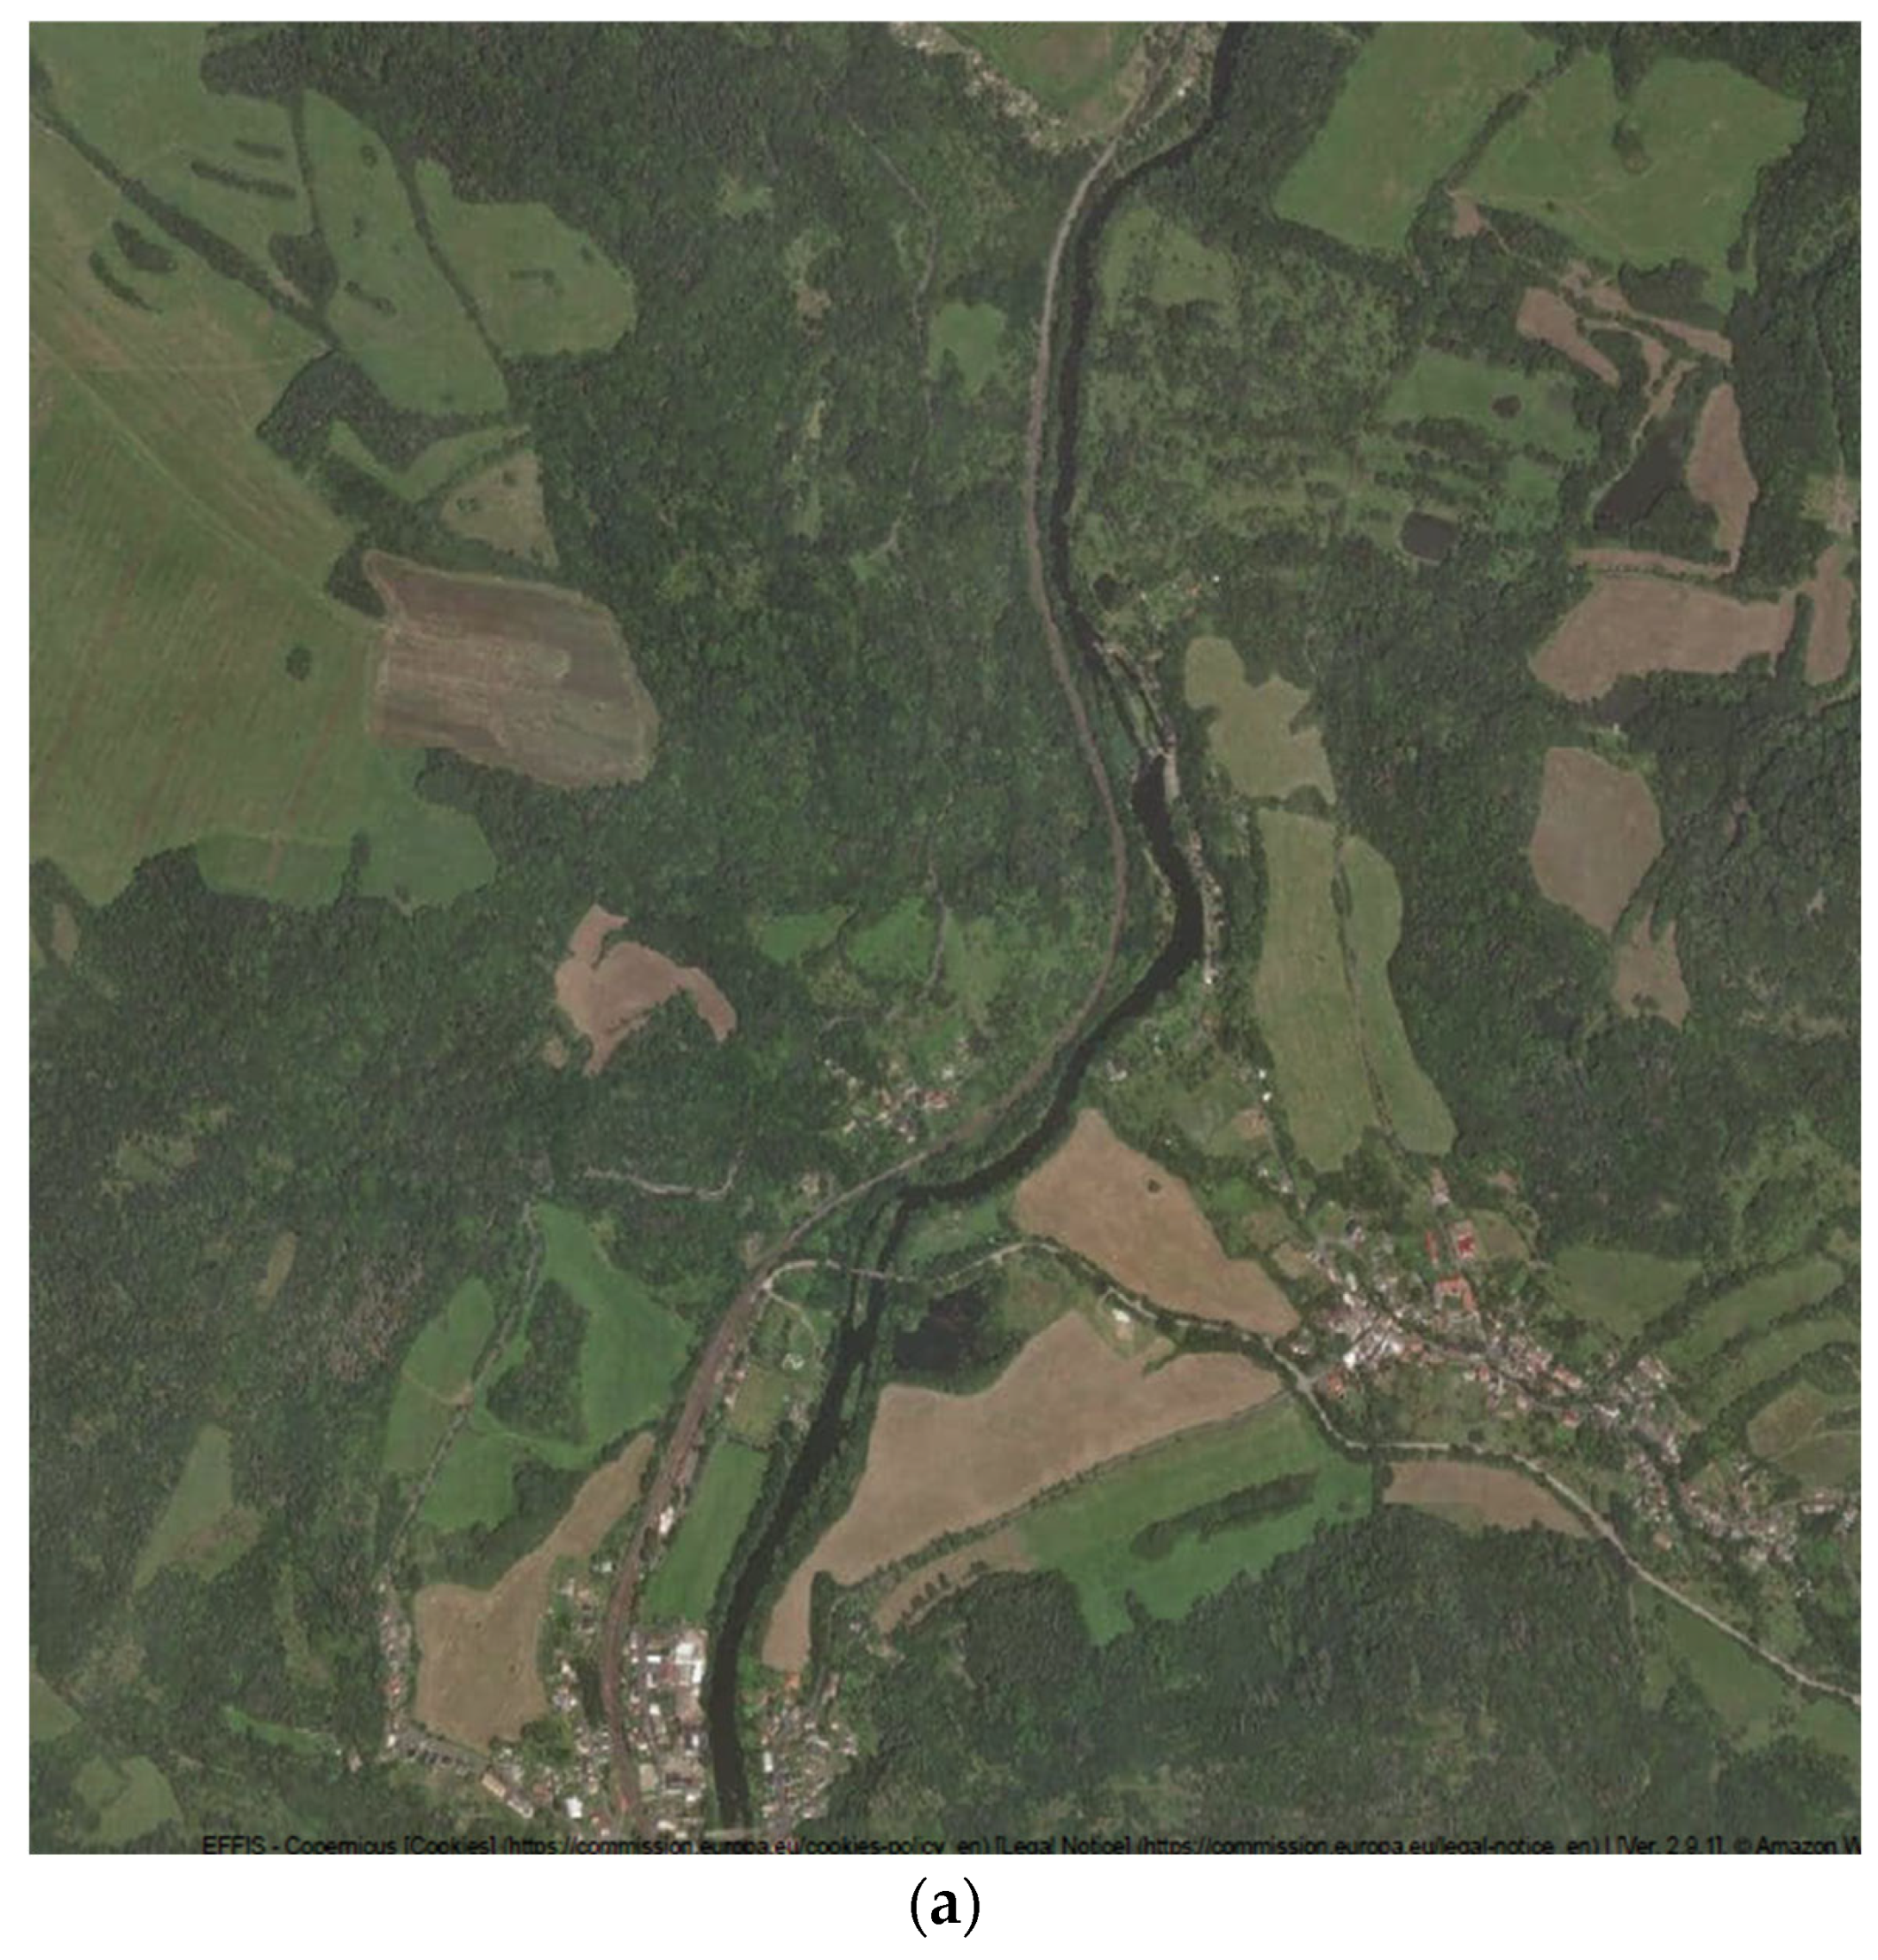
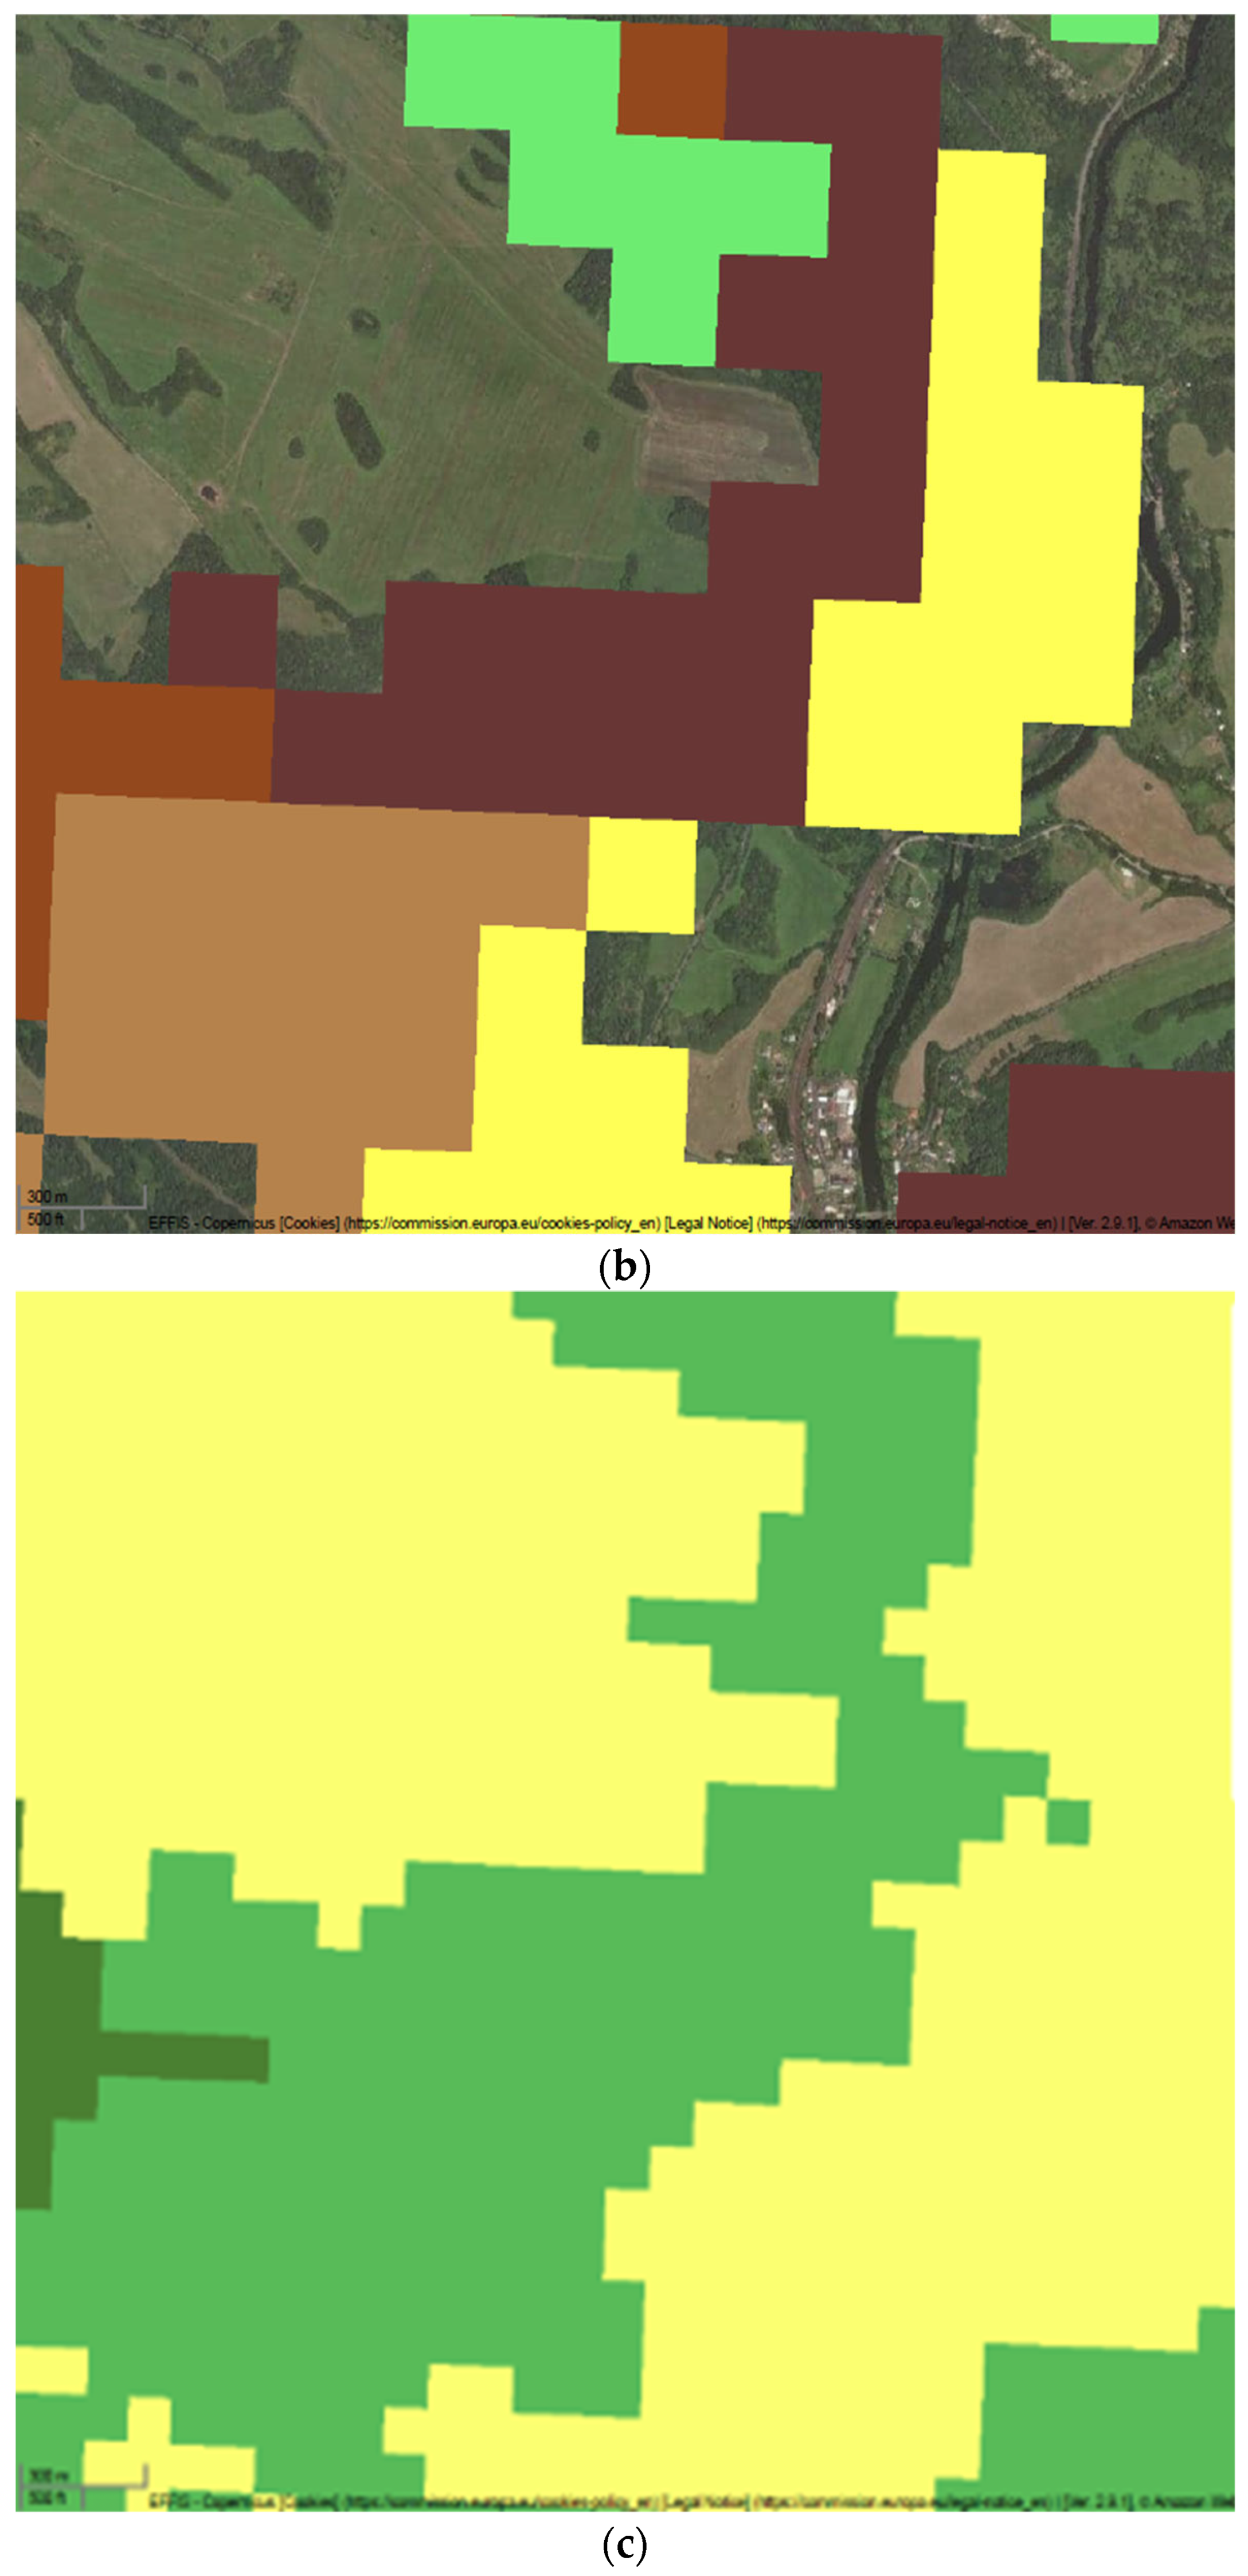
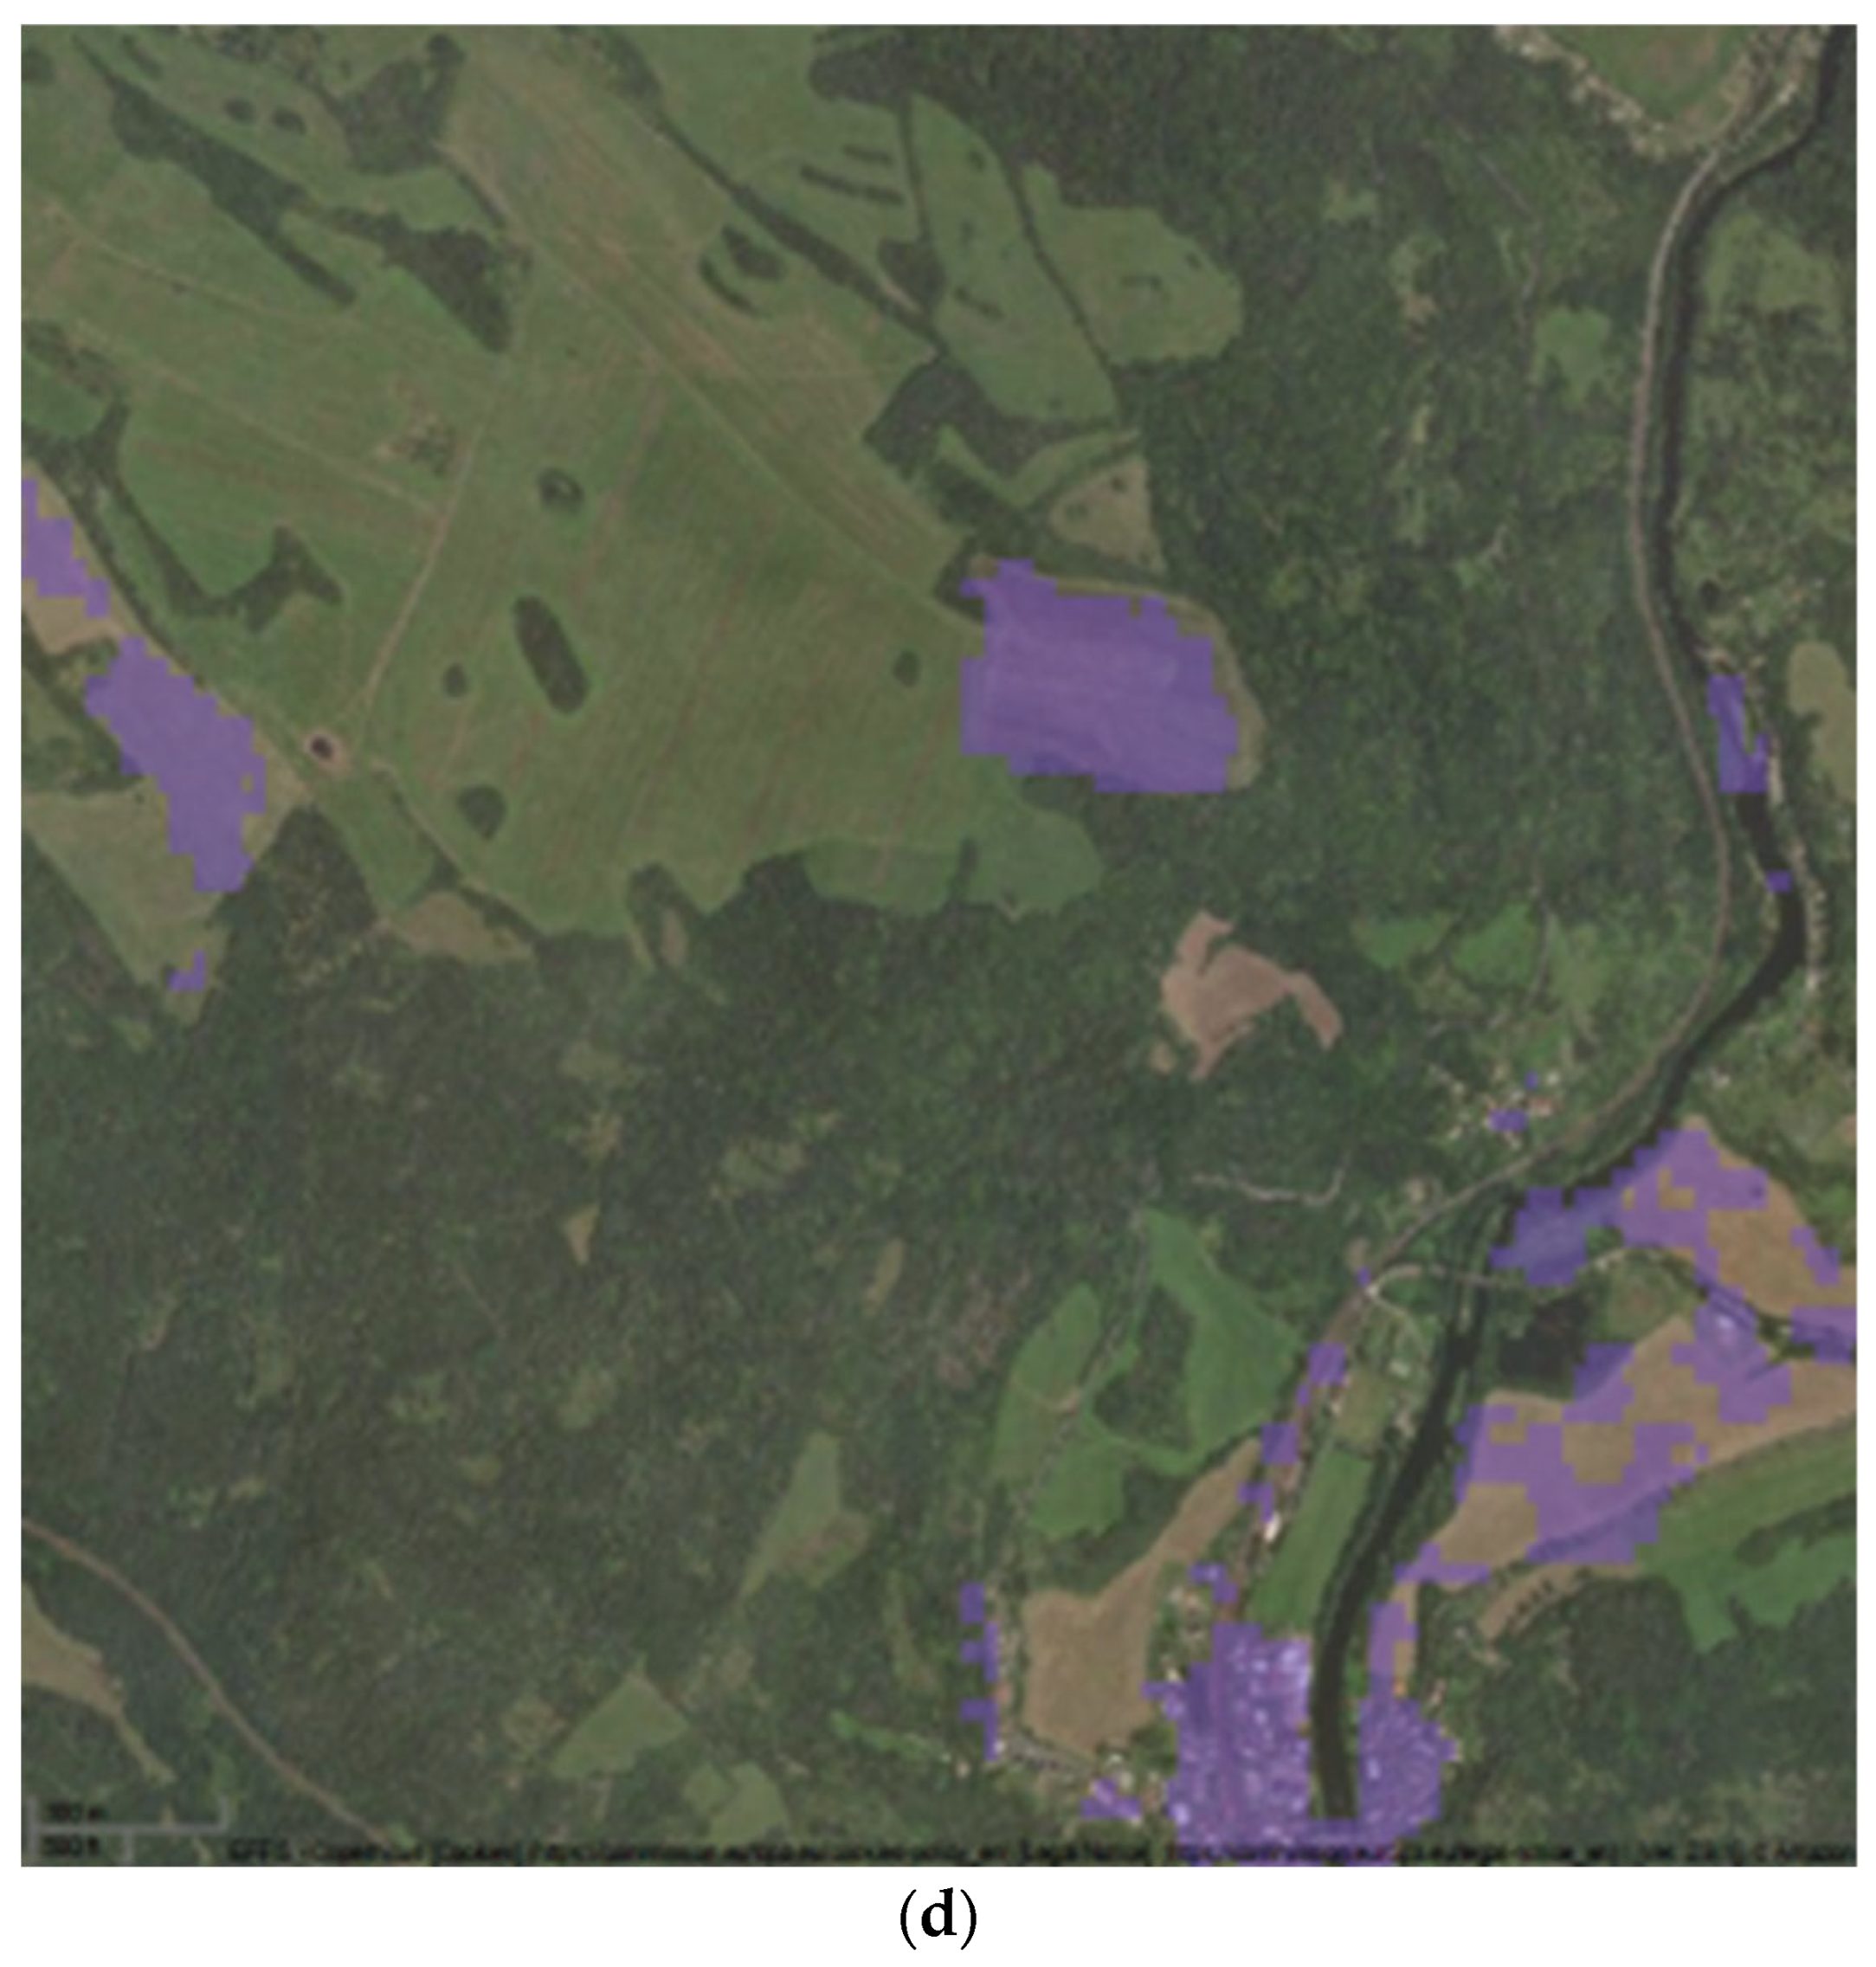
The study posits that wildfire risk within infrastructure corridors stems from exposure to landscape fires and the likelihood of ignition from railway operations and land use, resulting in spatial concentrations. It introduces three hypotheses: (H1) fire incidents along railway lines may form candidate spatial concentrations [7]; (H2) these are affected by factors such as fuel, terrain, weather, operational conditions, and track features [8]; and (H3) uniform protection zones and maintenance strategies do not uniformly mitigate risk across heterogeneous segments. Management approaches are tailored to specific segments, reflecting the corridor’s heterogeneity. In the Czech Republic, vegetation varies from the lowlands to the mountain regions [9,10]. leading to rapid changes in fuel conditions (see Figure 2) [11]. The EFFIS [2] and CORINE datasets are used as contextual layers because their low resolution is insufficient for detailed local analysis, as illustrated by the comparison in Figure 3. A unified railway track centerline was integrated into a GIS framework that incorporated elevation, geology, soil, water, settlement, water bodies, roads, and habitat data, all harmonized to assign relevant attributes (Figure 4) [10,12,13,14,15]. The corridor comprises various vegetation zones and a 100 m buffer zone, segmented into 500 m intervals with detailed attribute data. Field surveys further refined these segments, supported by habitat data, thereby forming the foundation for hazard and exposure assessments.
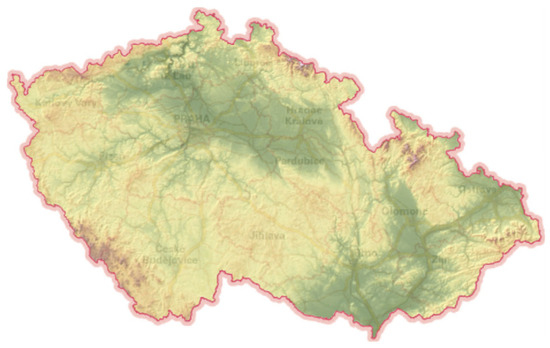
Figure 2.
The geomorphology of the Czech Republic delineates characteristic biotope transitions along the gradient from lowlands to the border mountains [2].
Figure 3.
The comparison local aerial imagery with broad reference layers for landscape interpretation: (a) railway corridor aerial image; (b) EFFIS fuel classification; (c) CORINE land cover; and (d) settlement layer. These overlays show that European products can misrepresent or oversimplify fragmented landscapes. Therefore, these serve only as supporting context [12].
Figure 4.
Three-dimensional visualization of the railway corridor and vegetation-management zones. The dashed line represents the railway line, including its vegetation-management/protection zones, running through the centre of the 3D scene. Green polygons in different shades represent areas with different vegetation types. Yellow outlines indicate polygons with cascading fuel structures, while red outlines indicate polygons with potential ladder fuels. Habitat labels were omitted from the figure to improve legibility. However, all vegetation polygons are linked to the GIS attribute database, which enables subsequent vegetation inventory, classification, and further spatial analysis.
2.2. Meteorological Scenario, Fuel-Model Crosswalk, and Fuel-Moisture Characterization
The screening workflow was parameterized utilizing meteorological, index, fuel- model, and moisture variables pertinent to ignition, spread, and exposure. Meteorological inputs comprised CHMI wind, temperature, humidity, and precipitation data [16]; FireRisk spread potential, moisture, and Fire Weather Index outputs [17]; and products from the Institute of Atmospheric Physics describing local wind direction, frequency, and speed [16,18]. FireRisk was employed solely to identify the lowest dead fuel moisture episode, rather than to reconstruct fire-weather conditions [17,18]. Atmospheric stability was preserved exclusively to retain smoke and enhance visibility, and a high-risk “hypothetical day,” modeled after adverse conditions in August 2025, served as a consolidated scenario input. Habitats were translated into Scott & Burgan FBFM 40 fuel models through a field-verified interpretative crosswalk refined by comparison between expected and modeled behavior [19,20]. Since fuel models characterize fuel-bed structure rather than vegetation taxonomy, polygons were assessed based on dominant fuel layer, fuel-bed height, curing status, shrub cover, litter, woody debris, and vertical continuity. Final selection criteria included structural dominance, depth, continuity, curing, and the presence of shrub or understory fuels. The fuel distribution map [11,21], which assigned models to segments, supported spatial fuel interpretation (see Figure 4 and Figure 5). Moisture characterization integrated in situ soil moisture, soil and air temperature measurements, laboratory moisture content assessments, and FireRisk-derived Dead Fuel Moisture Content (DFMC). Live Fuel Moisture Content (LFMC) was represented for grass (GR), grass-sedge (GR), and shrub (SH) fuels, and DFMC for three dead fuel classes. Baseline LFMC ranges were established using Mediterranean shrub data and Scott & Burgan scenarios, adjusted by measurements obtained from the Ohře valley [22,23,24,25]; DFMC values were derived from the same “hypothetical day” scenario [16,17]. Samples of Calamagrostis epigejos, Poa pratensis, Prunus spinosa, and mixed forest litter were analyzed for moisture content, heat release, and heat of combustion. These analyses did not serve as model inputs but supported the interpretation of fuel reactivity and ignition propensity (Table 1 and Table 2).
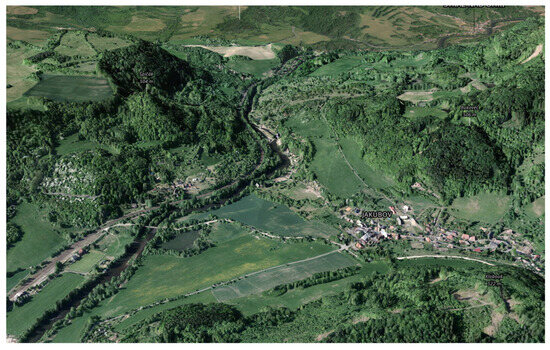
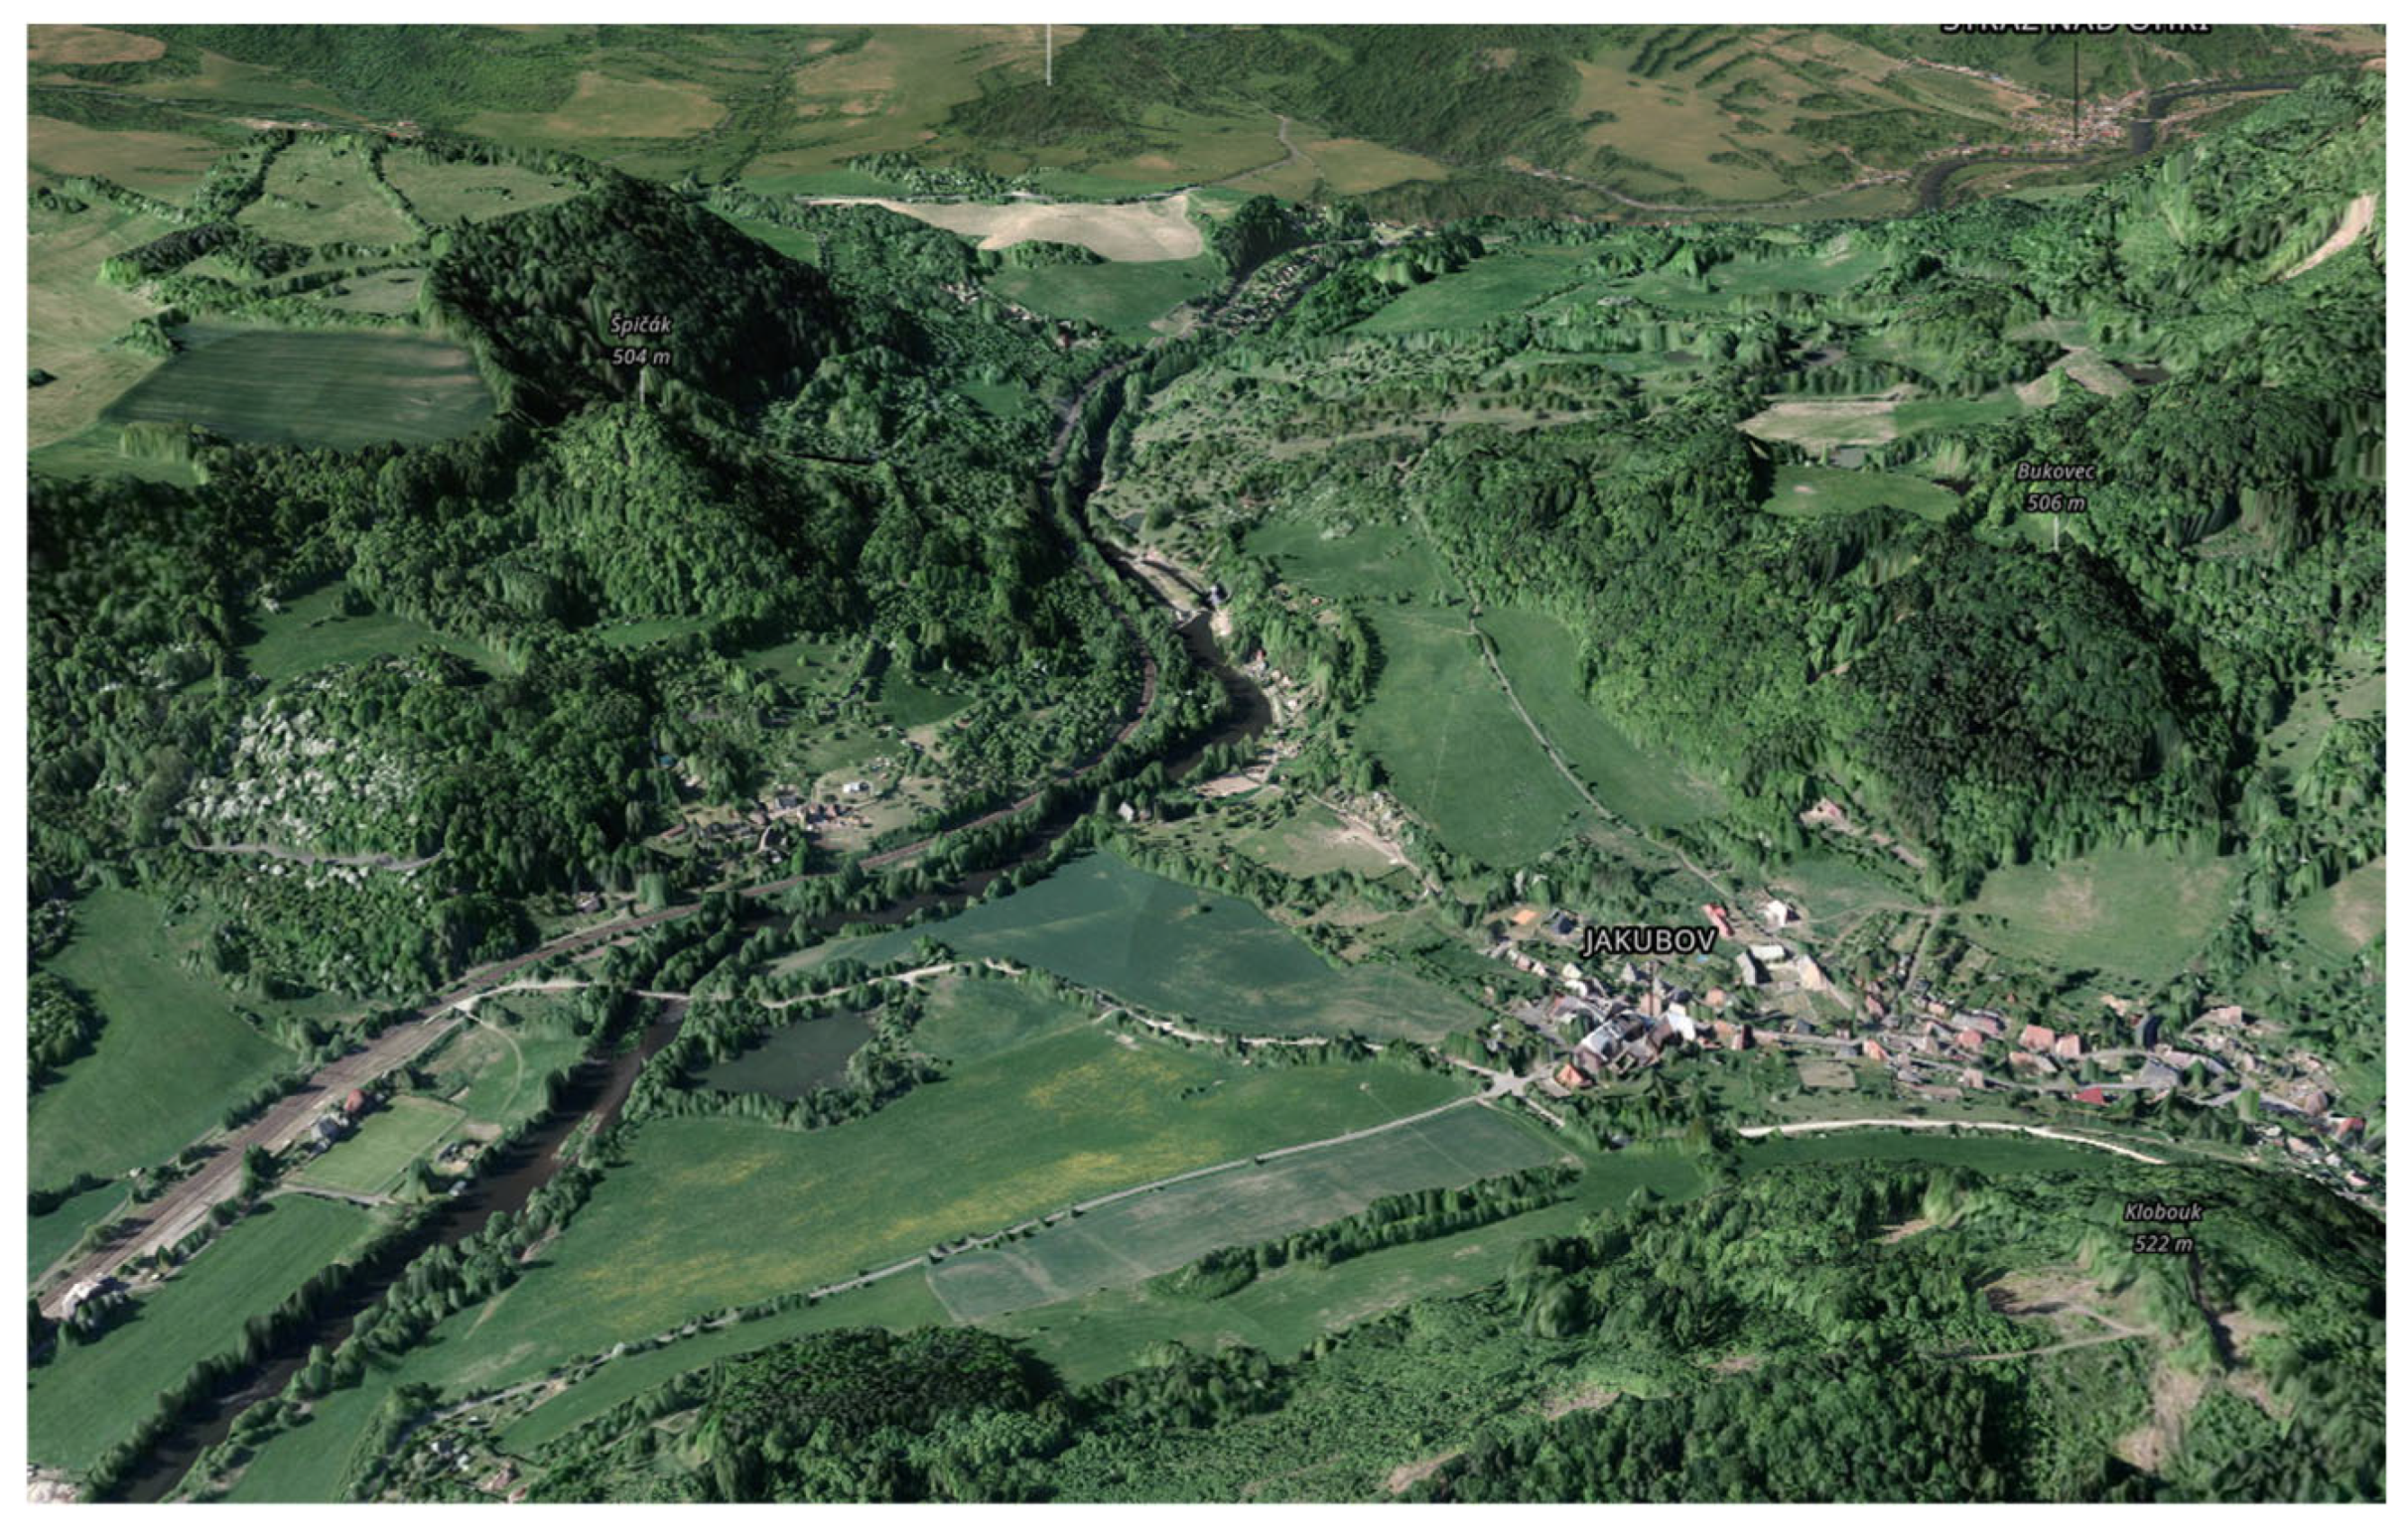
Figure 5.
A three-dimensional view of the study area shows the railway corridor amid settlements, farmland, the river corridor, and forested slopes [26].
Table 1.
The table presents humidity, heat release rates, and total heat release for vegetation fuels from the railway corridor, measured using cone calorimetry.
Table 2.
MARHE, ignition time, and heat of combustion for vegetation samples from the railway corridor.
2.3. Modeling and Validation
Surface fire spread was modeled using the Rothermel model within BehavePlus for selected 500 m railway segments, employing the prepared segment database [5,19]. Each segment was characterized by parameters including terrain (Figure 6), soil, hydrology, settlement, infrastructure, habitat, fuel model (Figure 7), live and dead fuel moisture, wind conditions, and the conservative high-danger meteorological scenario described above [9,10,16,17,19]. The workflow yielded comparable outputs—spread direction, rate of spread, fire geometry, fire area, flame length, and spotting distance—as indicators of potential exposure under consistent assumptions [5,19] and for assessing the effects of fuel, terrain, moisture, and wind. Validation was conducted as a screening-level plausibility check. The geocoded incident layer was utilized to identify observed concentrations of railway fires along short corridor sections [7,8], while the Ostrov case study compared modeling assumptions with recorded occurrences, seasonality, ignition information, response records, and fire-size categories [7]. This approach supports the scenario envelope, rather than the exact geometry or timing of modeled fire fronts.
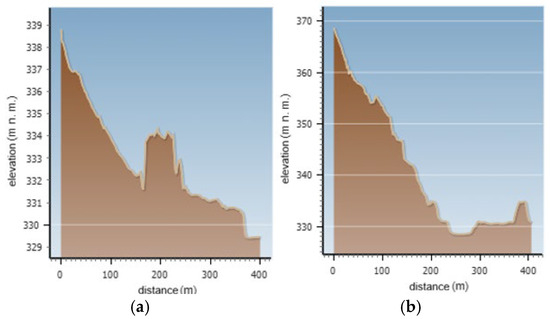
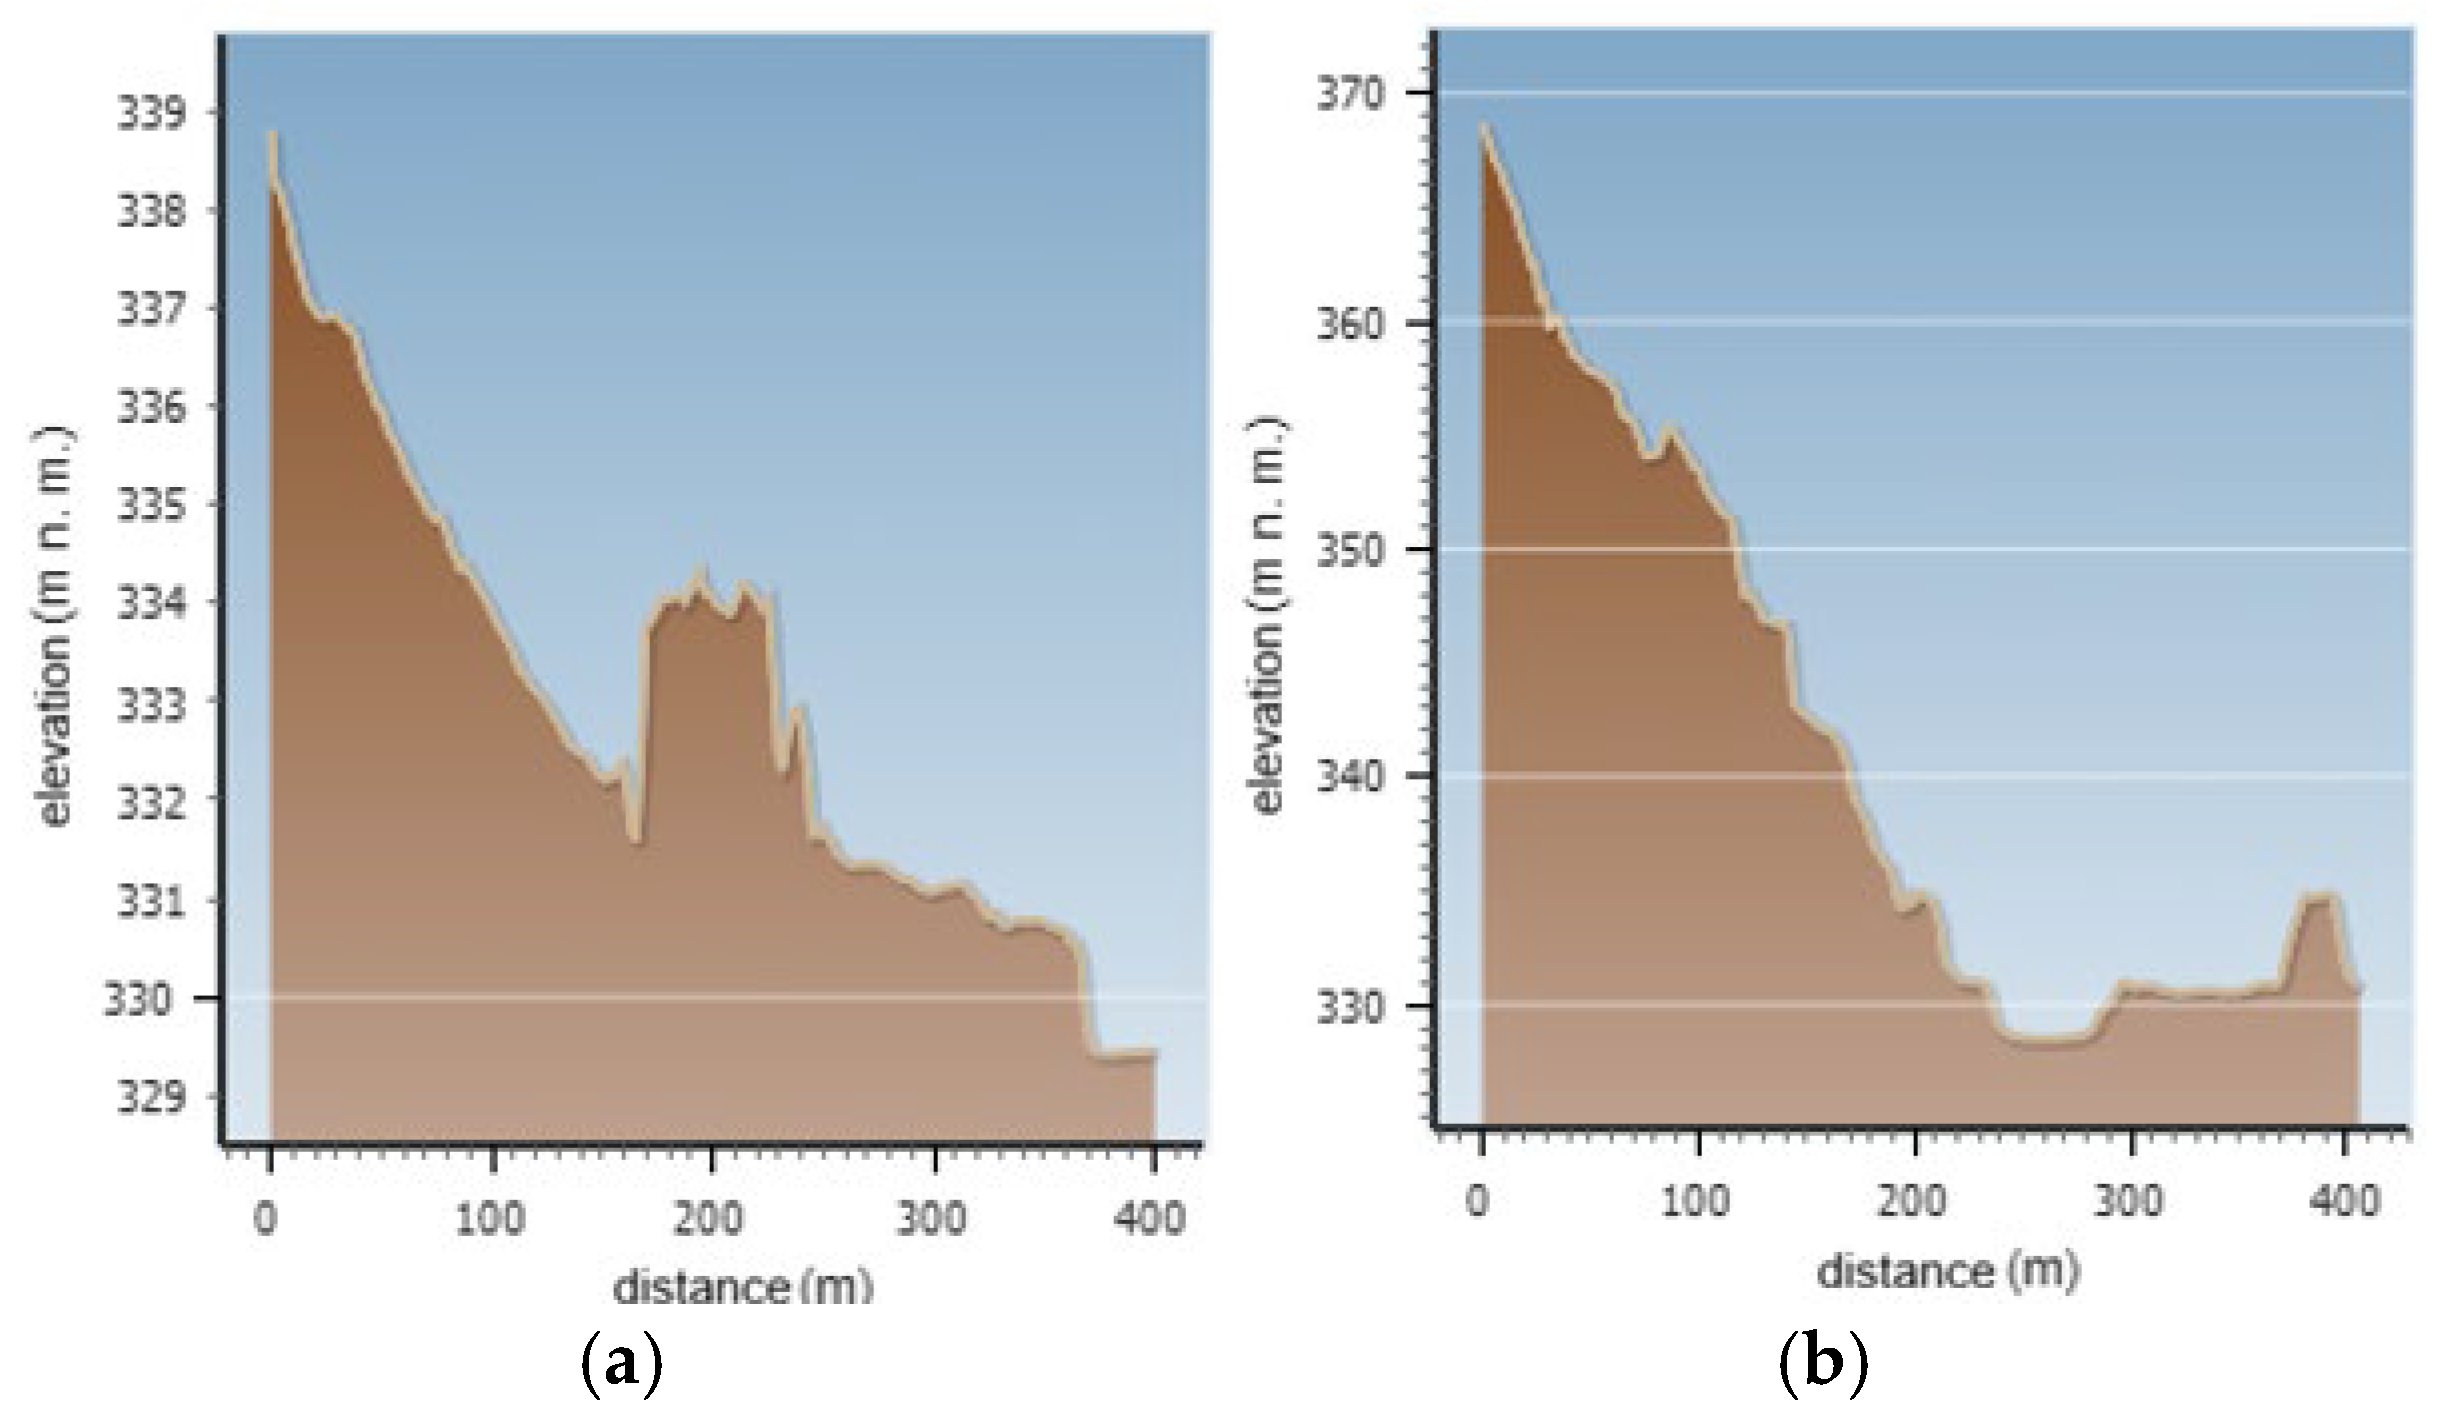
Figure 6.
Characteristic terrain profiles of selected assessed track sections, showing elevation changes over a distance of approximately 400 m [12]. (a) shows the cross-section at the beginning of the 500 m section, while (b) shows the cross-section at its end.
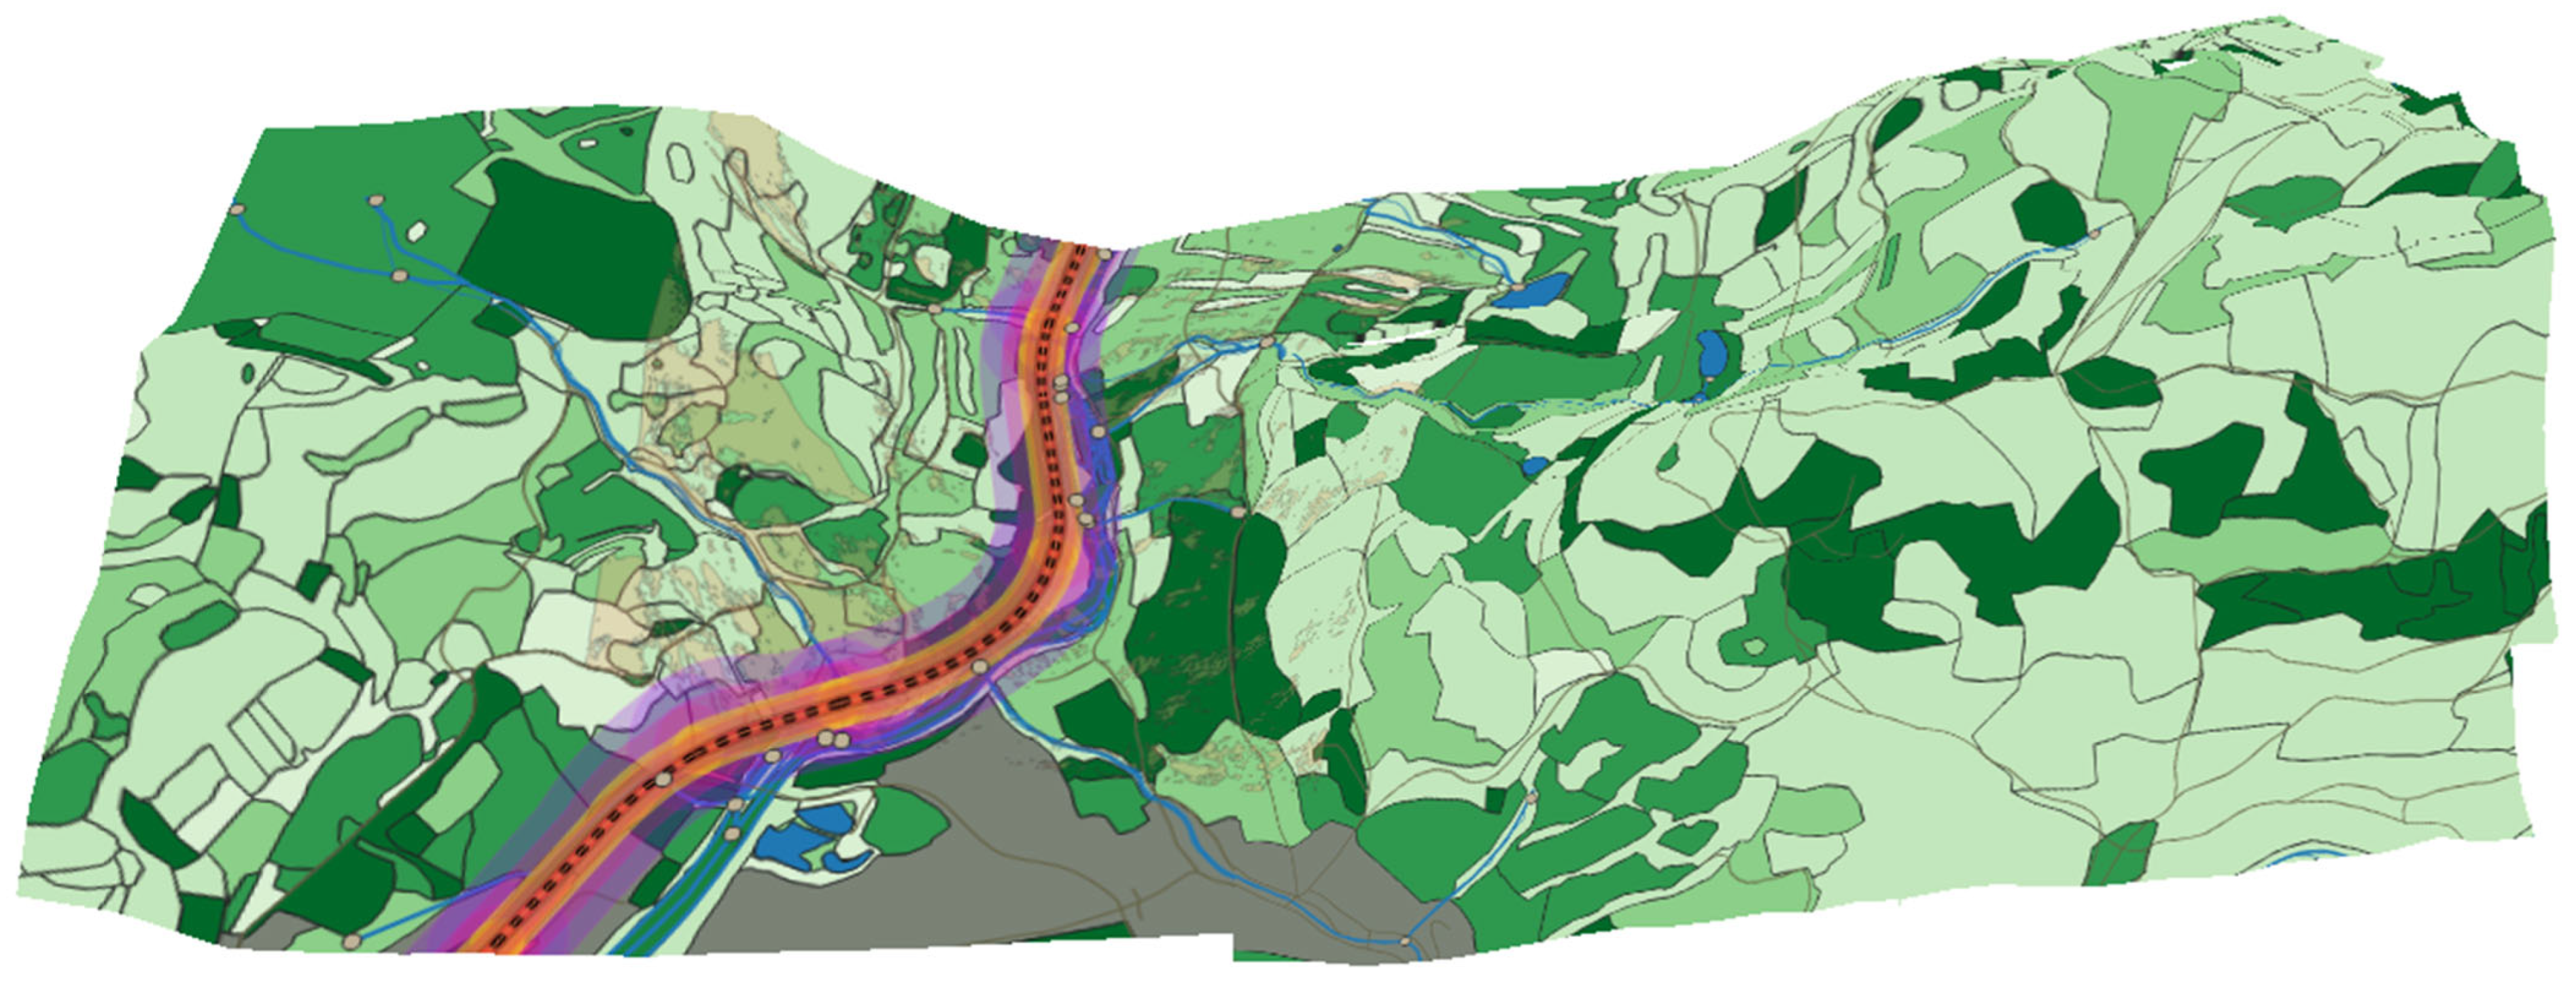
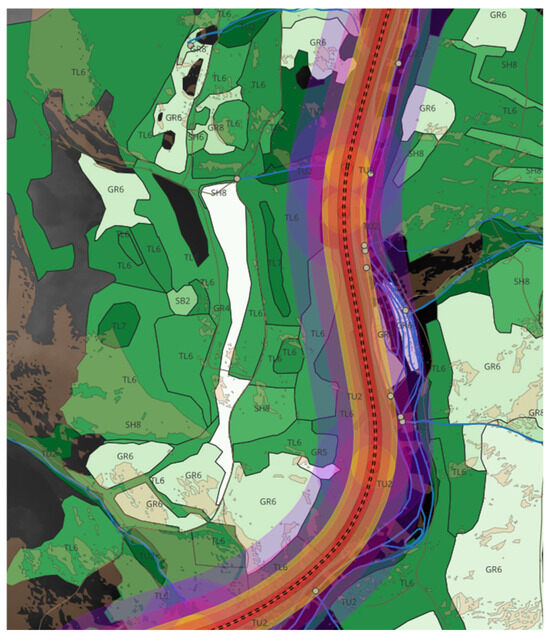
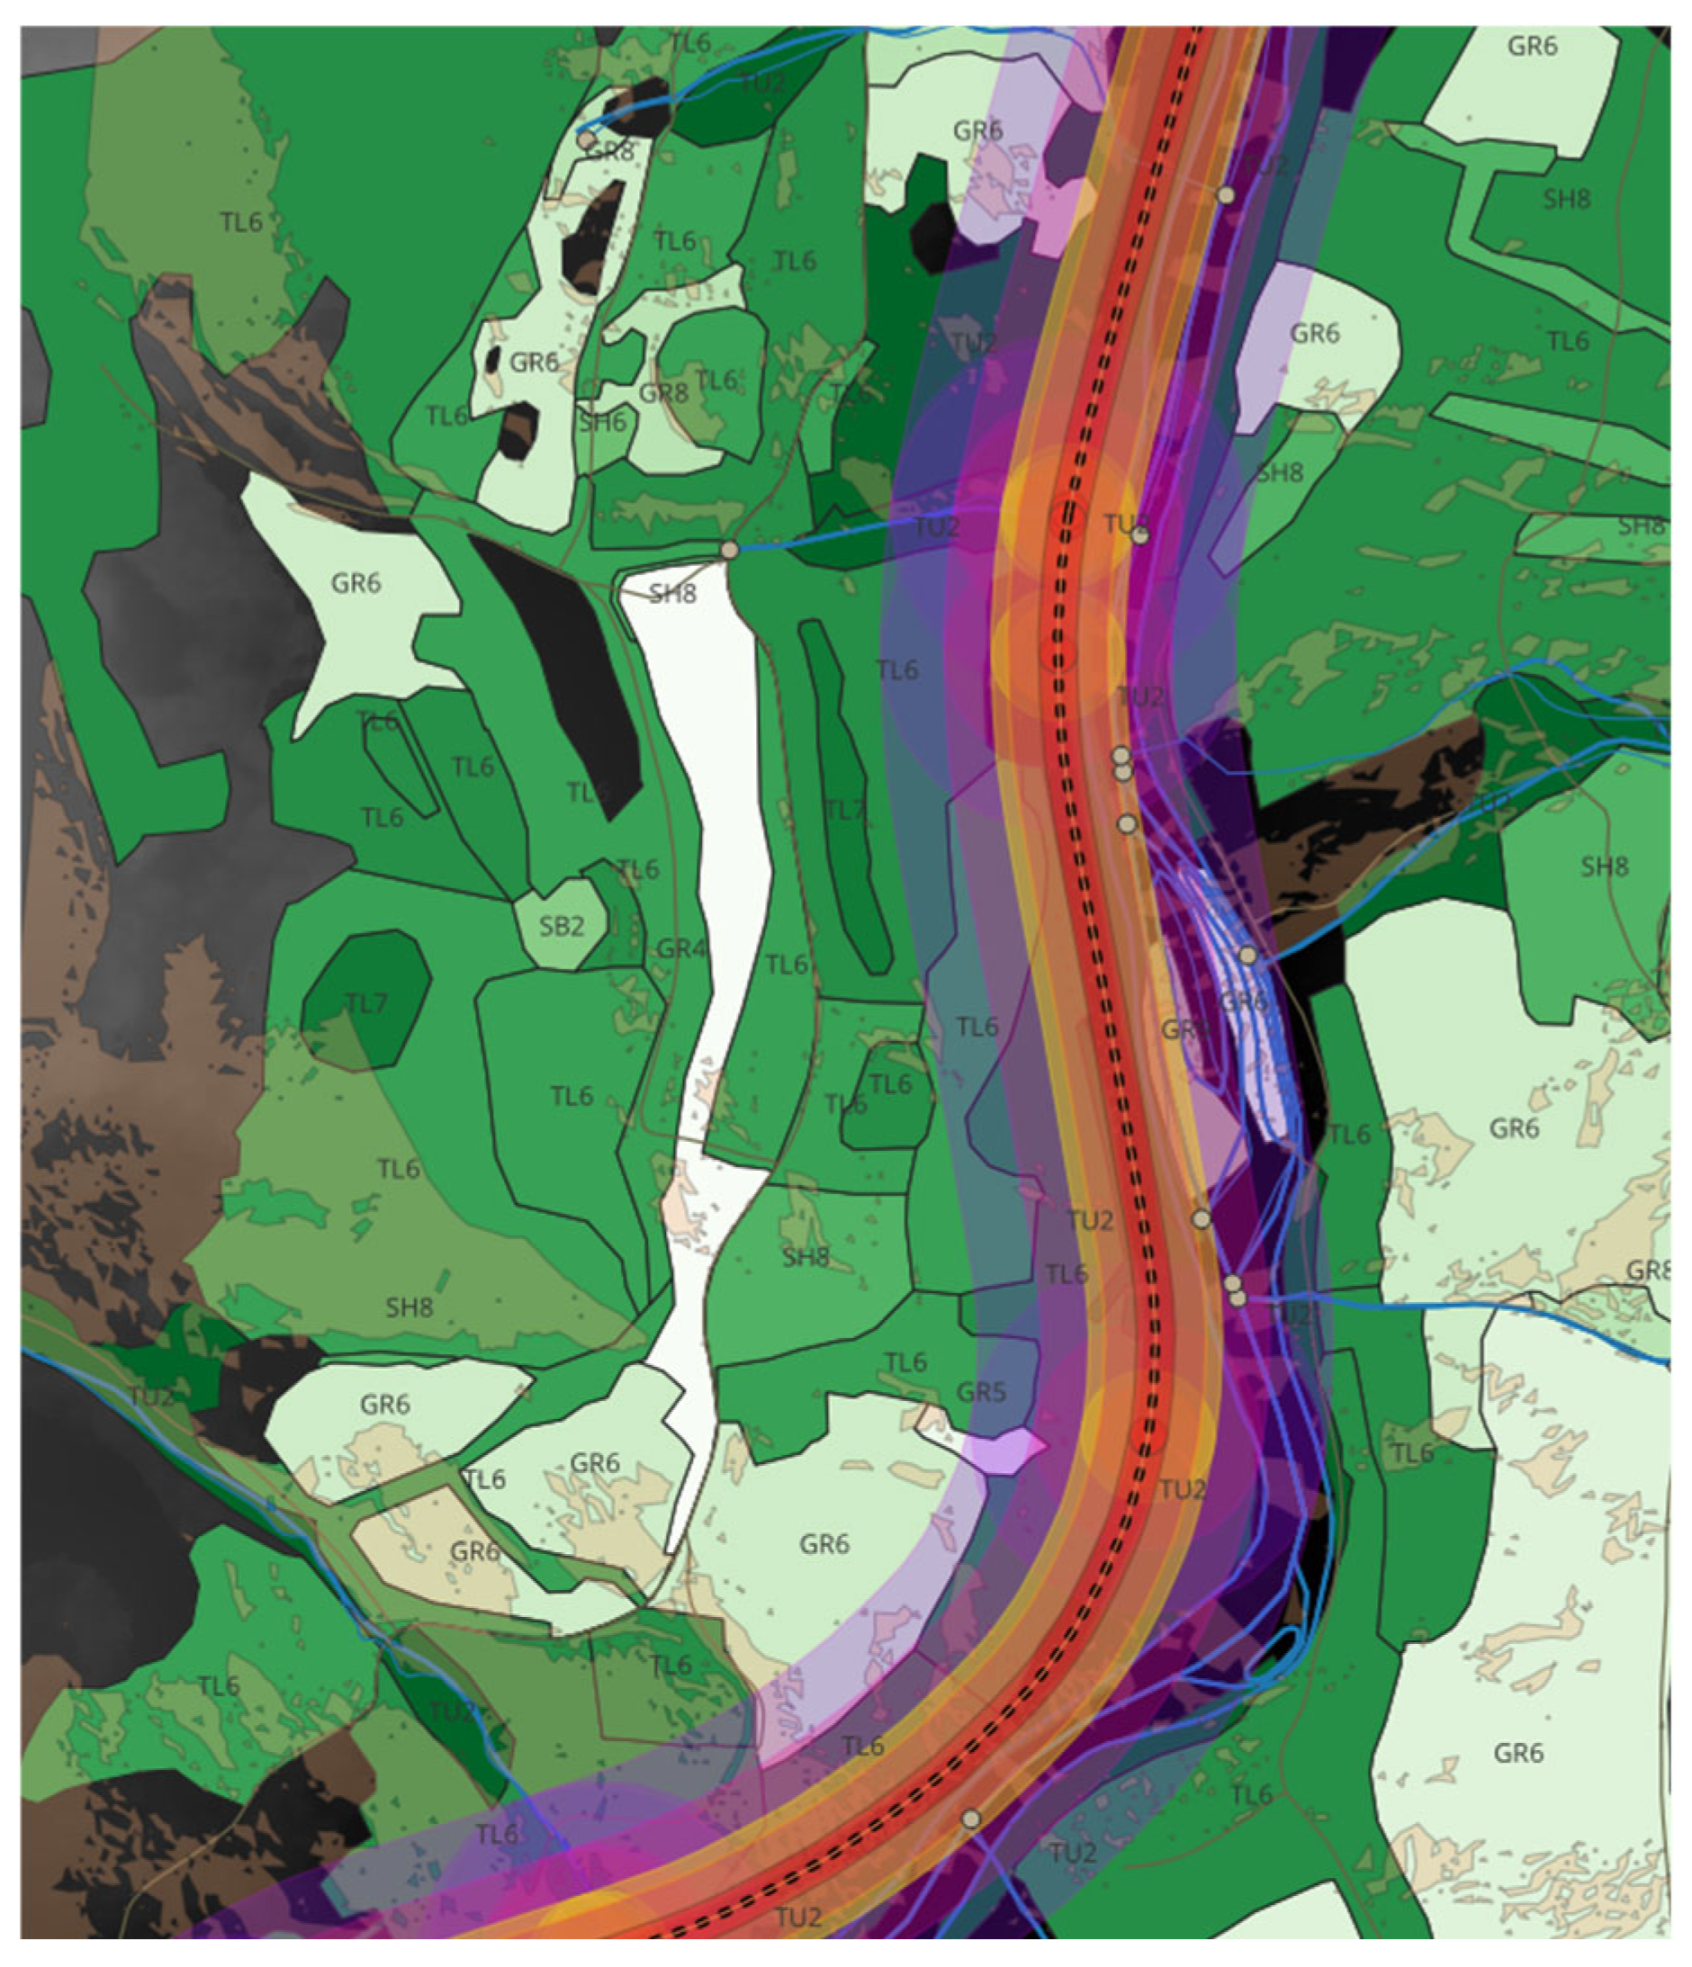
Figure 7.
The map shows the distribution of fire-behavior fuel models along the railway corridor. Green polygons represent expected fuel models. The dashed line indicates the railway, with surrounding-colored bands showing vegetation management zones. South-facing slopes and protection zones highlight biotope areas where fuel continuity, slope, and proximity to the railway may increase fire risk. Some overlaps are due to GIS layer integration and do not affect interpretation, as polygon attributes were evaluated in the GIS database.
3. Results
3.1. Landscape Setting, Soil Pattern, and Hydrology
The examined section near Jakubov, situated between Ostrov nad Ohří and Klášterec nad Ohří within the Ohře River valley of the southern Ore Mountains, is located at an elevation of 330–370 m above sea level. Railway No. 140 runs beneath the slope, near the river, traversing a mosaic of settlements, roads, meadows, farms, and forested higher ground (Figure 8). Infrastructure, including roads and bridges, facilitates access but also concentrates human activity and ignition sources. Slopes pertinent to fire hazards descend toward the railway over several hundred meters, with an elevation difference of 10–40 m and predominantly west-to-northwest aspects, which promote afternoon heating, subsequent fuel drying, and an increased potential for fire spread. Soils correspond to the valley–slope gradient. Haplic Fluvisols (FLm) dominate the floodplain and valley bottom, retaining moisture, reflecting groundwater influence, and supporting slower-drying herbaceous fuels. Near Jakubov, Vojkovice, and at slope transitions, Stagnic Cambisols (KAg) and locally Eutric Stagnic Cambisols (KAgb′) suggest temporary stagnation, particularly within hydrological group D. Broader slopes feature Haplic Cambisols (KAm) and Eutric Cambisols (KAb′), characterized by moderate to high water retention but rapid drying. Steeper or erosion-prone slopes include types such as KAy, KAsb′, LIb′, and RNtb′, which exhibit low retention capacity, rapid drainage, and high tendencies toward drying. Soil groups A and B are predominant in agricultural and sloped terrains, while group D indicates poorer drainage conditions. Water retention is high in floodplain and lower slopes (~200–300 mm), but may decrease to below 100 mm in shallow skeletal soils and Leptosols. Soil moisture content ranged from 28 to 38% in Cambisols and 35–40% in alluvial soils. The Ohře River is the primary hydrological axis near the railway, with a channel width of at least 35–40 m, typically 40–70 m, and locally up to 80–100 m. Tributaries, drainage lines, ponds, oxbow-like depressions, and flooded areas generate wetter zones and may disrupt the continuity of fine fuels.
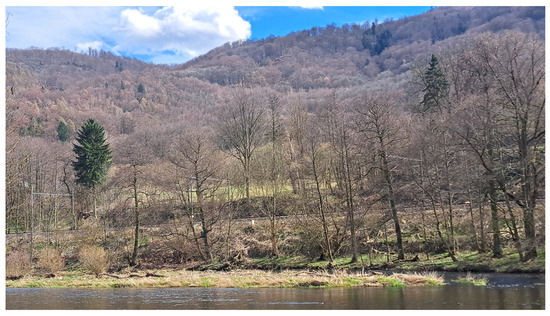
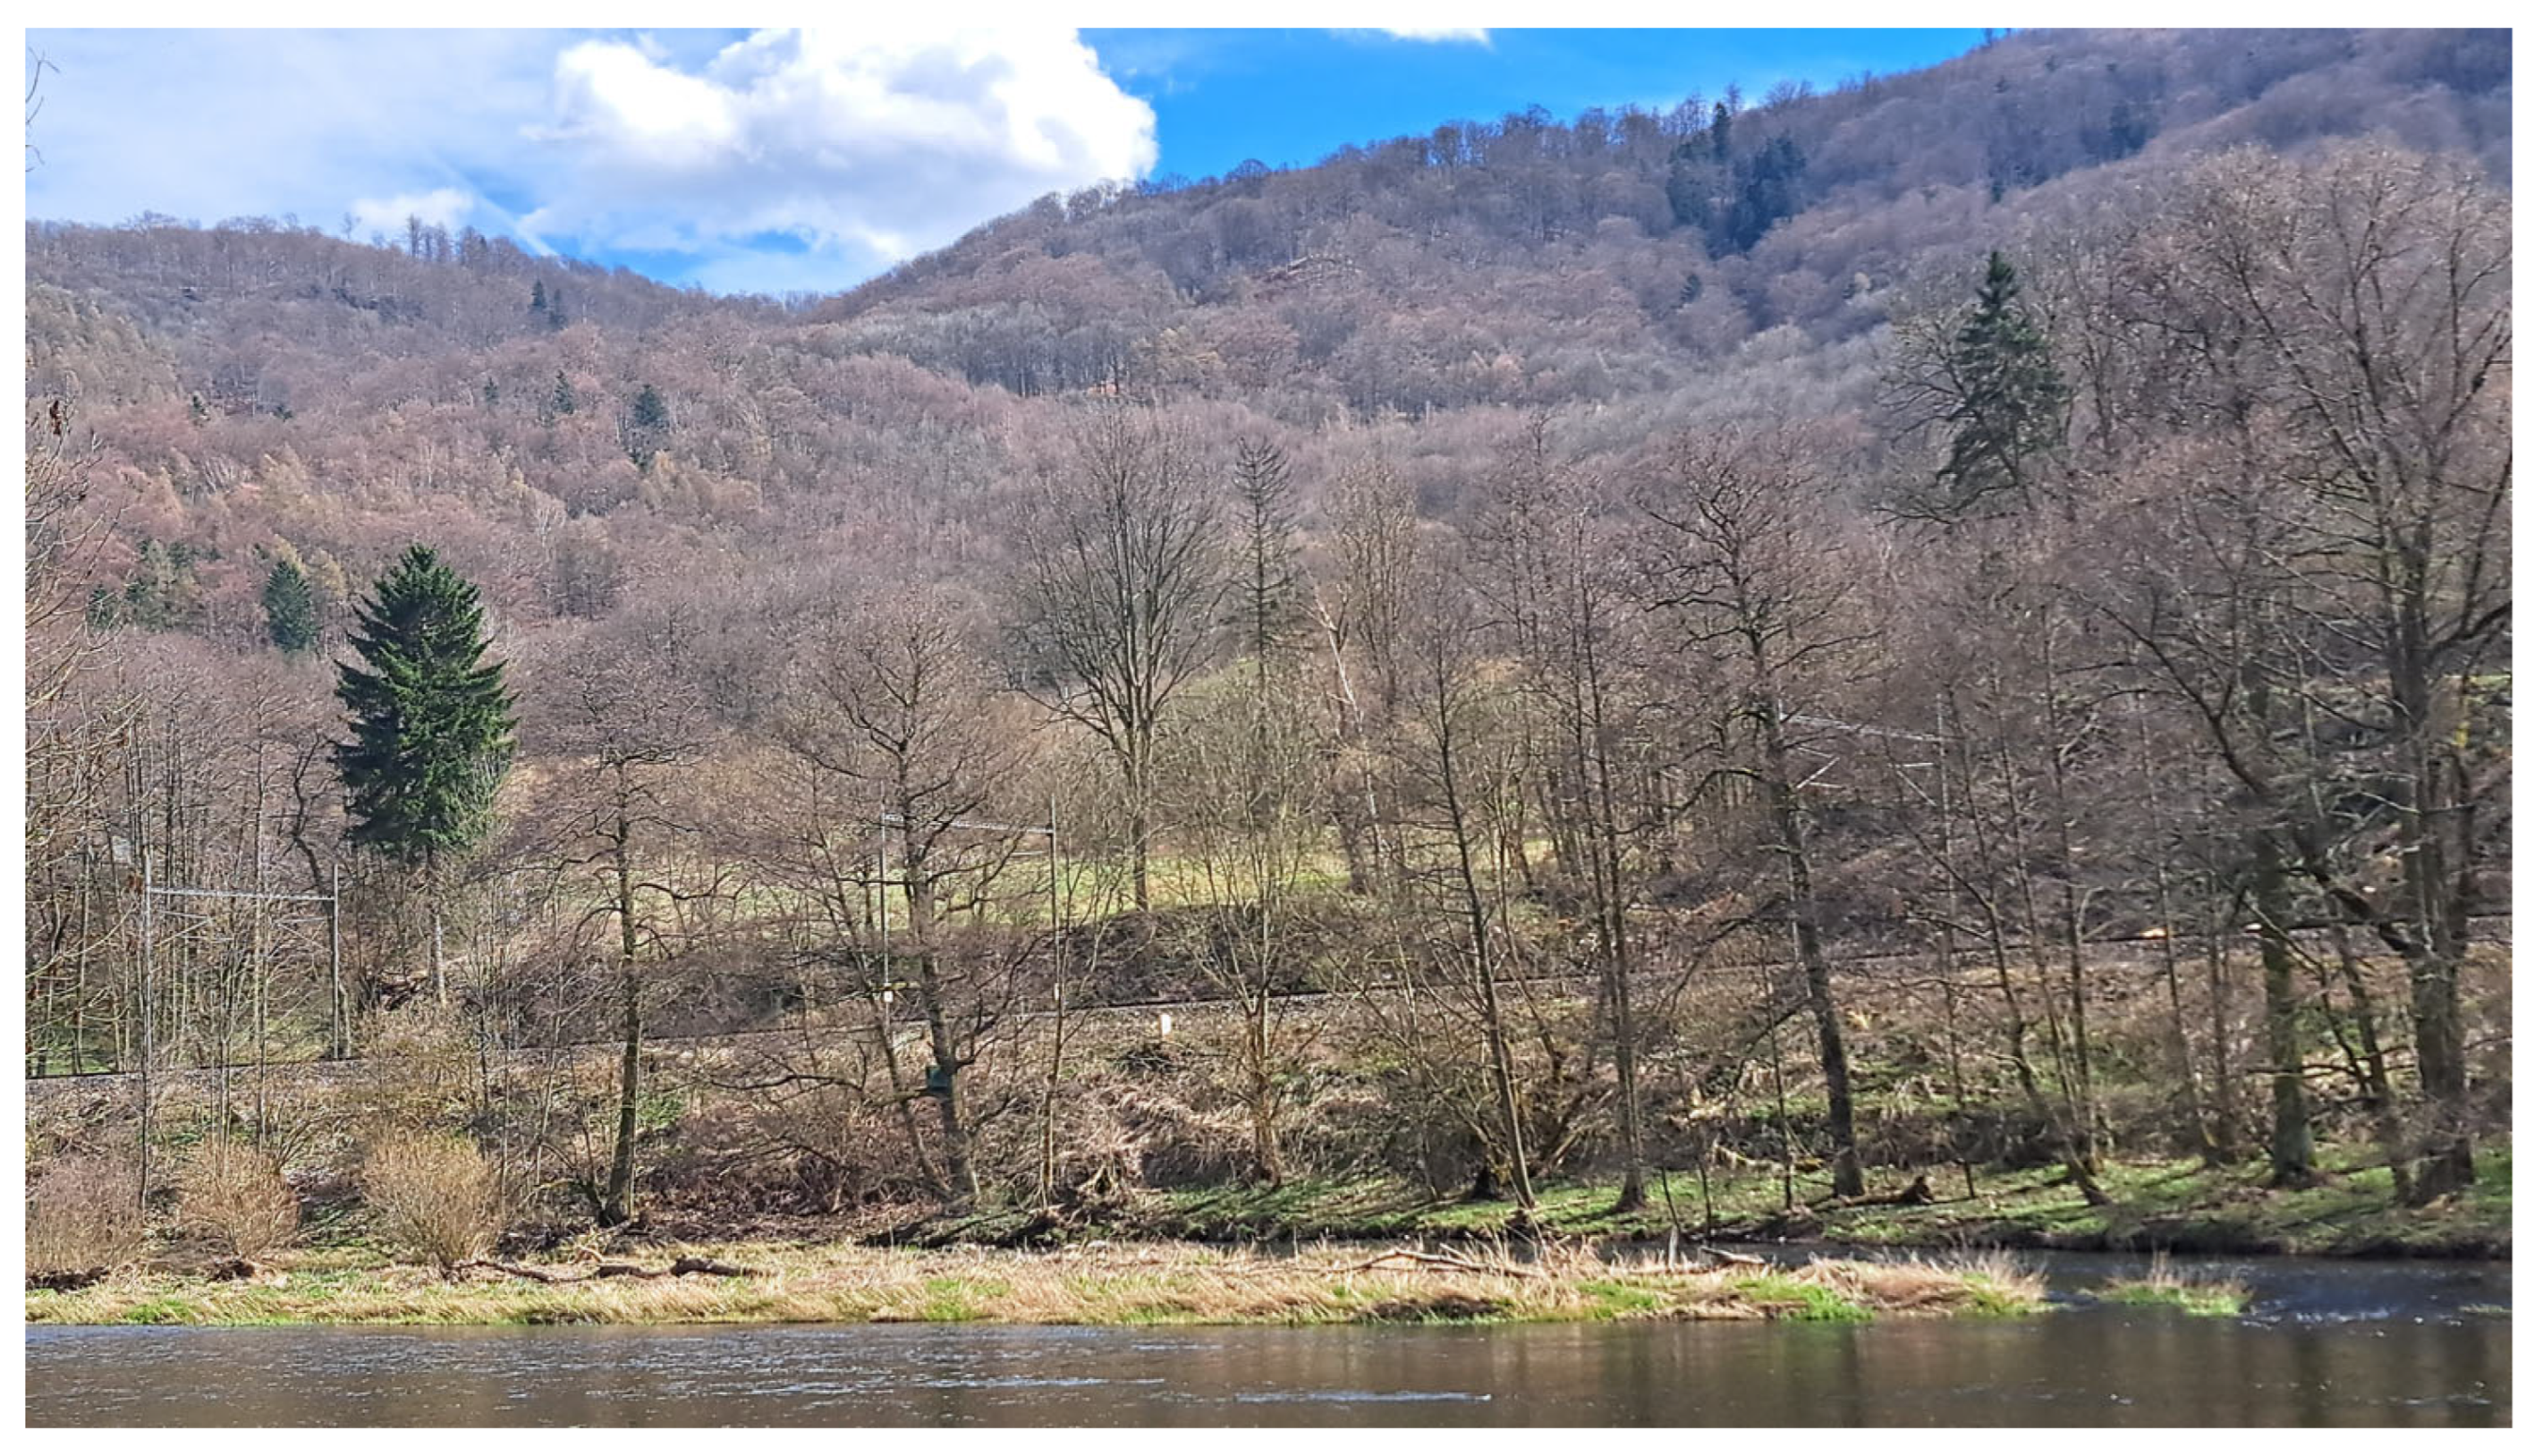
Figure 8.
A field view of a railway corridor in the Ohre River valley shows the close relationships between the railway, the river corridor, the slope, and the biotopes. The scene depicts a typical fuel cascade.
3.2. Meteorology
Wind conditions in the Jakubov–Vojkovice corridor were assessed at two points at 10 m height. Both locations exhibited similar wind regimes, with mean speeds of 2.37 and 2.34 m·s−1, respectively. Winds below 4 m·s−1 dominated, exceeding 90% of cases, while 4–8 m·s−1 winds accounted for about 9%, and winds above 8 m·s−1 were rare. The dominant directions were approximately 60° and 240°, with higher speeds mainly from the 240–270° sector. Weibull parameters were similar at both points, with a scale of about 2.65 m·s−1 and a shape of about 1.97. Although atmospheric stability was not used as a direct BehavePlus input, it helps interpret smoke retention and visibility: day-time conditions from May to September were dominated by unstable classes A–C, whereas stable night-time classes E–F prevailed. The local climate is warm, with an average temperature of 10.1 °C, summer maxima up to 36.3 °C, 55 summer days above 25 °C, and 14.4 tropical days above 30 °C. Annual precipitation is about 457.9 mm, concentrated mainly from May to September but unevenly distributed, leaving frequent dry periods that can support fine-fuel drying and fire spread.
3.3. Vegetation
Vegetation polygons cover 154.76 ha and form a heterogeneous sequence from the Ohře valley bottom to the slope above the railway. Major biotopes over 5 ha include woody vegetation outside forests (31.16 ha), watercourse macrophytes (21.87 ha), mesic Arrhenatherum meadows T1.1 (19.46 ha), Hercynian oak-hornbeam forests L3.1 (17.44 ha), beech forests L5.1 (15.99 ha), ash-alder alluvial forests L2.2 (12.15 ha), managed meadows X5 (10.23 ha), urban areas X1 (9.26 ha), and mesic and xeric scrub K3 (8.66 ha); smaller biotopes cover 8.54 ha. Fuel models were assigned at the biotope level: grasslands mainly to GR6 and locally GR4, ruderal and tall-herb vegetation to GR6, wet meadows to GR5, riverine reeds M1.4 to GR9, scrub and woody vegetation outside forests to SH8, wet willow and rocky scrub to SH6, broadleaf forests mainly to TL4, ravine forests to TL2 or TL4, and ash-alder alluvial forests to TU2. Watercourse habitats and urban areas were treated as non-burnable. The main vertical sequence runs from grass and meadow fuels (~60–90 cm), through shrub fuels (~160 cm), to forest and timber–shrub fuels of 8–20 m with canopy layers of 3–16 m; yellow-framed polygons indicate cascading fuel-bed structures that may support upslope spread. Effective fuel-bed depth is about 0.5 m for GR5–GR6, 0.6 m for GR4, 1.5 m for GR9, 0.6–0.9 m for SH6–SH8, and 0.1–0.3 m for TL2, TL4 and TU2. Fuel moisture and fire-technical properties are summarized in Table 1 and Table 2; they were not direct model inputs but supported the interpretation of fuel reactivity and ignition behavior. Cone-calorimeter tests showed no sustained ignition of live Calamagrostis epigejos or Poa pratensis, and mixed forest litter showed glowing without sustained flaming.
3.4. Modeling Results and Plausibility Validation
The priority segment on railway line 140 lies between km 162.00 and 162.50, where the railway meets the slope below the hilltop. The railway is a potential ignition source, while the steep, partly protected, and poorly accessible slope above promotes upslope spread and complicates suppression from the Ohře valley, railway infrastructure, and river corridor. Adverse factors overlap: a solar-exposed sector of 135–215°, shallow skeletal Eutric Cambisol mainly in HSG B, fine GR5–GR6 herbaceous fuels near the railway, and an upslope transition to SH8 shrub and TL6/TU2 forest surface fuels. Fires starting at the railway edge may therefore spread rapidly through fine fuels before reaching deeper, less accessible shrubs and forest fuels. Under baseline TU2, fire behavior remains moderate at 11 km·h−1: rate of spread 2.6–2.8 m·min−1, flame length 0.9 m, fireline intensity 185–196 kW·m−1, 39–41 m head spread in 15 min and about 0.1 ha. At 29 km·h−1, TU2 increases to 9.8 m·min−1, flame length 1.6 m, fireline intensity 695 kW·m−1, 147.1 m head spread, and 0.6 ha. The comparative GR5 scenario represents a possible railway-edge fine-fuel strip, not reclassification of the whole L2.2 polygon. At 11 km·h−1, GR5 reaches 5.1–5.4 m·min−1, flame length 1.6 m, fireline intensity 719–759 kW·m−1, 76.7–81.0 m head spread, and 0.3 ha. At 29 km·h−1, it reaches 18.6 m·min−1, flame length 2.9 m, fireline intensity 2612 kW·m−1, 278.6 m head spread, and 2.0 ha. All runs are wind-driven. Wind factors exceed slope factors: 8.4/33.8 versus 0.5 for TU2 and 11.9/44.9 versus 0.6 for GR5 at 11/29 km·h−1. Maximum spread is about 57–59° for wind from 240° and 242–243° for wind from 60°. The results, therefore, mainly indicate sensitivity to continuous fine fuel at the railway edge, which requires field verification.
BehavePlus results were compared with empirical railway-fire data for line 140. The Ostrov mean spread rate is 1.5 m·min−1 for fires > 100 m2, with an overall mean of 1.35 m·min−1. Baseline TU2 is of the same order, whereas high-wind TU2 and GR5 represent adverse wind-driven cases. Because empirical rates use simplified circular or sector geometries, while BehavePlus produces elliptical wind-driven growth, and many railway fires occurred in spring under residual-grass conditions, the results support the plausibility of the scenario envelope but not the exact geometry, timing, or impact of historical fires.
4. Discussion
Wildfire risk along the assessed railway corridor is spatially uneven because exposure to surrounding landscape fires and ignition probability from railway operation, maintenance, and trackside land use vary over short distances. Fuel type, distribution, and continuity; slope, aspect, and wind exposure; and railway alignment differ between segments [27,28]. The workflow assigns hydrology, soil, fuel, vegetation, terrain, weather, firebreaks, accessibility, and infrastructure layers to 500 m segments aligned with railway stationing. Static inputs, including relief, soil type, hydrology, corridor configuration, alignment, and infrastructure location, are combined with dynamic inputs, including meteorology, fire-danger indices, LFMC/DFMC, fine-fuel curing, precipitation deficit, and post-maintenance fuel condition. BehavePlus was used in the Rothermel framework to test how segment configuration affects fire behavior. In the priority segment, TU2 was the baseline fuel model for the mapped L2.2 ash-alder alluvial forest, whereas GR5 tested a possible continuous fine-herbaceous strip along the railway edge. GR5 does not replace TU2 or reclassify the polygon; it tests whether the railway contact zone can form a fine-fuel bridge toward upslope shrub and forest fuels. BehavePlus outputs describe expected fire behavior as a source term, not direct infrastructure loading. Since all runs are wind-driven, exposure depends on the burned area, the front orientation relative to the railway, the exposed track length, the distance to sensitive elements, and the exposure duration. A fixed buffer is insufficient unless linked to exposure mechanisms. The high-danger scenario supports comparison under adverse assumptions but is not a historical reconstruction. Validation is limited to plausibility: empirical data confirm incident concentration, seasonality, ignition context, response time, and fire-size classes, but not modeled front geometry or timing. Formal weighting was not required because the analyzed segment was deliberately selected to ensure that hazard, exposure, and operational constraints overlapped. Wider application requires defensible weighting or separate sub-indices for ignition, spread, suppression, exposure, and consequences. Translating modeled fire behavior into infrastructure exposure also remains unresolved: BehavePlus outputs describe fire behavior, but not loads on cable ducts, signaling cabinets, sleepers, traction components, bridges, or nearby buildings [29,30,31]. EEF and CEF are therefore introduced as intermediate exposure concepts, not spread models, final risk values, or validated operational limits; the radiative component is expressed only by a screening formulation:
where E is the effective radiant power of the flame, Fv is the view factor, τ is atmospheric transmissivity, D is distance, Lf and Wf are characteristic flame or front dimensions, α is slope, and φ is the horizontal orientation of the target relative to the fireline.
The External Exposure/Intensity Factor (EEF) quantifies cumulative radiative exposure as a function of incident heat flux, view factor or distance, fire-front geometry, target orientation, and exposure time. For linear infrastructure, target orientation relative to the fireline is important because the projected radiating surface is greatest when the front is approximately normal to the target; EEF therefore distinguishes scenarios with similar peak heat flux but different exposure durations.
This formulation keeps EEF auditable by separating physical exposure from component vulnerability. CEF represents cumulative convective exposure during the fire-front approach and passage, distinguishing no flame contact, hot-gas or smoke exposure, and flame impingement. EEF and CEF therefore structure exposure, but they do not quantify damage or operational consequences without asset-specific thresholds. Cables, signaling cabinets, sleepers, traction equipment, bridges, culverts, access routes, and nearby buildings may respond differently to radiation, hot gases, smoke, flame contact, and firebrands. The classification in Table 3 is therefore a provisional screening layer, not a validated operational limit system. Wider application requires defensible weighting, derivation of EEF and CEF from BehavePlus outputs, fragility or limit functions for railway components, and validation separating occurrence, escalation, suppression difficulty, and infrastructure impact. Only then can the workflow support segment prioritization, vegetation management, sensor placement, tactical planning, and transfer to other linear infrastructure.
Table 3.
Proposed preliminary exposure classes for EEF and CEF used to classify radiative and convective exposure of railway infrastructure during vegetation-fire scenarios. EEF is based on incident radiant heat flux, while CEF describes the dominant convective regime.
The results support the assumptions unevenly. H1 is supported by observed incident concentrations, but formal hotspot definition, temporal stability, and segmentation sensitivity remain unresolved. H2 is supported mechanistically by segment differences in fuel, terrain, wind exposure, and track configuration, but still requires weighting and sensitivity analysis. H3 is conceptually supported by corridor heterogeneity; segment-specific management remains a working hypothesis requiring future testing.
5. Conclusions
This study presents a corridor-based workflow for wildfire hazard and exposure assessment along railways. The line is divided into 500 m segments linked to GIS data on terrain, soil, hydrology, settlements, infrastructure, biotopes, access, and fuel structure, supplemented by field checks. The pilot shows that neighboring segments differ in fire-relevant conditions, so railway wildfire risk cannot be represented by a uniform buffer. BehavePlus provides scenario estimates, not historical reconstructions: spread rates range from 1.1 to 6.6 m·min−1 at about 3 m·s−1 wind and 14.5–17.1 m·min−1 at 6–7 m·s−1, with fire areas of 0.1–1.9 ha, flame lengths of 0.6–3.1 m, and spotting distances of 0.1–0.5 km. Structural fuel transitions influence surface-fire development and potential exposure even without a crown-fire transition. Validation supports plausibility but not exact front geometry. Remaining issues are the weighting of interdependent variables and the translation of fire-behavior outputs into EEF/CEF exposure classes and component-specific thresholds before operational risk scoring.
Author Contributions
Contribution share: J.H. 50%, Z.H. 10%, D.C. 15%, T.Č. 10%, J.P. 10%, I.Š. 5%. Conceptualization, J.H.; methodology, J.H., D.C. and I.Š.; formal analysis, J.H., Z.H. and D.C.; validation, Z.H.; investigation, J.H.; resources, J.H.; data curation, Z.H., D.C., T.Č. and J.P.; writing—original draft preparation, J.H. and D.C.; writing—review and editing, J.H., T.Č. and J.P.; visualization, J.H.; supervision, J.H., T.Č. and J.P.; project administration, J.H. All authors have read and agreed to the published version of the manuscript.
Funding
This research was funded by the Technology Agency of the Czech Republic; grant number CL02000046.
Institutional Review Board Statement
Not applicable.
Informed Consent Statement
Not applicable.
Data Availability Statement
The original contributions presented in this study are included in the article. Further inquiries can be directed to the corresponding author.
Conflicts of Interest
The authors declare no conflicts of interest. The funders had no role in the design of the study; in the collection, analyses, or interpretation of data; in the writing of the manuscript; or in the decision to publish the results.
References
- ECMWF. Extreme Wildfires in Summer 2025. ECMWF Newsletter 2025. Number 185. Available online: https://www.ecmwf.int/en/newsletter/185/news/extreme-wildfires-summer-2025 (accessed on 9 March 2026).
- Copernicus Emergency Management Service (CEMS). EFFIS’s Current Situation Viewer. Available online: https://forest-fire.emergency.copernicus.eu/apps/effis_current_situation/ (accessed on 9 March 2026).
- Wintle, T. Spain: Wildfires See Madrid–Galicia High-Speed Link Cut Off for Sixth Day in a Row. RailTech.com, 19 August 2025. Available online: https://events.railtech.com/news/news/2025/08/19/spain-wildfires-see-madrid-galicia-high-speed-link-cut-off-for-sixth-day-in-a-row/ (accessed on 9 March 2026).
- Správa železnic. Methodological Guideline for Tree Maintenance: Consolidated Wording. Available online: https://novymostvyton.cz/documents/50004227/155732975/MP+konsolidovan%C3%A9+zn%C4%9Bn%C3%AD+pro+%C3%BAdr%C5%BEbu+stromov%C3%AD.pdf/c046b61b-65f9-49c9-84a0-d450febe1156 (accessed on 9 March 2026).
- Anderson, H.E. Aids to Determining Fuel Models for Estimating Fire Behavior; USDA Forest Service General Technical Report INT-122; USDA Forest Service: Salt Lake City, UT, USA, 1982; pp. 1–22. Available online: https://research.fs.usda.gov/treesearch/download/6447.pdf (accessed on 9 March 2026).
- Správa železnic. Methodological Guideline for Tree Maintenance: Amendment 1. Available online: https://www.spravazeleznic.cz/documents/50004227/139626480/SZ_MP_pro_%C3%BAdr%C5%BEbu_stromov%C3%AD_zm1_20210604.pdf/20a4f480-dc46-4764-8928-0577f5581ef9?version=1.0 (accessed on 9 March 2026).
- Nezval, V. Fires in the Vicinity of Railway Lines: Interactive Portal. Available online: https://www.cdvgis.cz/~nezval/nezvalpozary/index.php (accessed on 9 March 2026).
- Nezval, V.; Andrášik, R.; Bíl, M. Vegetation fires along the Czech rail network. Fire Ecol. 2022, 18, 15. [Google Scholar] [CrossRef] [Scilit]
- Chytrý, M.; Kučera, T.; Kočí, M.; Grulich, V.; Lustyk, P. Habitat catalog of the Czech Republic. Agency for Nature Conservation and Landscape Protection of the Czech Republic. 2010. Available online: https://www.sci.muni.cz/botany/chytry/Chytry_etal2010_Katalog-biotopu-CR-2.pdf (accessed on 9 March 2026).
- Agency for Nature Conservation and Landscape Protection of the Czech Republic (AOPK ČR). Biotopes Portal. Available online: https://portal.nature.cz/web/cz/biotopy (accessed on 9 March 2026).
- Kutchartt, E.; González-Olabarria, J.R.; Aquilué, N.; Garcia-Gonzalo, J.; Trasobares, A.; Botequim, B.; Hauglin, M.; Palaiologou, P.; Vassilev, V.; Cardil, A.; et al. Pan-European fuel map server: An open-geodata portal for supporting fire risk assessment. Geomatica 2024, 76, 100036. [Google Scholar] [CrossRef] [Scilit]
- Czech Office for Surveying, Mapping and Cadastre (CUZK). ČÚZK Geoportal. Available online: https://geoportal.cuzk.gov.cz/ (accessed on 9 March 2026).
- Czech Geological Survey. Web Services: Maps and Data. Available online: https://cgs.gov.cz/mapy-a-data/webove-sluzby (accessed on 9 March 2026).
- VÚMOP (Research Institute for Soil and Water Conservation). Map Portal. Available online: https://mapy.vumop.cz (accessed on 9 March 2026).
- Czech Statistical Office (CSU). Georeports: External Application. Available online: https://geodata.csu.gov.cz/as/georeporty/ext/ (accessed on 9 March 2026).
- Czech Hydrometeorological Institute (CHMI). FireRisk Portal: History View, Location ID 784559. Available online: https://www.firerisk.cz/#history/784559/ (accessed on 9 March 2026).
- FIRERISK. FireRisk: A System for Assessing the Risk of Ignition and Spread of Wildfires in the Landscape. Online. 2026. Available online: https://www.firerisk.cz/ (accessed on 9 March 2026).
- Institute of Atmospheric Physics of the Czech Academy of Sciences. Wind Conditions at 10 m Height: Conditions for Small Wind Turbines. Available online: http://vitr.ufa.cas.cz/male-vte/ (accessed on 9 March 2026).
- Heward, H.; Heinsch, F.A. Fire Behavior Fuel Model Reference Guide (FBFM40). NWCG Training 2005. Available online: https://training.nwcg.gov/dl/rx300/fbfm40-reference-guide.pdf (accessed on 9 March 2026).
- LANDFIRE. LANDFIRE Viewer. Available online: https://www.landfire.gov/viewer/ (accessed on 9 March 2026).
- FIRE-RES. Pan-European Fuel Map Server. Available online: https://www.cirgeo.unipd.it/fire-res/app (accessed on 9 March 2026).
- Duché, Y.; Savazzi, R.; Toutchkov, M.; Cabanne, E. Multisite and Multispecies Live Fuel Moisture Content (LFMC) Series in the French Mediterranean Since 1996, Version 1; Zenodo: Geneva, Switzerland, 2017. [Google Scholar]
- Martin-StPaul, N.; Pimont, F.; Dupuy, J.L.; Rigolot, E.; Ruffault, J.; Fargeon, H.; Cabane, E.; Duché, Y.; Savazzi, R.; Toutchkov, M. Live fuel moisture content (LFMC) time series for multiple sites and species in the French Mediterranean area since 1996. Ann. For. Sci. 2018, 75, 57. [Google Scholar] [CrossRef] [Scilit]
- Yebra, M.; Scortechini, G.; Badi, A.; Beget, M.E.; Boer, M.M.; Bradstock, R.; Chuvieco, E.; Danson, F.M.; Dennison, P.; de Dios, V.R.; et al. Globe-LFMC, a global plant water status database for vegetation ecophysiology and wildfire applications. Sci. Data 2019, 6, 155. [Google Scholar] [CrossRef] [Scilit] [PubMed]
- Yebra, M.; Scortechini, G.; Adeline, K.; Aktepe, N.; Almoustafa, T.; Bar-Massada, A.; Beget, M.E.; Boer, M.; Bradstock, R.; Brown, T.; et al. Globe-LFMC 2.0, an enhanced and updated dataset for live fuel moisture content research. Sci. Data 2024, 11, 332. [Google Scholar] [CrossRef] [Scilit] [PubMed]
- Mapy.cz. Aerial Imagery View. Available online: https://mapy.com/cs/letecka?pid=75951563&newest=1&yaw=5.329&fov=1.257&pitch=-0.062&x=13.0278303&y=50.3145728&z=17&ovl= (accessed on 9 March 2026).
- Quan, X. Global Live Fuel Moisture Content (LFMC) Dataset, V1.0.0; Zenodo: Geneva, Switzerland, 2023. [Google Scholar]
- Quan, X.; Yebra, M.; Riaño, D.; He, B.; Lai, G.; Liu, X. Global fuel moisture content mapping from MODIS. Int. J. Appl. Earth Obs. Geoinf. 2021, 101, 102354. [Google Scholar] [CrossRef] [Scilit]
- Scarponi, G.E.; Pastor, E.; Planas, E.; Cozzani, V. Analysis of the impact of wildland–urban-interface fires on LPG domestic tanks. Saf. Sci. 2020, 124, 104588. [Google Scholar] [CrossRef] [Scilit]
- Pimont, F.; Ruffault, J.; Martin-StPaul, N.K.; Dupuy, J.-L. Why is the effect of live fuel moisture content on fire rate of spread underestimated in field experiments in shrublands? Int. J. Wildland Fire 2019, 28, 127–137. [Google Scholar] [CrossRef] [Scilit]
- Pimont, F.; Ruffault, J.; Martin-StPaul, N.K.; Dupuy, J.-L. A cautionary note regarding the use of cumulative burnt areas for the determination of fire danger breakpoints. Int. J. Wildland Fire 2019, 28, 254–258. [Google Scholar] [CrossRef] [Scilit]

Disclaimer/Publisher’s Note: The statements, opinions and data contained in all publications are solely those of the individual author(s) and contributor(s) and not of MDPI and/or the editor(s). MDPI and/or the editor(s) disclaim responsibility for any injury to people or property resulting from any ideas, methods, instructions or products referred to in the content. |
© 2026 by the authors. Licensee MDPI, Basel, Switzerland. This article is an open access article distributed under the terms and conditions of the Creative Commons Attribution (CC BY) license.