1. Introduction
Rivers are essential components of natural and human systems, providing water resources, supporting ecosystems and shaping regional development. In Mediterranean regions, river systems are characterized by strong temporal variability, influenced by climatic conditions and human activities. The Pinios River, one of the largest rivers in Greece, plays a crucial role in agricultural production, water supply and flood regulation. However, increasing pressures from land use changes and climate variability highlight the need for systematic monitoring and reliable assessment methods.
To address these challenges, the present study combines discharge and water quality analysis based on systematic monthly observations. Future river discharge is estimated using both the conventional Stage–Discharge (H–Q) relationship and the Index Velocity method at selected monitoring stations, allowing for a comparative evaluation of their performance under varying flow conditions. In parallel, water quality is assessed through laboratory analysis of key physicochemical parameters, providing an integrated approach to understanding the river’s behavior and supporting effective management strategies.
2. Data and Methods
The study is based on data collected from three monitoring stations along the Pinios River, operated by the Soil & Water Resources Institute of the Hellenic Agricultural Organization “DEMETER” [
1]. The analysis covers a study period from 1 July 2024 to 31 December 2025, during which systematic measurements of hydrological and water quality parameters were conducted.
River discharge was estimated using two different approaches. The conventional Stage–Discharge (H–Q) method was applied based on established rating curves at each station. In addition, the Index Velocity method was used, utilizing additional velocity measurements to improve discharge estimation, particularly under unsteady flow conditions. A comparative analysis of the two methods was performed to assess their accuracy and reliability across different flow regimes.
Water quality assessment was carried out through monthly sampling and laboratory analysis of key physicochemical parameters, including temperature, pH, electrical conductivity, dissolved oxygen and nutrient concentrations. Standard analytical methods were followed to ensure data quality and comparability.
The integrated analysis of hydrological and water quality data provides a comprehensive framework for assessing the river’s behavior and supports informed water resources management and environmental protection strategies.
Water samples were collected from the selected monitoring sites from April to December 2025 and analyzed at the ELOT EN ISO 17025:2017 [
2] accredited laboratory of the Soil and Water Resources Institute of the Hellenic Agricultural Organization “DEMETER”, Sindos, Greece. The analyzed parameters included pH, electrical conductivity, alkalinity, nutrients, major ions, total hardness, SAR, boron, manganese and iron. Analyses were performed using standard methods, including conductometry for electrical conductivity, volumetric titration for alkalinity and chloride, UV/VIS spectrophotometry for nutrients and boron, flame photometry for sodium and potassium, and atomic absorption spectrometry for calcium, magnesium and trace metals.
3. Study Area
The Pinios River, one of Greece’s largest rivers, originates from the Pindus mountains at elevations above 2000 m and flows east through the Thessalian plain, covering a basin of approximately 10,700 km
2, before reaching the Aegean Sea. The basin includes Lake Karla, a significant lowland water body, and features a topography ranging from mountainous upstream areas to lowland plains near sea level [
3]. The Mediterranean climate, with hot, dry summers and wet winters, leads to pronounced seasonal discharge variability. Intensive agriculture, water abstractions, and land use changes influence both flow and water quality, making integrated monitoring essential for sustainable management.
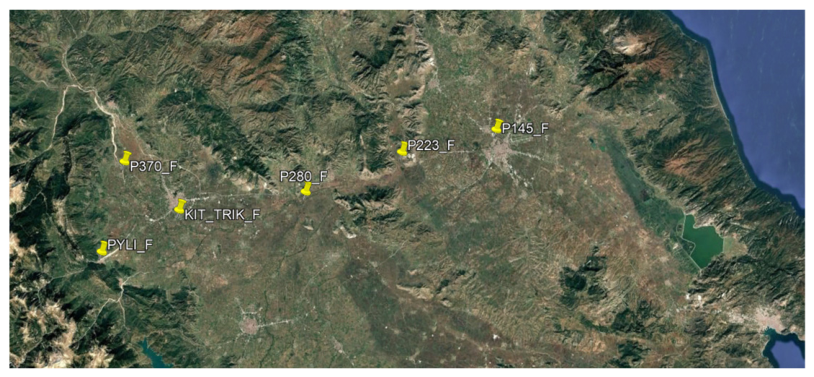
The study area contains six (6) measurement locations (sites) (
Figure 1), in this study, three (3) sites were used to obtain monthly stage and discharge data, P145_F, P223_F and P370_F because they are the most representative, concerning Pinios River discharge.
The measurements take place at the Giannouli–Larissa bridge, on the new channel of the Pinios River, in Larissa. It is a wide bridge, offering good safety conditions for personnel. From a hydrological perspective, the site presents problems due to flow regulation by a dam located approximately 1.2 km upstream of the measurement point, a second dam downstream, the slow flow under normal conditions, and the accumulation of sediment at the measurement cross-section.
Usually, during summer months, the flow is significantly affected by the operation of the upstream dam and possibly also by the Girtoni dam, located about 5 km downstream of the measurement site, which is used for irrigation purposes. Immediately upstream of the site, and across roughly two-thirds of the riverbed, deposits of coarse material have formed, causing the flow to be directed toward the southern part of the cross-section, between the last two bridge piers.
In many cases, particularly after flood flows, parts of the wetted cross-section are occupied by branches, logs, and other debris that become trapped on the bridge piers, resulting in irregular changes in the wetted cross-section and hindering measurements. All discharge measurements at the site are carried out using suspended equipment.
The measurement is carried out at a bridge on the Larissa–Trikala national road. This location has good hydraulic conditions, as the channel boundaries are defined by vertical concrete blocks and there are no intermediate supports within the cross-section.
However, it is difficult to perform discharge measurements due to road traffic (a high-speed road, a bend in the road axis, and insufficient width of the shoulder lane).
Measurements are always carried out using suspended equipment from the gap between the two traffic directions of the road.
The site is representative of the upper course of the Pinios River, about 185 km from its mouth. It is a newly constructed bridge, approximately 10 m high, safe and suitable for conducting measurements using a propeller velocity meter with suspension. At the site, there is also a second, older bridge with a cross-section also suitable for measurements, while there is the possibility of conducting in-channel measurements during low flows.
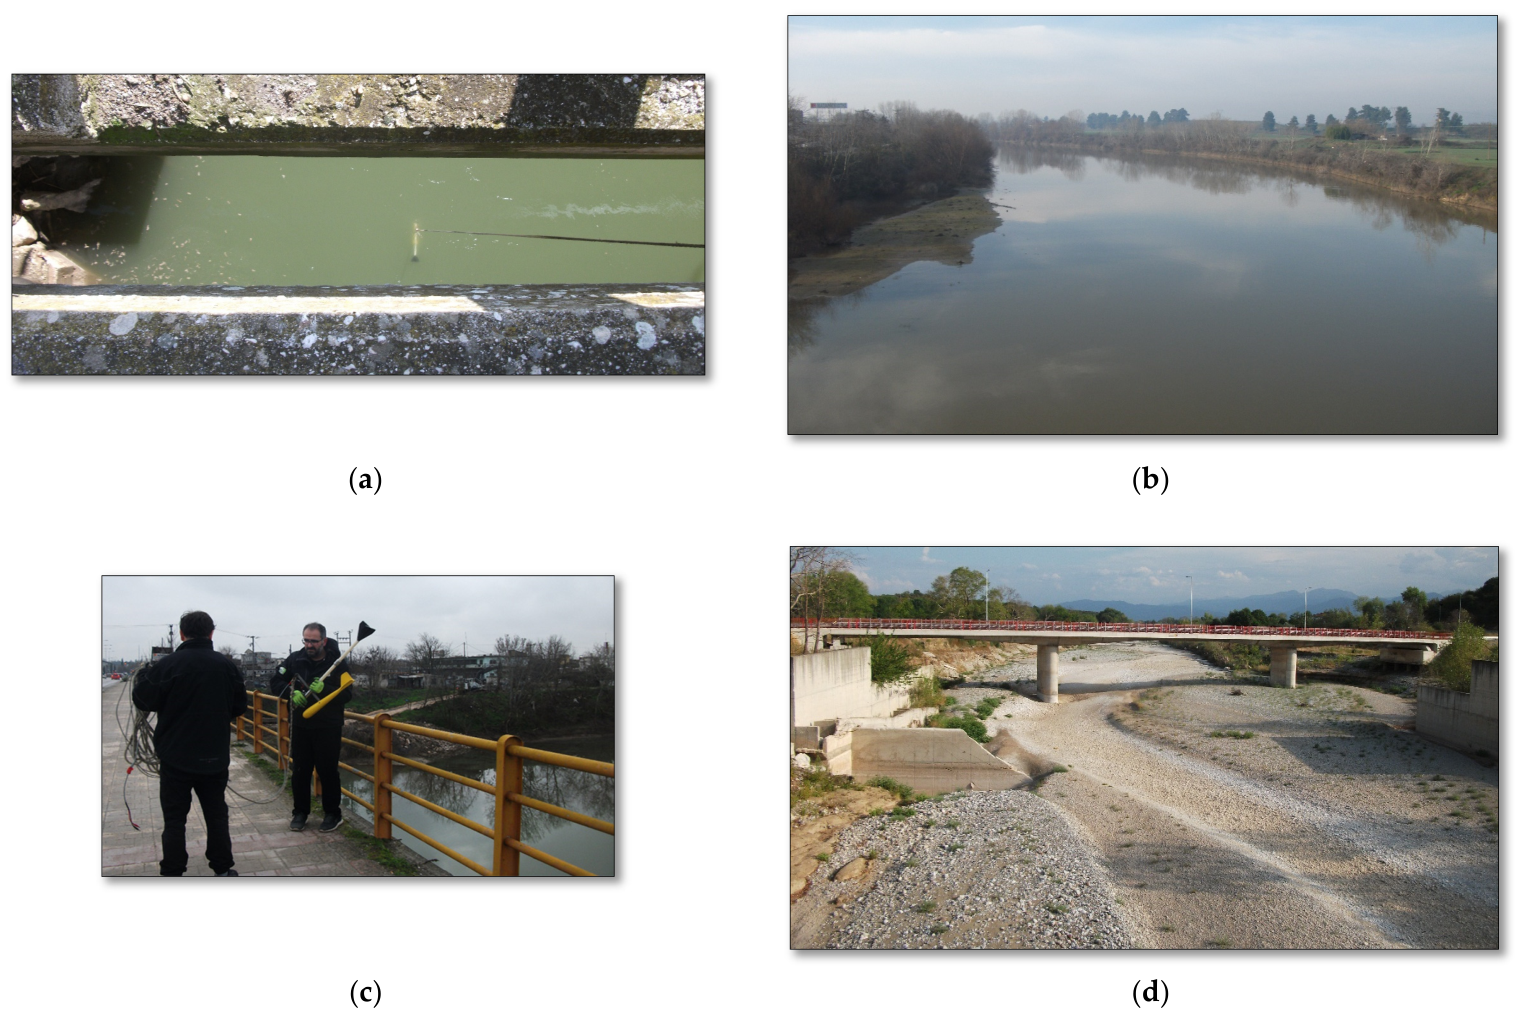
During 2024–2025, twenty-four (24) discharge measurements were carried out using suspended equipment, while in the period from mid-June to early November, no flow was observed during site visits, as illustrated in
Figure 2d, except for the measurement on 3 October 2025, when a small discharge was recorded.
4. Physicochemical Characteristics of the Selected Monitoring Sites
In addition to the hydrometric characteristics, the selected monitoring sites were also described in terms of their main physicochemical water quality parameters. Water quality sampling was conducted from April to December 2025, and summary statistics, including average, median, minimum and maximum values, were calculated for each site in order to provide an overview of the spatial variability of water quality conditions along the studied part of the Pinios River. The parameters considered include pH, electrical conductivity, alkalinity, nutrients, major ions, hardness, SAR, sulphates, boron, manganese and iron [
2].
Overall, the three sites showed slightly alkaline conditions and moderate electrical conductivity (
Table 1,
Table 2 and
Table 3). P145_F presented the highest average electrical conductivity, suggesting relatively higher dissolved ion content, while P370_F showed lower concentrations of chloride, sodium, potassium and SAR, consistent with its upstream character. Nutrient concentrations varied among sites, with nitrate values being higher at P223_F and P145_F compared to P370_F. Ammonium and nitrite showed relatively high maximum values at some sites, indicating temporal variability and possible episodic inputs, low-flow effects, or, to a considerable extent, fertilizer leaching from agricultural areas. These differences indicate that the selected monitoring sites differ not only in their hydraulic behavior but also in their physicochemical profile.
5. Discharge Estimation Methods
5.1. Introduction in Discharge Estimation Methods
This study investigates for each Pinios site mentioned above, the relationship between water level and discharge (Stage–Discharge Method) or water level and velocity both and discharge (Stage–Velocity–Discharge method or Index Velocity Method) (SD and IV, respectively). For the Index Velocity (IV) method, curves were examined based on the maximum vertical velocity (Vmax), to compare the application of the Index Velocity method using a parameter available in every discharge measurement (the maximum vertical velocity). The use of maximum vertical velocity is applied as a test in cases where velocity measurements at a fixed point are not available.
Depending on the equation that best expresses the relationship between water level and discharge or both water level and index velocity with discharge for each site, these equations can be used in combination with instrument installations (level or level and velocity) to provide a continuous estimate of discharge.
Below, the methods for creating water level-discharge or water level and index velocity-discharge curves applied in this study are presented.
5.1.1. 1st Method: Stage–Discharge Method
In the Stage-Discharge Method [
4], using an empirical formula, the following equation was applied:
where
= predicted discharge,
= water head or depth,
= water surface level,
= stage at zero flow,
= discharge when the head equals 1.0 m,
= slope of the stage–discharge curve.
5.1.2. 2nd Method: Index Velocity Method
In the Index Velocity Method or Stage–Velocity–Discharge method, the following equation was applied:
where
a, b, k = unknown coefficients,
L = water level calculated relative to the reference level defined for each site,
= “index” velocity at a fixed point in the cross-section (in this study, curves were created by using the maximum vertical velocity (Vmax) as recorded during discharge measurements) [
5].
The coefficients of both equations and both methods were determined using nonlinear regression to minimize the error between measured discharge and the discharge computed from the proposed equation in each case.
One way to evaluate these methods is the coefficient of determination, R
2.
Table 1 presents the R
2 values for each site, using the Stage–Discharge Method (SD) and the Index Velocity method (IV).
5.2. Comparing Discharge Prediction Methods for Each Pinios Monitoring Site Application
5.2.1. Equations and Diagrams
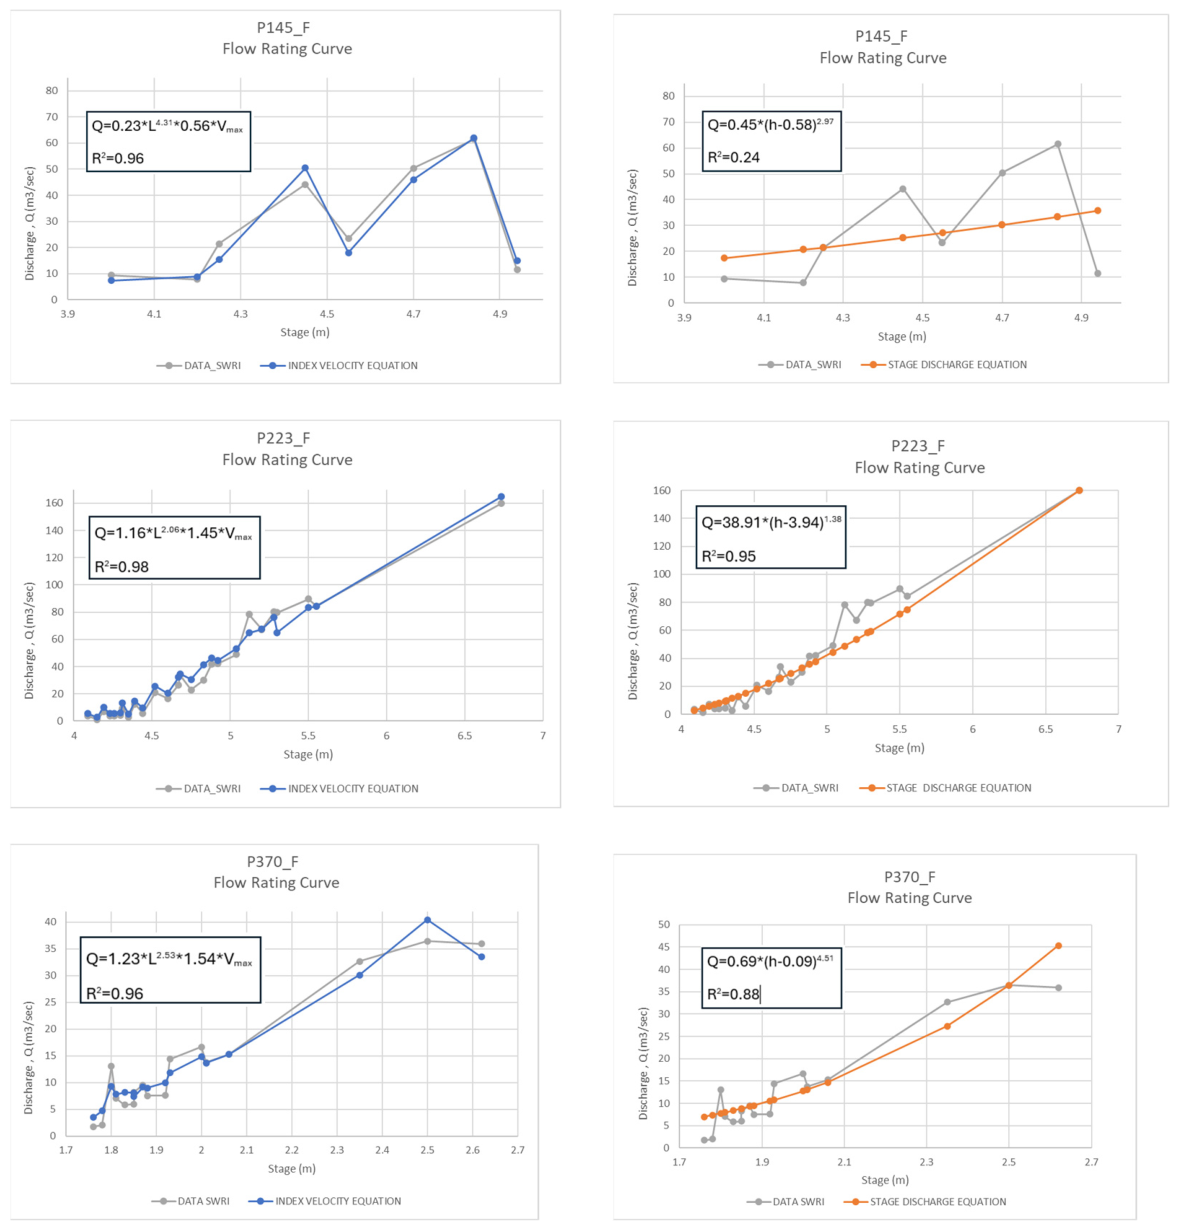
The graphs for each position (
Figure 3) for both methods, generated using the methodology described in the previous section, are presented below, including the corresponding equation.
5.2.2. Which Method Is Indicated for Each Pinios Monitoring Site
For site P145_F, the Index Velocity Method is the most suitable approach and is highly recommended, as the Stage–Discharge Method fails to accurately represent the river’s discharge (
Figure 3 and
Table 4).
At site P223_F, although both methods demonstrate high correlation based on R
2 criterion, the Index Velocity equation provides a significantly better fit to the observed data curve (
Figure 3 and
Table 4).
Regarding site P370_F, the Index Velocity Method is highly recommended; however, the Stage–Discharge Method’s rating curve may also serve as a viable alternative in case velocity data is unavailable (
Figure 3 and
Table 4).
Maintaining the reliability of rating curves requires ongoing surveillance and potential adjustment whenever hydraulic conditions change.
6. Conclusions
This study highlights the importance of integrating hydrometric measurements with water quality monitoring for the assessment of the Pinios River. The comparison between the Stage–Discharge and Index Velocity Methods showed that the Index Velocity approach generally provided a better fit to the observed discharge data, particularly at hydraulically complex sites such as P145_F, where the conventional Stage–Discharge Method was not sufficient to accurately represent flow conditions. The physicochemical analysis indicated slightly alkaline waters with moderate electrical conductivity, while spatial differences among the monitoring sites reflected both the upstream–downstream characteristics of the river and the influence of local hydrological and anthropogenic factors. Elevated maximum values of ammonium and nitrite at some sites suggest temporal variability, possibly related to episodic inputs, low-flow conditions and fertilizer leaching from agricultural areas.
The findings demonstrate that continuous and integrated monitoring is essential for improving discharge estimation, identifying potential water quality pressures and supporting sustainable water resources management in the Pinios River basin.
Author Contributions
Conceptualization, E.K., I.H. and A.T.; methodology, E.K. and V.K.; software, E.K., V.K., I.H. and A.T.; validation E.H.; formal analysis, E.K. and V.K.; investigation, E.K., V.K., I.H. and A.T.; resources, E.K., V.K. and E.H.; data curation, E.K. and V.K.; writing—original draft preparation, E.K.; writing—review and editing, E.K. and V.K.; visualization, I.H. and A.T.; supervision, E.H.; project administration, E.H.; funding acquisition, E.H. All authors have read and agreed to the published version of the manuscript.
Funding
This research, is based on data collected from monitoring stations along the Pinios River, operated by the Soil & Water Resources Institute of the Hellenic Agricultural Organization “DEMETER” which is one of the operating partners of the Network of “Operation of the National Monitoring and Recording Network of the Quantity (rivers) and Quality (rivers and lakes) of the Country’s Surface Waters (Directive 2000/60/EC)” program, the flow control stations are included in the Network and this program is co-funded by the European Union—Cohesion Fund and by National resources through the Public Investment Program.
Informed Consent Statement
Not applicable.
Data Availability Statement
The datasets used during the current study are available from the Soil & Water Resources Institute, Hellenic Agricultural Organization DIMITRA (Sindos), upon reasonable request.
Acknowledgments
Data was offered from the Land Reclamation Department, Soil & Water Resources Institute, a research unit of the Hellenic Agricultural Organization “DEMETER” which is one of the operating partners of the Network of “Operation of the National Monitoring and Recording Network of the Quantity (rivers) and Quality (rivers and lakes) of the Country’s Surface Waters (Directive 2000/60/EC)” program, the flow control stations are included in the Network.
Conflicts of Interest
The authors declare no conflicts of interest.
References
- Joint Ministerial Decision ΥΠΕΝ/ΔΠΔΥΠ/107168/1444, dated 19/11/2021: “Revision of the National Water Monitoring Network, in Accordance with Article 4, Paragraph 4 of Law 3199/2003 (Government Gazette A’ 280). Replacement of Joint Ministerial Decision No. 140384/2011 (Government Gazette B’ 2017)”. Available online: https://www.elinyae.gr/ethniki-nomothesia/ya-ypendpdyp10716814442021-fek-5384b-19112021 (accessed on 9 June 2026).
- ΕΛΟΤ EN ISO/IEC 17025 Ε3; General Requirements for the Competence of Testing and Calibration Laboratories (ISO/IEC 17025:2017). ISO/IEC: Geneva, Switzerland, 2017.
- 2nd Revision of the River Basin Management Plan of the River Basins of Thessaly Water District (EL08). Available online: https://wfdver.ypeka.gr/wp-content/uploads/2024/07/EL08_2REV_sdlap.pdf (accessed on 9 June 2026).
- Kavvadias, G.; Tzovaridis, S.; (Ministry of Environment, Physical Planning and Public Works); Nalbantis, I.; Mamassis, N.; (National Technical University of Athens). Fitting the Stage–Discharge Curves. 1993. Available online: https://www.itia.ntua.gr/en/getfile/305/1/documents/er1_8-4.pdf (accessed on 9 June 2026).
- Levesque, V.A.; Oberg, K.A. Computing Discharge Using the Index Velocity Method, Techniques and Methods 3–A2; U.S. Department of the Interior–U.S. Geological Survey: Reston, VA, USA, 2012. [Google Scholar]
| Disclaimer/Publisher’s Note: The statements, opinions and data contained in all publications are solely those of the individual author(s) and contributor(s) and not of MDPI and/or the editor(s). MDPI and/or the editor(s) disclaim responsibility for any injury to people or property resulting from any ideas, methods, instructions or products referred to in the content. |



 ,
,