1. Introduction
Global water scarcity, particularly in arid and semi-arid regions, poses significant challenges for securing adequate water quantity and quality due to population growth, urbanization, and climate change [
1]. Increasing and competing water demands across multiple sectors necessitate more effective, integrated, and low-cost water resources management approaches [
2]. In this context, reducing Non-Revenue Water (NRW) has become a priority for water utilities, with accurate and timely monitoring of water production and consumption serving as a fundamental first step for both operational control and financial sustainability [
3,
4].
Automated meter reading (AMR) and smart water metering technologies have gained increasing attention in smart city applications [
5] as alternatives to conventional manual meter reading [
6,
7]. Smart meters enable high-resolution, time-based measurement, storage, and transmission of water consumption data, supporting near real-time monitoring and advanced data analytics [
8]. Such data have been widely used for consumption analysis, modeling, and demand management strategies [
9]. Several pilot studies in Australia and other regions have demonstrated notable water savings associated with behavioral change and rapid leak detection enabled by smart meters [
10].
Despite these advances, limited research has focused on post-meter leakages in public areas, where uncontrolled and persistent water losses are common. Recent studies have highlighted the growing potential of high-resolution smart meter data, IoT-based monitoring, and data-driven analytics for detecting user-level anomalies, minimum night flow patterns, and post-meter leakage behavior [
11]. This study addresses this gap by identifying and assessing post-meter leakages in public facilities using online, near real-time monitoring of smart meter flow data at 15-min intervals. The paper presents the application and results of this approach to support improved detection, control, and management of post-meter water losses in public areas.
2. Materials and Methods
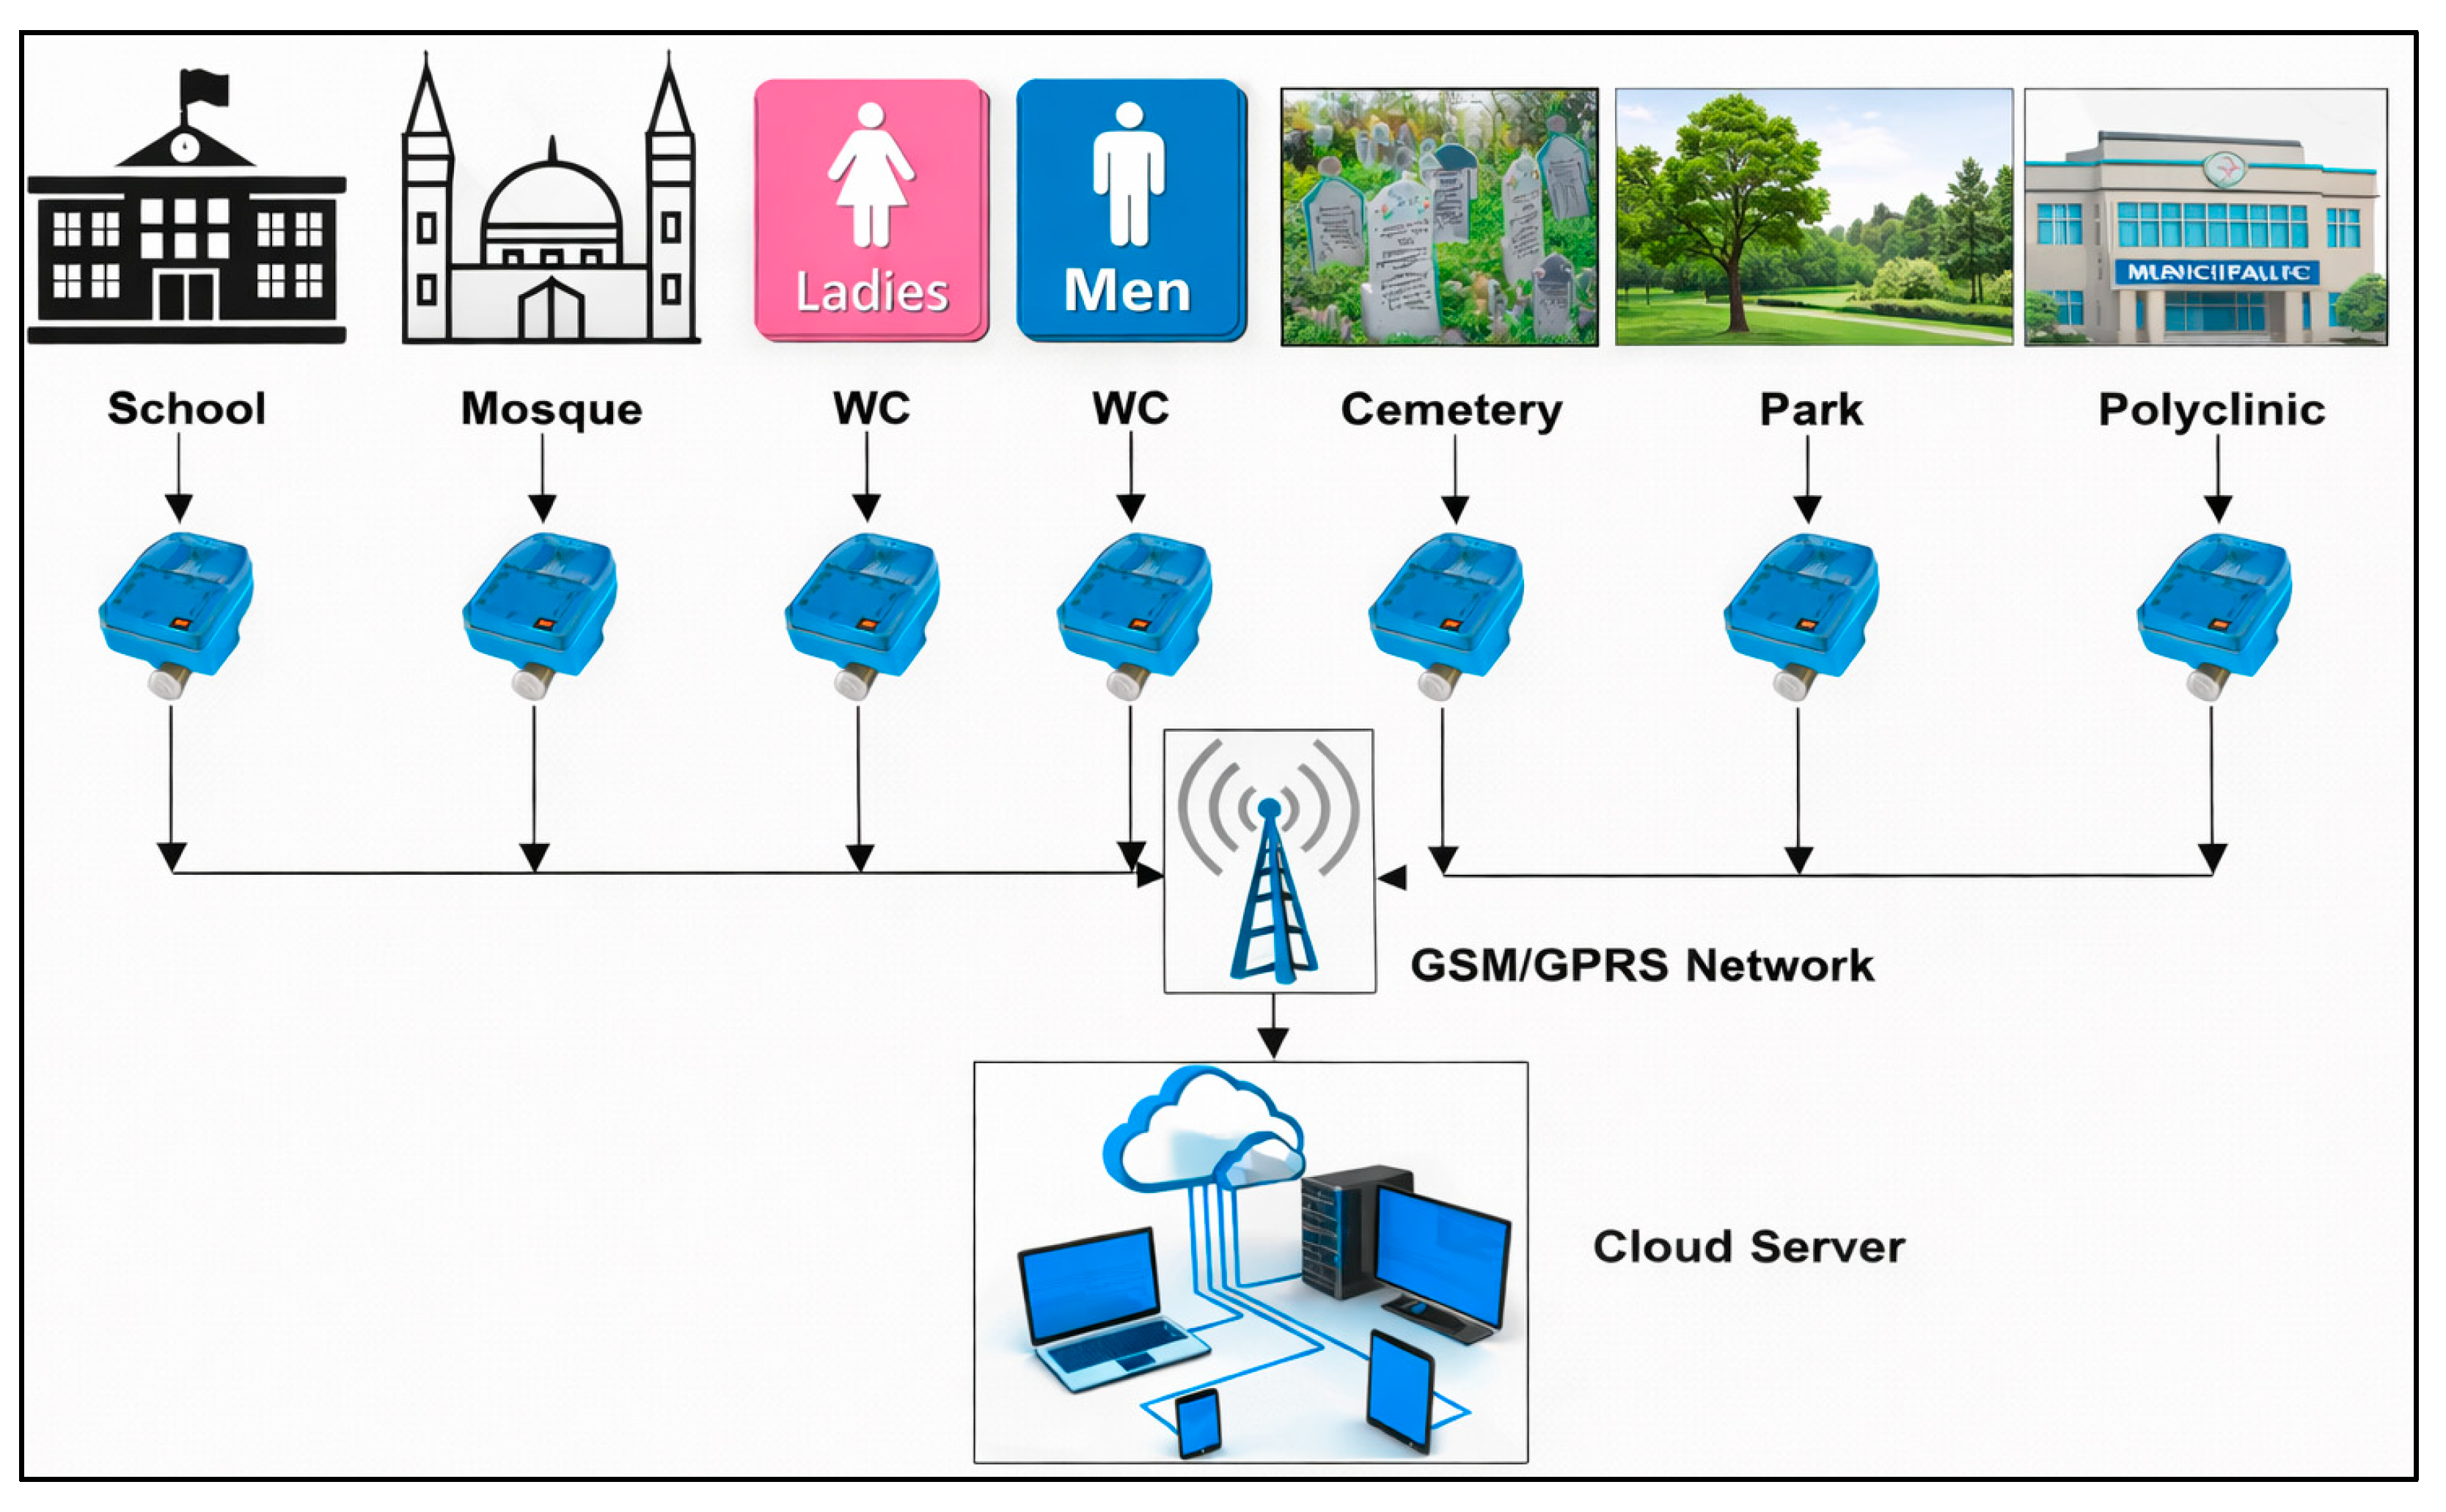
A total of 29 smart water meters were installed at selected public areas in Antalya, Türkiye, including 10 schools, 3 cemeteries, 4 mosques, 3 parks, 1 public toilet, 3 health service units, and 5 municipal buildings (
Figure 1). These sites were distributed across three districts, Muratpaşa, Kepez, and Konyaaltı, to represent different socioeconomic conditions and water use patterns in the city. Several factors such as the number of users (e.g., students in schools), daily usage frequency and monthly water consumption volumes were considered for the selection of sites. During installation, existing mechanical meters owned by the Antalya Water and Wastewater Administration (ASAT) were replaced with smart meters of the same nominal diameter. Flow rates were recorded at 15-min intervals and temporarily stored in the meter before being transmitted to a web-based platform via GSM–GPRS. The web platform enabled centralized storage, visualization, and analysis of the flow data, including time-series plotting and statistical evaluation. The system allowed user-defined settings for data logging and transmission, with data storage intervals ranging from 1 to more than 24 h and flexible scheduling of data uploads throughout the day. Flow rates at all public areas were continuously monitored over a nine-month period enabling detailed analysis of consumption patterns and temporal flow patterns to characterize site-specific usage behavior and variability.
Based on operational schedules, most facilities were closed or minimally active during late-night hours (00:00–05:00). Accordingly, post-meter leakages at the monitored public areas were estimated using the Minimum Night Flow (MNF) analysis. For each site, the nighttime period with minimal legitimate use (02:00–04:00) was analyzed to determine the MNF. As water consumption at schools, mosques, parks, and municipal buildings is expected to be negligible during these hours, persistent flows observed in this period were used to calculate continuous background post-meter leakage.
3. Results and Discussion
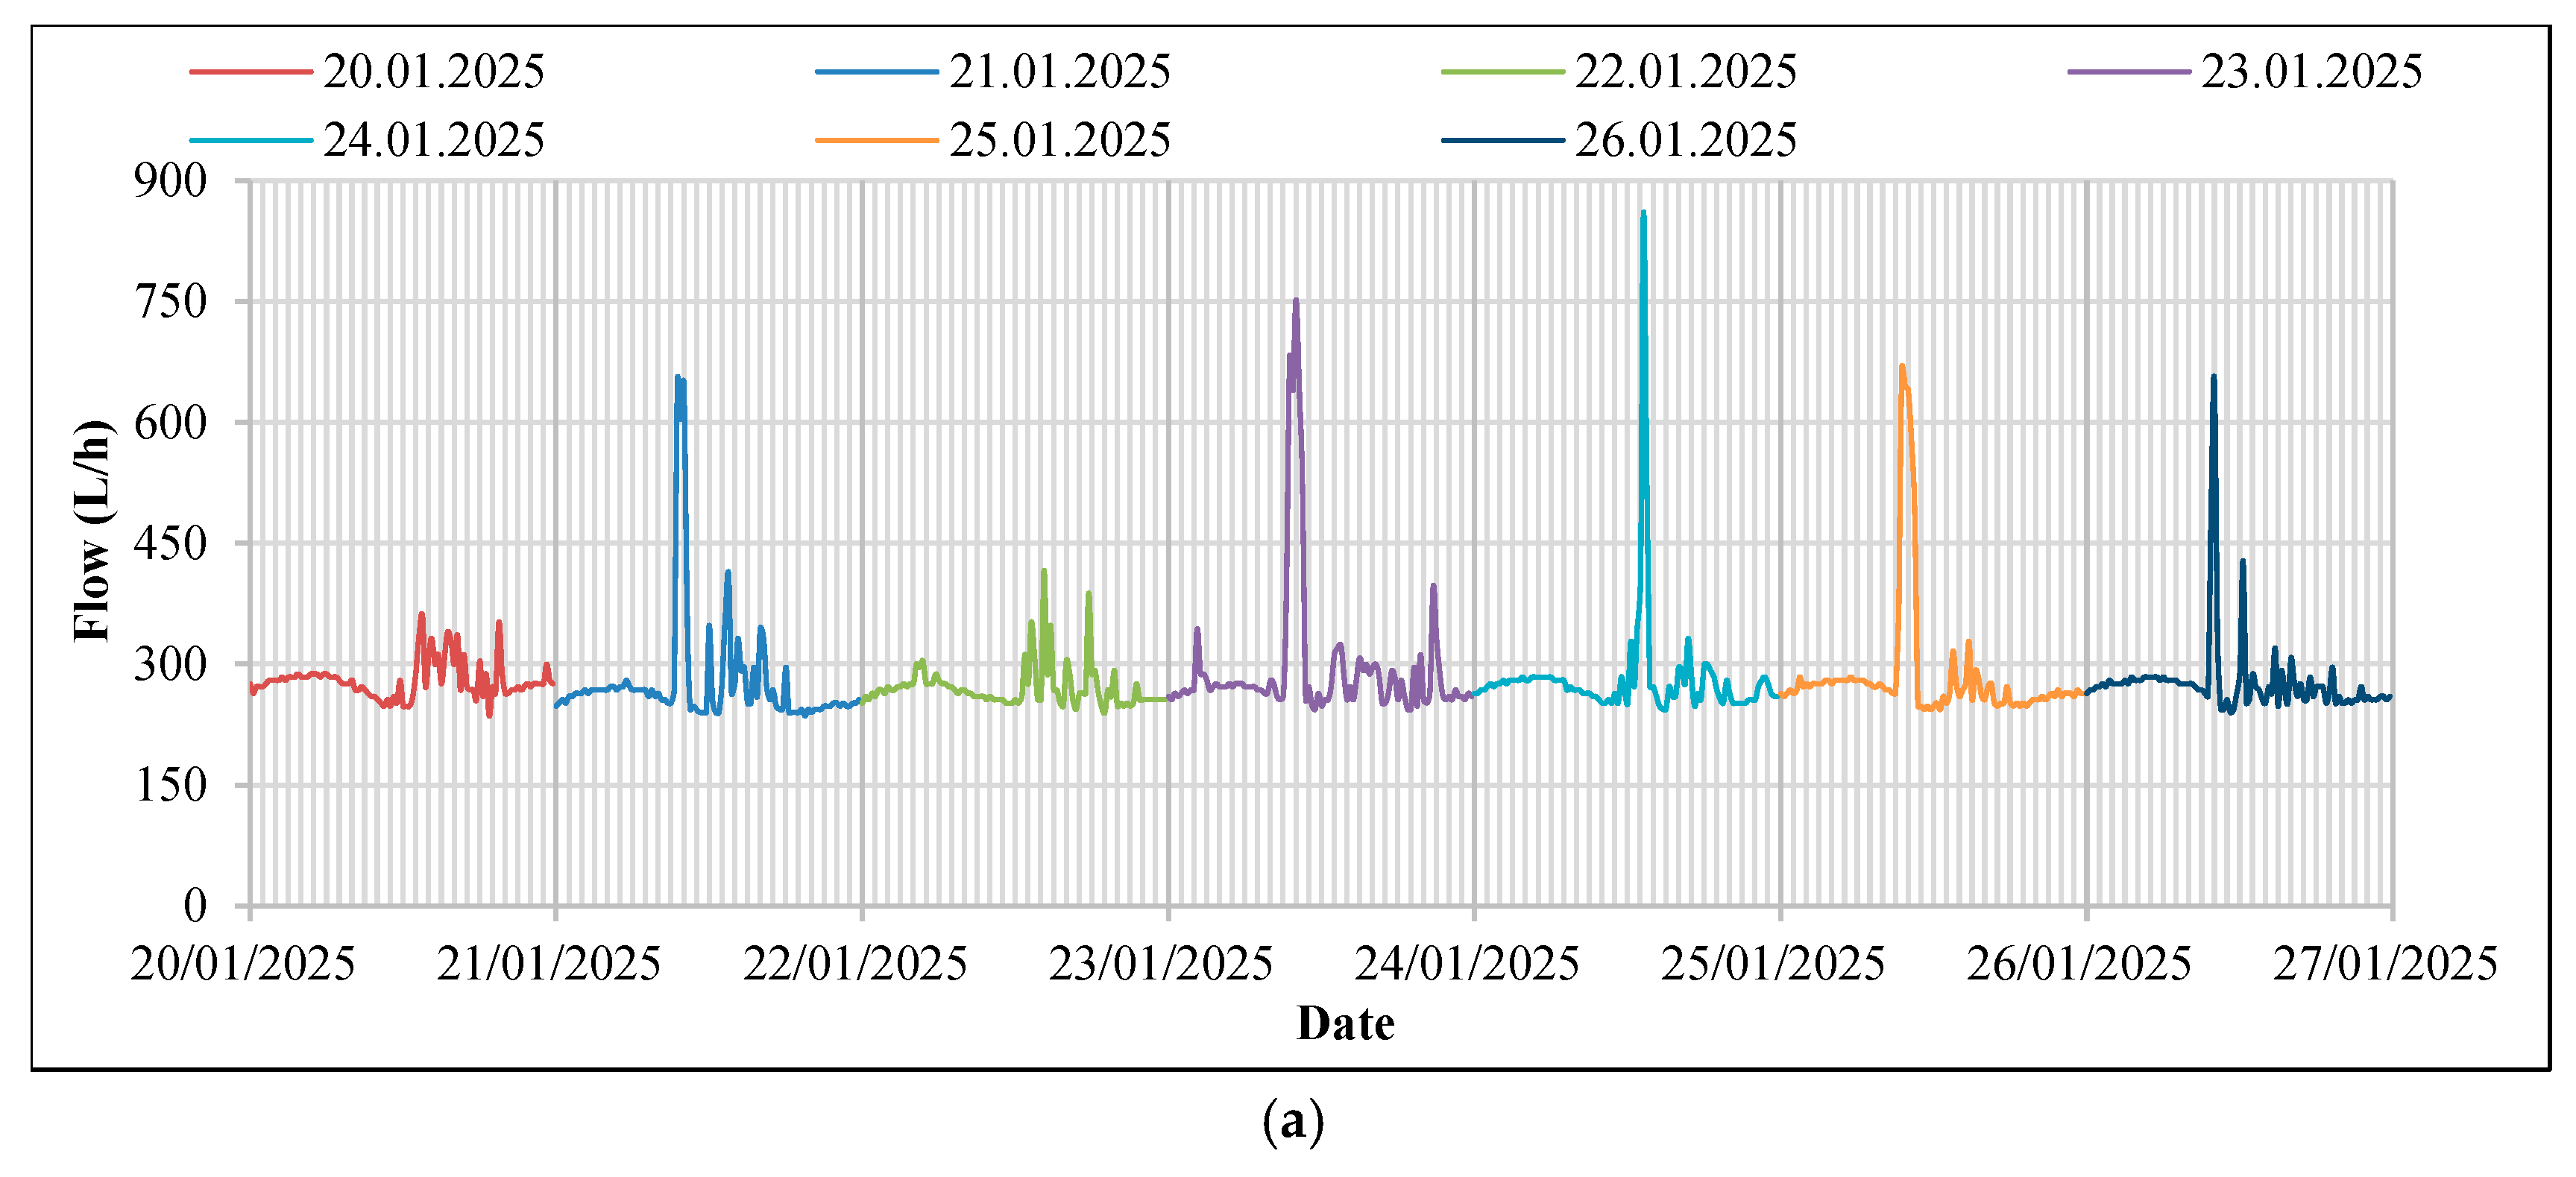
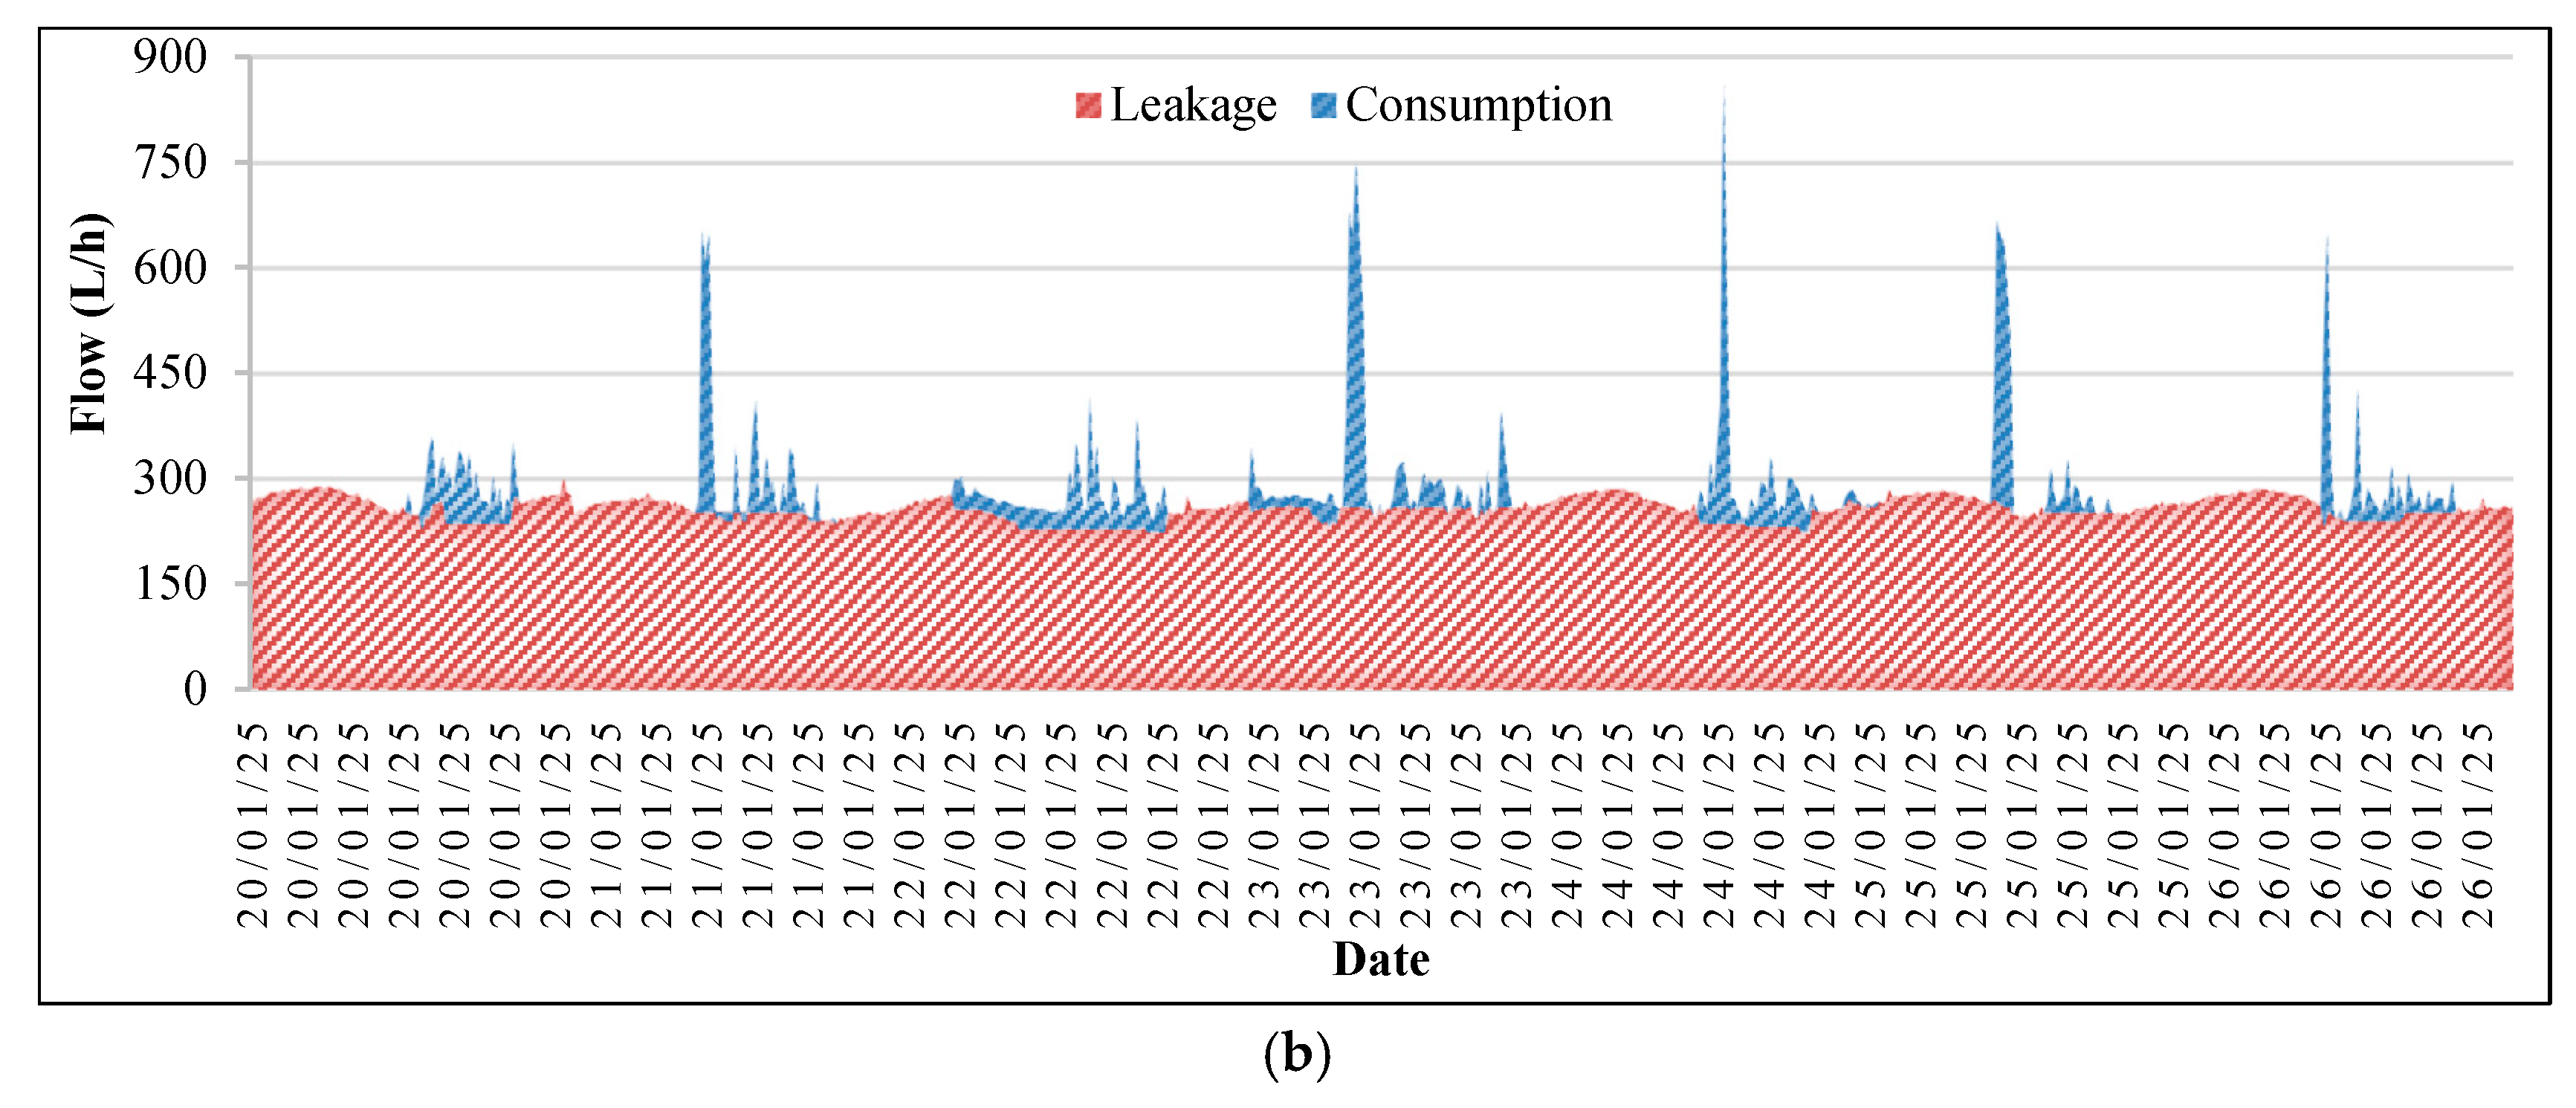
High levels of flow were measured at most of the investigated public areas due to frequently occurring high volumes of leakages which usually continued for long periods. This paper presents the monitoring results for 19 public areas (three cemeteries, four mosques, seven schools, one public toilet, one park, two health service units and one governmental building) for a period of nine months where post-meter leakage was observed. Leakage analysis was not performed for the remaining ten public areas (including a theatre, a sports facility, and municipal buildings) because their monitoring data did not exhibit a typical daily consumption pattern and/or no post-meter leakage was detected. As an illustrative example, weekly flow rate data from a mosque were analyzed for a representative week in January 2025 (Monday–Sunday), as shown in
Figure 2a. Daily flow patterns were distinguished by color coding.
Figure 2b presents the separation of leakage from total flow for the same site. The analysis showed that flow rates did not reach zero at any time during the week, indicating continuous post-meter leakage above 250 L/h with daily variability. Site-specific usage patterns were also considered in the interpretation of flow data, including expected peak demands during Friday noon prayers and occasional afternoon peaks associated with funeral services. The continuous minimum flows observed especially during night-time hours can systematically increase recorded monthly flows.
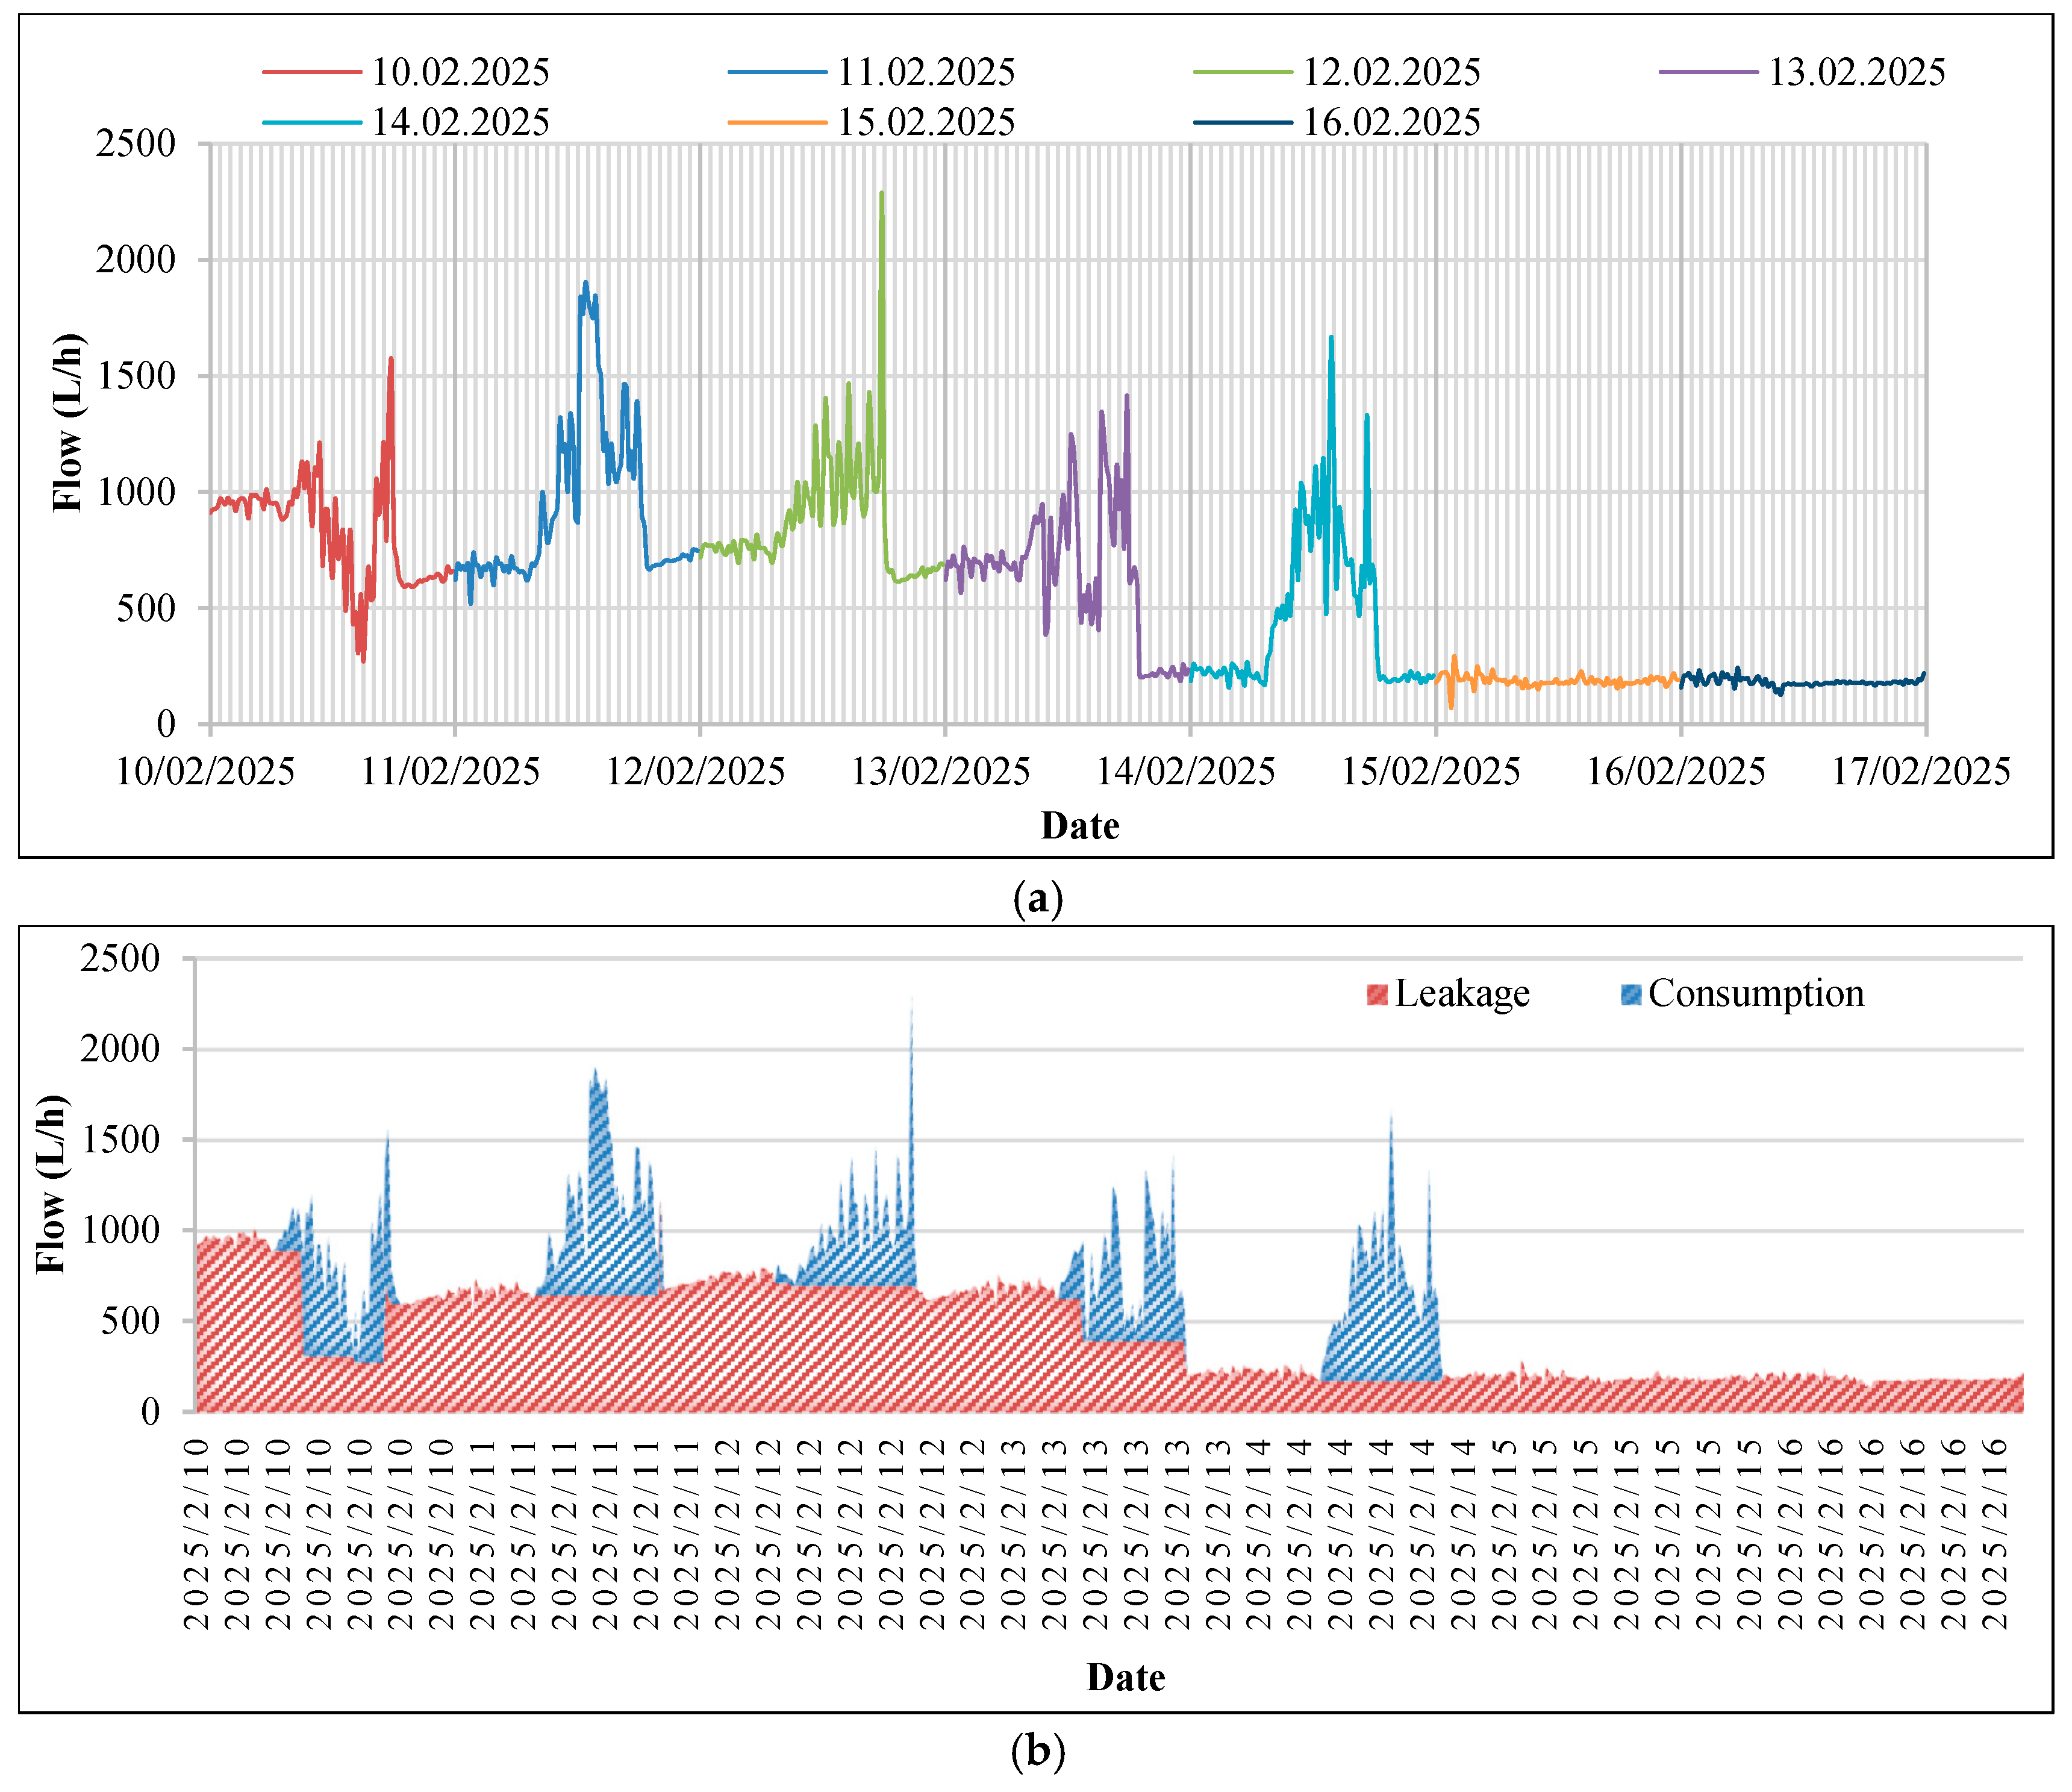
Figure 3a presents one week of monitored flow data for a school in February 2025 where
Figure 3b presents the separation of leakage from total flow for the same site. As expected, weekday flows were higher than weekend flows due to regular school activities. However, flow rates remained consistently above 170 L/h, indicating continuous leakage. Schools are high-risk areas for post-meter leakage due to extensive internal plumbing systems and the large number of taps and fixtures. Continuous low-flow leaks are commonly observed as minimum night flows, particularly during night-time hours, and can systematically increase recorded monthly flows.
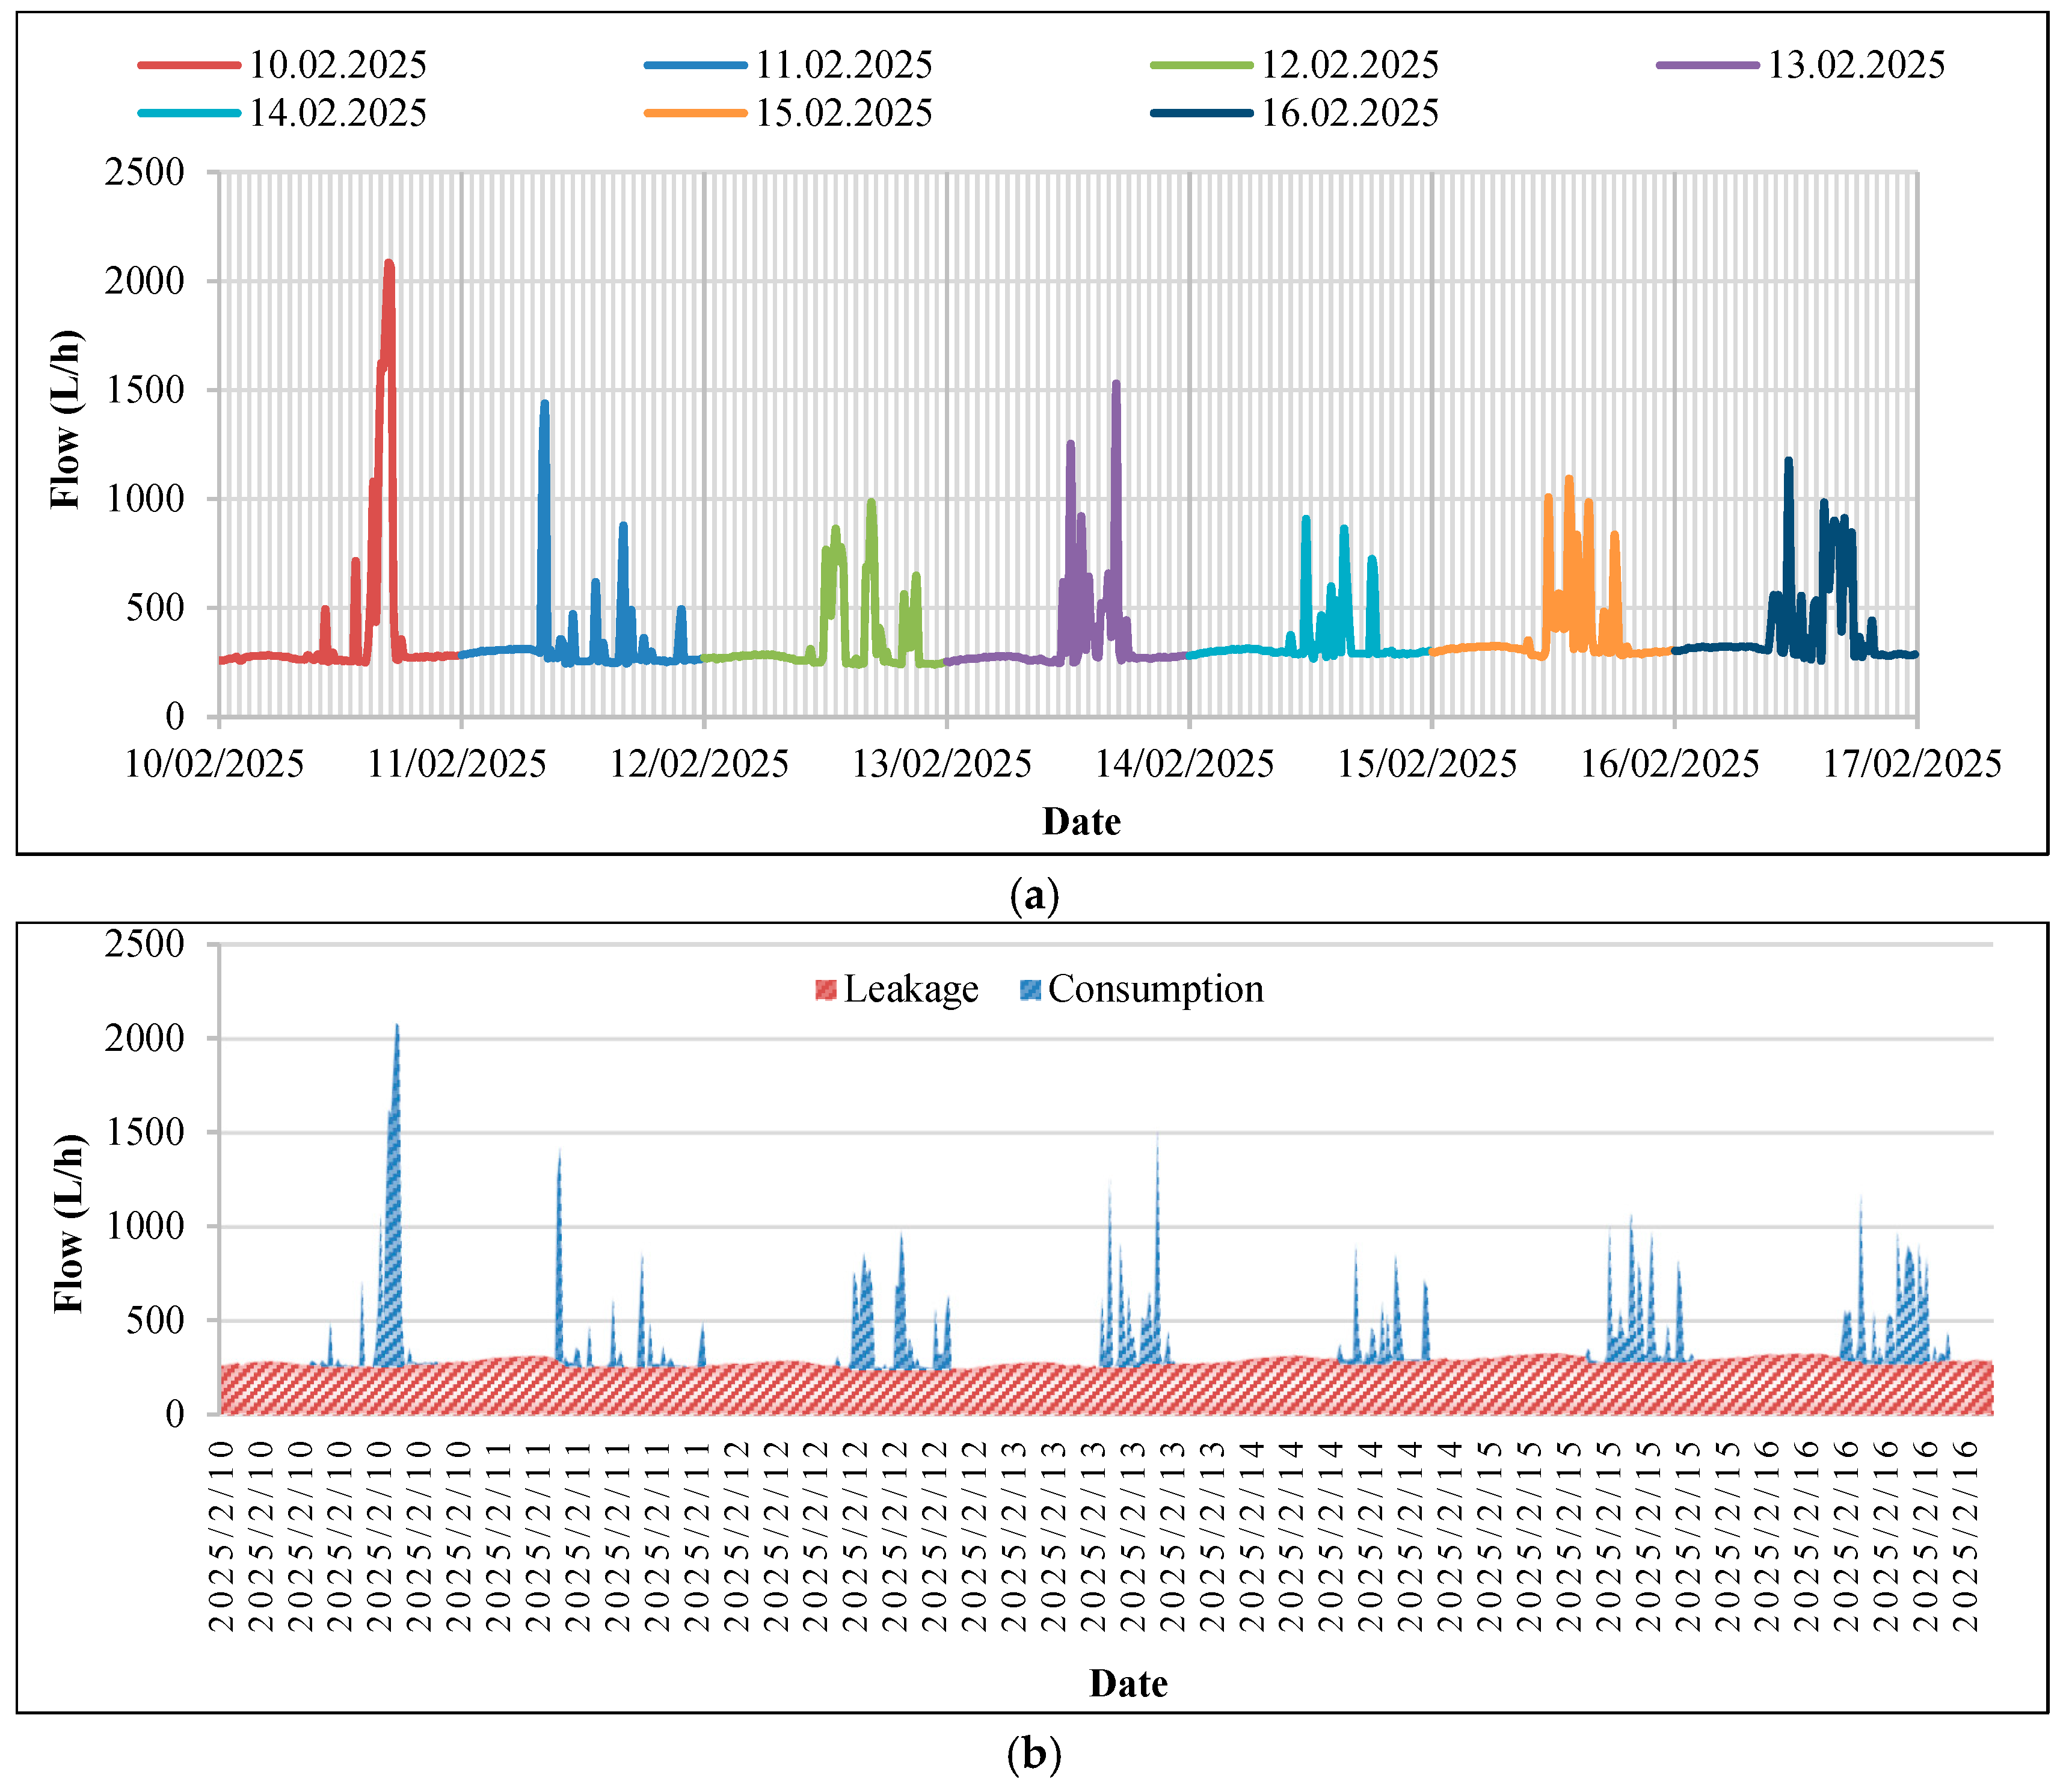
Figure 4a presents one week of monitored flow data for a cemetery in February 2025 where
Figure 4b presents the separation of leakage from total flow for the same site. Weekday flows were higher than weekend flows due to regular funeral activities. However, flow rates remained consistently above 180 L/h, indicating continuous leakage. Parks and cemeteries are particularly prone to post-meter leakages due to their physical layout, which typically has long internal distribution networks. Numerous taps, irrigation points, and open pipe ends increase unnoticed leakage. Mosques contain numerous ablution taps, tanks and internal plumbing systems that remain under continuous pressure and causes low-flow but persistent leakages. Schools, public toilets, health service units and municipal buildings are also susceptible to post-meter leakage because of extensive internal plumbing systems, a high number of fixtures, and intensive daily use. In such facilities, taps left open, aging or damaged fittings, faulty valves, and mechanical wear can lead to continuous low-flow leaks that often remain undetected for long periods. These leaks are typically observed as persistent MNF and systematically increase monthly flow records.
Table 1 presents the total monthly volumes of flow, consumption and post-meter leakage for the investigated public areas for the monitoring period of nine months from 1 January to 30 September 2025.
The leakage analysis revealed substantial post-meter leakage for most of the investigated public areas. The highest absolute leakage volumes were observed in schools (7955 m3), cemeteries (3233 m3), and mosques (2721 m3), while mosques exhibited the highest relative leakage ratio (0.77), followed by cemeteries (0.68) and schools and parks (both 0.66). Public toilets also showed considerable leakage (1106 m3; 0.56). In contrast, health service units and municipal buildings presented lower leakage ratios (0.32 and 0.44, respectively). These results indicate that facilities with extensive internal plumbing and multiple fixtures are more prone to post-meter leakage, supporting the need for targeted monitoring and internal leakage management in high-risk public areas.
4. Conclusions
The implementation of smart metering provides substantial environmental, social, and economic benefits, including detection of post-meter leakages, reduced operational costs, improved billing accuracy, enhanced customer engagement, increased revenues, and significant reductions in water consumption. Analysis of the high-resolution data enables quantification of leakage volumes and assessment of their contribution to total demand. The results of this study show that post-meter leakages in the investigated public areas were significant increasing operational costs, energy consumption, and greenhouse gas emissions. These findings are consistent with previous studies in the literature, which have reported that smart metering and high-resolution consumption monitoring are effective tools for identifying leakages and improving urban water demand management. The study demonstrates that advanced monitoring and analytics can support targeted interventions, improving water efficiency and climate-resilient urban water management.
Author Contributions
Conceptualization, A.M. and H.M.; methodology, A.M.; validation, B.E., T.A. and M.C.E.; formal analysis, B.E.; investigation, T.A.; writing—original draft preparation, A.M.; writing—review and editing, A.M.; visualization, B.E.; supervision, H.M. All authors have read and agreed to the published version of the manuscript.
Funding
This research was funded by the European Union (Instrument for Pre-Accession Assistance (IPA II) frame) and the Republic of Türkiye (Ministry of Environment, Urbanization and Climate Change) through Climate Change Adaptation Grant Programme (CCAGP)-EuropeAid/170484/ID/ACT/TR, grant number TR2017 ESOP MI A304/CCAGP/141.
Institutional Review Board Statement
Not applicable.
Informed Consent Statement
Not applicable.
Data Availability Statement
The datasets generated and/or analyzed during the current study are not publicly available in order to comply with privacy and ethical requirements.
Conflicts of Interest
The authors declare no conflicts of interest.
References
- Biswas, A.; Sarkar, S.; Das, S.; Dutta, S.; Choudhury, M.R.; Giri, A.; Bera, B.; Bag, K.; Mukherjee, B.; Banerjee, K.; et al. Water scarcity: A global hindrance to sustainable development and agricultural production—A critical review of the impacts and adaptation strategies. Wate 2025, 3, e4. [Google Scholar] [CrossRef]
- United Nations. The United Nations World Water Development Report, 2023: Partnerships and Cooperation for Water; UNESCO: Paris, France, 2023. [Google Scholar]
- Kanakoudis, V.; Muhammetoglu, H. Urban water pipe networks management towards non-revenue water reduction: Two case studies from Greece and Turkey. Clean-Soil Air Water 2014, 42, 880–892. [Google Scholar] [CrossRef]
- Gupta, A.D.; Pandey, P.; Feijóo, A.; Yaseen, Z.M.; Bokde, N.D. Smart water technology for efficient water resource management: A Review. Energies 2020, 13, 6268. [Google Scholar] [CrossRef]
- Koech, R.; Cardell-Oliver, R.; Syme, G. Smart water metering: Adoption, regulatory and social considerations. Australas. J. Water Resour. 2021, 25, 173–182. [Google Scholar] [CrossRef]
- Randall, T.; Koech, R. Smart water metering technology for water management in urban areas. Water E-J. 2019, 4, 1–14. [Google Scholar] [CrossRef]
- Zapata-Sierra, A.J.; Salmerón-Manzano, E.; Alcayde, A.; Zapata-Castillo, M.L.; Manzano-Agugliaro, F. The scientific landscape of smart water meters: A comprehensive review. Water 2024, 16, 113. [Google Scholar] [CrossRef]
- Lalle, Y.; Fourati, M.; Fourati, L.C.; Barraca, J.P. Communication technologies for Smart Water Grid applications: Overview, opportunities, and research directions. Comput. Netw. 2021, 190, 107940. [Google Scholar] [CrossRef]
- Gurung, T.R.; Stewar, R.A.; Beal, C.D.; Sharma, A.K. Smart meter enabled water end-use demand data: Platform for the enhanced infrastructure planning of contemporary urban water supply networks. J. Clean. Prod. 2015, 87, 642–654. [Google Scholar] [CrossRef]
- Britton, T.; Stewart, R.A.; O’Halloran, K. Smart metering: Enabler for rapid and effective post meter leakage identification and water loss management. J. Clean. Prod. 2013, 54, 166–176. [Google Scholar] [CrossRef]
- Muhammetoglu, A.; Albayrak, Y.; Bolbol, M.; Enderoglu, S.; Muhammetoglu, H. Detection and assessment of post meter leakages in public places using smart water metering. Water Resour. Manag. 2020, 34, 2989–3002. [Google Scholar] [CrossRef]
| Disclaimer/Publisher’s Note: The statements, opinions and data contained in all publications are solely those of the individual author(s) and contributor(s) and not of MDPI and/or the editor(s). MDPI and/or the editor(s) disclaim responsibility for any injury to people or property resulting from any ideas, methods, instructions or products referred to in the content. |