Proceeding Paper

Integrated Hydraulic Modeling of the Lamia Water Distribution Network for Enhanced Resilience †

by
Yiannis Tsiortos
1,
Aikaterini Lyra
1,*,
Pantelis Sidiropoulos
2,
Lampros Vasiliades
1 and
Nikitas Mylopoulos
1
1
Laboratory of Hydrology and Aquatic Systems Analysis, Department of Civil Engineering, School of Engineering, University of Thessaly, 38334 Volos, Greece
2
Laboratory of Hydraulic Works and Environmental Management, School of Rural and Surveying Engineering, Aristotle University of Thessaloniki, 54124 Thessaloniki, Greece
*
Author to whom correspondence should be addressed.
Presented at the 9th International Electronic Conference on Water Sciences, 11–14 November 2025; Available online: https://sciforum.net/event/ECWS-9.
Environ. Earth Sci. Proc. 2026, 40(1), 7; https://doi.org/10.3390/eesp2026040007
Published: 4 March 2026
(This article belongs to the Proceedings of The 9th International Electronic Conference on Water Sciences)

Abstract

Urban water distribution networks face increasing challenges related to operational efficiency and demand variability, which require accurate hydraulic modeling and robust calibration frameworks that address data limitations. This study develops and applies a hydraulic simulation model of the water distribution network of the city of Lamia, in Greece. The model represents both the external aqueducts and the internal distribution system of pipelines, storage tanks, pumping stations, and pressure-reducing valves. Hydraulic simulation was performed using a 72 h Extended-Period (EPS) with hourly demand patterns, while calibration/validation were based on SCADA-derived operational data. Several statistical indicators demonstrated strong agreement between observed and simulated values. The results confirm the model’s ability to accurately reproduce real network operation, providing a foundation for Digital Twin implementation, operational optimization, and sustainable urban water management.

1. Introduction

Fundamental infrastructures of organized societies are the water distribution networks because they promote and safeguard public health, economic activity, and social stability [1]. The resilience of modern urban centers is linked to the resilience of water distribution networks to withstand operational stresses and external physical disturbances that are commonly measured and designed based on measures of serviceability, pressure recovery, and failure mitigation scenarios [2]. However, aging infrastructure, demand variability due to climate and tourism variability, and limited data availability place additional pressure on the completion of their utility aims. Accordingly, this emphasizes the need for prior knowledge-based design and management through advanced modeling and decision-support tools. In this direction, integrated hydraulic modeling has become a pivotal applied solution for the analysis of the performance and the improvement of resilience of water distribution systems. Their performance is estimated through the combination of scientific methods to represent real water system responses, such as the extended-period hydraulic simulation, demand and storage variability, and virtual operational controls under normal and stressed conditions [3,4]. A few of the most well-known modern modeling platforms, including WaterGEMS and EPANET, provide advanced functionalities such as Extended Period Simulation (EPS), asset prioritization, scenario-based analysis, and integration with geographic information systems (GIS), which enable dynamic spatial and temporal simulation of urban networks [5,6,7,8,9]. Moreover, the dynamic coupling of hydraulic models with optimization and decision-support methods often leads to the improved effectiveness of repair strategies evaluation, demand management, and beneficial infrastructure upgrades [10,11]. Recent studies emphasize the significance of applying pressure-driven analysis and performance-based assessment, because traditional demand-driven approaches may lead to misinterpretation of results under low-pressure operations [6,12,13]. Case studies worldwide highlight the tangible benefits of integrated modeling applications, such as well-organized risk management, cost minimization, and enhanced serviceability [14]. The latter approach is strengthened by the trend of developing and employing service utility digital twins, where real-time sensors are linked to hydraulic simulation models to guide adaptive performance and proactive management [15,16]. Even though tremendous advancements have been achieved in simulation technologies, significant research gaps often hinder their applicability, particularly regarding harmonized resilience metrics, lack of data and incomplete records, and transferability of calibrated models.
In this context, the present study aims to develop an integrated hydraulic model of the water distribution network of a mid-sized urban center, the city of Lamia, in Greece. The approach addresses data gaps by combining multi-source network data, technological digitization, application of extended-period simulation, and use of SCADA-based calibration, and provides a reliable modeling framework that endorses resilient urban water management while serving as a foundation for digital twin extension.

2. Materials and Methods

2.1. Study Area

This research is focused on the city of Lamia, in the regional unit of Phthiotis in Greece. Lamia city is a mid-sized urban center with a population of approximately 51,500 residents, and serves as an economic and administrative hotspot of the wider region. The city’s economy is mainly based on commercial and tourist services, and small-to-medium-sized food processing facilities and other manufacturing units [17]. Geographically, the city is located at 67 m elevation in the plain area formed by the surrounding mountains of Othrys (1711 m), Kallidromo (1400 m), and Giona (2510 m). Hydrologically, it is in the Spercheios River Basin, which is bounded on the east side by the Maliakos Gulf (Figure 1). The climate of the plain is classified as typical Mediterranean, with an annual precipitation of 570 mm, and a mean temperature of 16.5 °C. Cotton and rice are cultivated in the plains, while orchards and livestock are encountered in the mountainous areas. The basin exhibits adequate water balance, and the urban water needs are covered by the contributory river to the Spercheios River, the Gorgopotamos River (≈10 km from the city), and by natural groundwater springs nearby, the Taratsa springs (≈4 km from the city). The Gorgopotamos aqueduct supplies 78% of the total inflow, while the Taratsa springs supply the remaining 22%, through a unidirectional configuration. Water is conveyed through the outer aqueduct to central storage and distributed through the inner network. This asymmetric and storage-dependent supply, combined with demand heterogeneity, makes Lamia a technically challenging case for integrated hydraulic modeling and operational calibration.

2.2. Data Collection and Digitization

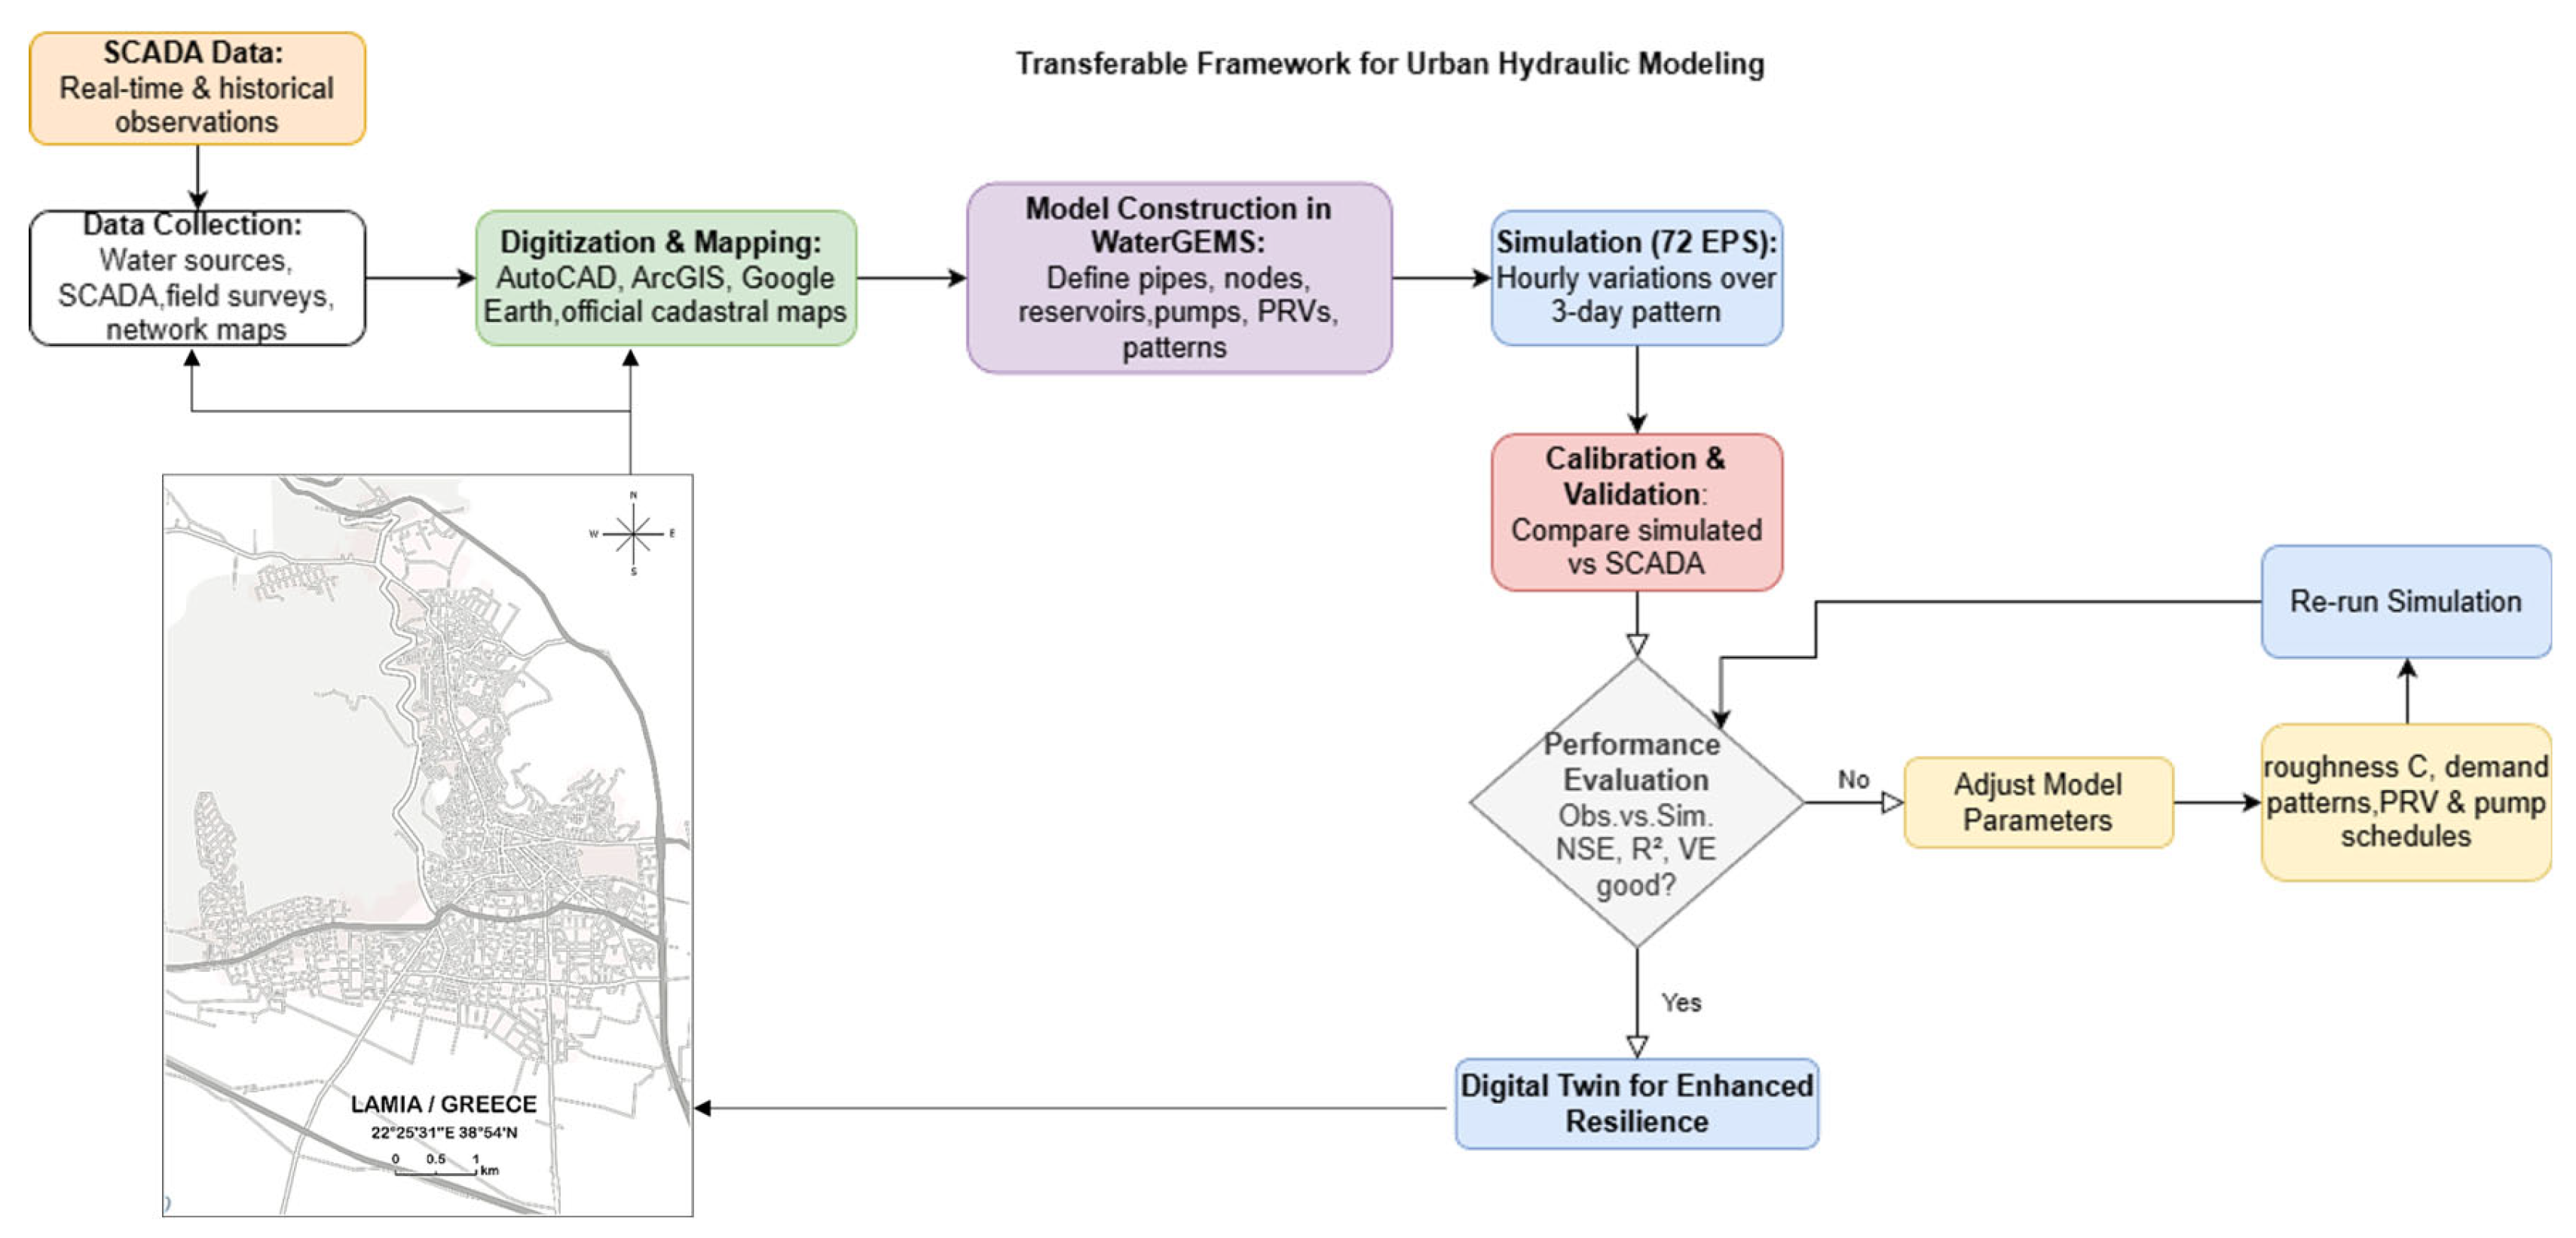
Operational data were obtained from the Municipal Water Supply and Sewerage Company of Lamia. Demand data were provided from water meter records on a yearly basis, while data from the SCADA system covered water levels at 14 storage tanks at 5 min intervals. The raw data were processed into hourly timesteps for the calibration and validation of the hydraulic model. Water uses are categorized into domestic, with specific water consumption at 105 L/capital/day, commercial and services with specific water consumption at 0.25 m3/unit/day, and total industrial with water demand at 5000 m3/day, including allowance for peak demands and development according to observed data. Network losses account for 14% of water demand. The spatial design of the water distribution network included the use of multi-source platforms to establish a complete spatial representation. The water distribution network expands to 253 km of pipelines, and the digitization was based on AutoCAD 2022 drawings, ArcGIS 10.8.2, Google Earth Pro 7.3.6, and georeferenced imagery maps from the Hellenic Cadastre. The digitization process included the establishment of pipes, storage tanks, pumping stations, node locations, pressure-reducing valves (PRV), and flow-control valves (FCV), which were validated through cross-referencing between sources. The modeling process is shown in Figure 2.

2.3. Hydraulic Model Construction in WaterGEMS and Simulation Setup

The digitized network was employed in WaterGEMS to assist with hydraulic modeling. The simulation timestep was set at an hourly scale, while the demand patterns were determined based on the Uniform Demand Distribution method. The city’s blocks were categorized based on the number and size of buildings, type of water use, and estimated number of residents per block. The network was divided into 14 supply zones according to the tank utility. The hydraulic model solves the continuity equation at nodes, as shown in Equation (1) [18]:
Q i n Q o u t = D
where Q i n , Q o u t are the sum of inflows and outflows at a network node (m3/s), respectively, and D is the water used at a node (m3/s). The energy conservation equation along pipes with head losses is computed using the Hazen–Williams method based on the physical characteristics of the network materials and topology, as shown in Equation (2) [18]:
h L = 10.67 L C 1.852 D 4.87 Q 1.852
where h L is the head loss due to friction along a pipe (m), L is the pipe length (m), D is the pipe internal diameter (m), C is the Hazen–Williams roughness coefficient, and Q is the volumetric flow rate in a pipe (m3/s). The tank storage variations are computed through mass-balance equations within a 72 h Extended Period Simulation (EPS) with hourly time step intervals to capture the functional performance of high and low demand curves, as shown in Equation (3) [18]:
d V d t = Q i n Q o u t
where d V d t is the rate of change in tank storage volume over time (m3/s), Q i n is the total inflow rate to the tank, including contributions from aqueducts, pumping stations, or upstream pipelines (m3/s), and Q o u t is the total outflow rate from the tank supplying downstream demand zones, pipelines, or other storage tanks (m3/s). The calibration and validation of the modeled network were based on the tank water level data from SCADA. Its performance was evaluated using the statistical indicators of Nash–Sutcliffe Efficiency (NSE), coefficient of determination (R2), and Volumetric Efficiency (VE) as given in Equations (4)–(6), where x denotes the observed and y denotes the simulated tank water levels [19,20].
N S E = 1 i = 1 n ( x i y i ) 2 i = 1 n ( x i x ¯ ) 2
R 2 = i = 1 n ( x i x ¯ ) ( y i y ¯ ) 2 i = 1 n ( x i x ¯ ) 2 i = 1 n ( y i y ¯ ) 2
V E = 1 i = 1 n y i x i i = 1 n x i

3. Results and Discussion

3.1. Network Digitization–Model Development

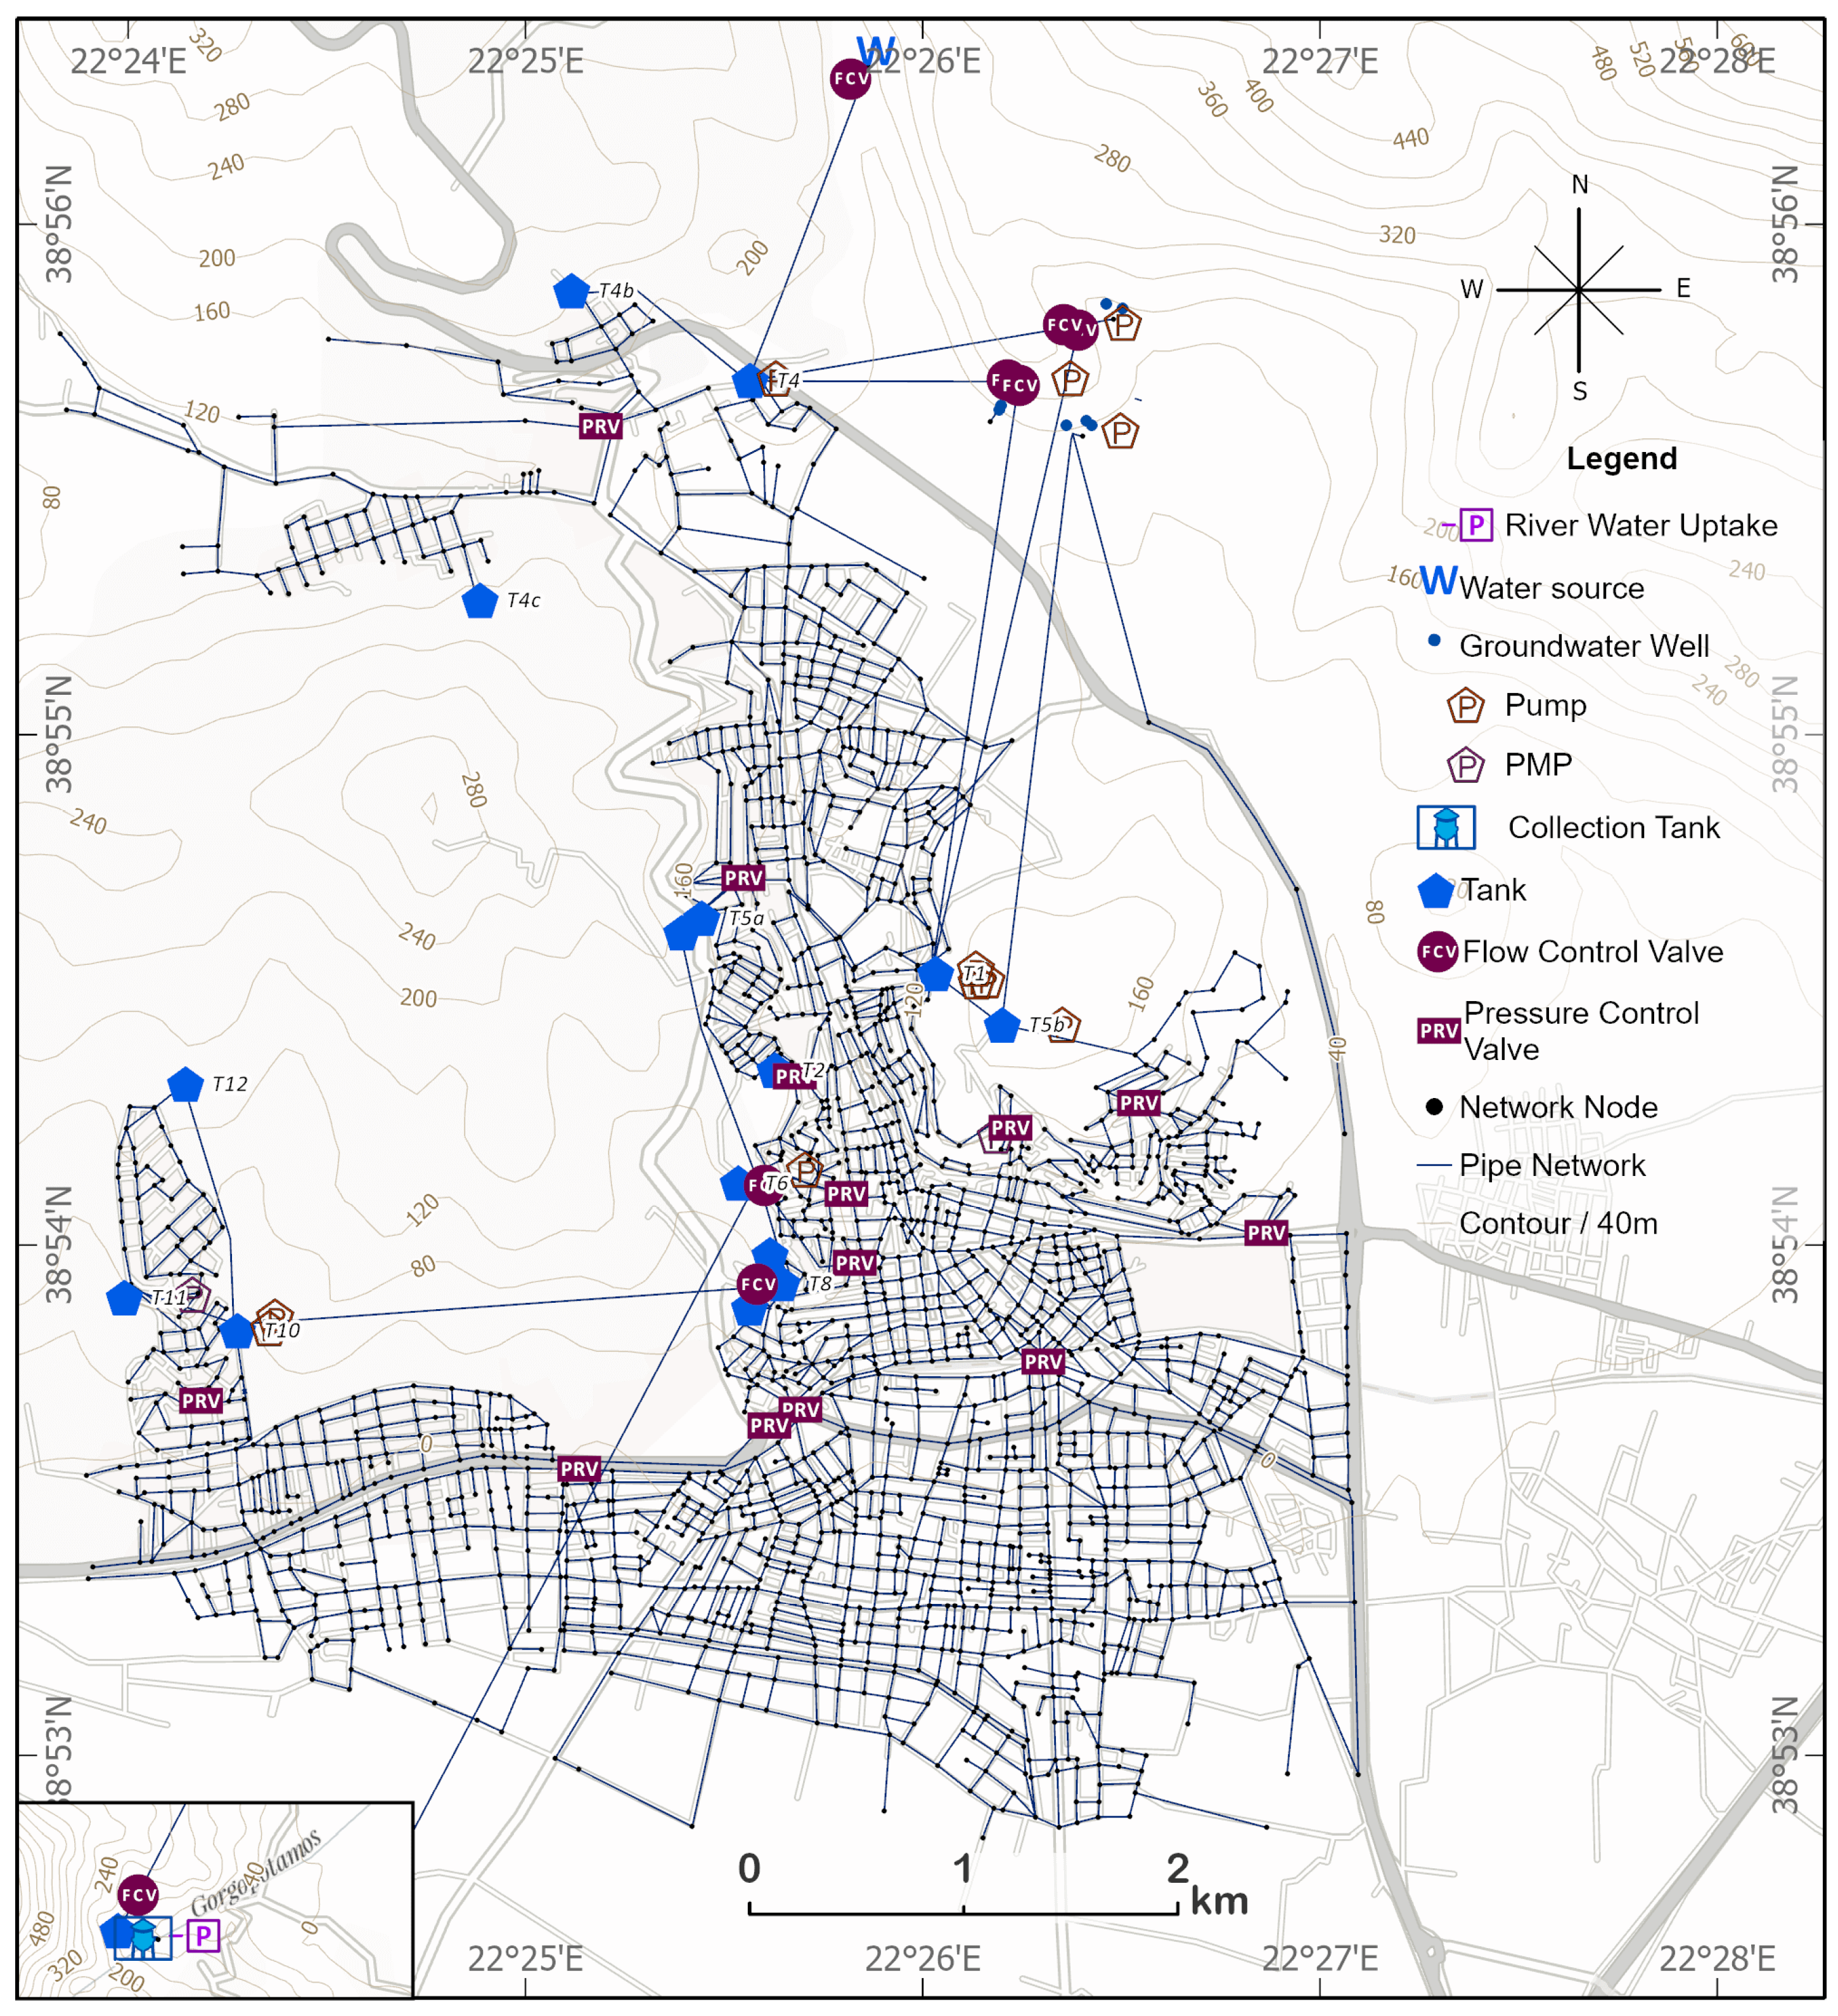
The application of the presented methodology resulted in the complete digitization, georeferencing and harmonization of all the available data on the structure of the hydraulic network. The finalized digital network comprises of 253 km of pipelines, 2079 nodes and 14 storage tanks. The daily water supply from the two aqueducts amounts to 26,529 m3/day, while the daily demand is about 23,312 m3/day. The hourly demand patterns were estimated through calibration, with peak demand at daylight. The digital network is shown in Figure 3.

3.2. Model Performance Metrics

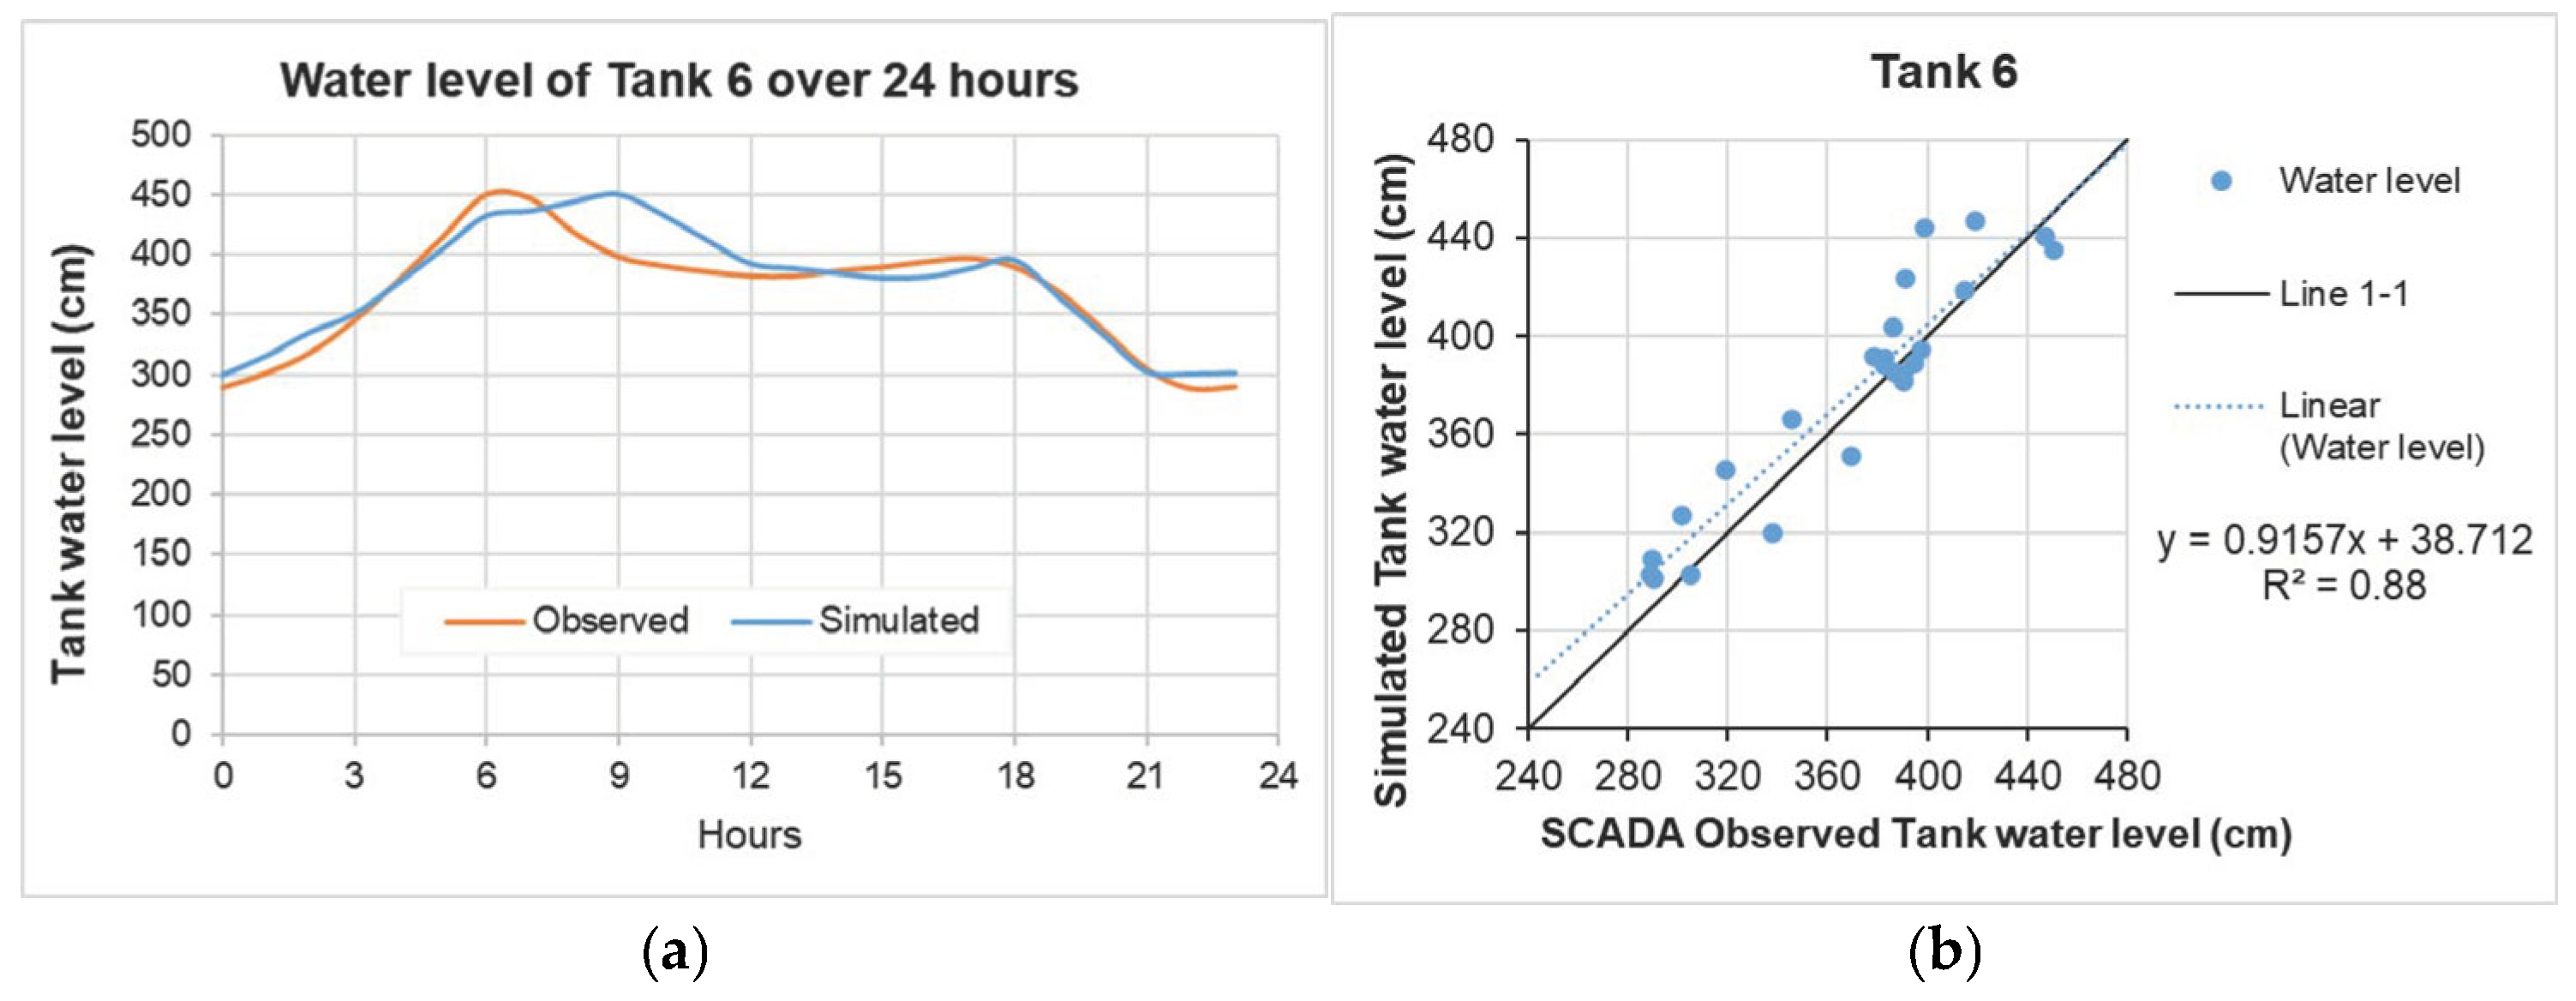
The hydraulic simulation was conducted using WaterGEMS for an Extended Period Simulation (EPS) of 72 h on an hourly interval. The calibration of the model was based on the evaluation of the water levels of the storage tanks, and especially of Tank 6, which controls approximately 77% of the network’s water balance. Tank 6 receives water from the external aqueduct of Gorgopotamos, and serves the Tanks 3, 7 and 8 of the central network. The statistical indicators for the performance of the water network achieved high values, where Nash–Sutcliffe Efficiency (NSE) scored 0.78, R2 was estimated at 0.82, and Volumetric Efficiency (VE) scored 0.97, indicating strong performance and reliability of the results. Particularly for Tank 6, the metrics scores are 0.85 for (NSE), 0.88 for R2, and 0.96 for (VE). The observed and simulated water levels of Tank 6 are shown in Figure 4.

3.3. Pressure and Velocity Distribution

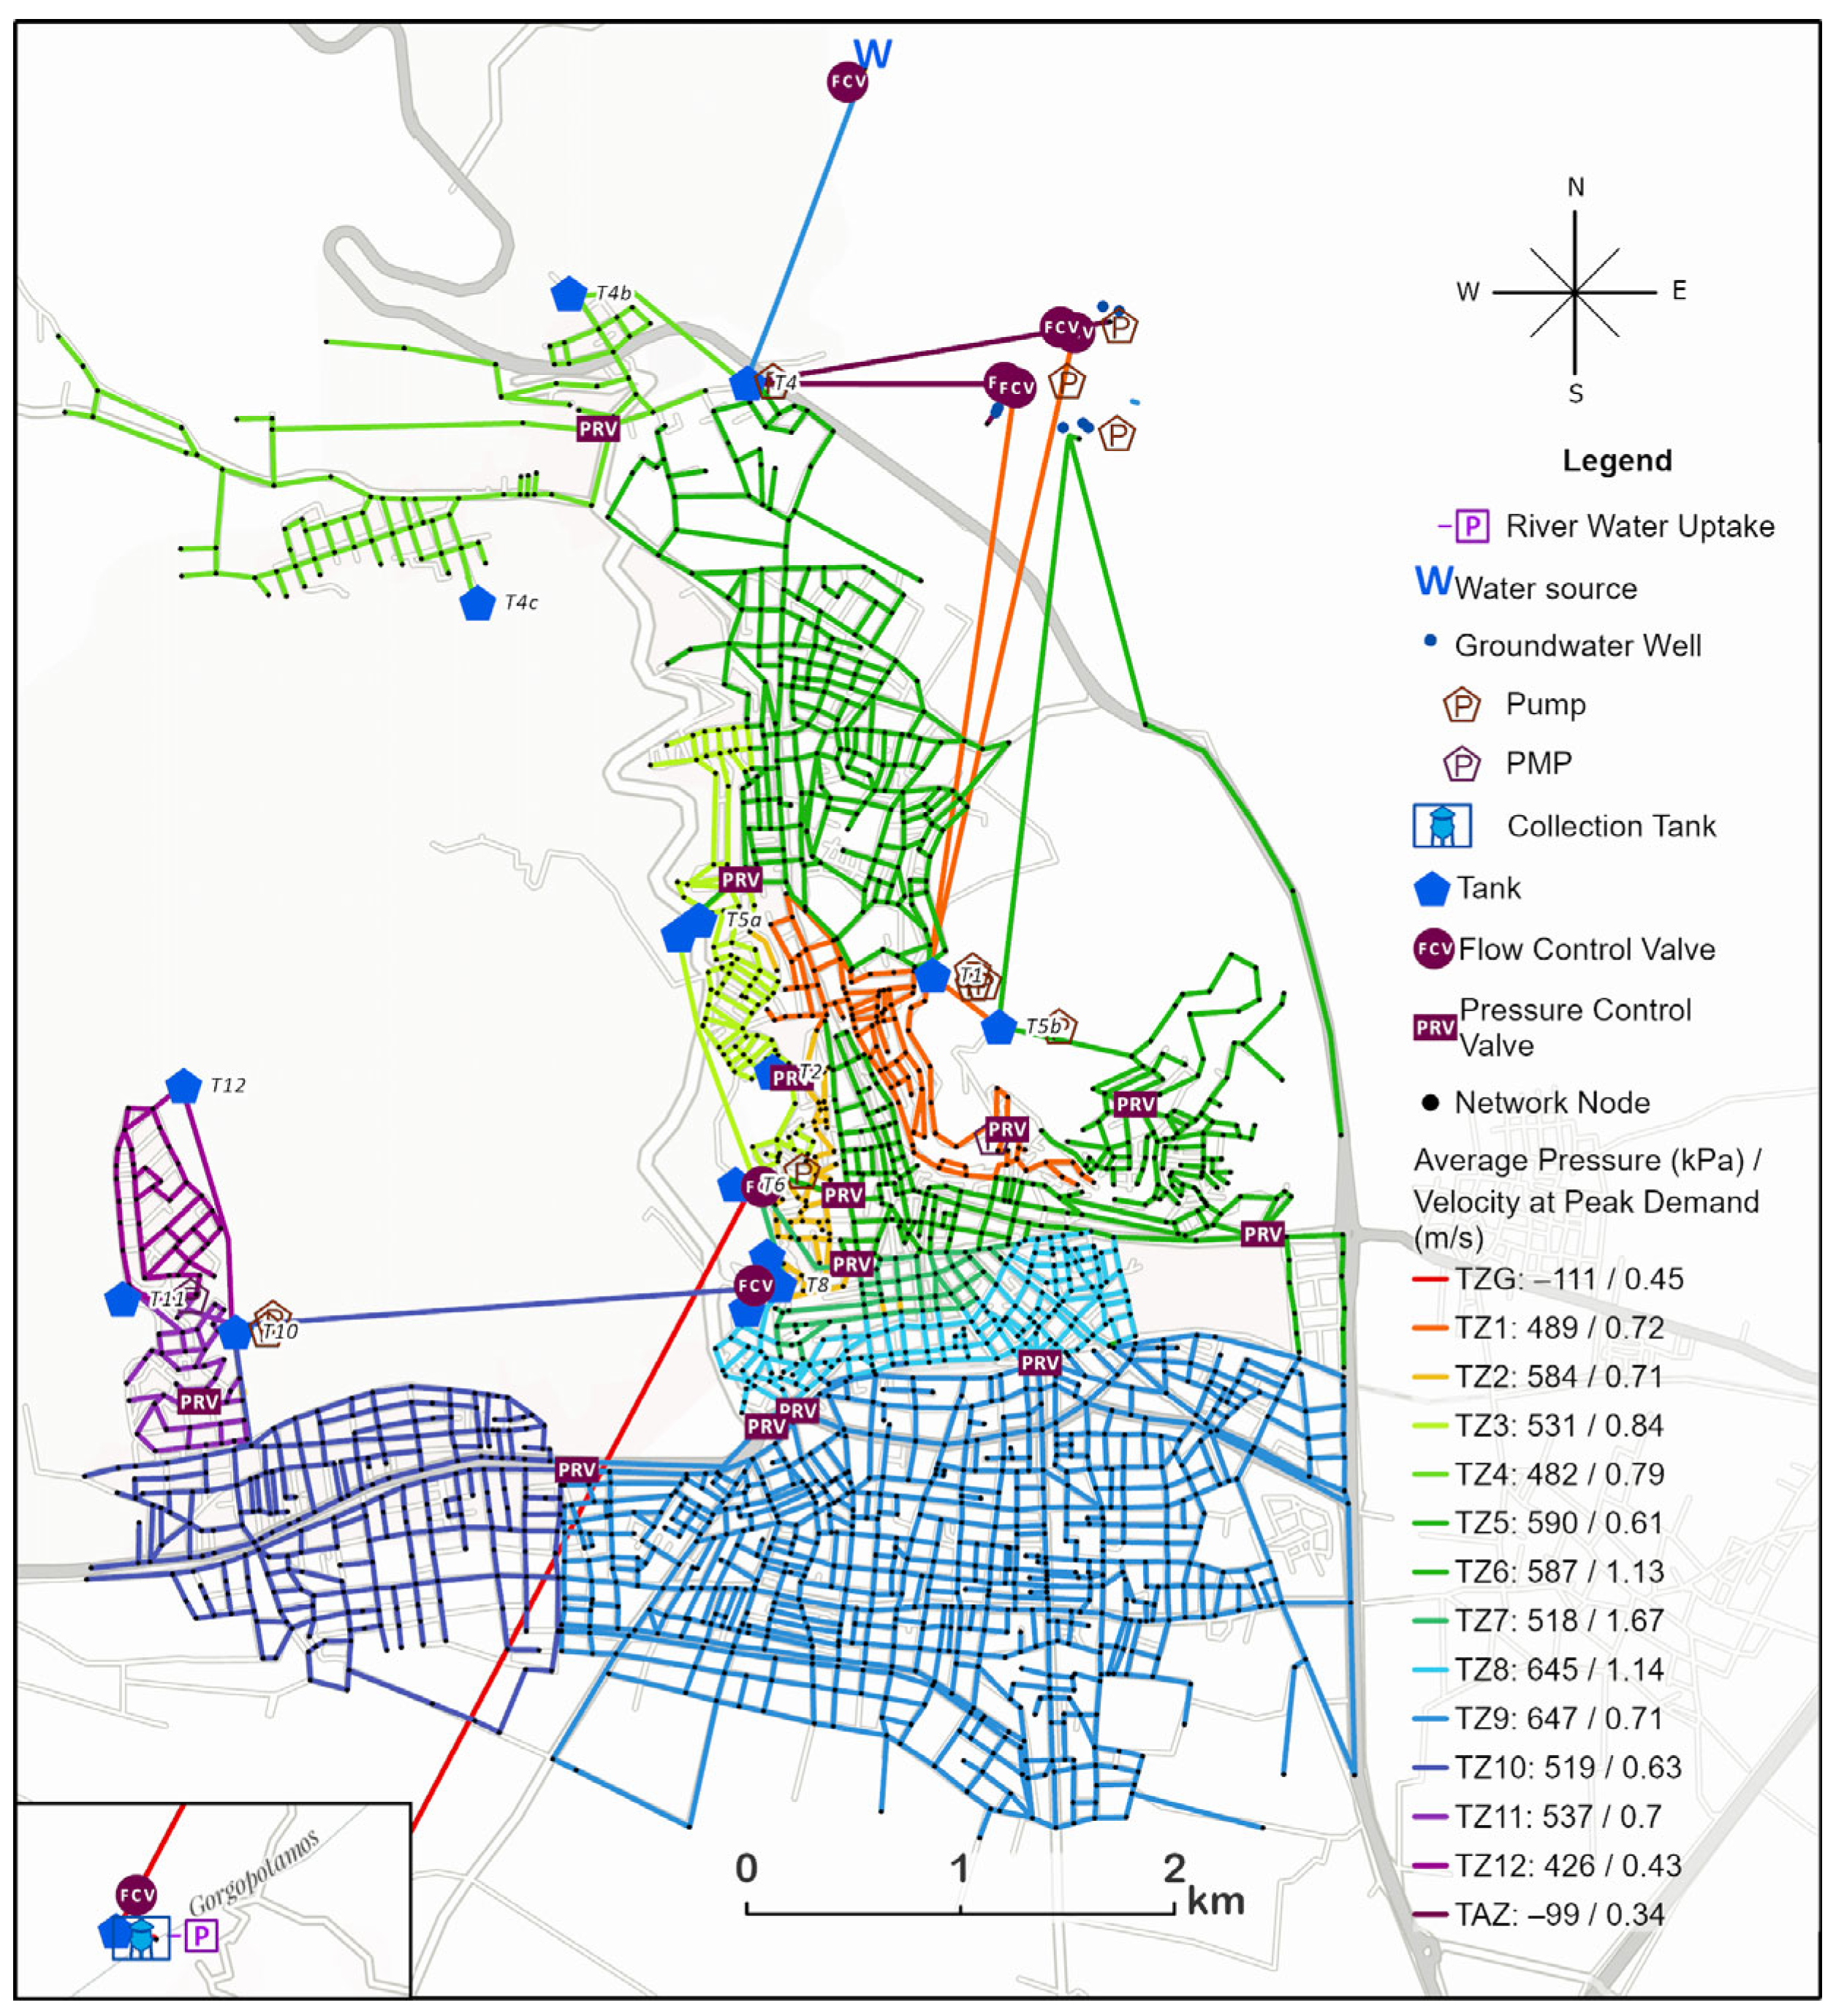
The average zonal pressure of the network is approximately 546 kPa, which is within acceptable operational limits of urban water supply systems, and the most pressurized zones are Tank Zones 8 and 9 in the central-southern part of the network. The peak pipe flow velocities average to 0.84 m/s and remain below 1.7 m/s in all utility zones, with comparatively higher velocities larger than 1 m/s in Tank Zones 6, 7, and 8, following the distribution of pipe pressures. The distribution of pressures and peak velocities of the water network is shown in Figure 5.
The geometric structure of the network allows Tank Zone 9 to entail multiple connections and loops, which promote the natural internal control and stability of the water supply network, while keeping lower velocities and expanding to the largest part of the city. Tank Zones 3 to 7 present fewer connections and loops than TZ9, but depend on pressure control valves (PRVs) for the pressure regulation due to the lower elevation of the area. Tank Zones 10, 11 and 12 are based on fewer loops but are located in similar elevation to Tank Zone 9, thus enabling the lack of dependence on PRVs. The most sensitive zones to pressure regulation are Tank Zones 1 and 2 that are control-dependent on PRVs and water level of storage Tanks. Consequently, the most hydraulically resilient zones are evaluated to be Tank Zones 8 and 9, and the least resilient are the Tank Zones 1 and 2 that rely heavily on pressure regulation due to the low elevation of the wider area.

4. Conclusions

This study presented the development and application of a digitally integrated hydraulic model of the water supply network of Lamia, Greece, aimed at improving system understanding, operational performance, and decision support for enhanced resilience. Results demonstrated that zonal structural differences in elevation, geometrical layout, and dependence on pressure regulation mechanisms define the network resilience. An optimized operational scenario is recommended that (i) maximizes supply through hydraulically resilient zones (TZ8–TZ9), (ii) reduces excessive PRV dependence in low-lying zones through targeted pressure zoning or storage rebalancing, and (iii) maintains pipe velocities below 1.7 m/s to minimize energy losses and structural stress. Beyond its immediate application, the Lamia water distribution network model provides a foundational step toward a digital twin implementation. Multi-source data harmonization and performance-based calibration can promote resilience assessment and operational efficiency in mid-sized urban centers. These results reinforce the importance of data-driven resilience planning for sustainable and reliable service under climatic and operational pressures.

Author Contributions

Conceptualization, P.S. and N.M.; methodology, P.S.; software, Y.T.; validation, Y.T.; formal analysis, Y.T. and A.L.; investigation, Y.T.; resources, L.V.; data curation, Y.T.; writing—original draft preparation, Y.T. and A.L.; writing—review and editing, A.L.; visualization, A.L.; supervision, N.M.; project administration, L.V. All authors have read and agreed to the published version of the manuscript.

Funding

This research received no external funding.

Institutional Review Board Statement

Not applicable.

Informed Consent Statement

Not applicable.

Data Availability Statement

The original contributions presented in this study are included in the article. Further inquiries can be directed to the corresponding author.

Conflicts of Interest

The authors declare no conflicts of interest.

References

  1. Ferdowsi, A.; Piadeh, F.; Behzadian, K.; Mousavi, S.-F.; Ehteram, M. Urban Water Infrastructure: A Critical Review on Climate Change Impacts and Adaptation Strategies. Urban Clim. 2024, 58, 102132. [Google Scholar] [CrossRef] [Scilit]
  2. Ulusoy, A.-J.; Stoianov, I.; Chazerain, A. Hydraulically Informed Graph Theoretic Measure of Link Criticality for the Resilience Analysis of Water Distribution Networks. Appl. Netw. Sci. 2018, 3, 31. [Google Scholar] [CrossRef] [Scilit] [PubMed]
  3. Rasoulkhani, K.; Mostafavi, A.; Cole, J.; Sharvelle, S. Resilience-Based Infrastructure Planning and Asset Management: Study of Dual and Singular Water Distribution Infrastructure Performance Using a Simulation Approach. Sustain. Cities Soc. 2019, 48, 101577. [Google Scholar] [CrossRef] [Scilit]
  4. Berglund, E.Z.; Pesantez, J.E.; Rasekh, A.; Shafiee, M.E.; Sela, L.; Haxton, T. Review of Modeling Methodologies for Managing Water Distribution Security. J. Water Resour. Plan. Manag. 2020, 146, 1–23. [Google Scholar] [CrossRef] [Scilit] [PubMed]
  5. Chu-Ketterer, L.-J.; Murray, R.; Hassett, P.; Kogan, J.; Klise, K.; Haxton, T. Performance and Resilience Analysis of a New York Drinking Water System to Localized and System-Wide Emergencies. J. Water Resour. Plan. Manag. 2023, 149, 05022015. [Google Scholar] [CrossRef] [Scilit] [PubMed]
  6. Khatavkar, P.; Mays, L.W. Resilience of Water Distribution Systems during Real-Time Operations under Limited Water and/or Energy Availability Conditions. J. Water Resour. Plan. Manag. 2019, 145, 04019045. [Google Scholar] [CrossRef] [Scilit]
  7. Villa, D.; Hart, D.; Klise, K.; Bynum, M.; Laird, C.; Seth, A.; Moriarty, D.; Hogge, J.; Bonney, K. Water Network Tool for Resilience (WNTR); U.S. Department of Energy: Oak Ridge, TN, USA, 2023. [CrossRef]
  8. Chu-Ketterer, L.-J.; Platten, W.E., III; Bolenbaugh, S.; Haxton, T. Resilience Analysis and Emergency Response Evaluation for Drinking Water Systems. J. Am. Water Work. Assoc. 2023, 115, 32–42. [Google Scholar] [CrossRef] [Scilit] [PubMed]
  9. Sidiropoulos, P.; Papadomanolakis, A.; Lyra, A.; Mylopoulos, N.; Vasiliades, L. A Modelling Framework for the Hydraulic Simulation of a Water Distribution System Under Data Scarcity: Application in the City of Farsala, Greece. Appl. Sci. 2025, 15, 6124. [Google Scholar] [CrossRef] [Scilit]
  10. Cunha, M.; Marques, J.; Creaco, E. Water Networks Management: Assessment of Heuristic and Exact Approaches for Optimal Valve Location and Operation Settings Schedule. Water 2025, 17, 3249. [Google Scholar] [CrossRef] [Scilit]
  11. Ulusoy, A.-J.; Pecci, F.; Stoianov, I. Bi-Objective Design-for-Control of Water Distribution Networks with Global Bounds. Optim. Eng. 2022, 23, 527–577. [Google Scholar] [CrossRef] [Scilit]
  12. Pordal, A.; Noshadi, M.; Masoudi, M.H. Analysis of Drinking Water Distribution Network Using EPANET Model (Case Study: Part of Shiraz Water Distribution Network). Iran. J. Sci. Technol. Trans. Civ. Eng. 2023, 47, 1791–1799. [Google Scholar] [CrossRef] [Scilit]
  13. Bosco, C.; Campisano, A.; Modica, C.; Pezzinga, G. Application of Rehabilitation and Active Pressure Control Strategies for Leakage Reduction in a Case-Study Network. Water 2020, 12, 2215. [Google Scholar] [CrossRef] [Scilit]
  14. Ghorbani Bam, P.; Rezaei, N.; Roubanis, A.; Austin, D.; Austin, E.; Tarroja, B.; Takacs, I.; Villez, K.; Rosso, D. Digital Twin Applications in the Water Sector: A Review. Water 2025, 17, 2957. [Google Scholar] [CrossRef] [Scilit]
  15. Degeler, V.; Hadadian, M.; Karabulut, E.; Lazovik, A.; van het Loo, H.; Tello, A.; Truong, H. DiTEC: Digital Twin for Evolutionary Changes in Water Distribution Networks. In Proceedings of the Leveraging Applications of Formal Methods, Verification and Validation—Application Areas, 12th International Symposium, ISoLA 2024, Crete, Greece, 27–31 October 2024; Margaria, T., Steffen, B., Eds.; Springer Nature Switzerland: Cham, Switzerland, 2025; pp. 62–82. [Google Scholar]
  16. Alves, D.; Blesa, J.; Duviella, E.; Rajaoarisoa, L. Data-Driven Leak Localization in WDN Using Pressure Sensor and Hydraulic Information. IFAC—PapersOnLine 2022, 55, 96–101. [Google Scholar] [CrossRef] [Scilit]
  17. Bussines Registries—ELSTAT. Available online: https://www.statistics.gr/en/bussines_registries (accessed on 31 December 2025).
  18. Walski, T.; Chase, D.; Savic, D.; Grayman, W.; Backwith, S.; Koelle, E. Advanced Water Distribution Modeling and Management; Haestead Press: Ultimo, Australia, 2003; ISBN 978-0-9714141-2-9. [Google Scholar]
  19. Moriasi, D.; Arnold, J.; Van Liew, M.; Bingner, R.; Harmel, R.D.; Veith, T. Model Evaluation Guidelines for Systematic Quantification of Accuracy in Watershed Simulations. Trans. ASABE 2007, 50, 885–900. [Google Scholar] [CrossRef] [Scilit]
  20. Criss, R.E.; Winston, W.E. Do Nash Values Have Value? Discussion and Alternate Proposals. Hydrol. Process. 2008, 22, 2723–2725. [Google Scholar] [CrossRef] [Scilit]
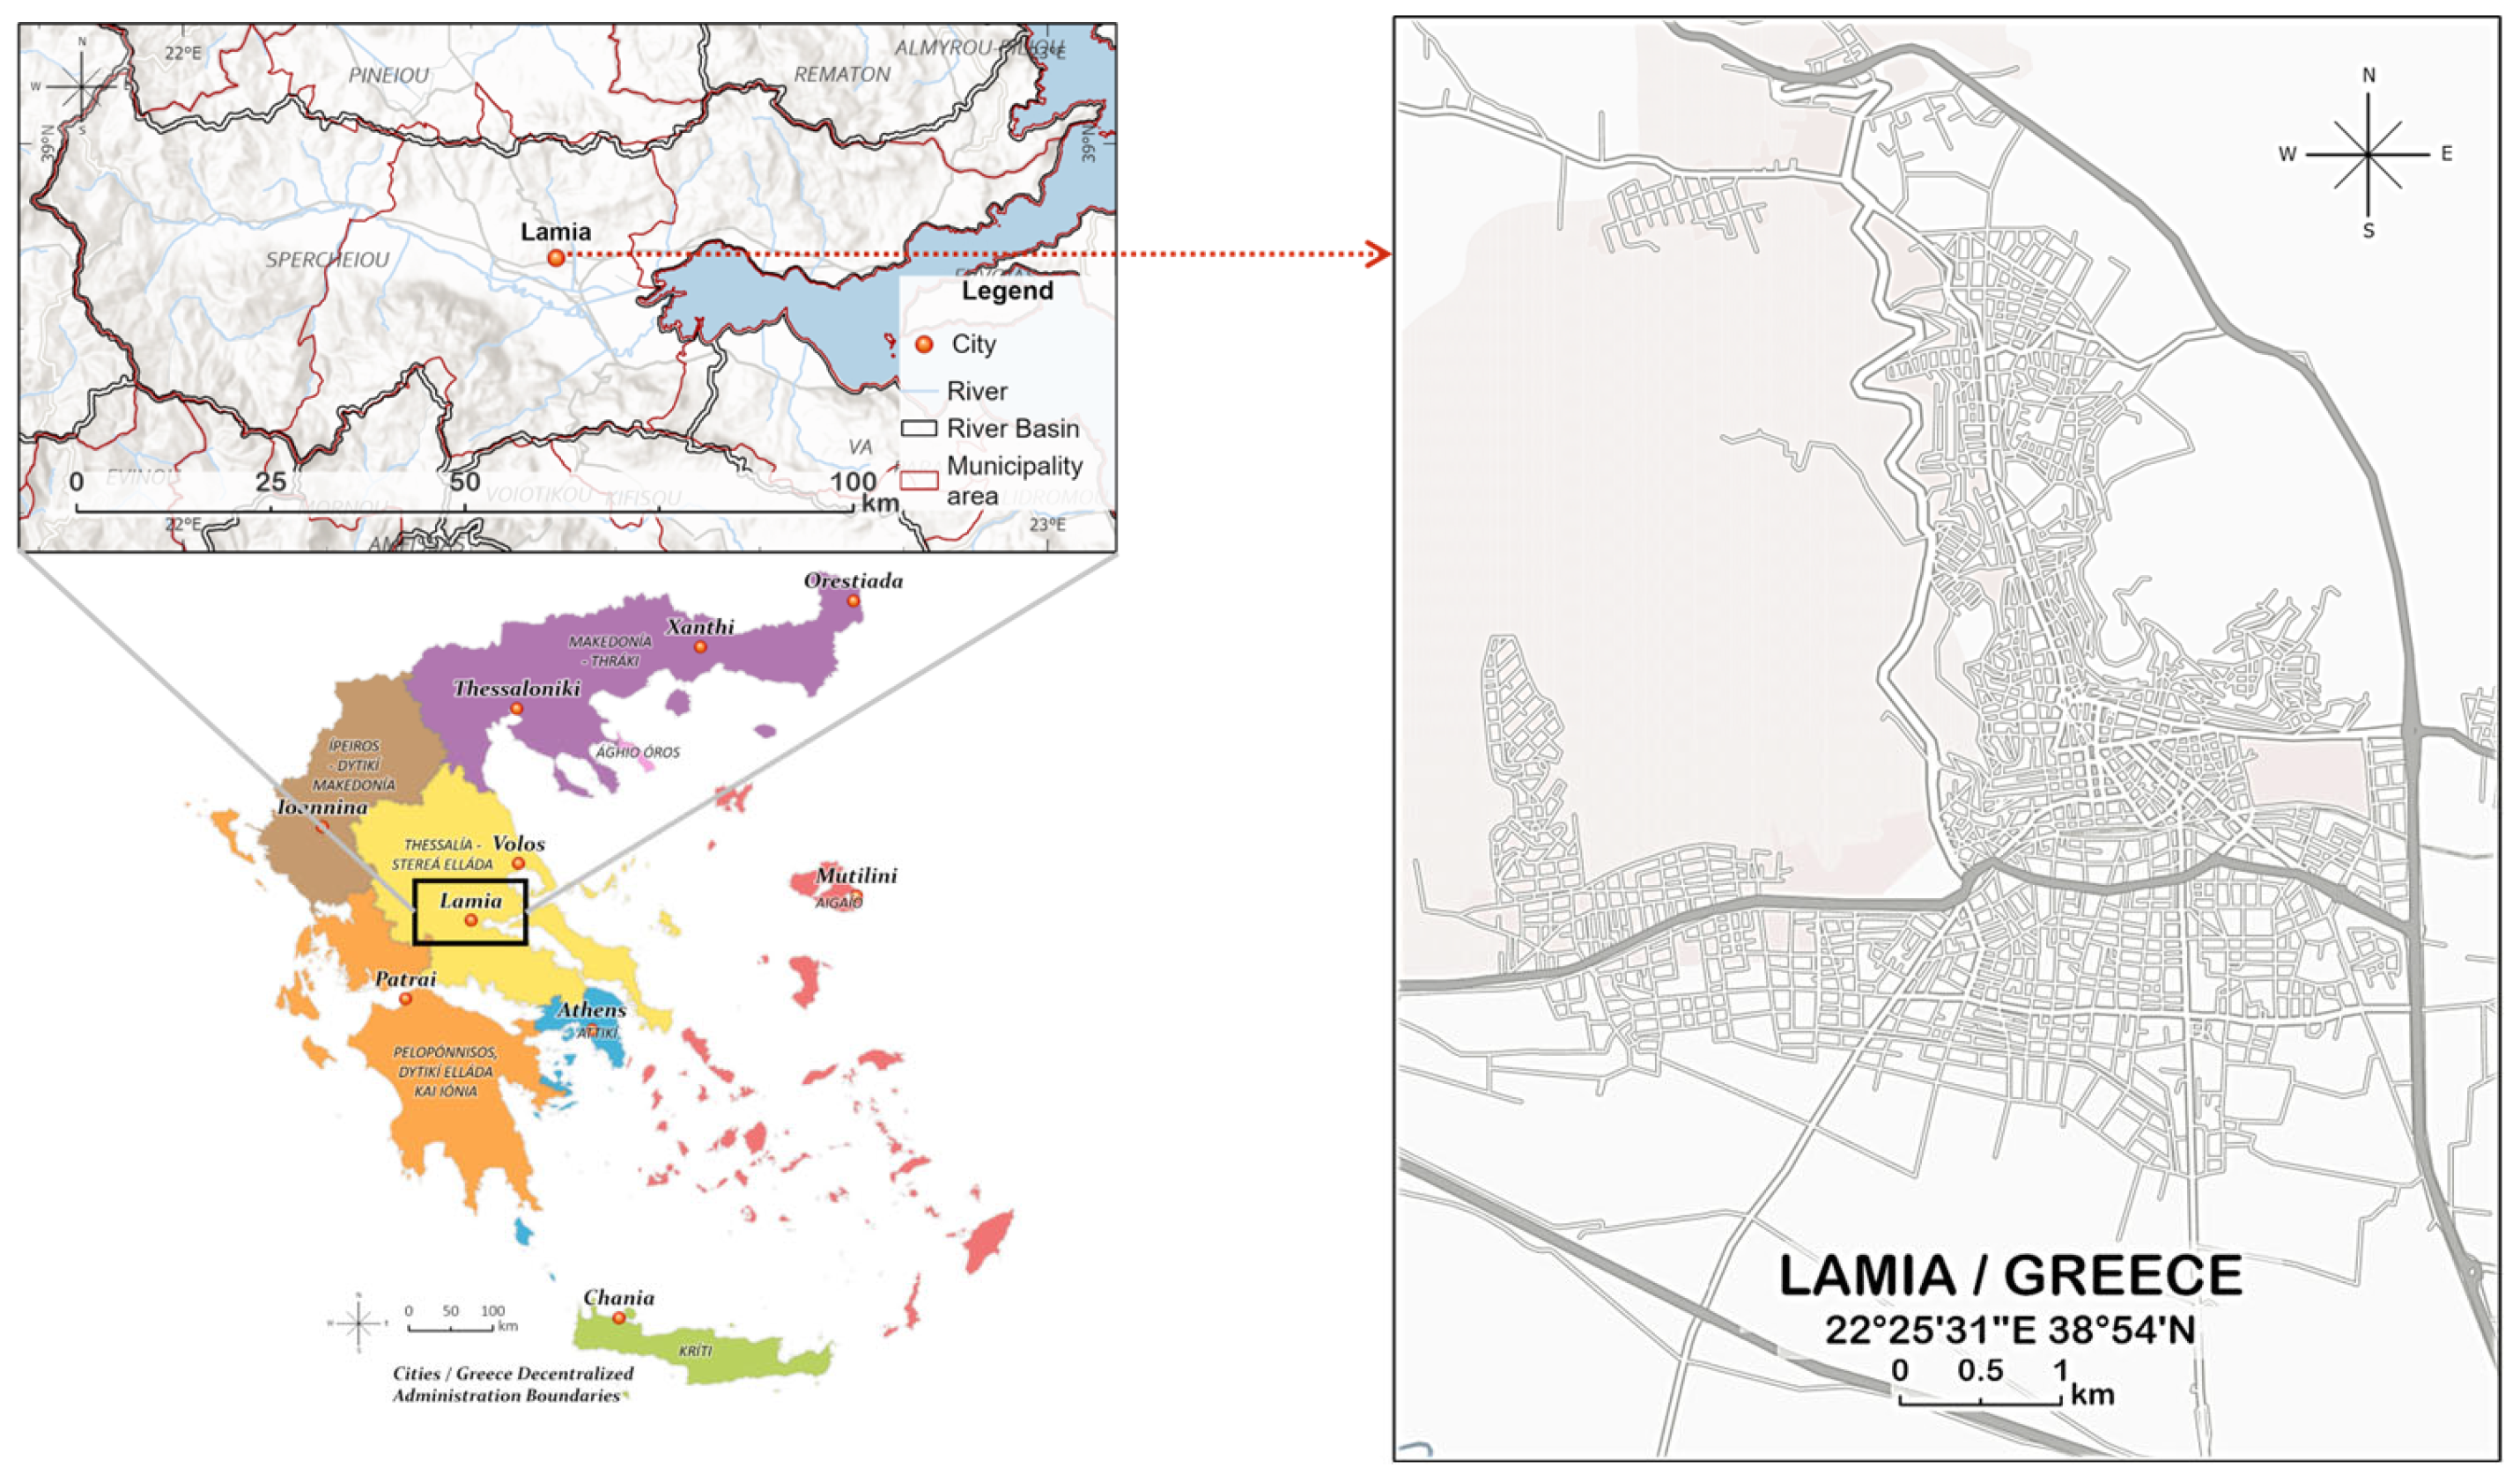
Figure 1. Locator map of the study area, the city of Lamia in Greece.
Eesp 40 00007 g001
Figure 2. Transferable framework for Urban Hydraulic Modeling.
Eesp 40 00007 g002
Figure 3. Lamia’s fully digitized water supply network.
Eesp 40 00007 g003
Figure 4. (a) Water level fluctuation and (b) observed and simulated water levels of Tank 6.
Eesp 40 00007 g004
Figure 5. Average pressures (kPa) and velocity (m/s) at peak demand per zone.
Eesp 40 00007 g005
Disclaimer/Publisher’s Note: The statements, opinions and data contained in all publications are solely those of the individual author(s) and contributor(s) and not of MDPI and/or the editor(s). MDPI and/or the editor(s) disclaim responsibility for any injury to people or property resulting from any ideas, methods, instructions or products referred to in the content.