


Abstract
Microbial fuel cells (MFCs) offer a promising pathway for treating wastewater while simultaneously generating electricity; however, they remain largely pilot-scale technology due to persistent limitations, such as low power density. Microalgae can act as in situ oxygen suppliers in the cathode chamber of dual chamber MFCs, enhancing electricity generation while facilitating nutrient removal. This study compares the performance of cathodic microalgae in MFCs utilizing either a cation exchange membrane (CEM) or an anion exchange membrane (AEM). Raw municipal wastewater collected from the preliminary tank was used as the anodic substrate, while pre-cultivated Chlorella vulgaris (optical density ≈ 0.42) was introduced into the cathode chambers. The performance of both configurations was constantly monitored through various analytical methods. The AEM-based MFC produced significantly higher and more stable voltages (avg. 0.05 volts; peak ≈ 0.11 volts) and achieved a 0.95 mW/m2 peak power density, compared to the CEM-based MFC, which produced lower voltages (avg. 0.01 volts; peak ≈ 0.06 volts) and achieved a 0.25 mW/m2 peak power density. No significant differences in nutrient removal rates were found among the membranes. Findings demonstrate the superiority of AEM configurations for microalgae-assisted MFCs, establishing a more viable framework for potential large-scale wastewater treatment applications.
1. Introduction
The wastewater treatment process is a highly energy-intensive process, accounting for approximately 3–4% of the United States’ annual electricity load [1]. To combat the intensive energy demand of wastewater treatment systems, innovative technologies such as bioelectrochemical systems (BESs) can be utilized. MFCs, one of the BES configurations, can convert the chemical energy present in wastewater in the form of oxidizable organic or inorganic substrates into electrical energy. This is done through the utilization of exoelectrogenic bacteria, which oxidize compounds present in wastewater and generate an electric current [2,3].
A central limitation with MFCs is that their power densities are relatively low compared to the energy demand for wastewater treatment. For this reason, research is necessary to establish more efficient reactor configurations before they can be implemented in large-scale wastewater treatment plants to sustainably treat water with net zero or even net positive energy production [4,5]. To combat the power density limitations of MFCs, microalgae can be implemented within the cathode chamber, creating a biocathode to supply ample oxygen for the cathodic reduction reaction. Serving as a terminal electron acceptor, oxygen allows for a more continuous flow of electrons between electrodes and helps to complete the electric circuit present in an MFC [6]. Biocathodes have been shown to increase the power density of MFCs. A study done in a double-chamber MFC with plain graphite electrodes and a Chlorella vulgaris biocathode reported six-fold increases in power density when raising the continuous light intensity from 26 to 96 µE m−2 s−1 [7]. The results indicate that increasing light intensity boosts photosynthetic O2 production in the biocathode, directly enhancing the power density of the MFC. Beyond optimizing biocathode light conditions, the selection of ion exchange membranes—specifically Anion Exchange Membranes (AEMs) and Cation Exchange Membranes (CEMs)—represents a critical factor for further improving MFC efficiency through ion transport [8].
AEMs facilitate the transport of OH− from the cathode to the anode chamber, where they are neutralized by H+. In contrast, CEMs must transport H+ into the cathode to neutralize OH−; however, proton flux is limited and typically fails to keep pace with OH− production [9]. In these systems, water can act as a hydrogen donor, resulting in the formation of hydroxide ions rather than water molecules. These hydroxide ions may then freely migrate into the anode chamber for neutralization by hydrogen ions [10].
In addition to boosting power output, microalgae-assisted MFCs may significantly enhance nutrient removal and recovery. Currently, the rate at which nutrients such as nitrogen and phosphorus are removed is not consistent in stand-alone MFCs, requiring optimization of operational parameters [11]. Through biological uptake, microalgae assimilate nutrients such as nitrogen and phosphorus into biomass. Algal biomass can then be utilized to produce biofuels, such as biodiesel and bioethanol, as a renewable alternative to fossil fuels [12]. The process of converting microalgal biomass within biocathodes to renewable fuels is a topic that can be explored in future studies.
There has not been a direct comparison of the performance of AEMs and CEMs in microalgae-assisted MFCs. One study on air-cathode MFCs suggested an advantage of an AEM over a CEM, with 4–5-fold greater current generation. This was attributed to neutral cathode pH in contrast to the significantly higher pH of the CEM cathode. However, lower ohmic resistance was reported in the CEM reactor [13]. Another study evaluated the performance of algal biocathode in a microbial desalination cell (MDC) against air cathode and biocathode MFC and found comparable maximum power density generated by the MDC and air cathode MFC. However, it is noted that the MDC had the advantage of simultaneous saline removal and algae growth in a bioelectrochemical system [14]. A comparison of an AEM and CEM in biocathode MFCs may provide valuable insight into how ion selectivity differences impact algal function and the overall performance of MFCs, potentially establishing more efficient reactor configurations.
2. Materials and Methods
2.1. Experiment Setup
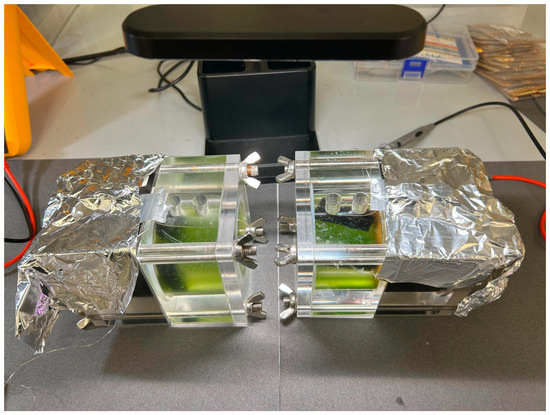
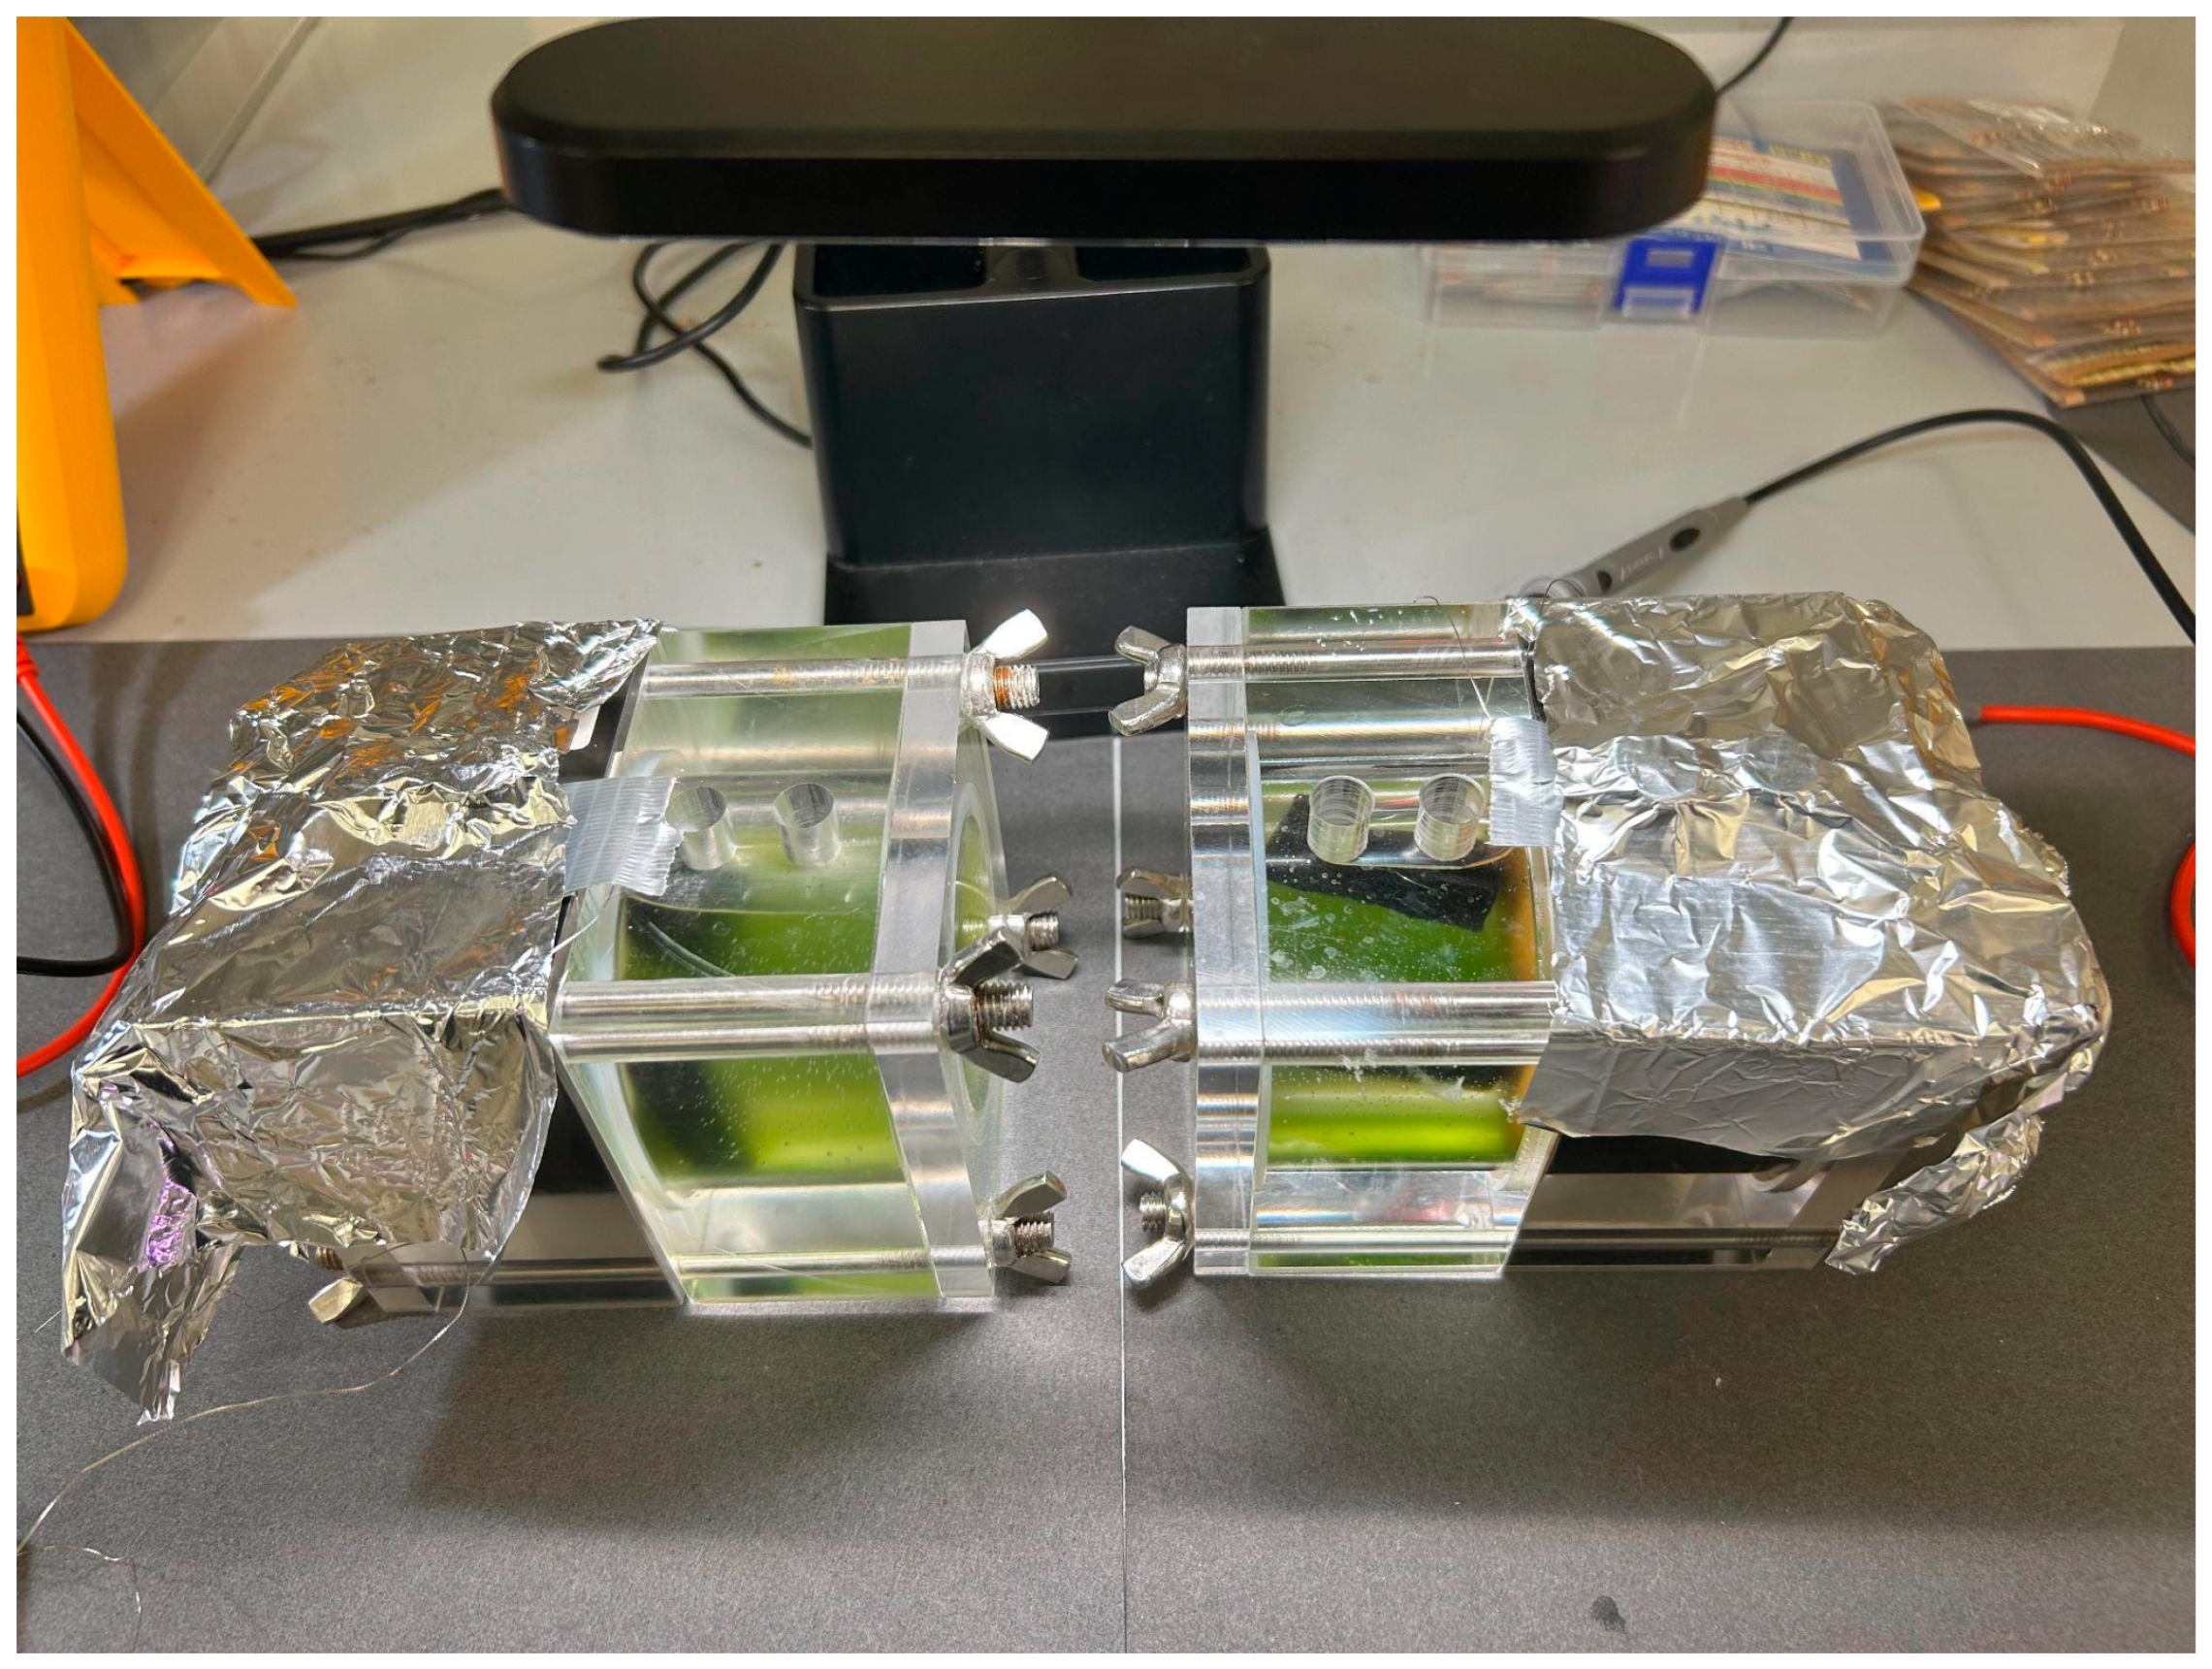
Two MFC reactors were utilized for the experiment, one containing an AEM and the other containing a CEM. All experimental units are identical except for the type of ion exchange membrane used in the two types of set up. Both cathodic chambers remained exposed to roughly the same intensity of light, and the carbon-based anode and cathode electrodes had identical dimensions (5 cm × 3cm × 1cm). The anodic chambers remained covered with foil to reduce the growth of photosynthetic organisms, which may compete with the exoelectrogenic bacteria [15]. This setup can be seen in Figure 1.
Figure 1.
Microalgae biocathode MFC reactors (left: AEM, right: CEM).
Municipal wastewater samples from the preliminary treatment effluent (Portage Wastewater Treatment Plant, Portage, IN, USA) were utilized as the anode substrate. Prior to being added, the samples were double-filtered through 0.42 µm filters and mixed with secondary sludge (from the same plant) at a ratio of 80/20. A total of 100 mL of the wastewater/sludge mixture was added to the anode chambers. Microalgae (Chlorella vulgaris), cultivated in the laboratory to an optical density (OD) of ~4.2, was introduced into the cathode chambers, along with the growth medium (100 mL total). The growth media contained macronutrients (ammonia and phosphate), micronutrients (iron, manganese, zinc, and cobalt), vitamins (B1 and B12), and sodium carbonate. The presence of nitrogen and phosphorous in the growth media presents difficulties when analyzing nutrient removal/recovery in the MFC; the nutrient concentration of the growth media containing the algae was unknown when it was added to the cathodes, making it essentially impossible to construct a mass balance. This will be considered in the results of the experiment.
2.2. Measurements
Over the span of eight trials, the performance of both MFCs was evaluated on two primary factors—power generation and nutrient removal/recovery. Nutrient concentrations were measured using a HACH DR6000. As a basis of monitoring the MFC performance, the following measurements were taken in both the anode and cathode chambers, in addition to voltage readings: chemical oxygen demand (COD), conductivity, total dissolved solids (TDS), salinity, dissolved oxygen (DO), pH, total nitrogen (TN), total phosphorous (TP), ammonia, nitrate, and nitrite. Non-voltage measurements were taken at the start and end of each trial. The endpoint of each experiment was determined based on sustained voltage decline, i.e., when voltage reaches stable minimum (steady state). A polarization test was also performed. After the open-circuit voltage (OCV) stabilized, external resistance was sequentially adjusted to 1, 10, 100, 500, 1000, 2000, 5000, 10,000, 20,000, and 50,000 Ω. Each load was maintained for 15 min.
2.3. Calculations
Current (I) was calculated by
where V is the voltage (V) produced by the MFC and is the external resistance (Ω) (either of a color-coded resistor or variable resistor).
Power density (PD) was calculated by
where V is the voltage (V) produced by the MFC, is the external resistance (Ω), and A is the area of the anode.
3. Results
3.1. Voltage Profiles
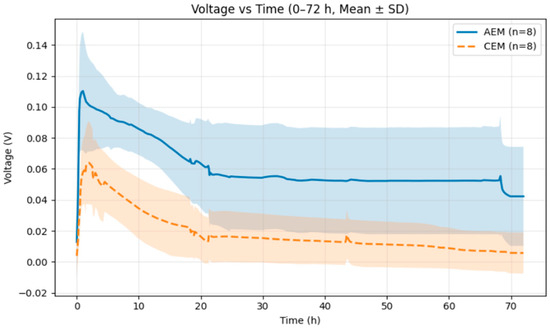
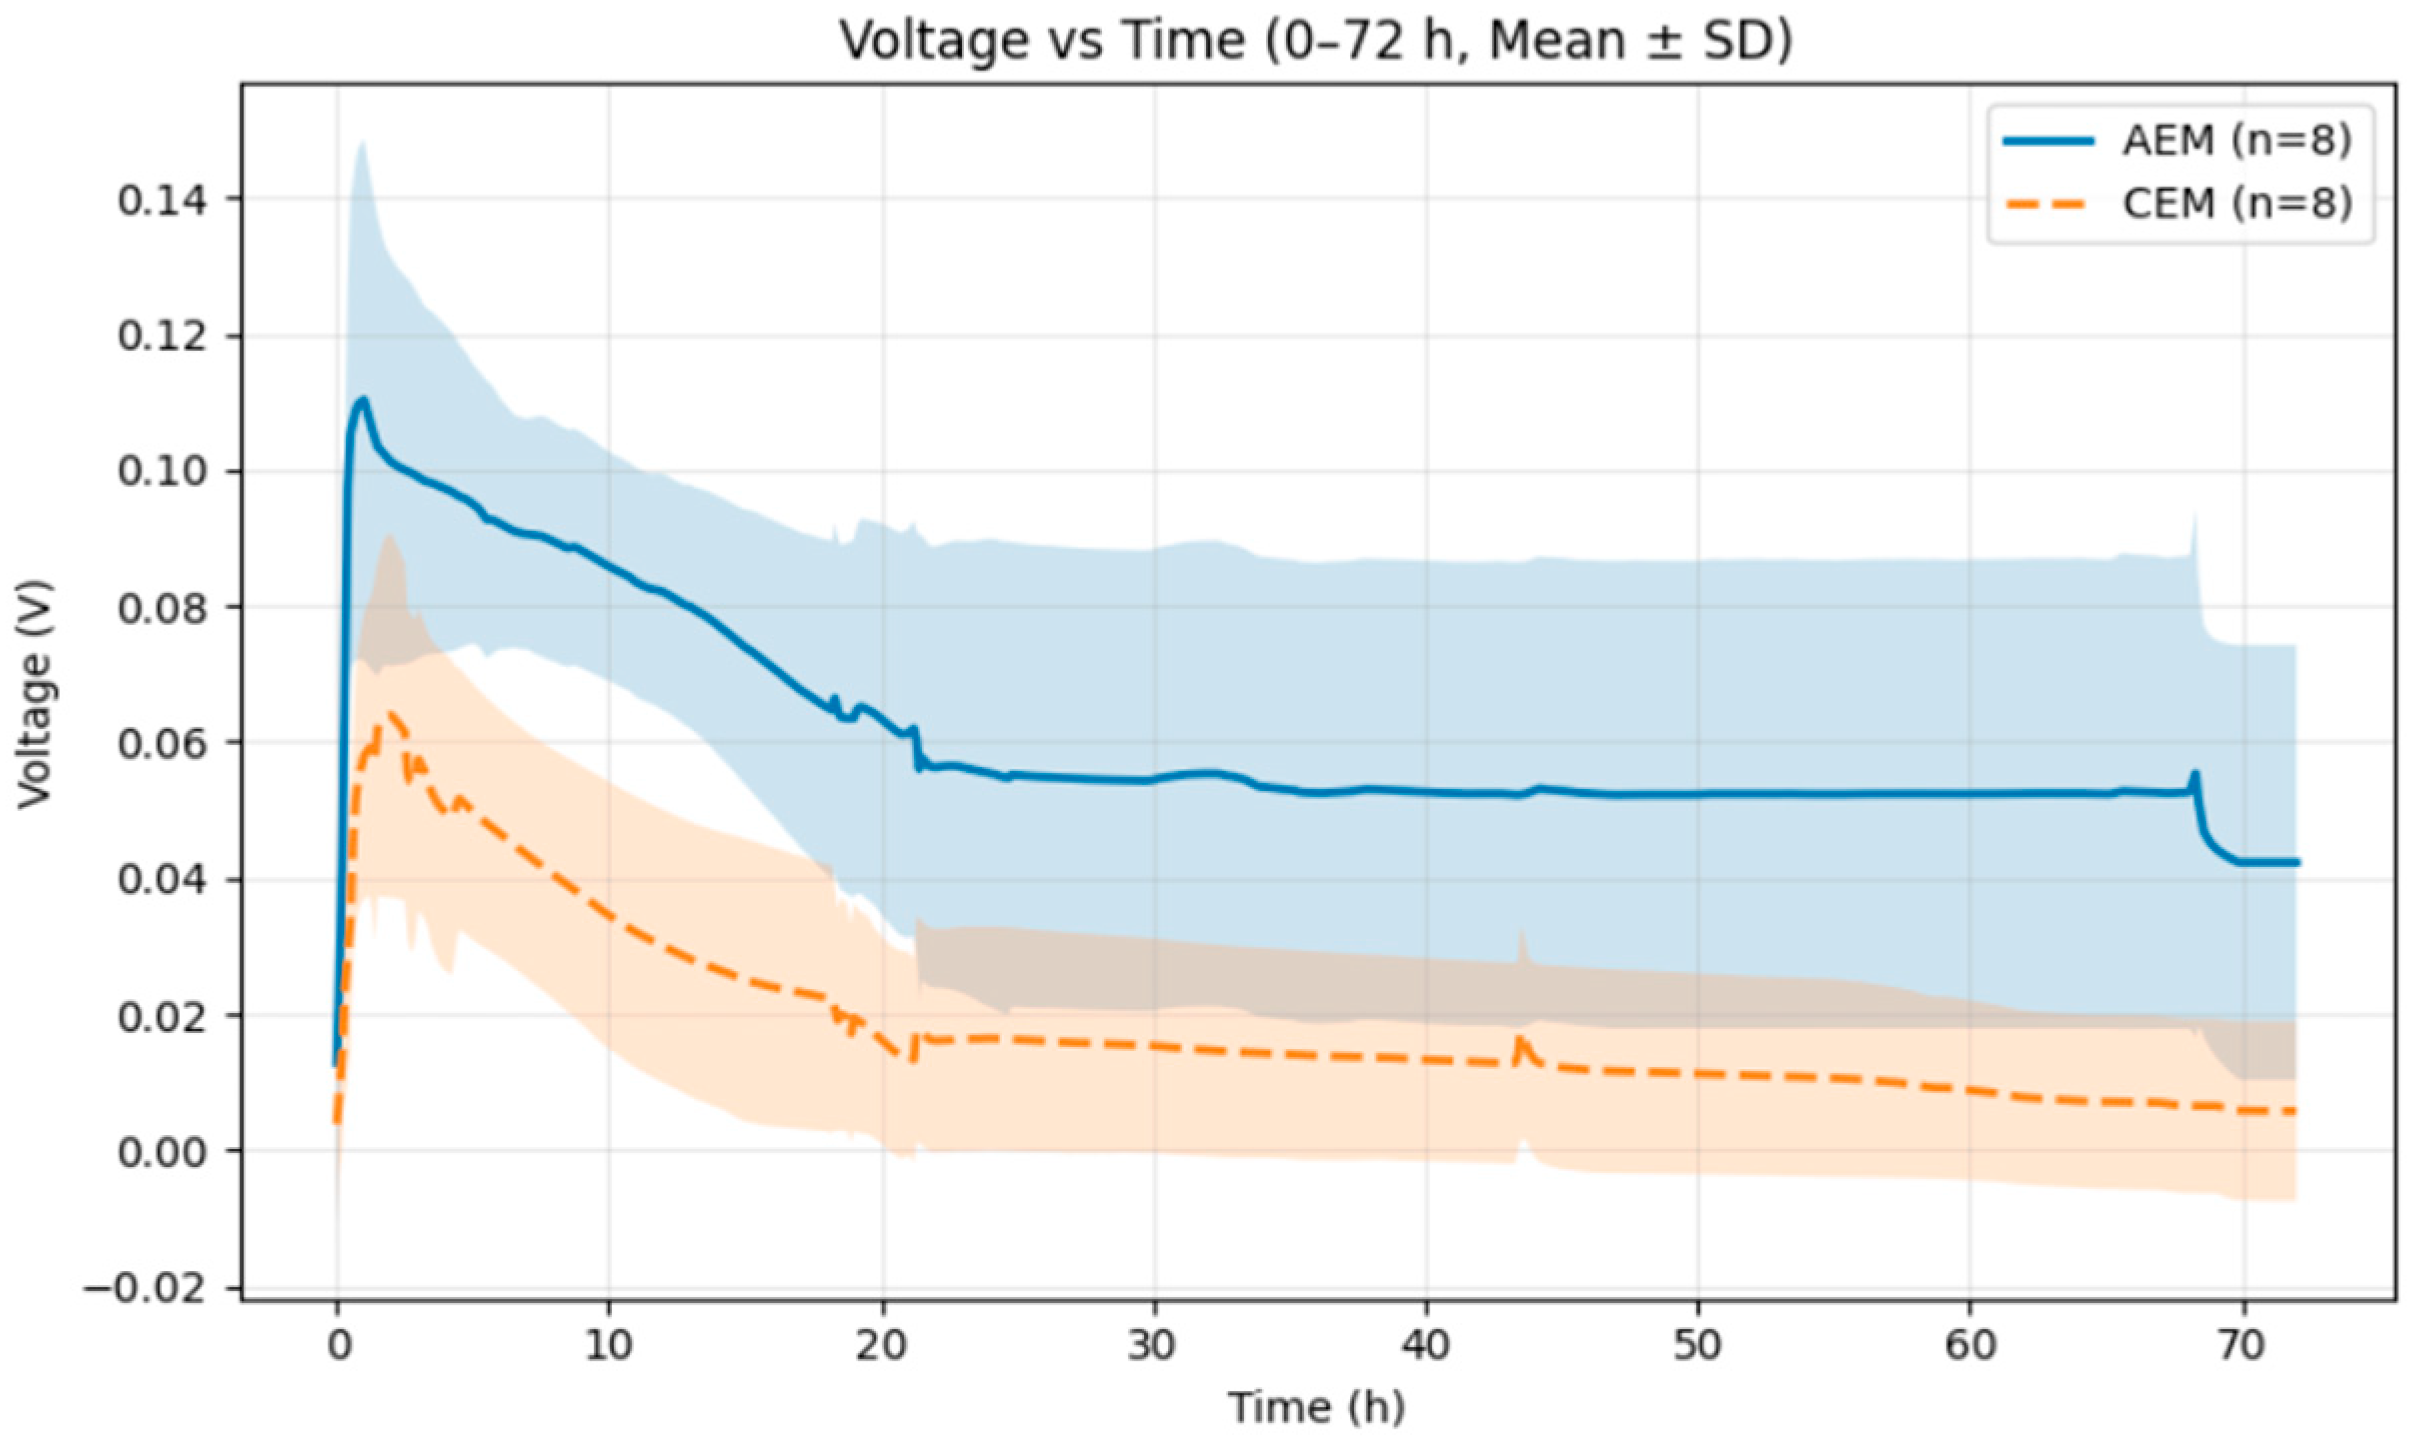
The compiled results of the voltages produced by the AEM and CEM reactors, respectively, across eight independent experiments are shown in Figure 2.
Figure 2.
Mean ± SD voltage profiles for microalgae-assisted MFCs operated at a fixed 1000 Ω external load (n = 8 per membrane).
The reactor equipped with an AEM consistently generated higher voltage than the CEM-equipped reactor under a 1000 Ω load. As shown in Figure 2, neither system reached zero voltage; instead, both approached steady-state values. AEM voltage peaks rose to ~0.11 V and stabilized at ~0.05 V. In contrast, CEM voltage peaks were lower at ~0.06 V and stabilized at ~0.01 V. While both systems showed persistent electrochemical activity, the AEM reactor reached a higher and more stable steady-state voltage, indicating potentially more favorable electrochemical conditions and lower effective internal losses, though polarization is needed to further validate this claim.
3.2. Polarization
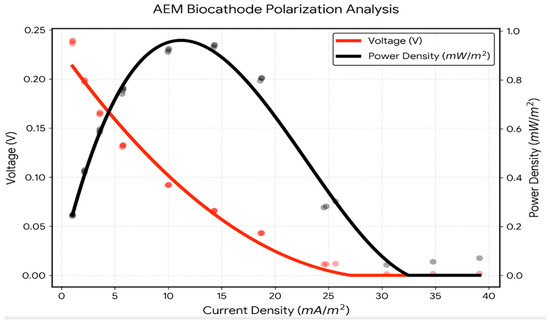
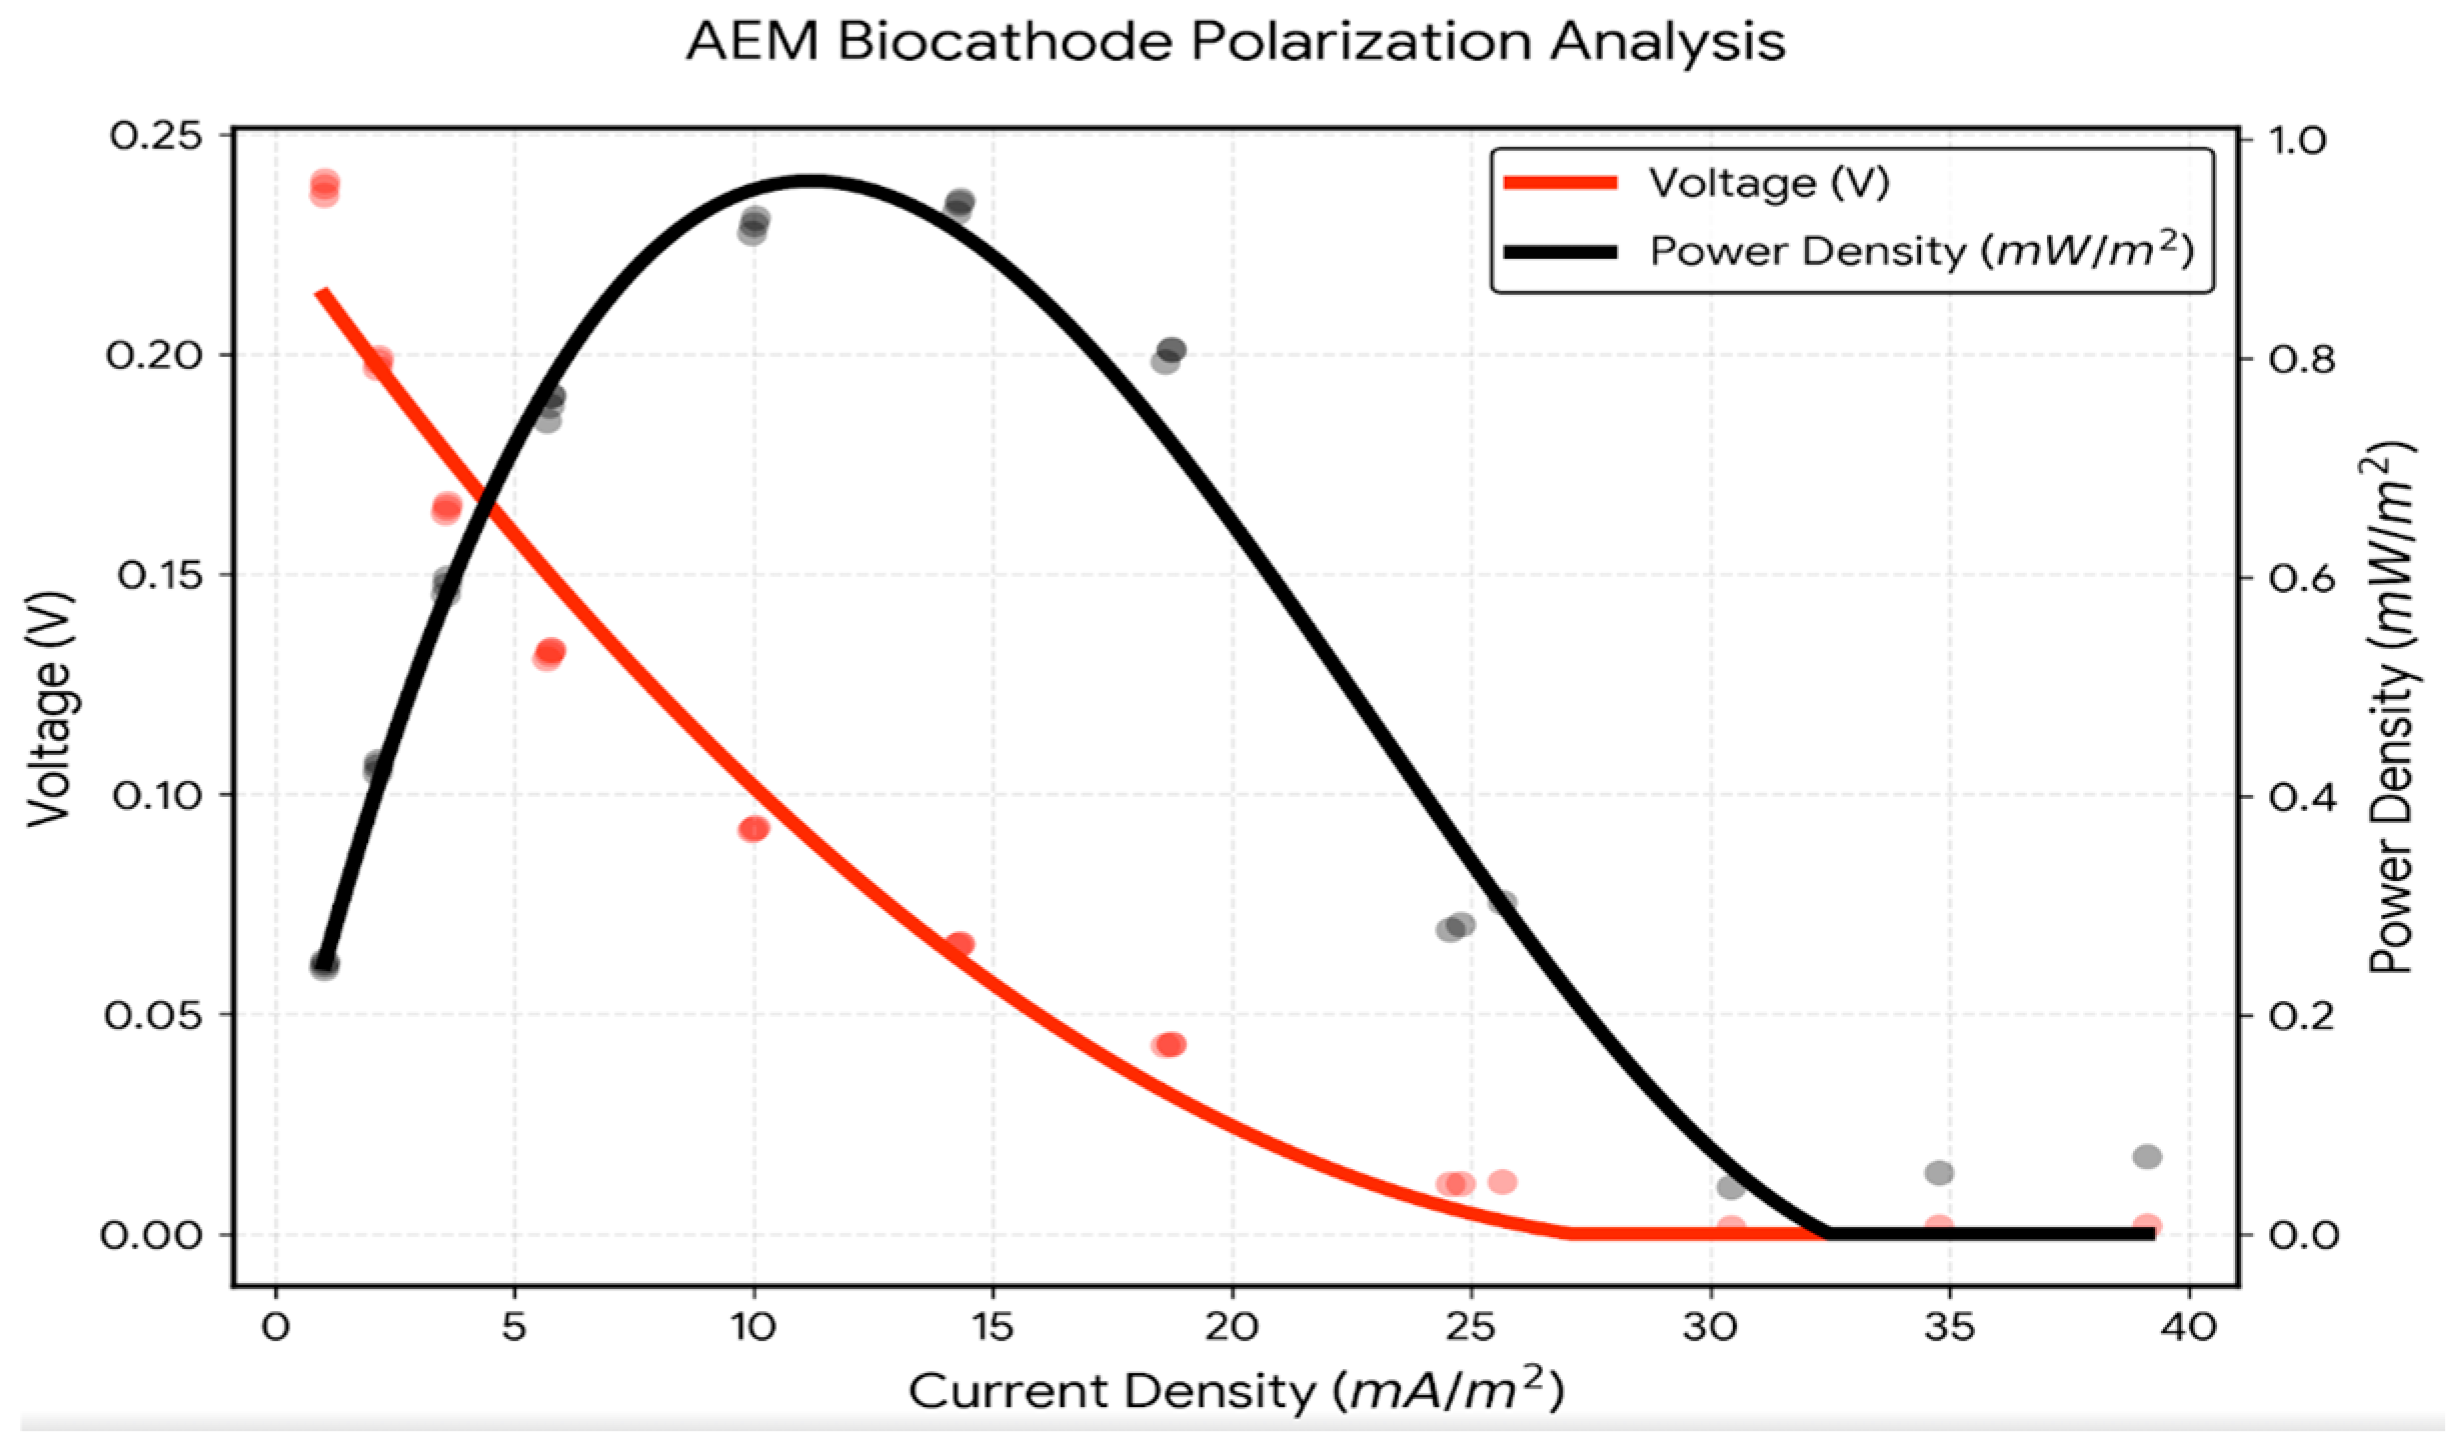
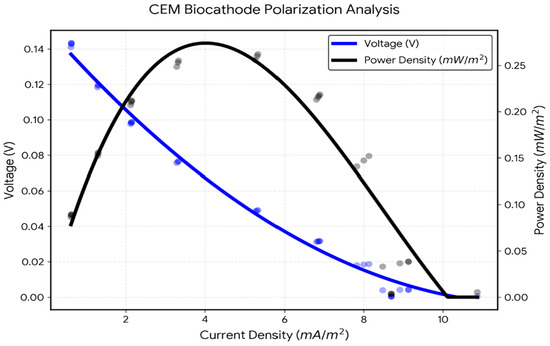
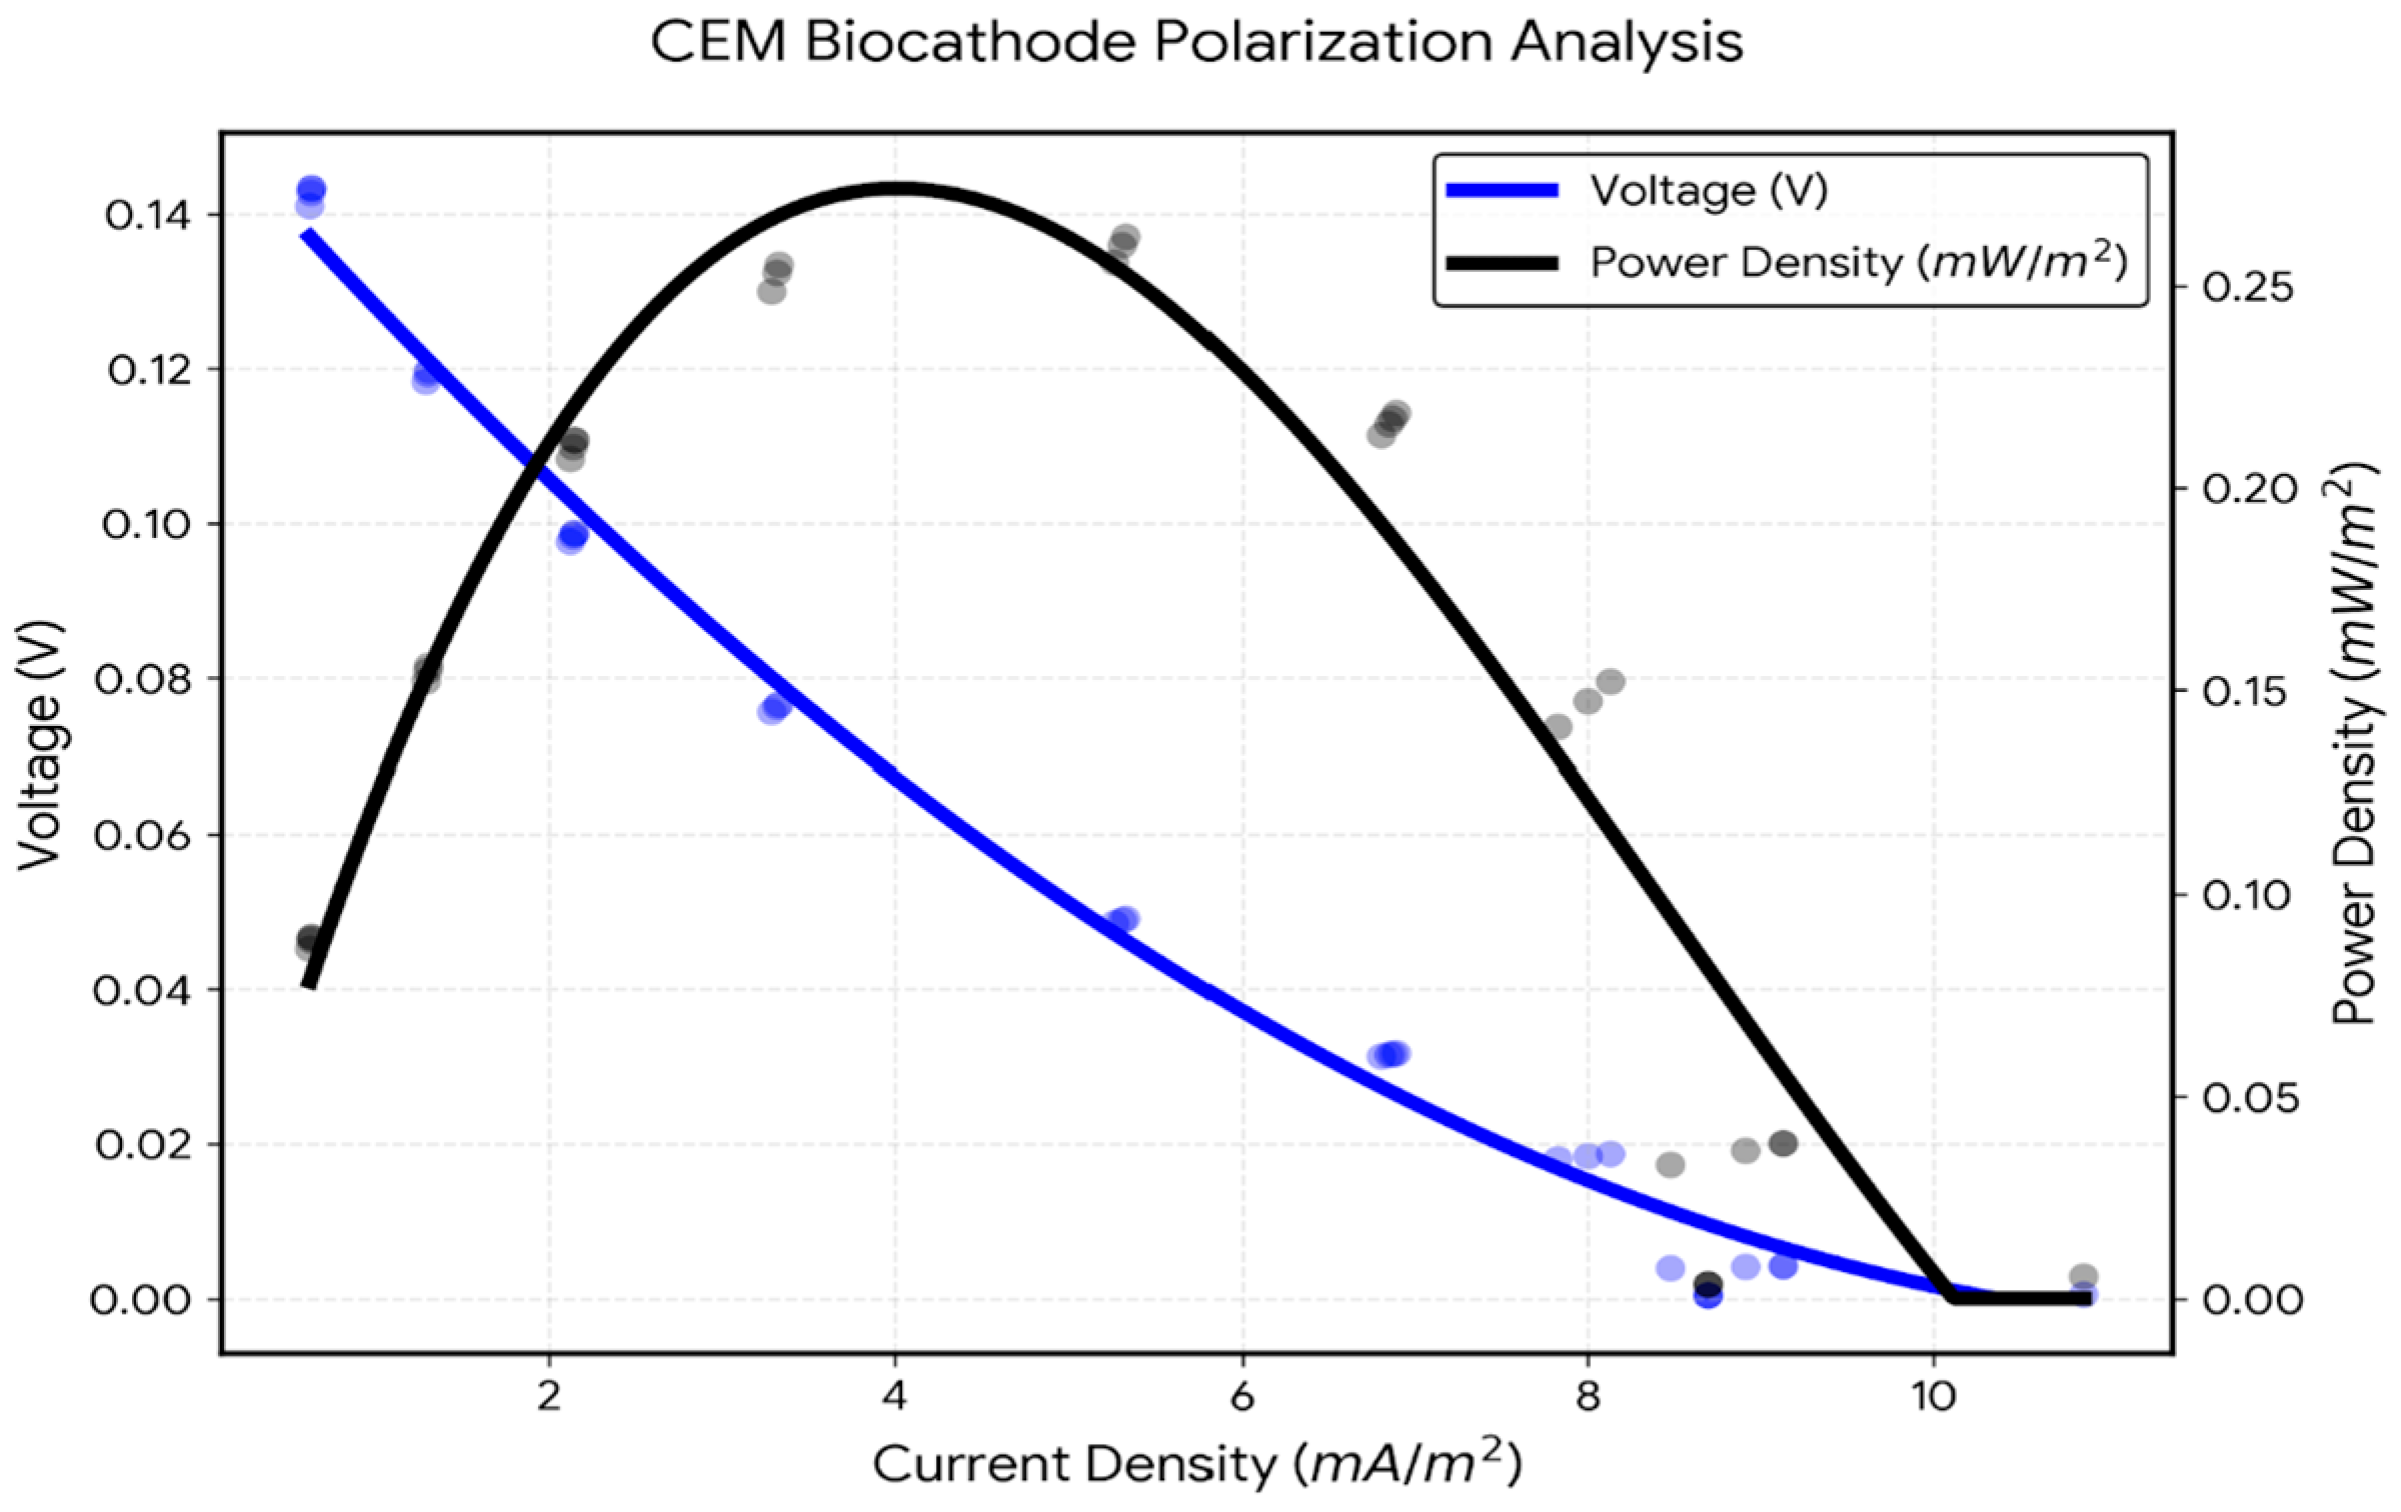
Polarization results for the AEM and CEM reactors, respectively, are depicted in Figure 3 and Figure 4. Current and power measurements were obtained using the anode’s surface area, which was 0.0046 m2.
Figure 3.
Polarization curves for AEM biocathode setup.
Figure 4.
Polarization curves for CEM biocathode setup.
The AEM reactor outperforms the CEM in every category. As shown in Figure 3, an AEM power density peak of ~0.95 mW/m2 was achieved at current densities between 2 and 40 mA/m2. In contrast, Figure 4, depicting the CEM reactor, shows a power density peak of ~0.25 mW/m2 at lower current densities between 1 and 10 mA/m2. The CEM’s much shorter horizontal range and lower peak power suggest that ions are moving through the CEM with much higher resistance than through the AEM. This affirms that the CEM experiences higher effective internal losses than the AEM.
3.3. Nutrient Analyses
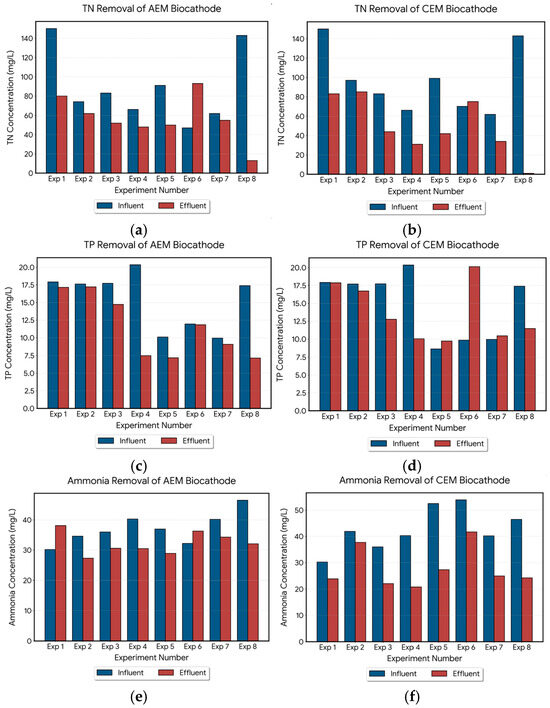
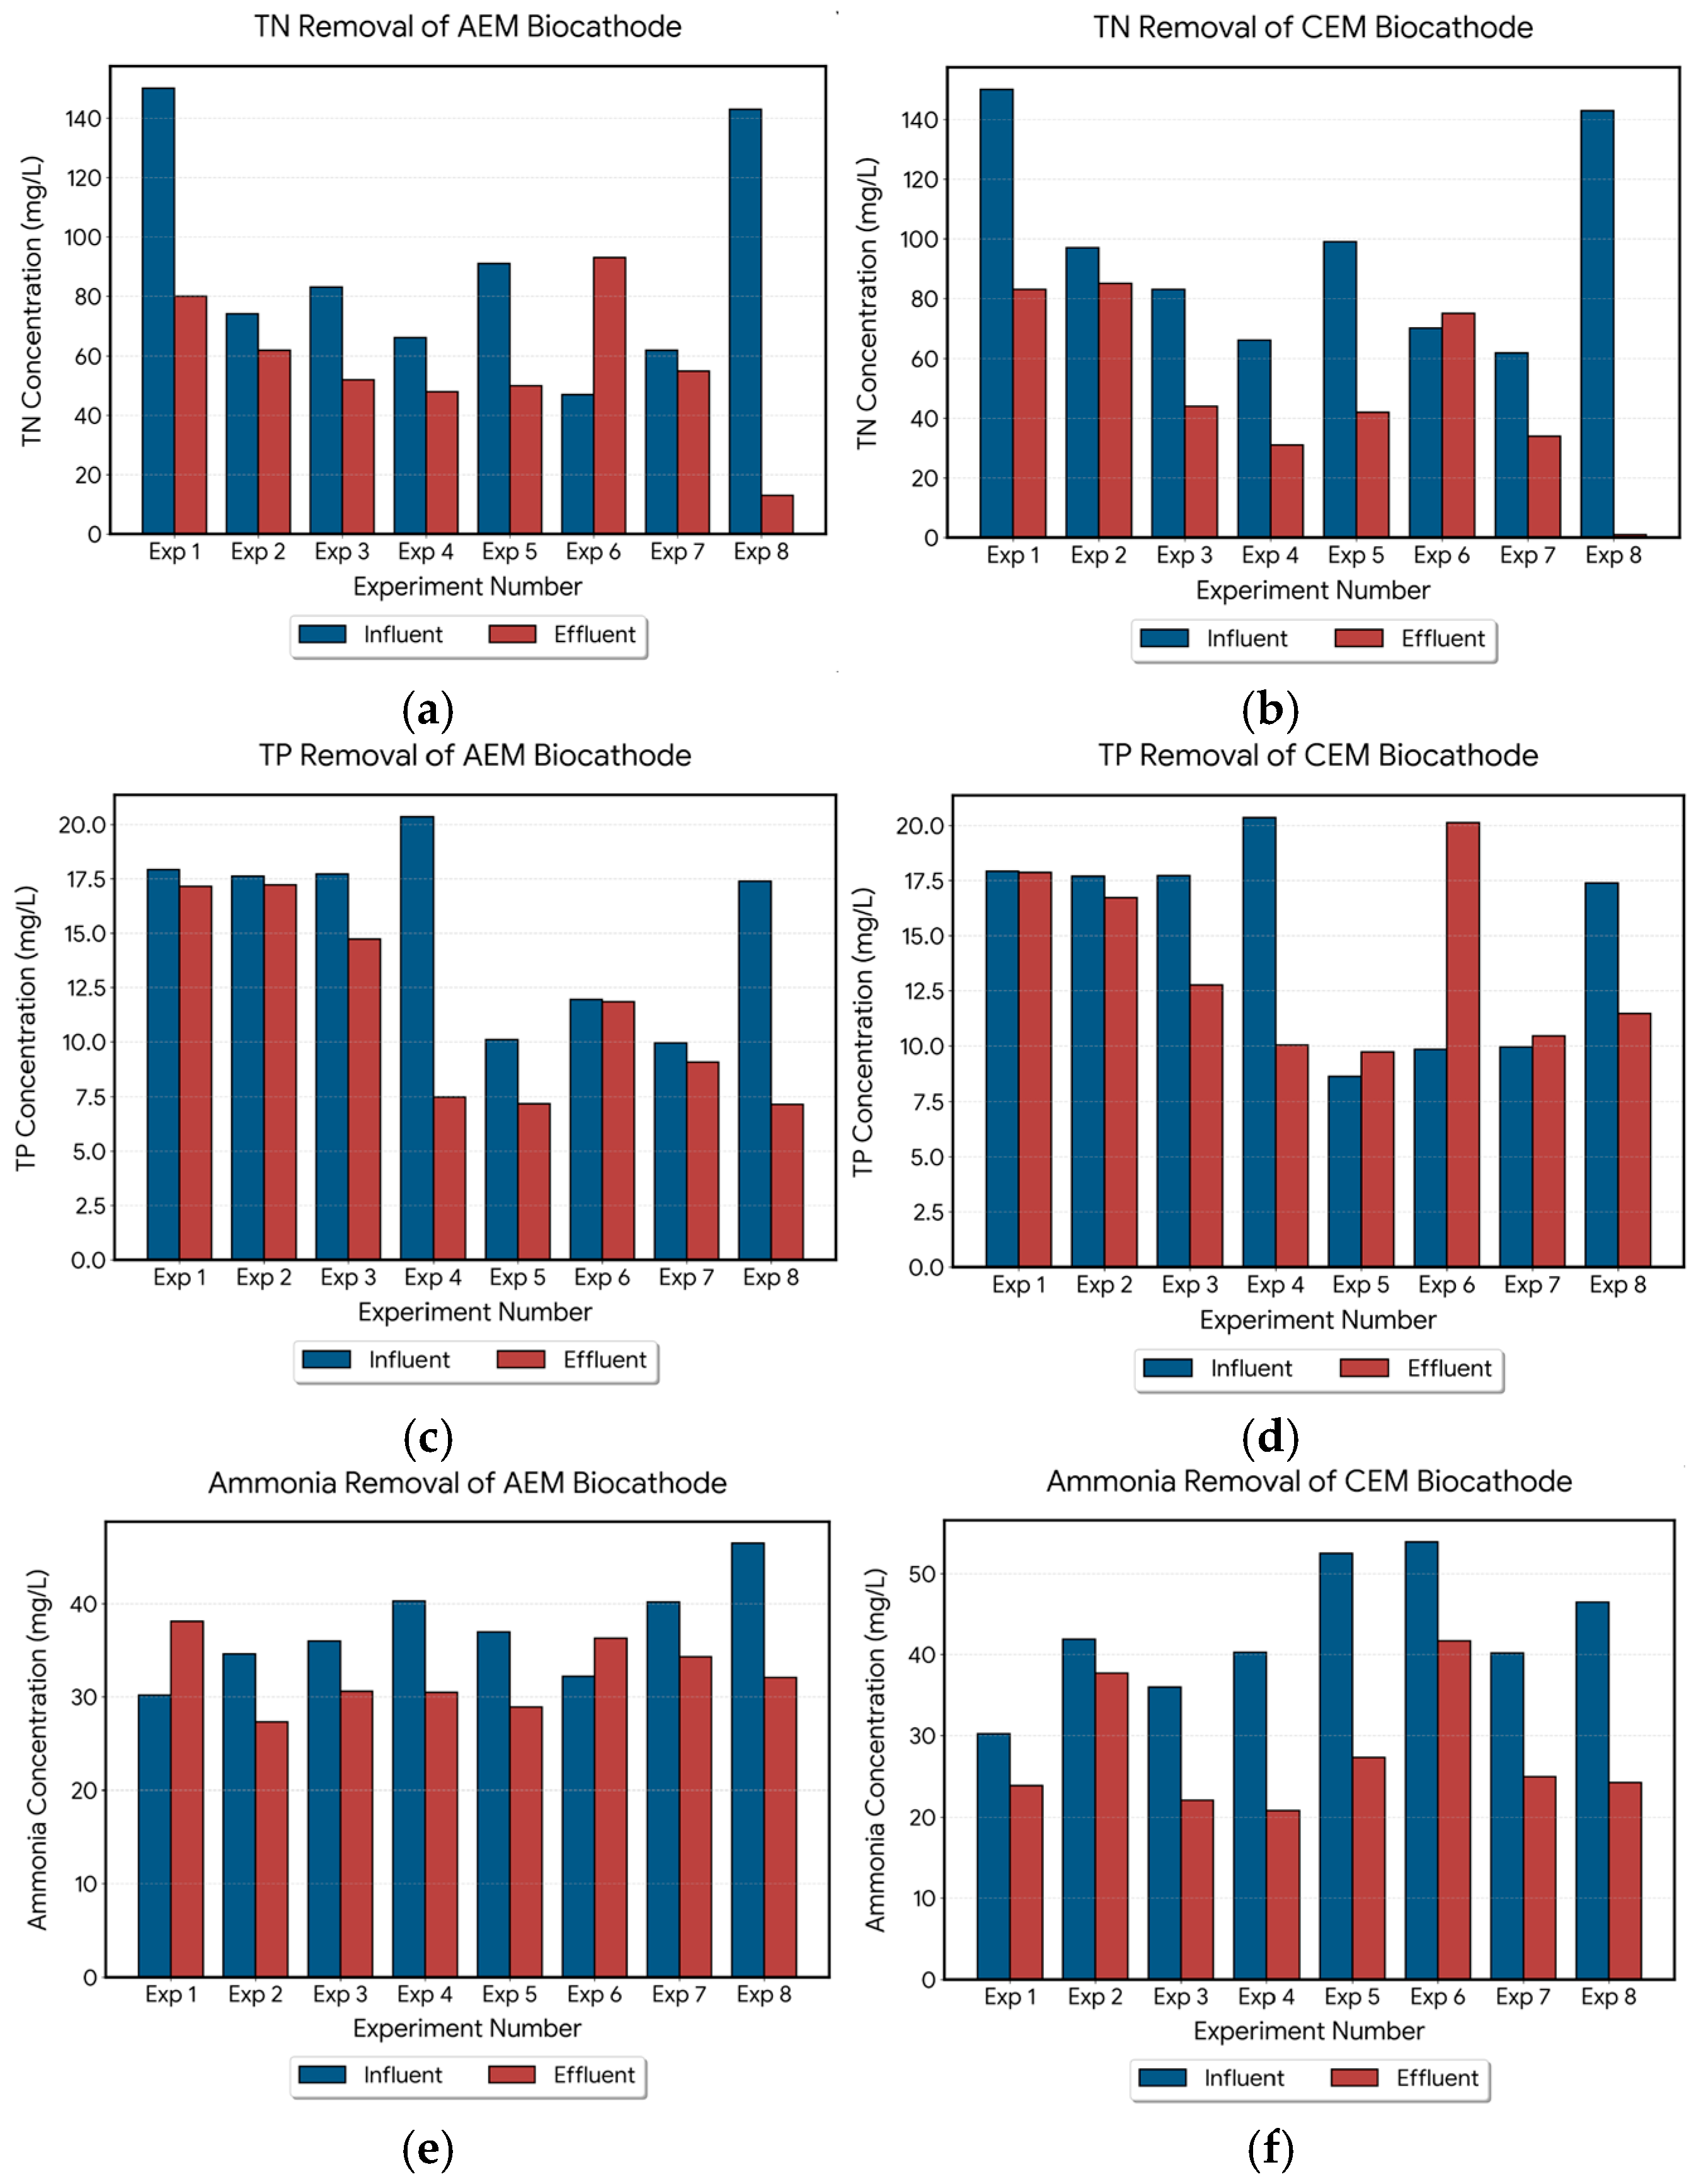
Nutrient concentrations were analyzed in influents and effluents. The difference in the sums of anode and cathode concentrations between influents and effluents was used to calculate the removal efficiency. As previously noted, the culture media containing the microalgae that was introduced into the cathode chambers contained unknown amounts of nitrogen and phosphorus. Therefore, it is not possible to distinguish between nutrients removed from the algae media and wastewater. These results are laid out in Figure 5.
Figure 5.
Nutrient concentrations in influent compared to effluent for (a) TN of the AEM reactor; (b) TN of the CEM reactor; (c) TP of the AEM reactor; (d) TP of the CEM reactor; (e) ammonia of the AEM reactor; (f) ammonia of the CEM reactor.
TN, TP, and ammonia were shown to decrease between influent and effluent in almost all experiments, showing a strongly positive nutrient removal trend in biocathode MFCs. Both the AEM- and CEM-equipped reactors showed comparable removal amounts of all nutrients. Nutrient removal pathways for TN and ammonia include denitrification or assimilation into algal biomass, while nutrient removal for TP may only be attributed to assimilation, as no chemical precipitation (i.e., struvite formation) was observed. Instances where an increase in nutrients was observed may be attributed to internal loading, where decay of dead biomass within the chamber leaches nutrients into the water.
3.4. Key Performance Indicators
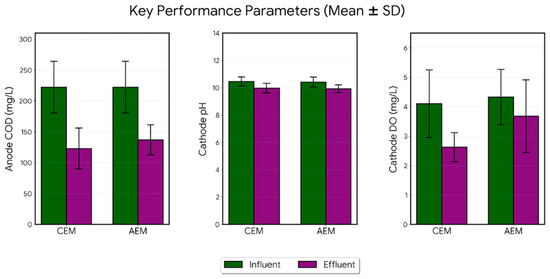
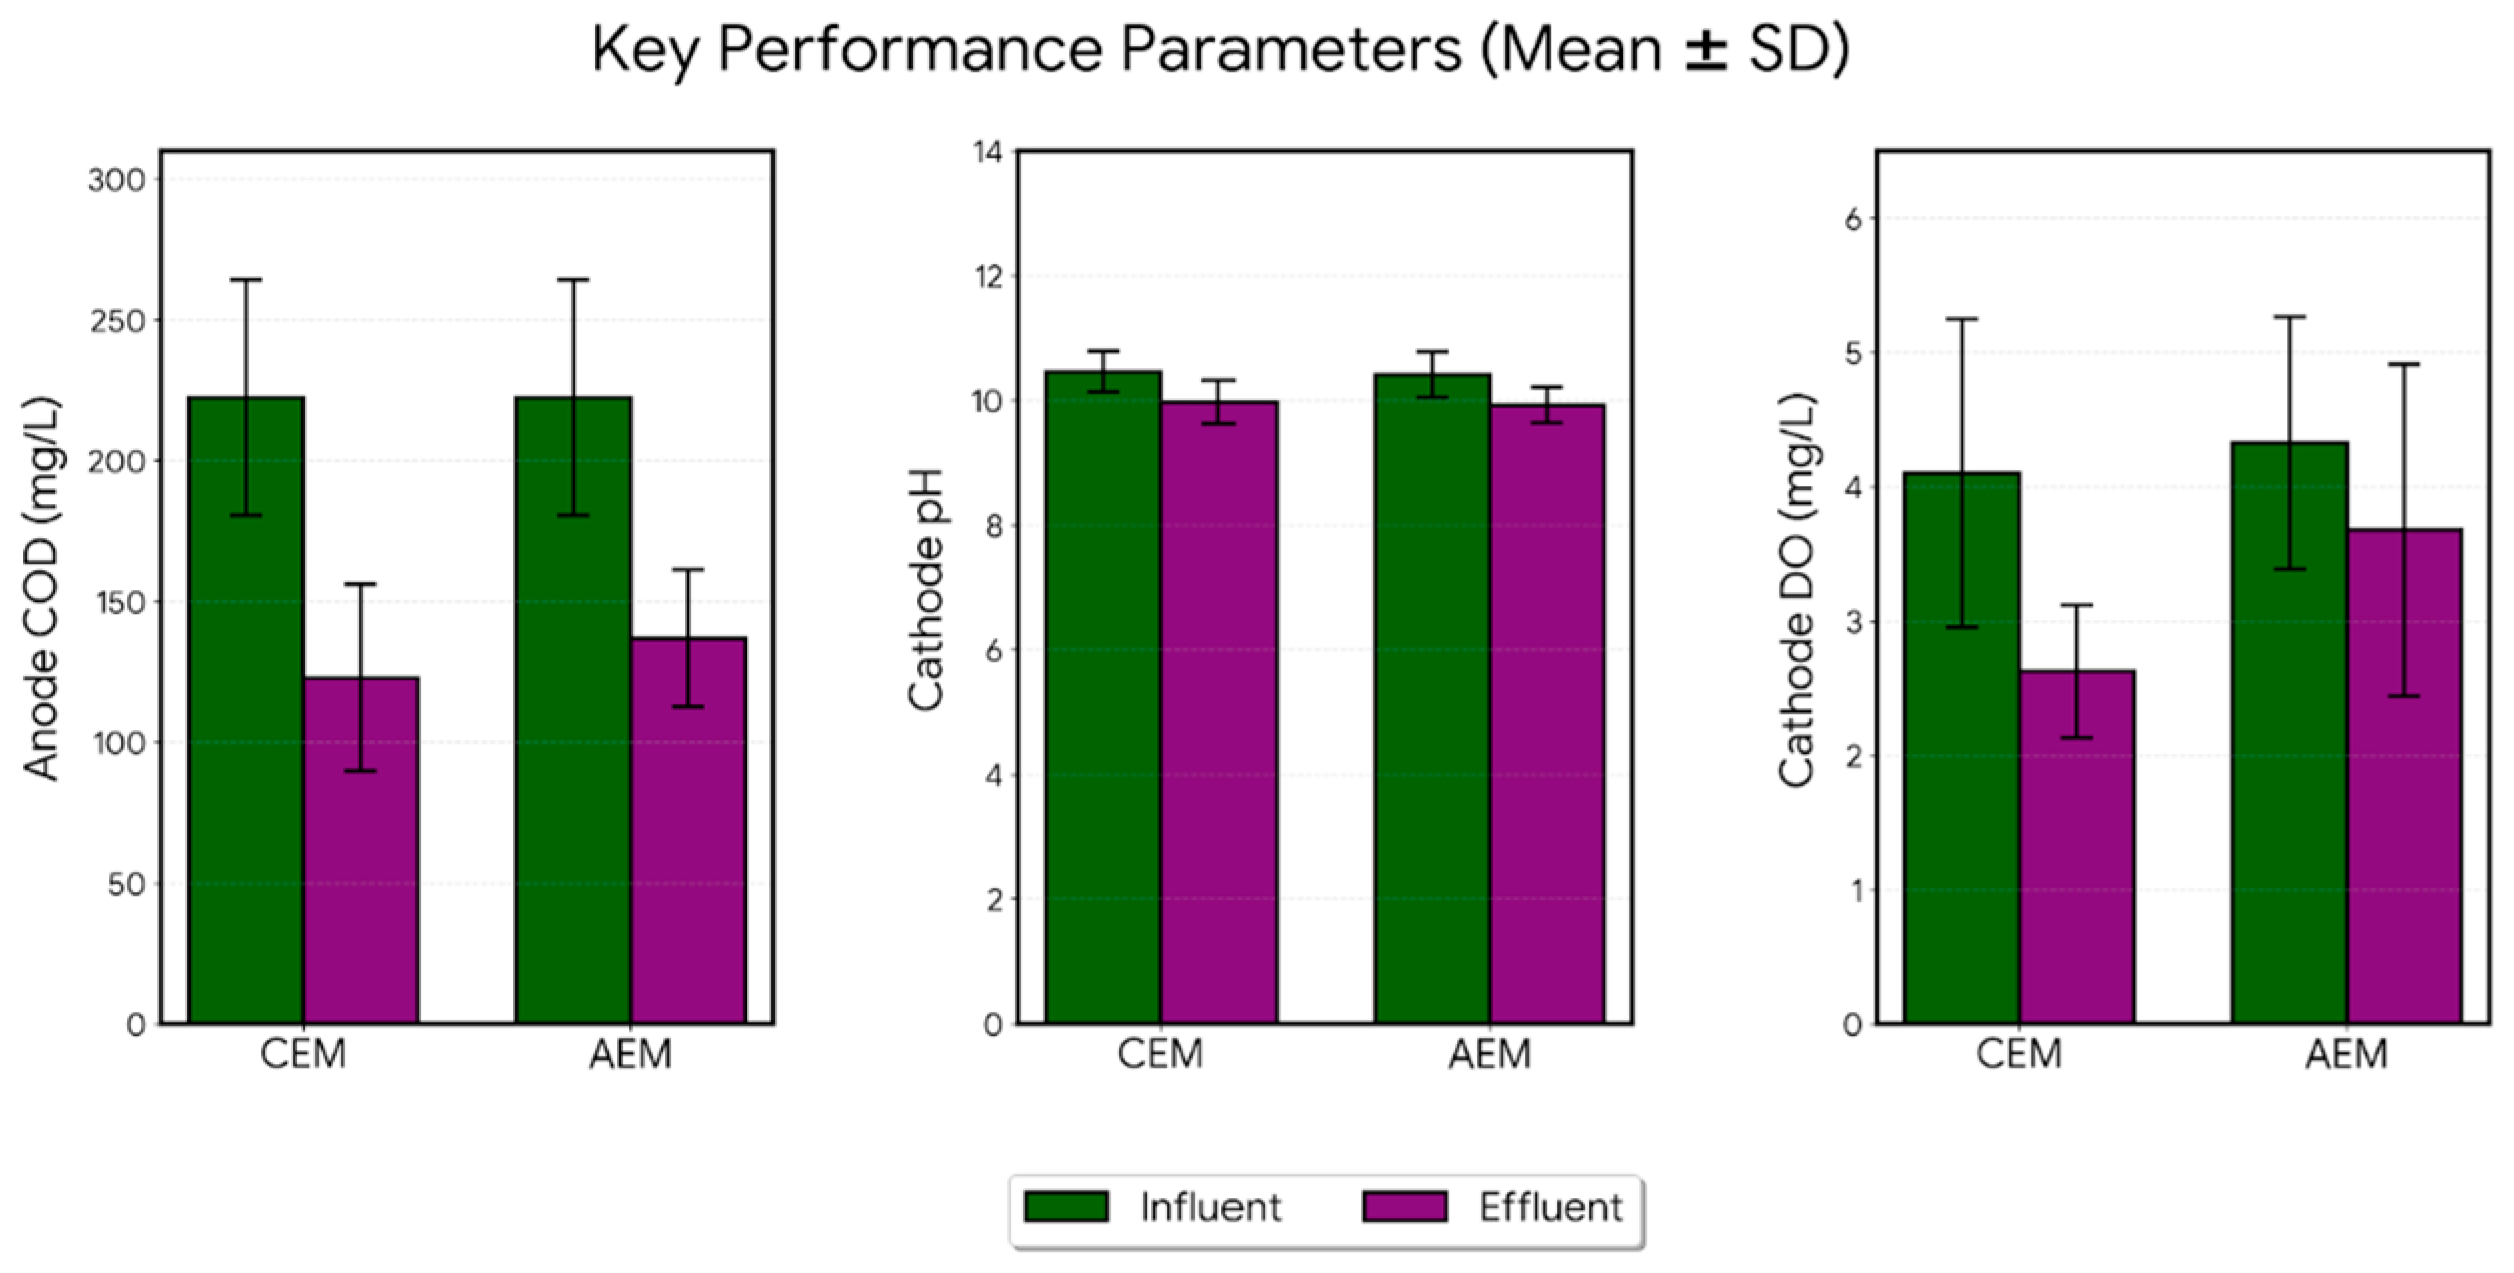
A comparison of key performance indicators for the AEM and CEM configurations, such as COD, cathode DO, and cathode pH, is shown in Figure 6.
Figure 6.
Key performance indicators for AEM and CEM configurations.
As shown in Figure 6, COD removal rates in both reactor configurations were roughly the same, with the CEM achieving roughly 5% higher removal by the end of the experiment duration. This suggests that organic oxidation at the anode is not limited by the type of membrane. Moreover, both systems showed net DO drop in the cathode chamber, but CEM cathodes showed a net drop roughly 0.9 mg/L higher (potentially less favorable conditions for microalgae). In either case, photosynthetic O2 production could not fully offset oxygen consumption by the oxygen reduction reactions (ORR) or microbial respiration. Both systems showed slight cathode acidification, with the changed cathodic pH level roughly the same in both reactors. This suggests that cathode acidification is not membrane dependent, and microalgae biocathodes tend to acidify regardless of whether an AEM or CEM is utilized.
4. Discussion
4.1. Electrochemical Conditions
Contrary to the CEM, the higher voltage profile of the AEM reactor suggests that it provided more favorable electrochemical conditions. A key indication of this is the lower net DO drop in the AEM cathode. A higher cathodic DO content at the end of the experiment shows that the photosynthetic reactions of the algae were more successful in the AEM reactor. Additionally, even though the bulk pH from both reactors eventually dropped ~0.5 units, the AEM was likely more successful in managing local pH gradients. This is because it allows ions like OH− to transfer from the cathode to the anode, whereas OH− and other anions like HCO3− accumulate in the CEM cathode. So, while the AEM does not permanently stop acidification, it prevents sharp local pH shocks during the voltage-building phase, which is critical for microalgae oxygen production.
4.2. Ion Profiles
Specific ion profiles passed by each membrane may have a notable impact on reactor performance (voltage/power generation) due to their impact on electrochemical conditions and effective internal losses. Perhaps the limiting factor for the CEM performance is the ion profile it permits. In the CEM reactor, H+ and a significant amount of NH4+ (~73% anode removal) likely migrated into the cathode instead of leaving the system as N2. Under these cathodic conditions, microalgae may become stressed from proton and ammonium buildup. On the one hand, H+ buildup acidifies the biocathode, impairing algal enzymes and photosynthesis. On the other hand, NH4+ buildup can become toxic to algae, disrupting intracellular pH and increasing energy demand. In either case, ionic/osmotic stress is raised, which can be a metabolic burden to algae [16]. In summary, the high anodic nitrogen removal rate in the CEM occurred largely via ion migration into the cathode, causing cathodic instability and inhibiting algal performance.
4.3. Internal Resistance
Voltage in MFCs is also heavily influenced by internal resistance. The AEM was more favorable for several reasons. Unlike the CEM, the AEM prevented excessive NH4+ buildup at the cathode, reducing algal metabolic stress and oxygen depletion. Since the algae were less stressed, they were able to produce more DO near the cathode, improving oxygen reduction reaction (ORR) kinetics. This enabled the cathode to accept electrons faster, leading to a higher measured voltage under the same resistor load. Thus, the AEM provided higher usable voltage by mitigating ion buildup and allowing the cathode to stay more oxygen-rich during productive hours.
5. Conclusions
This study evaluated the power generation and electrochemical behavior of microalgae-assisted microbial fuel cells equipped with either anion exchange membranes or cation exchange membranes. The AEM-equipped reactor consistently outperformed the CEM configuration in both voltage generation and power density. These results demonstrate that the electrochemical environment facilitated by the AEM more effectively supports MFC redox reactions while significantly reducing effective internal losses. Interestingly, both systems exhibited comparable nutrient removal, suggesting that membrane ion-selectivity differences do not limit the system’s capacity for nutrient remediation. The findings of this research provide a clearer understanding of the trade-offs associated with specific ion exchange membranes in microalgae-assisted MFCs. Future work will focus on characterizing the algal biomass growth over time, (e.g., optical density or Chlorophyll-a measurements) in the cathode chamber. This will allow for documenting the synthesis between algal productivity and electrochemical performance. Additionally, investigating alternative membranes (e.g., proton exchange membranes and bipolar membranes) may facilitate configurations to advance the capabilities of MFCs in simultaneous power generation, contaminant removal, and nutrient recovery.
Author Contributions
Conceptualization, A.R.H., K.T.T. and V.G.G.; methodology, A.R.H., K.T.T. and V.G.G.; validation, A.R.H., K.T.T. and V.G.G.; formal analysis, A.R.H., K.T.T. and V.G.G.; investigation, A.R.H., K.T.T. and V.G.G.; resources, V.G.G.; data curation, A.R.H. and K.T.T.; writing—original draft preparation, A.R.H. and K.T.T.; writing—review and editing, A.R.H., K.T.T. and V.G.G.; visualization, A.R.H. and K.T.T.; supervision, V.G.G.; project administration, V.G.G.; funding acquisition, V.G.G. All authors have read and agreed to the published version of the manuscript.
Funding
This work is supported by the grants REEU program [grant no. 2023-68018-40325], WAMS program [grant no. 2023-38503-41313], and HSI program [2024-77040-43780] from the U.S. Department of Agriculture, National Institute of Food and Agriculture. Any opinions, findings, conclusions, or recommendations expressed in this publication are those of the author(s) and should not be construed to represent any official USDA or U.S. Government determination or policy.
Institutional Review Board Statement
Not applicable.
Informed Consent Statement
Not applicable.
Data Availability Statement
Data will be available upon request.
Acknowledgments
The authors acknowledge support from the NiSource–Meyer Foundation and the Purdue University Northwest Water Institute.
Conflicts of Interest
The authors declare no conflicts of interest. The funders had no role in the design of the study; in the collection, analyses, or interpretation of data; in the writing of the manuscript; or in the decision to publish the results.
References
- McCarty, P.L.; Bae, J.; Kim, J. Domestic wastewater treatment as a net energy producer–can this be achieved? Environ. Sci. Technol. 2011, 45, 7100–7106. [Google Scholar] [CrossRef] [Scilit] [PubMed]
- Gude, V.G. Integrating bioelectrochemical systems for sustainable wastewater treatment. Clean Technol. Environ. Policy 2018, 20, 911–924. [Google Scholar] [CrossRef] [Scilit]
- Kannan, N.; Donnellan, P. Algae-assisted microbial fuel cells: A practical overview. Bioresour. Technol. Rep. 2021, 15, 100747. [Google Scholar] [CrossRef] [Scilit]
- Gude, V.G. Wastewater treatment in microbial fuel cells—An overview. J. Clean. Prod. 2016, 122, 287–307. [Google Scholar] [CrossRef] [Scilit]
- Gude, V.G. Advancing microbial electrochemical technologies for the circular economy, energy resilience, and environmental sustainability. Front. Sci. 2026, 4, 1808328. [Google Scholar] [CrossRef] [Scilit]
- Anandapadmanaban, B.H.; Liu, S.-H.; Lin, C.-W. Prospects of microalgae in the cathode chamber of microbial fuel cells: From sequestration to bioproduct production. Biomass Bioenergy 2025, 194, 107616. [Google Scholar] [CrossRef] [Scilit]
- Montoya-Vallejo, C.; Quintero Díaz, J.C.; Yepes, Y.A.; Fernández-Morales, F.J. Microalgal microbial fuel cells: A comprehensive review of mechanisms and electrochemical performance. Appl. Sci. 2025, 15, 3335. [Google Scholar] [CrossRef] [Scilit]
- Tun, K.T.; Gude, V.G. Ion exchange membranes impact energy and treatment performance of low strength municipal wastewater in microbial fuel cells. J. Environ. Chem. Eng. 2026, 14, 121734. [Google Scholar] [CrossRef] [Scilit]
- Rossi, R.; Logan, B.E. Using an anion exchange membrane for effective hydroxide ion transport enables high power densities in microbial fuel cells. Chem. Eng. J. 2021, 422, 130150. [Google Scholar] [CrossRef] [Scilit]
- Bard, A.J.; Faulkner, L.R. Electrochemical Methods: Fundamentals and Applications, 2nd ed.; Wiley: Hoboken, NJ, USA, 2001. [Google Scholar]
- Baby, M.G.; Ahammed, M.M. Nutrient removal and recovery from wastewater by microbial fuel cell-based systems—A review. Water Sci. Technol. 2022, 86, 29–55. [Google Scholar] [CrossRef] [Scilit] [PubMed]
- Mahmood, T.; Hussain, N.; Shahbaz, A.; Mulla, S.I.; Iqbal, H.M.N.; Bilal, M. Sustainable production of biofuels from the algae-derived biomass. Bioprocess Biosyst. Eng. 2022, 46, 1077–1097. [Google Scholar] [CrossRef] [Scilit] [PubMed]
- Itoshiro, R.; Yoshida, N.; Yagi, T.; Kakihana, Y.; Higa, M. Effect of ion selectivity on current production in sewage microbial fuel cell separators. Membranes 2022, 12, 183. [Google Scholar] [CrossRef] [Scilit] [PubMed]
- Gajda, I.; Greenman, J.; Ieropoulos, I.A. Recent advances in real-world applications of microbial fuel cells (MFCs) for wastewater treatment and power generation. J. Environ. Chem. Eng. 2018, 6, 1104–1114. [Google Scholar] [CrossRef] [Scilit]
- Xing, D.; Cheng, S.; Regan, J.M.; Logan, B.E. Change in microbial communities in acetate- and glucose-fed microbial fuel cells in the presence of light. Biosens. Bioelectron. 2009, 25, 105–111. [Google Scholar] [CrossRef] [Scilit] [PubMed]
- Chang, H.; Ngo, H.H.; Guo, W.; Nguyen, D.D.; Zhang, X.; Liu, Y.; Wang, J. Effects of ammonium and free ammonia on microalgae growth and nitrogen removal in high-strength wastewaters. Environ. Sci. Ecotechnol. 2024, 23, 100558. [Google Scholar]
Disclaimer/Publisher’s Note: The statements, opinions and data contained in all publications are solely those of the individual author(s) and contributor(s) and not of MDPI and/or the editor(s). MDPI and/or the editor(s) disclaim responsibility for any injury to people or property resulting from any ideas, methods, instructions or products referred to in the content. |
© 2026 by the authors. Licensee MDPI, Basel, Switzerland. This article is an open access article distributed under the terms and conditions of the Creative Commons Attribution (CC BY) license.