Proceeding Paper

Rainfall Runoff Simulation for Climate-Resilient Watershed Management: A Case Study of the Mangla Watershed, Pakistan †

1
College of Agricultural Science and Engineering, Hohai University, Nanjing 210098, China
2
Department of Irrigation and Drainage, University of Agriculture, Faisalabad 38000, Pakistan
3
School of Earth Science and Engineering, Hohai University, Nanjing 210098, China
*
Author to whom correspondence should be addressed.
Presented at the 2nd International Electronic Conference on Land (IECL 2025), 4–5 September 2025; Available online: https://sciforum.net/event/IECL2025.
Environ. Earth Sci. Proc. 2025, 36(1), 7; https://doi.org/10.3390/eesp2025036007
Published: 24 November 2025
(This article belongs to the Proceedings of The 2nd International Electronic Conference on Land)

Abstract

Due to climate change, runoff simulations and understanding the relationship between rainfall and runoff are crucial for watershed management. This study combined a Geographic Information System (GIS) and the Hydrologic Engineering Centre-Hydrologic Modeling System (HEC-HMS) to simulate rainfall-based runoff for the Mangla Watershed. We used freely available satellite-based topography, soil and land use and land cover data, along with daily rainfall and discharge data for the hydrological modeling. For model generation, key parameters include the Curve Number method, the Unit Hydrograph method, the recession baseflow method, and the Muskingum routing method. The model was manually calibrated from 1991 to 2000 and validated from 2001 to 2010 and a sensitivity analysis was performed to check the model behavior and hydrological response of the watershed upon changing model parameters. The model’s efficiency was tested based on its statistical parameters, like the root mean square error (RMSE), standard deviation, Percent Bias, and Nash–Sutcliffe Efficiency. The Nash–Sutcliffe Efficiency for calibration and validation was 0.919 and 0.945, respectively. The findings demonstrate that HEC-HMS is an effective tool for rainfall-based runoff modeling in the Mangla Watershed and providing valuable insights for flood risk management and climate-resilient planning by using hydrological modeling to predict runoff dynamics, optimize reservoir operations, and inform adaptive strategies for managing water resources under changing climate conditions.

1. Introduction

Increasing population pressure, changing climate patterns, and rapid land use changes are contributing to growing water scarcity, particularly in developing regions. Urban expansion, deforestation, and agricultural activities have affected natural hydrological cycles, reduced groundwater recharge, and increased surface runoff [1]. Additionally, changes in precipitation and temperature patterns intensify drought frequency and exacerbate water imbalance. These combined challenges underscore the need for a deeper understanding of watershed-scale hydrological processes to develop effective and sustainable water resource management strategies [2,3,4].
Effective planning requires reliable quantification of the hydrological cycle, which includes precipitation, evapotranspiration, infiltration, runoff, and streamflow. Hydrological models are widely used to analyze these processes and guide decision-making [3,5,6]. Over the years, several models have been developed, such as MIKE-SHE, SWAT, VIC, HBV, and HEC-HMS [7,8].
HEC-HMS, created by the “U.S. Army Corps of Engineers”, is among the most applied because it is freely available, user-friendly, and incorporates a GIS interface for digital elevation data. It allows flexible use of different runoff generation and routing methods, such as the SCS Curve Number, SCS Unit Hydrograph, recession baseflow, and Muskingum routing [9,10,11,12,13].
This study utilized HEC-HMS (v4.7.1) combined with ArcGIS 10.8 to simulate rainfall runoff dynamics in the Mangla Watershed, Pakistan. The model was chosen for its proven ability and flexibility to simulate complex hydrological processes, including rainfall runoff simulation, streamflow routing, and baseflow estimation [14]. The model is practically suitable for large watersheds where data availability is limited and topography plays a vital role in runoff behavior [15]. Additionally, its GIS interface enables more accurate DEM processing for the precise delineation of the watershed. The model was calibrated (1991–2000) and validated (2001–2010) using daily observed rainfall and discharge data, with performance assessed through statistical indices (Nash–Sutcliffe Efficiency, RMSE, and Percent Bias). This approach provides valuable insights into the watershed’s hydrological response and supports the development of climate-resilient water management strategies, particularly in the context of flood risk reduction. The use of these methods is critical in addressing the transboundary challenges of the Mangla Watershed, providing an integrated modeling framework to support sustainable water resource management across both Pakistan and India.

2. Methodology

2.1. Study Area

The Mangla Watershed lies in northeastern Pakistan and extends into the western Himalayas, partly shared with India, between 73.9–75.6° E and 33.4–34.7° N. The watershed covers an area of approximately 33,490 km2 with elevations ranging from 182 m in lowland valleys to over 5800 m in the high mountains. The basin hosts five main rivers, Jhelum, Poonch, Kanshi, Neelum, and Kunhar, with the Jhelum River being the and most significant tributary and the site of the Mangla Dam (Figure 1). The topography varies considerably, with approximately 62% of the area classified as mountainous, 28% as undulating terrain, and 10% as plains. The average slope ranges from less than 2% in the plains to over 35% in the upper catchments [16]. The region experiences a monsoon climate, with rainfall ranging from 500 mm in the lowlands to over 2000 mm at higher elevations. The watershed’s soil types vary from loam and clay in the lowlands to rocky soils in the mountains. Vegetation in the lower regions is dominated by agriculture, while the upper elevations feature forests. Over the period, the watershed has experienced significant land use changes, including deforestation and agricultural expansion, which have influenced the watershed’s hydrology, leading to increased runoff and soil erosion, particularly in the mountainous areas. This has caused the siltation problem in the watershed and reduced the dam’s storage capacity. This watershed plays a critical role in regional water supply, irrigation, and hydropower production, making it strategically important for both countries.

2.2. Data Used

In this study, different datasets were used for runoff simulation on the Mangla Watershed, including freely available satellite data and ground-based data. The details of these datasets are given in Table 1 with their source and type.

2.3. Data Processing

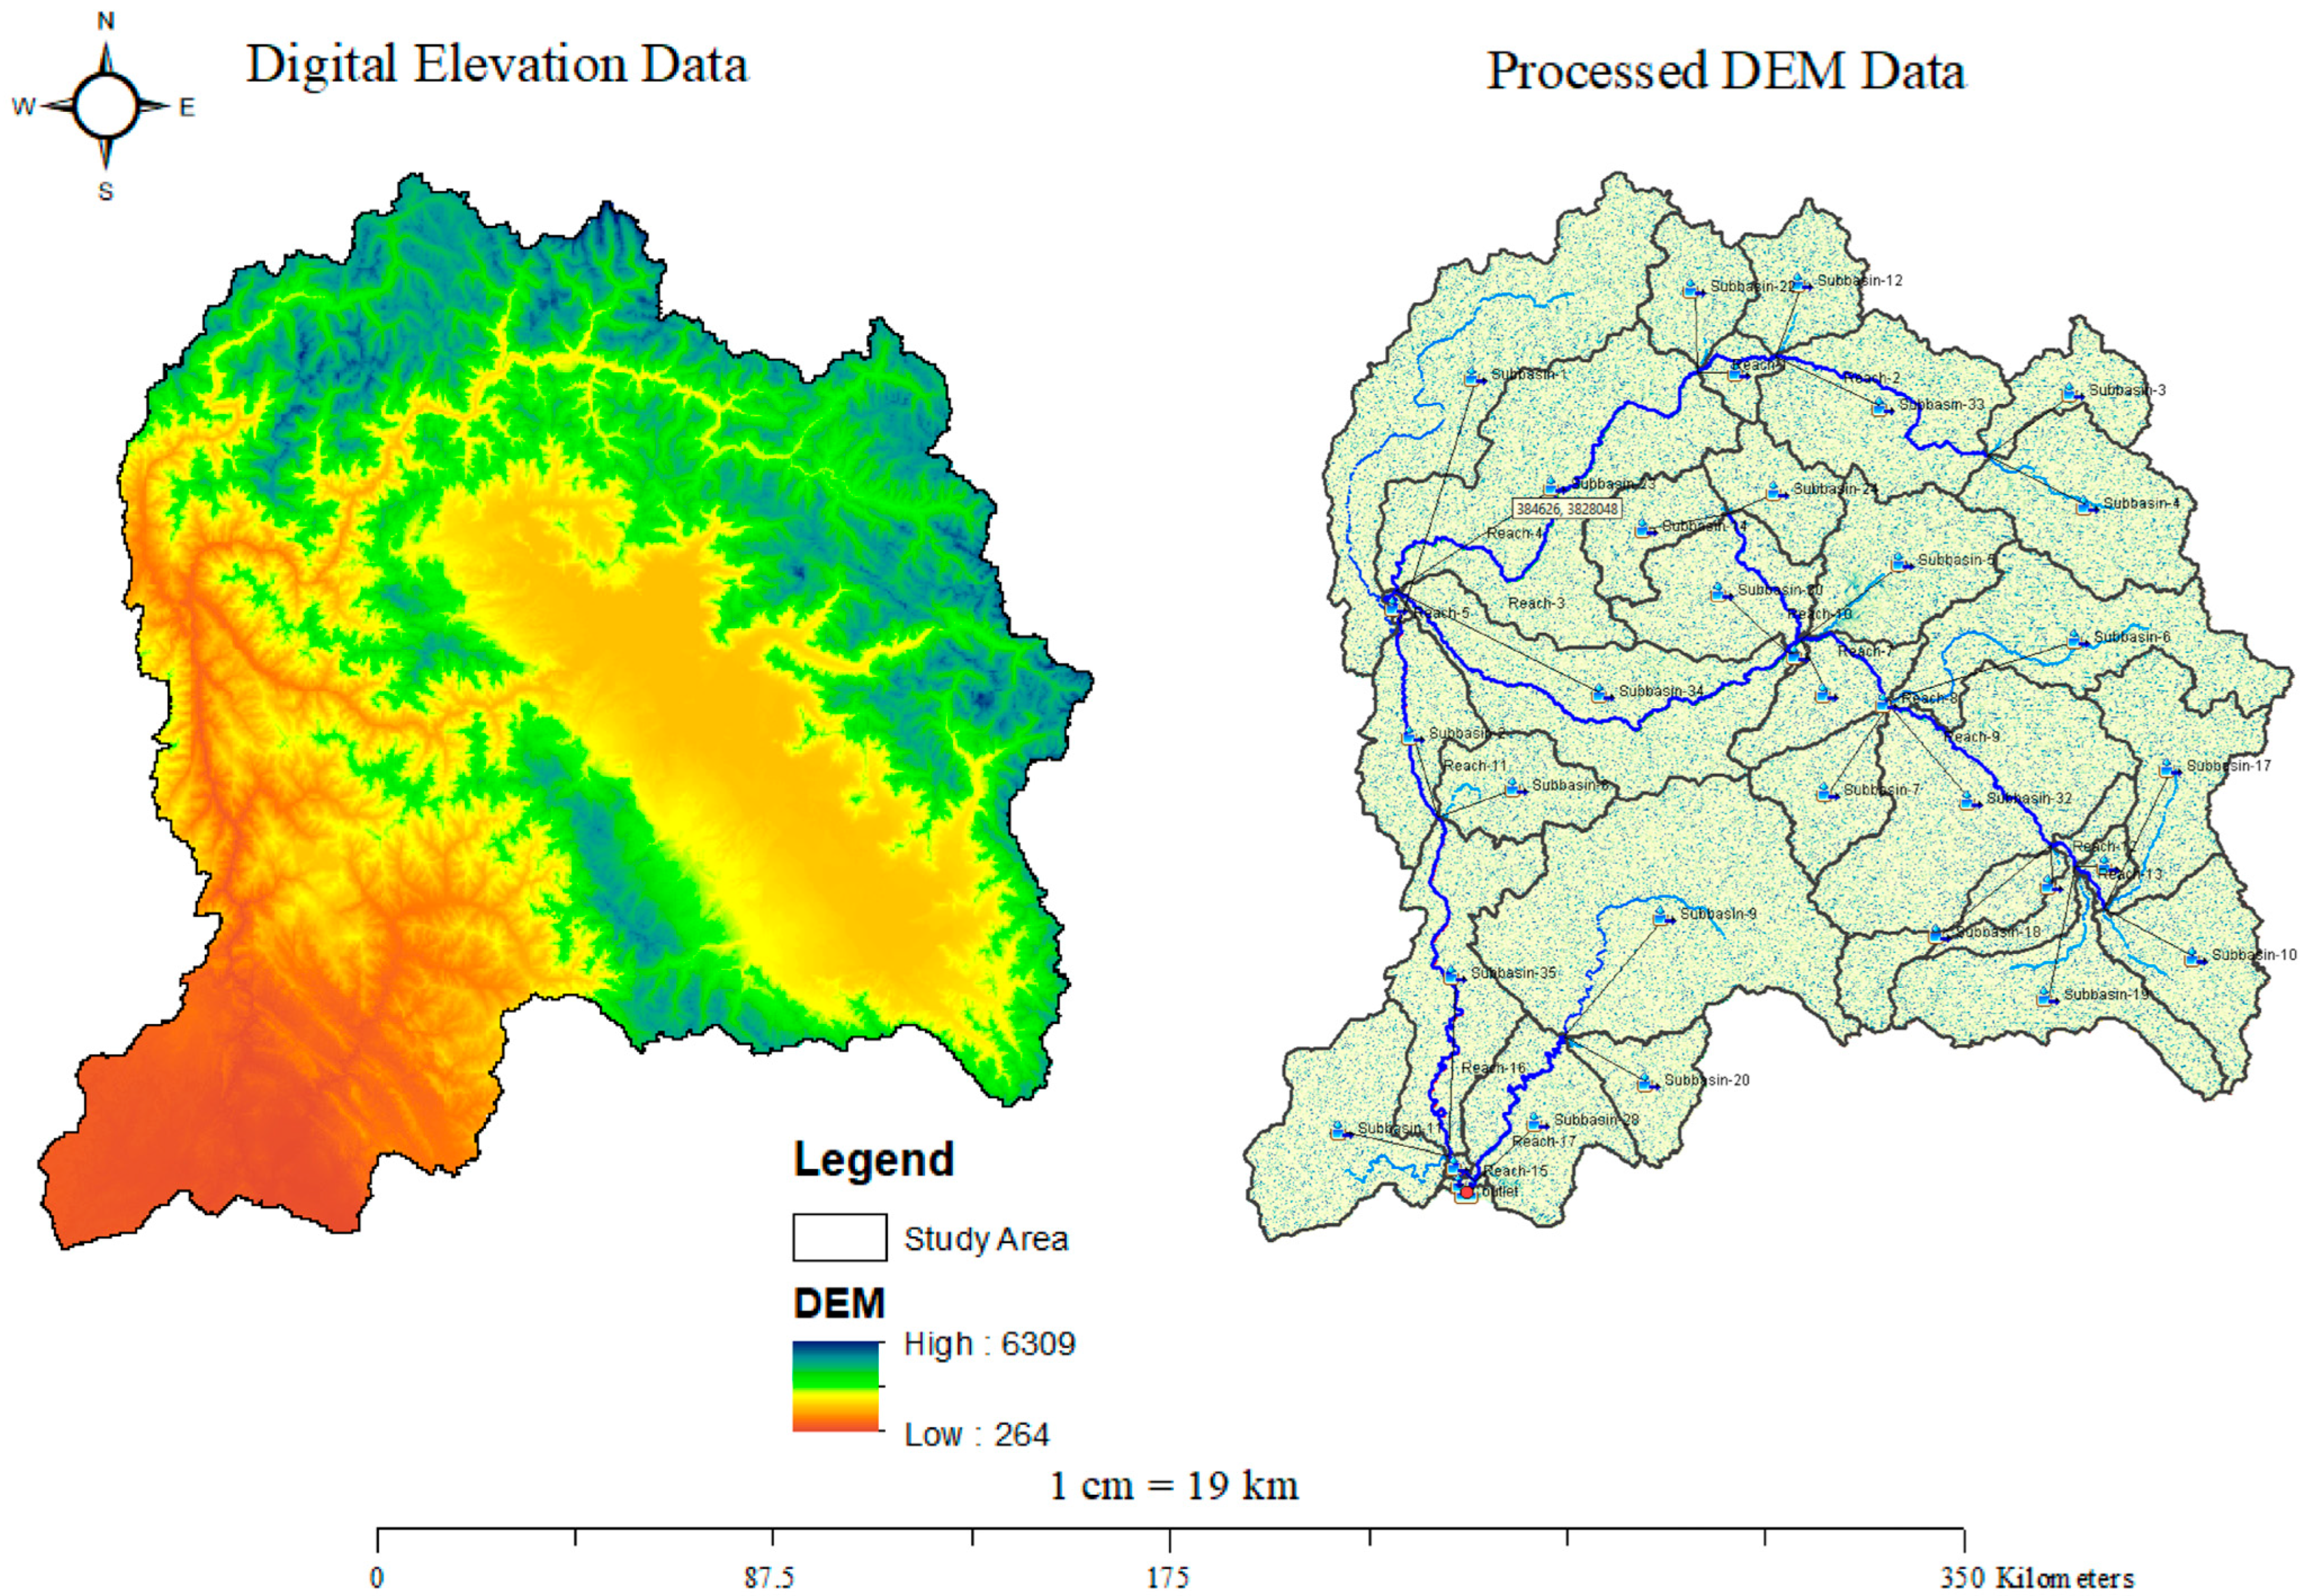
The first step in modeling was to process DEM data (Figure 2), where various steps were taken to ensure that the DEM was properly processed in HEC-HMS (v4.7.1) software to identify streams and delineate sub-basins. Any sinks and depressions in the DEM were filled to avoid errors during streamflow routing. The 30 m DEM resolution provides sufficient accuracy for large-scale modeling; however, its coarse resolution may introduce some uncertainty, particularly in regions with steep topography, which may not fully capture smaller-scale features. This potential uncertainty was considered during model calibration and validation [10].
The second step was to calculate the Curve Number (CN) by using soil and land use data in ArcGIS. The CN value was assigned using the CN table supplied by the United States Army Corps of Engineers, based on the soil hydrological group and land use cover type. The CN map, Figure 3, was then used to assign a CN value to each sub-basin of the watershed in the HEC-HMS interface.
The daily rainfall and discharge data used in this study were obtained from the Pakistan Meteorological Department (PMD) and Water and Power Development Authority (WAPDA). During data processing, missing values were handled by using temporal interpolation to estimate data points from neighboring stations. The accuracy of the rainfall stations was checked using metadata provided by the Pakistan Meteorological Department (PMD), ensuring the reliability of the data used in model calibration.

2.4. Parameter Estimation

2.4.1. Loss Estimation

Runoff losses were estimated using the SCS Curve Number method, where CN values were calculated as area-weighted by using Formula (1) [17].
C N = A i C N i A i
where A i is the area (km2) and C N i is the Curve Number.

2.4.2. Transform Method

Excess rainfall was transformed to runoff using the SCS Unit Hydrograph. Basin lag time was derived from watershed slope, flow path length, and CN values by using Formula (2) [18].
L a g = ( S + 1 ) 0.7 L 0.8 1900 × Y 0.5
where S = (25400/CN) − 254 (mm), L a g = basin lag time (h), L = longest flow path length (ft), and Y = basin slope (%).

2.4.3. Baseflow

The recession method was adopted to represent baseflow, with initial values for the recession constant and peak ratio adjusted during calibration. HEC-HMS uses Equation (3) for computing baseflow [11].
B a s e f l o w = Q o K t
where Q o is the initial discharge, K is the recession constant, and t is the current cumulative time.

2.4.4. Routing

Channel flow was simulated using the Muskingum method, where coefficients (K and X) were tuned within acceptable ranges. The values of K lie initially between 0 and 0.5, and the value of X is initially set at 0.1, but during the calibration, these values changed to make the model more efficient [4].

2.5. Sensitivity Analysis

A sensitivity analysis was conducted to assess the impact of different model parameters on simulated runoff in the Mangla Watershed. The Curve Number (CN) parameter was varied by ±10, and the Muskingum routing coefficient K varied by ±0.1 and X by ± 0.02, which were adjusted within the ranges specified in the model’s user manual.

2.6. Model Calibration and Validation

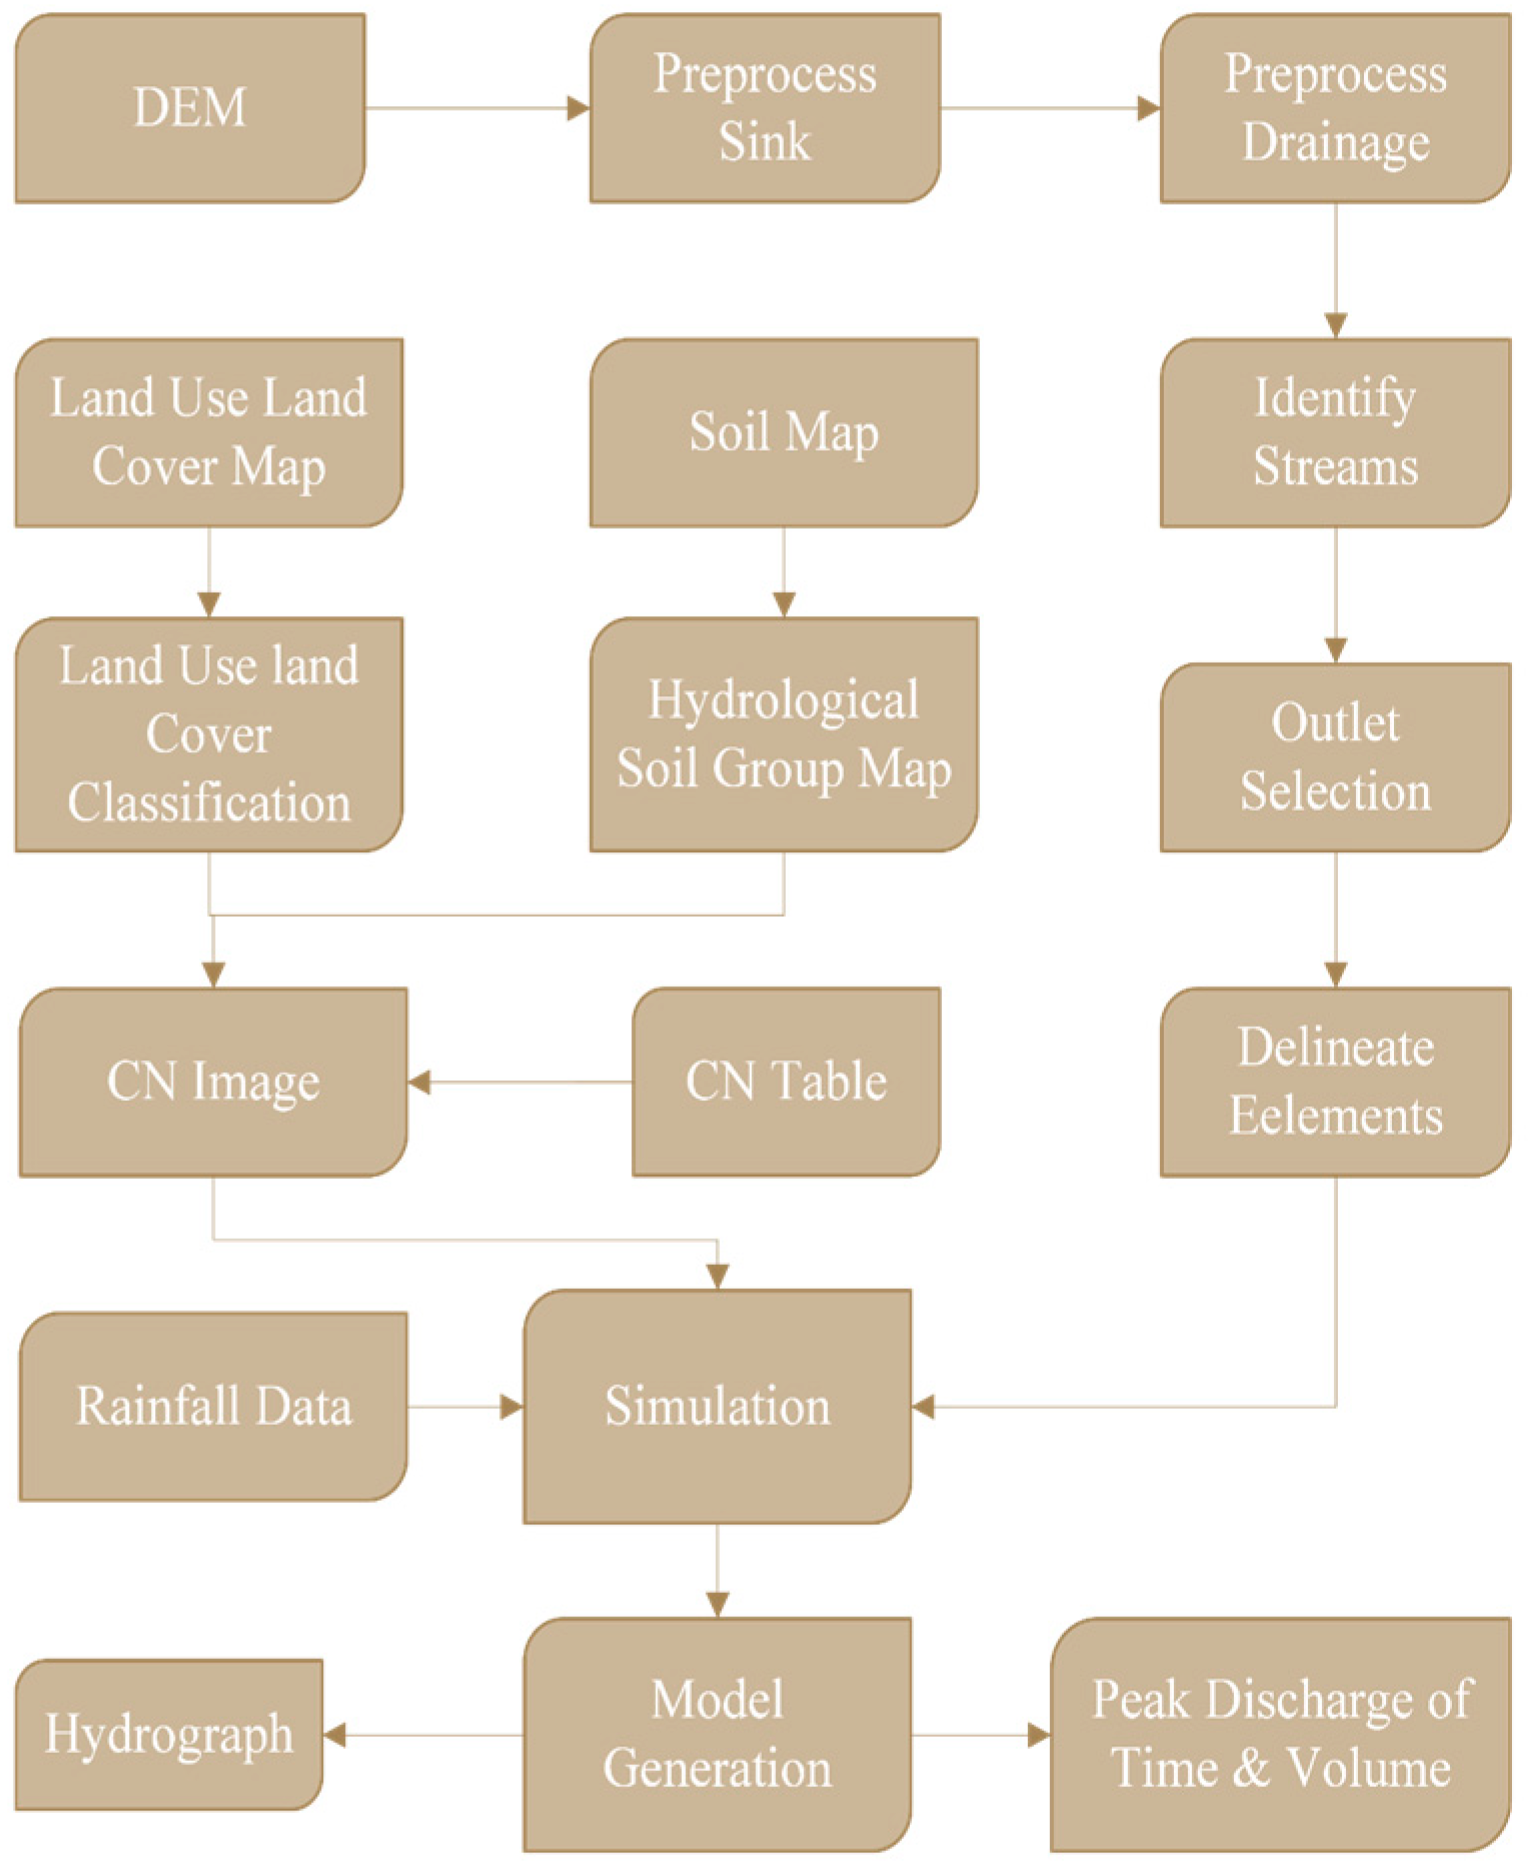
The model was run on a daily time interval. Utilizing daily rainfall and discharge data, the model output generates daily runoff that matches the input data frequency. Calibration was carried out for the period 1991–2000 by comparing simulated hydrographs with observed discharges, adjusting parameters iteratively until satisfactory performance was achieved. Validation was conducted for 2001–2010 using the calibrated parameters. Model accuracy was evaluated using Nash–Sutcliffe Efficiency (NSE), root mean square error (RMSE), Percent Bias (PBIAS), and standard deviation. The detailed methodological procedure is given in Figure 4.

3. Results and Discussion

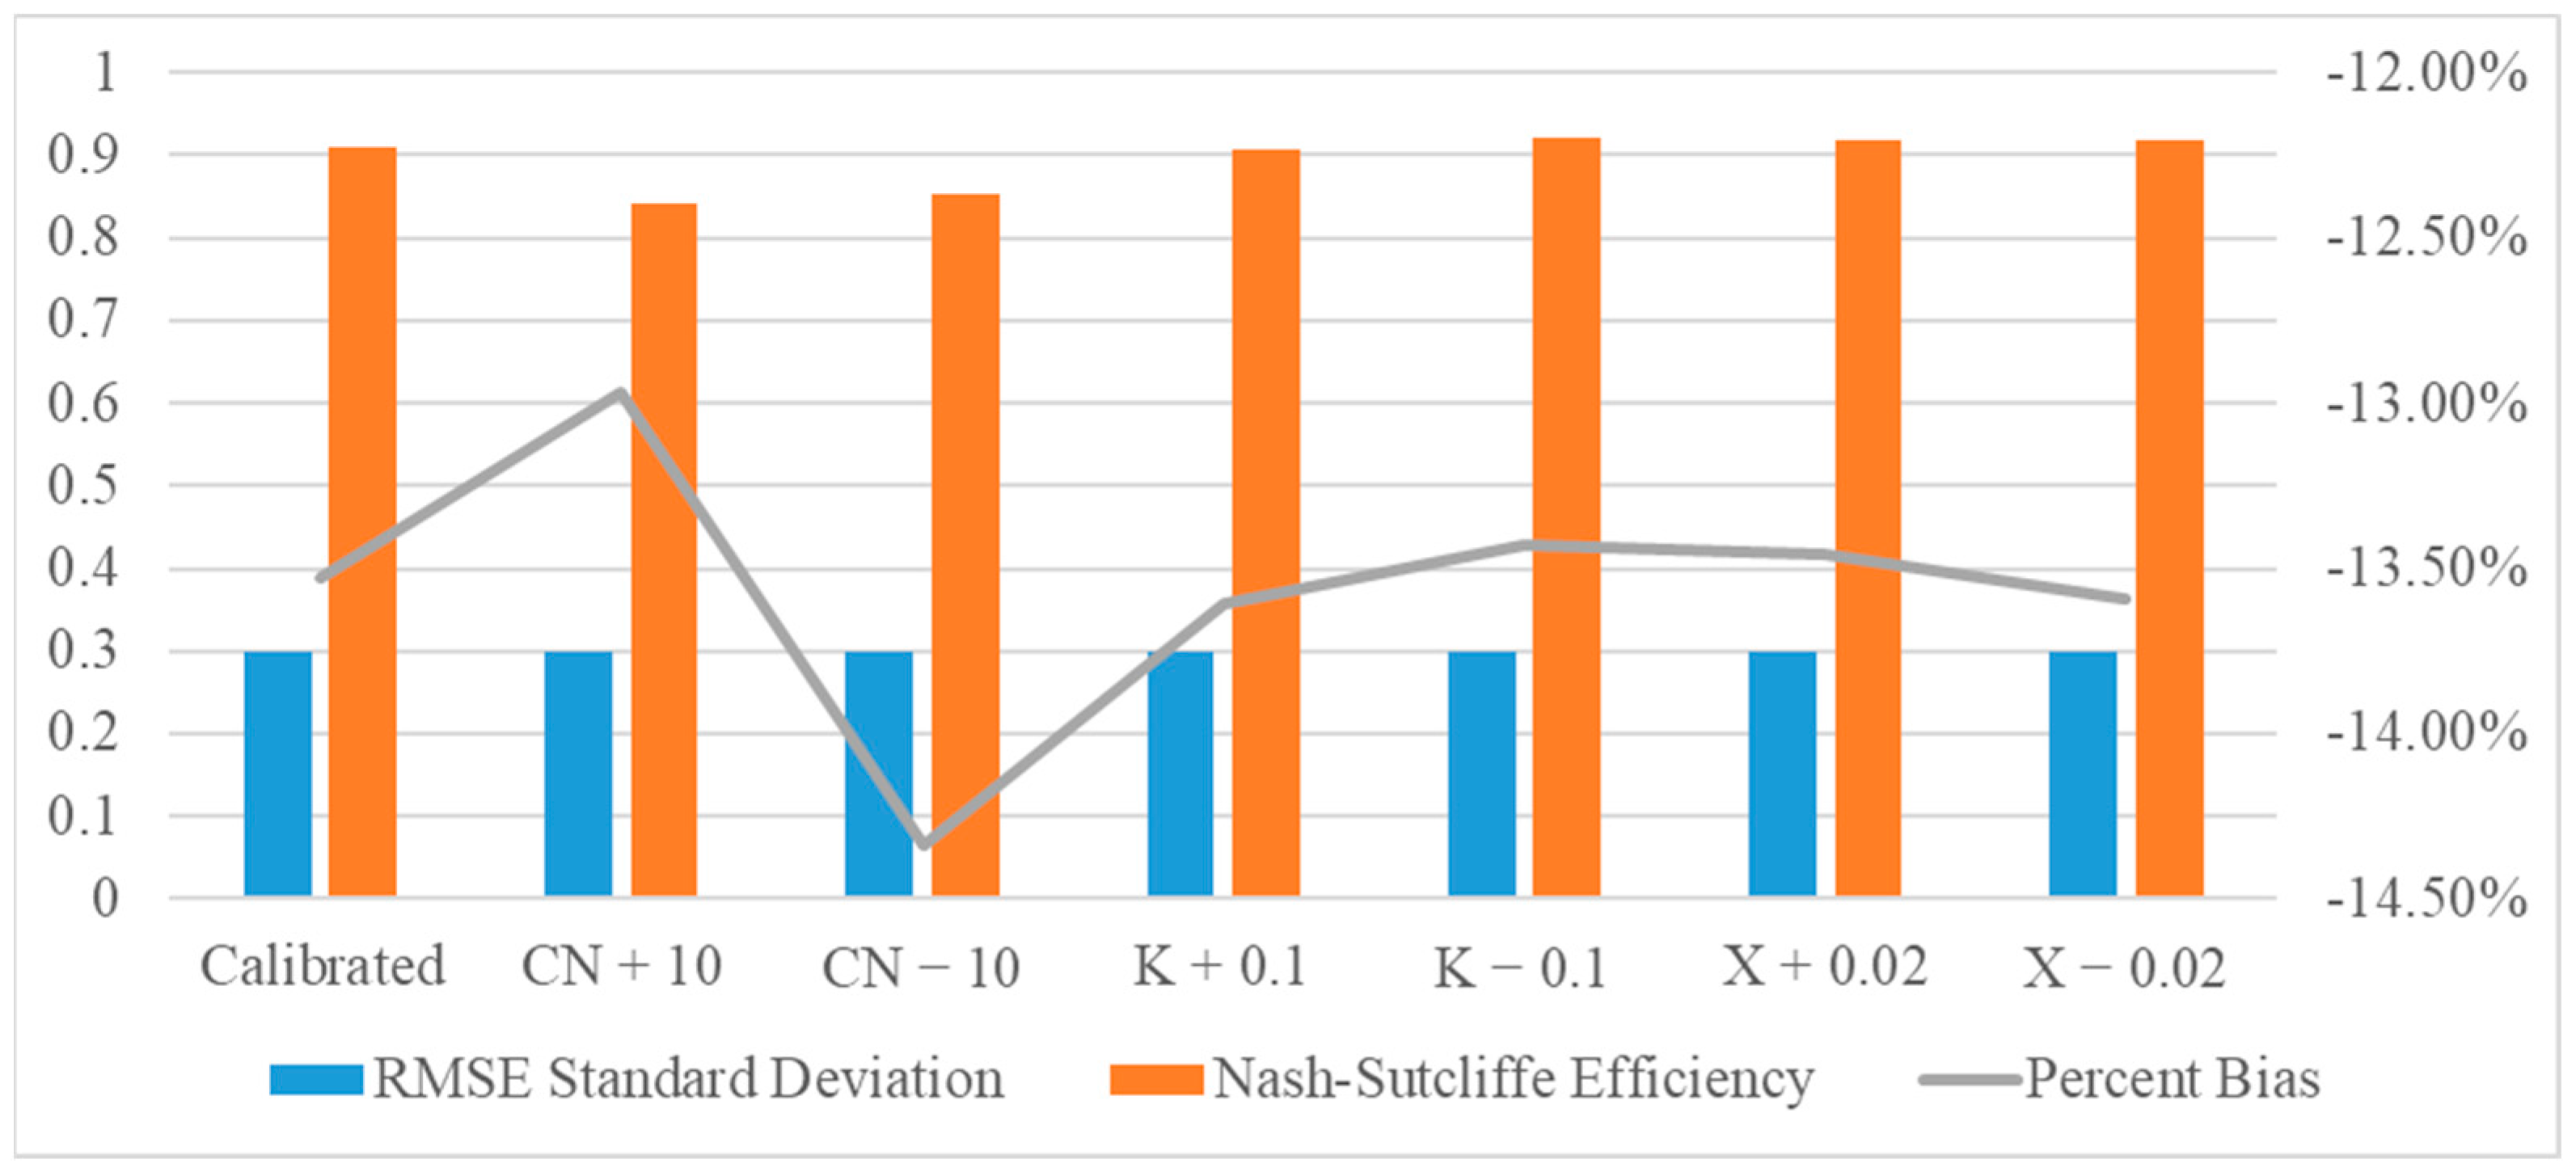
The sensitivity analysis results (Figure 5) indicate that Curve Number (CN) has the most significant impact on model performance. The Nash–Sutcliffe Efficiency (NSE) decreased from 0.91 to 0.86 when CN was modified by ±10, highlighting the sensitivity of runoff predictions to land use and soil variations. In contrast, variations in the Muskingum routing parameters K and X had a minimal impact on model performance, with NSE values remaining between 0.90 and 0.92 across a wide range of values. This suggests that the routing method is robust and adequately represents channel flow dynamics in this region. The line graph (Figure 6) illustrates the comparison between observed and simulated discharge, where the simulated CN + 10 and Muskingum K + 0.1 results closely match the observed data, demonstrating the model’s effectiveness in representing the hydrological dynamics of the Mangla Watershed.
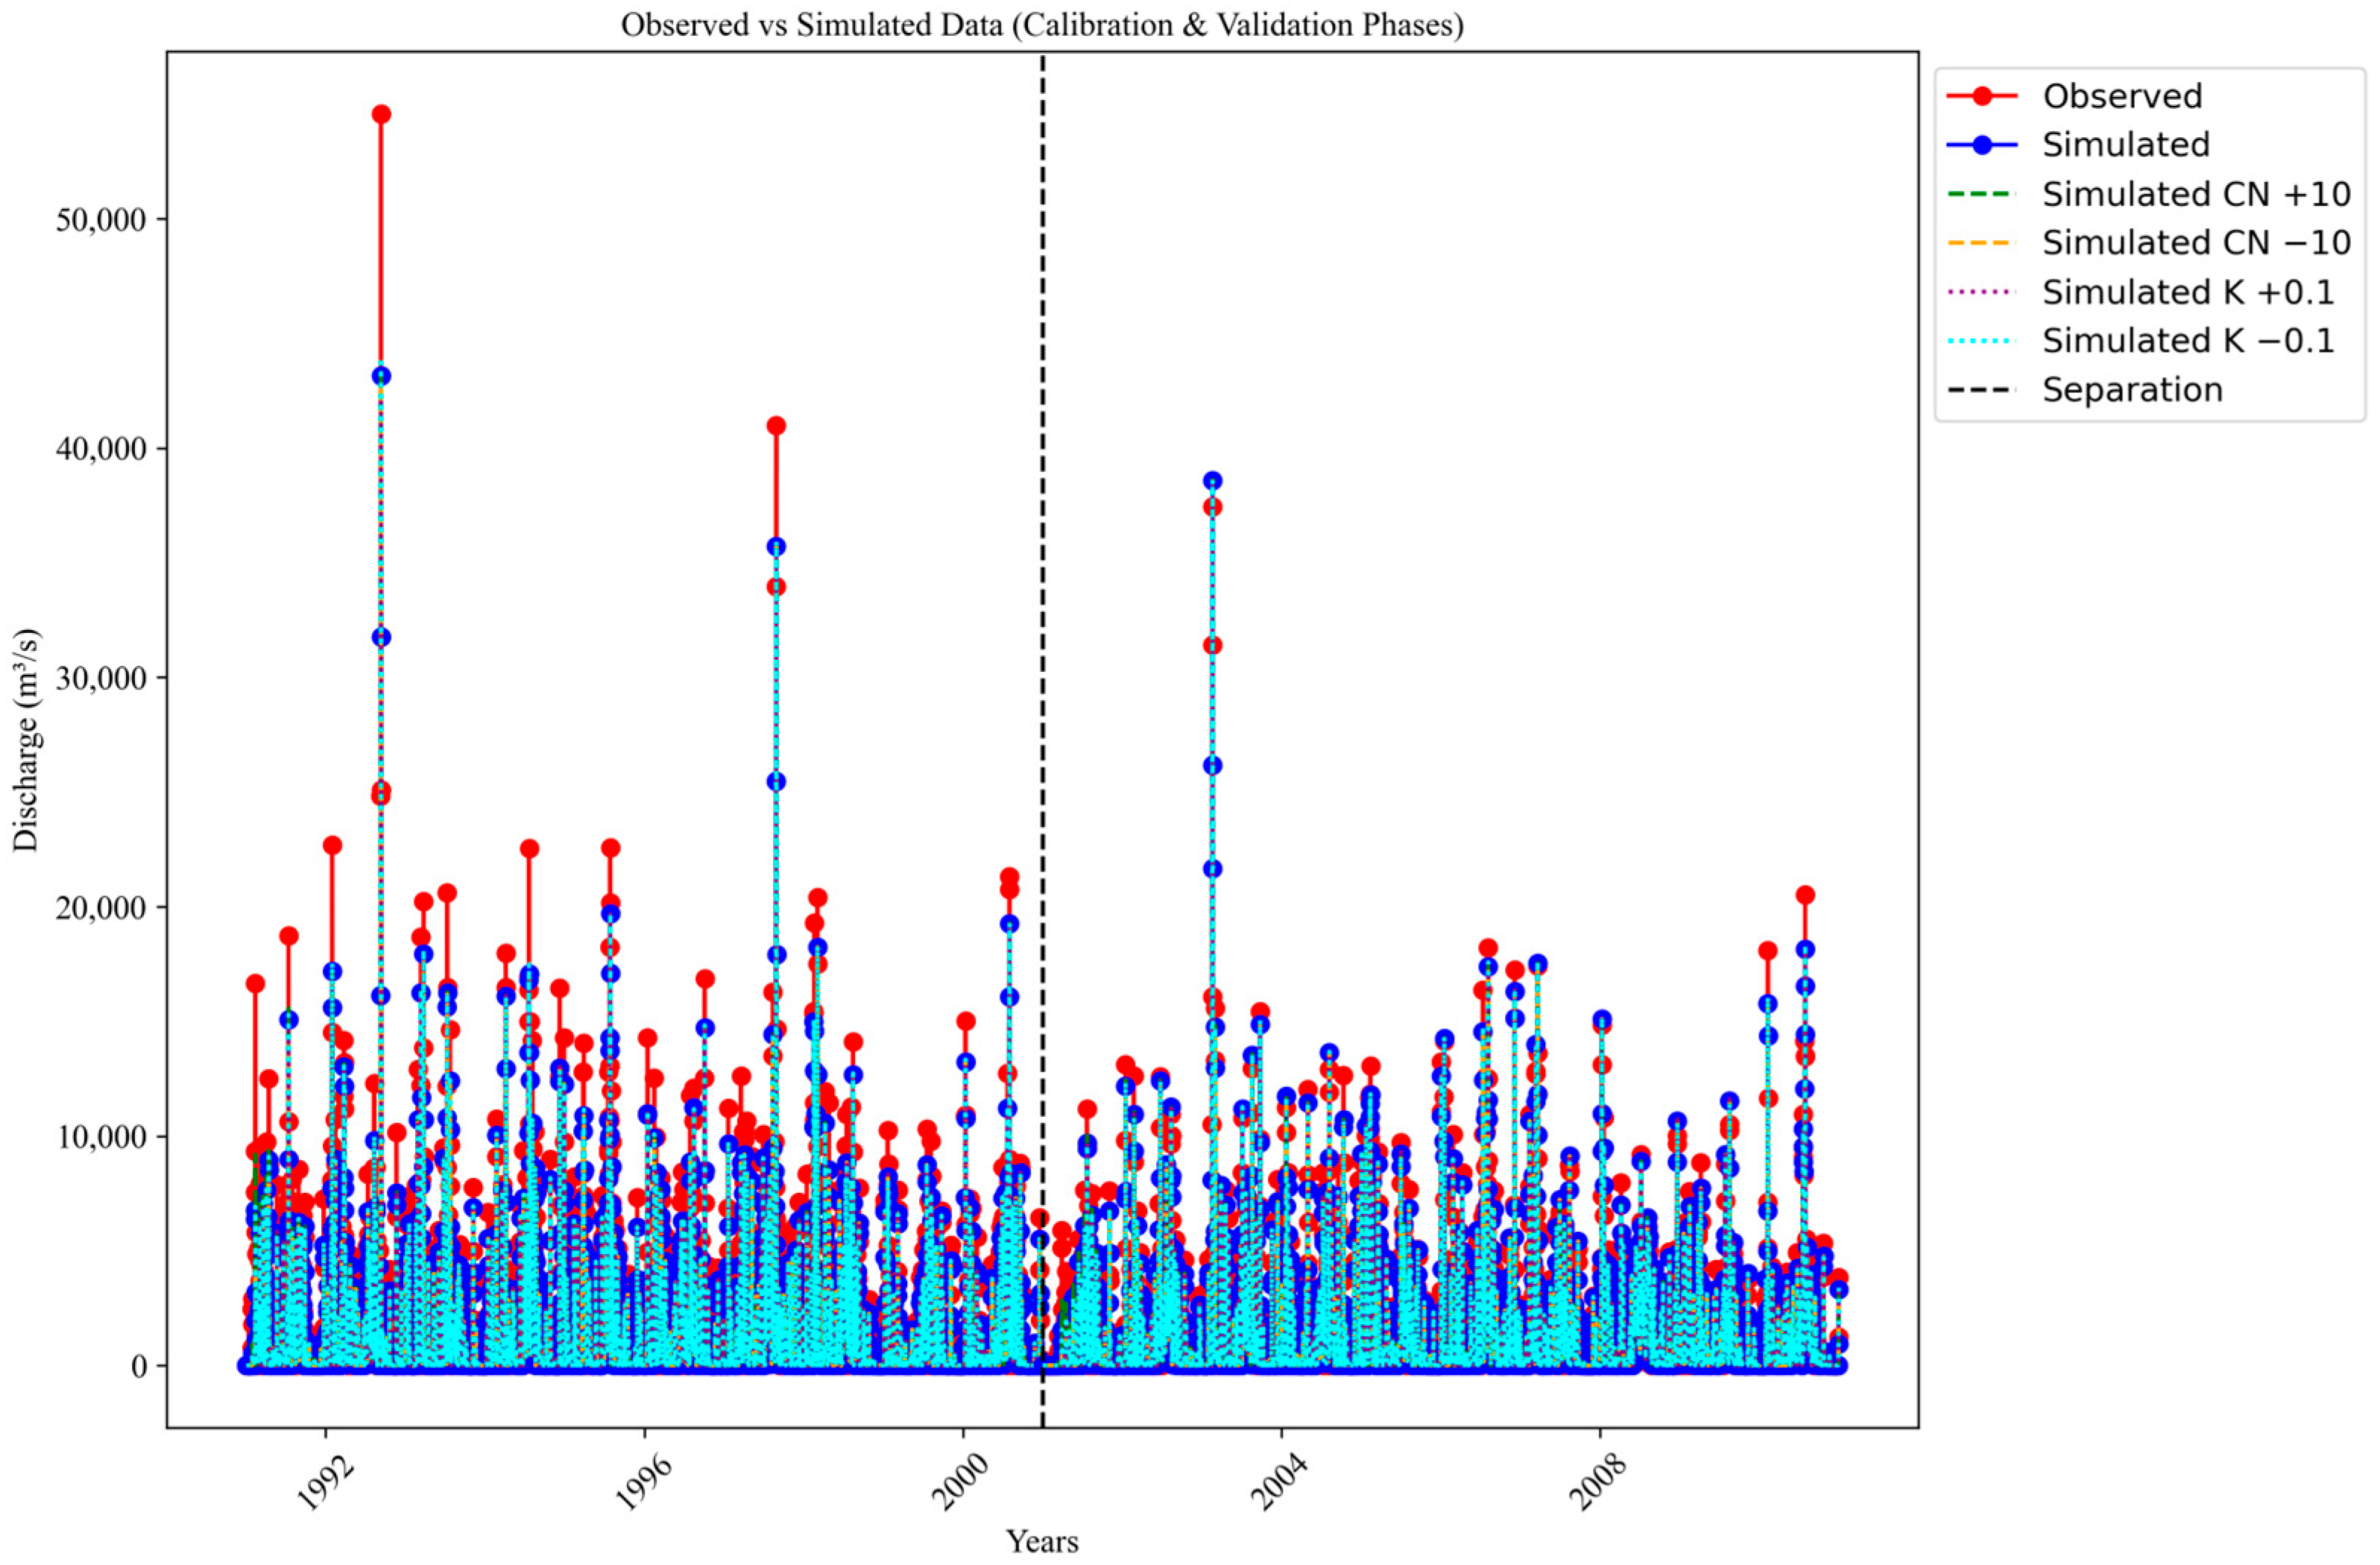
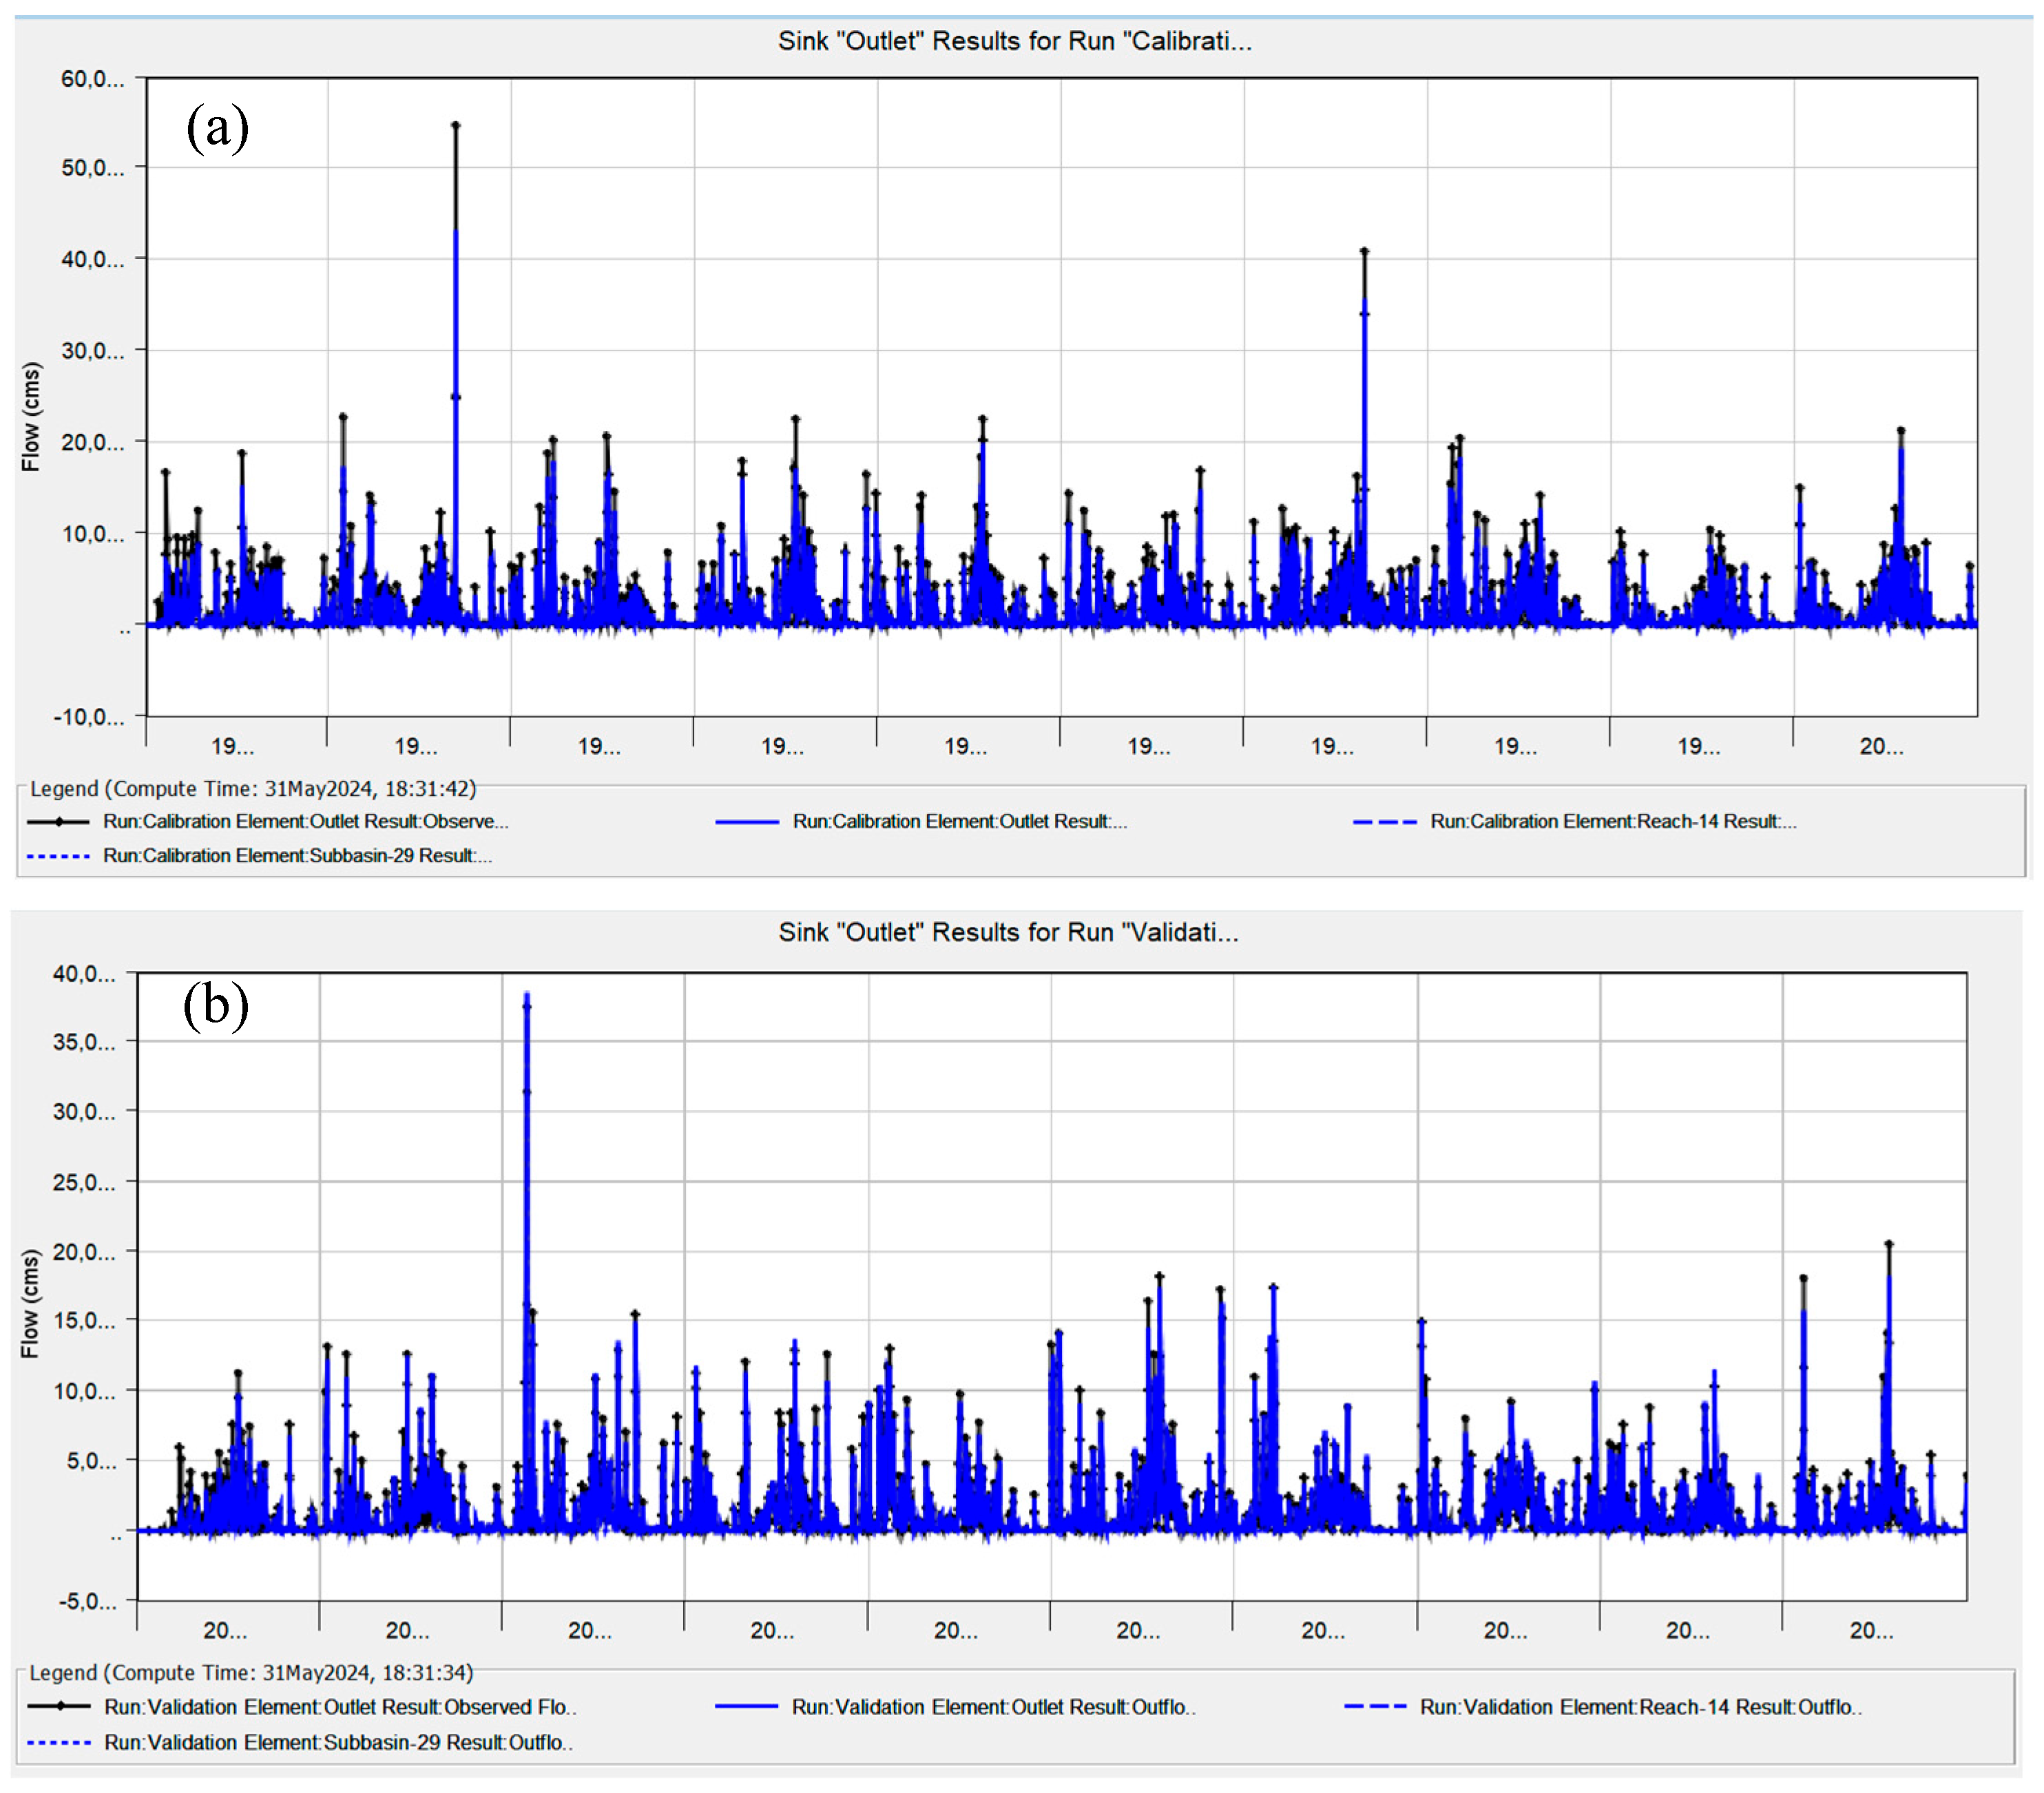
The observed and simulated hydrographs for the calibration period (1991–2000) and validation period (2001–2010) are shown in Figure 7. The simulated flow follows the observed discharge closely, with only slight overestimation of peak flows. The model demonstrates stable performance across both phases.
Statistical evaluation confirms the reliability of the simulations (Table 2). During calibration, the model achieved an NSE of 0.91, RMSE standard deviation of 0.30, and PBIAS of −13.5%. Validation further improved NSE to 0.945, with an RMSE standard deviation of 0.20 and PBIAS of −2.9%. These indices fall within widely accepted ranges, indicating excellent model performance.
When compared to previous studies, the results highlight strong predictive capacity. For instance, Halwatura & Najim [9] applied HEC-HMS in a tropical catchment and reported NSE values of 0.78–0.82. Similarly, Mandal & Chakrabarty [12] reported NSE values of 0.83–0.87 in the Teesta River Basin, while Yusop et al. [13] achieved an NSE of around 0.80 in an oil palm catchment in Malaysia. More recently, Yaseen et al. [8] simulated runoff in the Mangla Watershed using statistical downscaling coupled with HEC-HMS and achieved NSE values near 0.89. In comparison, the present study achieved higher efficiency (>0.90), which reflects the robustness of the manual calibration strategy adopted, as well as the model’s ability to replicate the watershed’s hydrological response under varying conditions.
The results also demonstrate the flexibility of HEC-HMS in simulating runoff in a complex transboundary basin such as Mangla, which is characterized by steep topography and diverse land uses. The accurate representation of both peak flows and baseflow trends indicates that the model can be confidently used for climate resilience planning. Its capacity to reproduce extreme flow events suggests potential for flood forecasting applications and reservoir operation strategies.
From a hydrological standpoint, the model’s ability to accurately simulate both high-flow events (floods) and low-flow conditions (baseflow) is essential for effective watershed management. The slight overestimation of peak flows is a common challenge in hydrological modeling. Still, it does not significantly detract from the model’s ability to predict flood risks or manage reservoir operations. This suggests that HEC-HMS, when coupled with GIS-based preprocessing, can be confidently used to evaluate the impact of rainfall runoff dynamics on the watershed, making it a valuable tool for climate resilience planning.
Overall, these findings underscore that integrating HEC-HMS with GIS-based preprocessing provides a cost-effective and reliable tool for watershed-scale hydrological modeling. The high-performance metrics, combined with consistent validation, position this study as a solid reference for future research and decision-making in flood risk management and sustainable water resource planning.

4. Conclusions

This study utilized HEC-HMS combined with GIS to simulate rainfall runoff processes in the Mangla Watershed, achieving strong model performance with NSE values above 0.90 for both calibration and validation. The results confirm the model’s reliability in simulating complex hydrological processes, particularly in areas with steep topography and transboundary water issues. The model’s accuracy is valuable for improving flood risk management and optimizing reservoir operations at Mangla Dam, balancing hydropower generation and irrigation needs under varying climate scenarios. It can also inform early warning systems for flood forecasting and guide sustainable land management practices to reduce flood risks. Future research should integrate climate change scenarios and remote sensing data to predict long-term hydrological changes and support sustainable water resource planning.

Author Contributions

All authors contributed significantly to the conception, design, and implementation of this study. S.U.R.: data curation, methodology, writing—original draft. M.Z.: supervision, data curation, formal analysis, writing—review and editing. T.C.: methodology, data curation, writing, review, and editing. A.B.J.: formal analysis. All authors have read and agreed to the published version of the manuscript.

Funding

This research received no external funding.

Institutional Review Board Statement

Not applicable.

Informed Consent Statement

Not applicable.

Data Availability Statement

The data that support the findings of this study are available from the corresponding author upon reasonable request.

Conflicts of Interest

The authors declare no conflicts of interest.

References

  1. Macalam, F.J.; Wang, K.; Onodera, S.-I.; Saito, M.; Nagano, Y.; Yamazaki, M.; Nang, Y.W. Hydrological Modeling of the Chikugo River Basin Using SWAT: Insights into Water Balance and Seasonal Variability. Sustainability 2025, 17, 7027. [Google Scholar] [CrossRef]
  2. Vairavamoorthy, K.; Gorantiwar, S.D.; Pathirana, A. Managing urban water supplies in developing countries–Climate change and water scarcity scenarios. Phys. Chem. Earth Parts A/B/C 2008, 33, 330–339. [Google Scholar] [CrossRef]
  3. Wang, M.; Zhang, L.; Baddoo, T.D. Hydrological Modeling in A Semi-Arid Region Using HEC-HMS. J. Water Resour. Hydraul. Eng. 2016, 5, 105–115. [Google Scholar] [CrossRef]
  4. Din, S.U.; Khan, N.M.; Israr, M.; Nabi, H.; Khan, M. Runoff Modelling Using HEC HMS for Rural Watershed. Int. J. Adv. Eng. Res. Dev. 2019, 6, 79–85. [Google Scholar] [CrossRef]
  5. Lundin, L.-C. Sustainable Water Management in the Baltic Sea Basin: 1. The Waterscape; Baltic University Press: Uppsala, Sweden, 2000. [Google Scholar]
  6. Gosain, A.K.; Mani, A.; Dwivedi, C. Hydrological modelling-literature review. Adv. Fluid Mech. 2009, 339, 63–70. [Google Scholar]
  7. Devia, G.K.; Ganasri, B.P.; Dwarakish, G.S. A Review on Hydrological Models. Aquat. Procedia 2015, 4, 1001–1007. [Google Scholar] [CrossRef]
  8. Yaseen, M.; Waseem, M.; Latif, Y.; Azam, M.I.; Ahmad, I.; Abbas, S.; Sarwar, M.K.; Nabi, G. Statistical downscaling and hydrological modeling-based runoff simulation in trans-boundary mangla watershed Pakistan. Water 2020, 12, 3254. [Google Scholar] [CrossRef]
  9. Halwatura, D.; Najim, M.M.M. Application of the HEC-HMS model for runoff simulation in a tropical catchment. Environ. Model. Softw. 2013, 46, 155–162. [Google Scholar] [CrossRef]
  10. Oleyiblo, J.O.; Li, Z. Application of HEC-HMS for flood forecasting in Misai and Wan’an catchments in China. Water Sci. Eng. 2010, 3, 14–22. [Google Scholar]
  11. Skhakhfa, I.D.; Ouerdachi, L. Hydrological modelling of Wadi ressoul watershed, Algeria, by HEC-HMS model. J. Water Land Dev. 2016, 31, 139–147. [Google Scholar] [CrossRef]
  12. Mandal, S.P.; Chakrabarty, A. Flash flood risk assessment for upper Teesta river basin: Using the hydrological modeling system (HEC-HMS) software. Model. Earth Syst. Environ. 2016, 2, 59. [Google Scholar] [CrossRef]
  13. Yusop, Z.; Chan, C.H.; Katimon, A. Runoff characteristics and application of HEC-HMS for modelling stormflow hydrograph in an oil palm catchment. Water Sci. Technol. 2007, 56, 41–48. [Google Scholar] [CrossRef] [PubMed]
  14. Tibangayuka, N.; Mulungu, D.M.M.; Izdori, F. Evaluating the performance of HBV, HEC-HMS and ANN models in simulating streamflow for a data scarce high-humid tropical catchment in Tanzania. Hydrol. Sci. J. 2022, 67, 2191–2204. [Google Scholar] [CrossRef]
  15. Shekar, P.R. Rainfall-Runoff Modelling of a River Basin Using HEC HMS: A Review Study. Int. J. Res. Appl. Sci. Eng. Technol. 2021, 9, 506–508. [Google Scholar] [CrossRef]
  16. Haider, H.; Zaman, M.; Liu, S.; Saifullah, M.; Usman, M.; Chauhdary, J.N.; Anjum, M.N.; Waseem, M. Appraisal of Climate Change and Its Impact on Water Resources of Pakistan: A Case Study of Mangla Watershed. Atmosphere 2020, 11, 1071. [Google Scholar] [CrossRef]
  17. Hamdan, A.N.A.; Almuktar, S.; Scholz, M. Rainfall-runoff modeling using the HEC-HMS model for the al-adhaim river catchment, northern Iraq. Hydrology 2021, 8, 58. [Google Scholar] [CrossRef]
  18. Manoj, N.; Kurian, C.; Sudheer, K. Development of a flood forecasting model using HEC-HMS. In Proceedings of the National Conference on Water Resources and Flood Management with Special Reference to Flood Modelling, Surat, India, 14–15 October 2016; Sardar Vallabhbhai National Institute of Technology: Surat, India, 2016; pp. 14–15. [Google Scholar]
Figure 1. Study area map of Mangla Watershed.
Eesp 36 00007 g001
Figure 2. DEM processing and sub-basin generation.
Eesp 36 00007 g002
Figure 3. Curve Number map with LULC and soil hydrological group map.
Eesp 36 00007 g003
Figure 4. Flow chart of the methodology for rainfall runoff simulation.
Eesp 36 00007 g004
Figure 5. The chart illustrates the behavior of various statistical parameters in response to varying model parameters.
Eesp 36 00007 g005
Figure 6. The line graph for the observed vs. simulated discharge upon varying input parameters.
Eesp 36 00007 g006
Figure 7. The hydrograph for the observed and computed flow (cms) at outlet: (a) for the calibration process 1990–2000; (b) for the validation period 2001–2010.
Eesp 36 00007 g007
Table 1. Type of datasets used in this study along with sources.
Data TypeSourceResolution
TopographyUSGS Shuttle Radar Topography Mission30 × 30 m2
Land use dataEuropean Space Agency (ESA) Global Land Cover map300 × 300 m2
Soil dataFAO World Soil Database V 1.21 km
Climate dataPakistan Meteorological Department (PMD) and Water and PowerDaily
Hydrological dataWater and Power Development Authority (WAPDA)Daily
Table 2. Statistical indices for the calibration and validation phases.
IndicesSatisfactory RangeCalibration PeriodValidation Period
RMSE Standard Deviation0 < RMSE Std. Dev. < 0.70.30.2
Nash–Sutcliffe Efficiency0.5 < NSE ≤ 10.910.945
Percent Bias−25% < PBIAS < +25%−13.53%−2.91%
Disclaimer/Publisher’s Note: The statements, opinions and data contained in all publications are solely those of the individual author(s) and contributor(s) and not of MDPI and/or the editor(s). MDPI and/or the editor(s) disclaim responsibility for any injury to people or property resulting from any ideas, methods, instructions or products referred to in the content.