Abstract
In this study, Copernicus Atmosphere Monitoring Service (CAMS) reanalysis data (EAC4 & EGG4) are used. To capture short-term variations and analyze long-term changes in CO2 and CH4, this study focuses on two specific regions of interest in each of three European countries: Greece, Italy, and France. Both CO2 and CH4 exhibit a positive trend with seasonally averaged increases of over 6% and 2%, respectively, compared to the reference period 2003–2013. Enhanced CH4 concentrations in Greece are observed during winter, primarily linked to anthropogenic sources such as fossil fuel combustion, heating, industrial activities, and gas distribution. Additionally, positive CH4 residuals exceeding 0.6% were detected in autumn, likely due to regional agricultural activities in N. Greece and/or wildfires in Athens. Winter, spring, and autumn are the seasons during which CH4 concentrations are typically highest in the Basilicata and Po Valley regions of Italy, primarily due to agricultural activities, waste management processes, and natural gas extraction, particularly in the Val d’Agri region. Higher CH4 variability was found during winter in France. Regarding CO2, all countries show a large diurnal variability (approximately ± 2 ppm), that of a typical mid-northern-hemisphere site, largely associated with the biospheric cycle of photosynthesis and enhanced by anthropogenic emissions and wildfire episodes.
1. Introduction
The increasing concentrations of greenhouse gases (GHGs), particularly methane (CH4) and carbon dioxide (CO2), are driving global warming and climate change. In this work, reanalysis data from the Copernicus Atmosphere Monitoring Service (CAMS), specifically EAC4 & EGG4 [1], are analyzed to investigate these greenhouse gases. Industrialization, urbanization, transportation, and residential heating continuously escalate the demand for fossil fuel combustion, which is the primary source of CO2 and a major contributor to the anthropogenic carbon cycle in the Northern Hemisphere (NH). Additionally, activities such as agriculture, coal mining, waste management, and natural gas use significantly contribute to the rising concentrations of GHGs, such as CH4, in the atmosphere. The increasing anthropogenic emissions in many European countries account for the human-induced global warming and GHG long-term positive trends. Therefore, it is of the utmost importance to consistently monitor the concentrations of these gases by various remote sensing techniques, ground-based measurements [2,3], satellite observations [4] or model observations [5]. In the Northern Hemisphere—where the majority of anthropogenic emissions originate—ground-based measurements, satellite observations, and model forecasts consistently reflect this annual increase. Annual mean CO2 and CH4 growth rates, based on NOAA’s globally averaged marine surface data [6], show a clear upward trend, while it is worth mentioning that 2024 has recorded the highest annual growth rate in atmospheric CO2 concentrations in decades [7].
2. Methodology
In this study, seasonal CO2 anomalies and short-term variations were analyzed over France, Italy, and Greece using reanalysis data from the CAMS (Copernicus Atmosphere Monitoring Service). The dataset was spatially limited to two regions per country of interest and temporally to the years 2020 and 2023 for CO2 and CH4, respectively. Seasonal anomalies were computed by subtracting the multi-annual seasonal climatology from the corresponding seasonal means and expressing the difference as a percentage relative to the climatology, defined from 2003 to 2013. To assess diurnal variability and short-term variations, the data were resampled to 3-hourly means, and each data point was categorized by a specific meteorological season. For each season, mean diurnal cycles were calculated, and increased concentrations were derived by subtracting the corresponding seasonal 3-hourly mean from the original values. The resulting anomalies were further detrended using a centered 15-day moving average to isolate short-term variations. The analysis focused on identifying regional patterns of enhancement and variability, particularly over key sub-regions such as the Po Valley and Basilicata region in Italy, while for France, Paris and the Occitanie region were selected as areas of special interest. Regarding Greece, the northern part and the capital city, Athens, were analyzed accordingly, enabling detailed spatial and temporal analysis.
3. Results
In this section, seasonal-averaged anomalies of CH4 and CO2 in terms of percentage difference, compared to the reference period, are illustrated in Figure 1, Figure 2 and Figure 3 for Greece, Italy and France, while Figure 4, Figure 5 and Figure 6 demonstrate the short-term increased and decreased concentrations. Seasonal CH4 anomaly patterns reveal a consistent positive trend across Greece, Italy, and France relative to the reference period 2003–2013, with the most pronounced increases occurring during winter. While all countries also exhibit positive trends in autumn, the magnitudes are notably lower. Italy shows the highest wintertime CH4 increase among the three, largely influenced by anthropogenic emissions in the Po Valley region in northwestern Italy and along the border with France, which plays a key role in driving this trend. In contrast to CH4, CO2 seasonal trends across Greece, Italy, and France show the highest increases during summer (over 7.2–7.4%) and autumn, with comparatively smaller rises observed in winter (around 6.8–7.1%). These patterns are primarily driven by anthropogenic emissions—such as those from traffic, heating, and industrial activities—which remain significant throughout Europe. However, the enhanced CO2 trends during summer and autumn may also reflect the broader impacts of climate change. Specifically, a reduction in the efficiency of natural carbon sinks—such as photosynthetic uptake during the growing season—combined with persistently high anthropogenic emissions, could be contributing to the limited seasonal drawdown of CO2, thus amplifying concentrations during periods when lower levels would typically be expected.

Figure 1.
CAMS seasonal CH4 (upper) and CO2 (lower) anomalies [%] over Greece in 2023 and 2020 for DJF, JJA, MAM and SON (from left to right) relative to the reference period: 2003–2013.
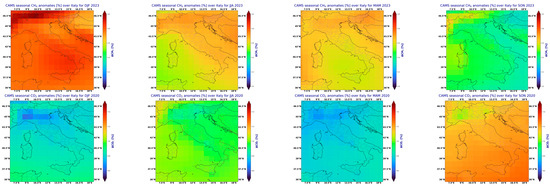
Figure 2.
Equivalent to Figure 1, shown here for Italy.
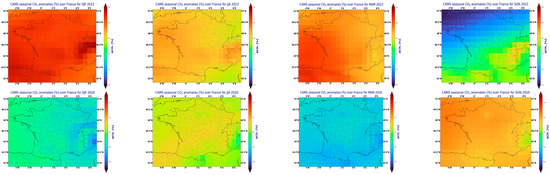
Figure 3.
Equivalent to Figure 1, shown here for France.
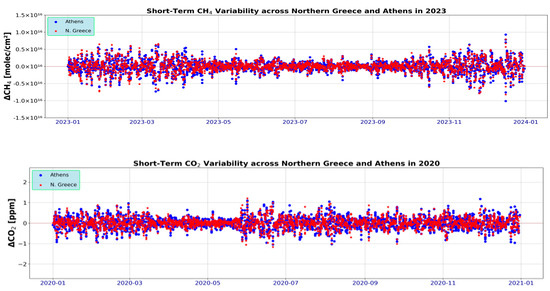
Figure 4.
Time series showing the variability in CH4 (2023) and CO2 (2020) in Northern Greece and Athens.
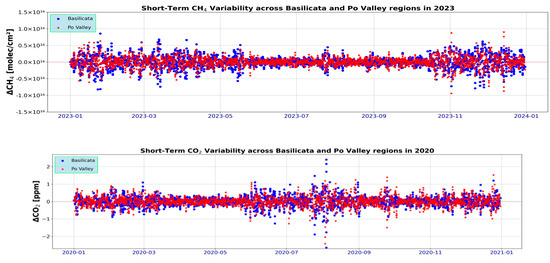
Figure 5.
Time series showing the variability in CH4 (2023) and CO2 (2020) in Basilicata and Po Valley regions in Italy.
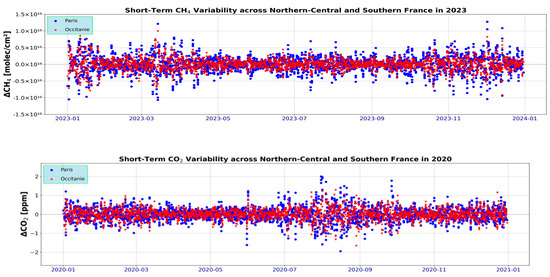
Figure 6.
Time series showing the variability in CH4 (2023) and CO2 (2020) in Paris and Occitanie region in France.
In Greece (Figure 4), ΔCH4 shows higher variability during winter and autumn, primarily due to increased anthropogenic emissions that peak during this period. Increased CH4 residuals are also observed in summer, attributed to wildfires that occurred in the final weeks of August and whose emissions were transported across Athens and the southwestern regions from northeastern Greece. Regarding ΔCO2, the 2023 data indicate increased variability during the summer and autumn months. This pattern is consistent with the seasonal cycle of CO2, which typically peaks in late spring and declines during summer, reflecting enhanced photosynthetic uptake by vegetation. Notably, short-term positive ΔCO2 residuals are observed in early August, suggesting the presence of localized emissions such as increased energy demand, or even biomass burning events that can temporarily elevate CO2 levels. Stagnant air masses, low wind speeds, or temperature inversions can trap CO2 near the surface, causing temporary concentration increases [8]. France and Italy exhibit similar seasonal patterns to those observed in Greece for both CH4 and CO2. These patterns reflect common regional influences such as agricultural practices, energy consumption trends, and biospheric activity across Southern and Western Europe. In particular, Paris shows the most pronounced ΔCH4 increased concentrations during late autumn and early December. This increase likely reflects elevated anthropogenic emissions associated with residential heating and transport. Regarding ΔCO2, increased concentrations were found in mid-summer and autumn in the region of Paris (Figure 6). In Italy, the Po Valley region exhibits significantly elevated CH4 concentrations during autumn and winter (Figure 5). This is likely due to the region’s dense agricultural activity—particularly livestock farming and manure management—combined with stagnant meteorological conditions and frequent temperature inversions. Conversely, the Basilicata region shows pronounced CO2 variability during mid-summer. This could be associated with potential reductions in photosynthetic uptake due to high temperatures or drought stress, which can temporarily reduce vegetation efficiency in sequestering CO2 or wildfire episodes occurring this time of the year in Europe.
Figure 7 presents the spatial and temporal variability of greenhouse gases, highlighting regional increases and sinks over France, Greece, and Italy during periods of elevated residuals in 2020 and 2023 within the study’s focus areas.
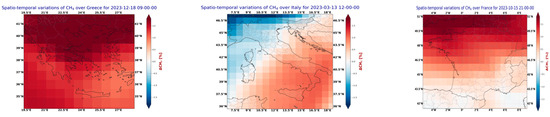
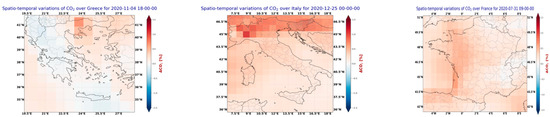
Figure 7.
Short-term CH4 (upper) and CO2 (lower) spatiotemporal variations over Greece, Italy and France.
4. Conclusions
CH4 shows a positive seasonal trend in Greece, France, and Italy, relative to the reference period 2003–2013. Enhanced short-term CH4 variations were observed in the Po Valley, Basilicata, and the Occitanie region (over 1% increase), suggesting localized sources likely linked to agricultural and anthropogenic activities. In Northern Greece, ΔCH4 peaks during winter and autumn further support the influence of agricultural practices, such as manure management and biomass burning, alongside increased domestic emissions during the colder months, as observed in urban areas like Athens. These findings highlight the importance of region-specific emission inventories and seasonal mitigation strategies in accurately assessing CH4 dynamics across Southwestern Europe.
ΔCO2 exhibits greater variability during the summer months in Greece and Italy, whereas France shows pronounced variability in late spring and early autumn (±2%), likely driven by enhanced boundary layer dynamics, which influence the accumulation and dispersion of surface emissions, as well as by the seasonal patterns in the NH. The observed weakening of the seasonal CO2 drawdown may indicate a decline in the biosphere’s carbon uptake capacity, possibly due to increasing heat stress, drought frequency, and shifts in vegetation dynamics associated with global warming. As a result, even during periods traditionally characterized by CO2 sequestration, net atmospheric CO2 continues to rise. These findings highlight how the connection between anthropogenic emissions and climate-driven biospheric changes can modulate seasonal CO2 behavior, with important implications for carbon cycle feedbacks and long-term climate trajectories in S and W Europe.
Author Contributions
Conceptualization, M.M., S.K. and V.A.; methodology, M.M., S.K., A.K. and V.A.; software, M.M.; validation, S.K., T.D. and A.K.; formal analysis, M.M.; investigation, M.M., A.K., S.K. and T.D.; resources, M.M., V.A. and S.K.; writing—original draft preparation, M.M. and S.K.; writing—review and editing, S.K., V.A., T.D. and A.K.; visualization, M.M.; supervision, V.A. and S.K. All authors have read and agreed to the published version of the manuscript.
Funding
This project has received funding from the European Union’s Horizon Europe Research and Innovation programme under Grant Agreement No 101182007.
Institutional Review Board Statement
Not applicable.
Informed Consent Statement
Informed consent was obtained from all subjects involved in the study.
Data Availability Statement
The CAMS reanalysis data are available from https://atmosphere.copernicus.eu/ (accessed on 5 September 2025).
Acknowledgments
We acknowledge CAMS reanalysis data of atmospheric composition (EAC4, EGG4) provided by Copernicus Atmosphere Data Store (https://ads.atmosphere.copernicus.eu/datasets, accessed on 6 May 2025).
Conflicts of Interest
The authors declare no conflicts of interest.
References
- Inness, A.; Ades, M.; Agustí-Panareda, A.; Barré, J.; Benedictow, A.; Blechschmidt, A.-M.; Dominguez, J.J.; Engelen, R.; Eskes, H.; Flemming, J.; et al. The CAMS reanalysis of atmospheric composition. Atmos. Chem. Phys. 2019, 19, 3515–3556. [Google Scholar] [CrossRef]
- Lorente, A.; Borsdorff, T.; Butz, A.; Hasekamp, O.; De Brugh, J.A.; Schneider, A.; Wu, L.; Hase, F.; Kivi, R.; Wunch, D.; et al. Methane retrieved from TROPOMI: Improvement of the data product and validation of the first 2 years of measurements. Atmos. Meas. Tech. 2021, 14, 665–684. [Google Scholar] [CrossRef]
- Frey, M.; Sha, M.K.; Hase, F.; Kiel, M.; Blumenstock, T.; Harig, R.; Surawicz, G.; Deutscher, N.M.; Shiomi, K.; Franklin, J.E.; et al. Building the COllaborative carbon column observing network (COCCON): Long-term stability and ensemble performance of the EM27/SUN Fourier transform spectrometer. Atmos. Meas. Tech. 2019, 12, 1513–1530. [Google Scholar] [CrossRef]
- Mermigkas, M.; Topaloglou, C.; Balis, D.; Koukouli, M.E.; Hase, F.; Dubravica, D.; Borsdorff, T.; Lorente, A. FTIR Measurements of Greenhouse Gases over Thessaloniki, Greece in the Framework of COCCON and Comparison with S5P/TROPOMI Observations. Remote Sens. 2021, 13, 3395. [Google Scholar] [CrossRef]
- Agustí-Panareda, A.; Barré, J.; Massart, S.; Inness, A.; Aben, I.; Ades, M.; Baier, B.C.; Balsamo, G.; Borsdorff, T.; Bousserez, N.; et al. Technical note: The CAMS greenhouse gas reanalysis from 2003 to 2020. Atmos. Chem. Phys. 2023, 23, 3829–3859. [Google Scholar] [CrossRef]
- Lan, X.; Thoning, K.W.; Dlugokencky, E.J. Trends in Globally-Averaged CH4, N2O, and SF6; Version 2025-05; Determined from NOAA Global Monitoring Laboratory Measurements; Global Monitoring Laboratory: Boulder, CO, USA, 2025. [Google Scholar] [CrossRef]
- Lan, X.; Tans, P.; Thoning, K.W. Trends in Globally-Averaged CO2; Determined from NOAA Global Monitoring Laboratory Measurements; Version Monday; Global Monitoring Laboratory: Boulder, CO, USA, 2025. [Google Scholar] [CrossRef]
- Mermigkas, M.; Topaloglou, C.; Balis, D.; Hase, F.; Dubravica, D. Local and regional enhancements of GHGs in Thessaloniki, inferred from ground-based FTIR measurements. Atmos. Res. 2025, 319C, 108035. [Google Scholar] [CrossRef]
Disclaimer/Publisher’s Note: The statements, opinions and data contained in all publications are solely those of the individual author(s) and contributor(s) and not of MDPI and/or the editor(s). MDPI and/or the editor(s) disclaim responsibility for any injury to people or property resulting from any ideas, methods, instructions or products referred to in the content. |
© 2025 by the authors. Licensee MDPI, Basel, Switzerland. This article is an open access article distributed under the terms and conditions of the Creative Commons Attribution (CC BY) license (https://creativecommons.org/licenses/by/4.0/).