Proceeding Paper

Economic Costs Associated with the Adverse Health Effects of PM10 and O3 Health over the Greater Athens Area, Greece, for the Period 2001–2019 †

by
Kleopatra Ntourou
1,*,
Kyriaki-Maria Fameli
1,
Christos Tsitsis
1,
Theodoros Papachristos
1,
Konstantinos Moustris
1 and
Nikolaos M. Manousakis
2
1
Air Pollution Laboratory, Mechanical Engineering Department, University of West Attica, 250 Thivon and P. Ralli Str., GR-12244 Athens, Greece
2
Laboratory of Electrical Circuits and Power Measurements, Department of Electrical and Electronics Engineering, University of West Attica, Campus 2, 250 Thivon and P. Ralli Str., GR-12244 Athens, Greece
*
Author to whom correspondence should be addressed.
Presented at the 17th International Conference on Meteorology, Climatology, and Atmospheric Physics—COMECAP 2025, Nicosia, Cyprus, 29 September–1 October 2025.
Environ. Earth Sci. Proc. 2025, 35(1), 24; https://doi.org/10.3390/eesp2025035024
Published: 12 September 2025

Abstract

Air pollution imposes significant economic burdens due to its adverse health effects. This study estimates the economic cost of premature mortality from PM10 and ground-level O3 exposure in the Greater Athens Area (2001–2019), using the value of statistical life and willingness-to-pay methods. Despite low PM10 levels in 2011, rising O3 concentrations from 2015–2019 correlated with increased cardiorespiratory mortality costs. The average cost reached €1253 million per 100,000 people. Results suggest air pollution mortality costs follow Gross Domestic Product (GDP) trends, underscoring the economic and public health value of improving air quality.

1. Introduction

Air pollution remains a major threat to ecosystems, the economy and public health. The combined effects of air pollution and increasingly frequent heatwaves in Europe significantly raise mortality risks, especially for vulnerable populations. Studies have shown that reducing air pollution improves public health and lowers related economic burdens [1]. Exposure to particulate matter (PM) and ground-level ozone is linked to numerous health issues, including upper and lower respiratory tract infections, lung cancer, stroke, ischaemic heart disease, diabetes mellitus, chronic obstructive pulmonary disease, and death [2]. Globally, air pollution is estimated to cause 3.8 million deaths annually, with the highest burden in developing regions [3]. The economic cost of premature mortality linked to air and household pollution reaches trillions of dollars each year [4].
In Greece, concentrations of many air pollutants stabilized or decreased during the decade 2000–2010 due to the increased use of higher quality fuels, changes in public transport systems and advanced vehicles technology. However, concentrations of particulate matter PM10 and ozone remained high [5]. From 2010 onwards, a gradual improvement in air quality was observed, mainly due to the economic crisis, with notable reductions in annual PM10 concentrations. In contrast, ozone levels showed less consistent improvement, influenced by regional climatic conditions. According to the latest health surveys, the combined exposure to PM10 and ozone air pollution was the fifth most important risk factor for mortality in Greece in 2019, following metabolic risks, tobacco use, dietary risks and suboptimal temperature [2]. The present study focuses on the Greater Athens Area (GAA) in Greece, where exceedances of EU air quality standards and WHO recommendations are still frequent, despite improving trends. Research on the economic impacts of air pollution in Greece remains limited. This study addresses this gap by quantifying the economic burden of premature mortality associated with long-term exposure to PM10 and O3 at ground level in five regions in GAA for the years 2001–2019 [4,6].

2. Materials and Methods

2.1. Data Sources

To investigate the economic damage caused by exposure to PM10 and O3 in GAA, data describing air pollution exposure, all-cause mortality rates, economic parameters and population measures were used from 2001 to 2019. Regarding daily average PM10 and O3 concentrations, data was obtained from five stations located within the GAA (Table 1). These stations are part of the Attica air pollution monitoring network, which is itself part of the Directorate of Climate Change and Air Quality (DCA), and operates under the supervision of the Greek Ministry of Environment and Energy (MEEE) [7]. The Athinas station measures only O3 concentrations while Aristotelous station only the PM10 particles; both are located in the center of Athens (Figure 1). The classification of stations is based on their location and categorization due to air pollution sources (UT stands for urban traffic station, UB for urban background station and SB suburban background station—Figure 1). Mortality and economic data were obtained from the Hellenic Statistical Authority and refers to the number of residents per area who died from respiratory and circulatory problems. The economic data included GDP per capita and the consumer price index (CPI) for each region for the period 2001–2019 [8]. Region- and age-specific population data were taken from the 2011 and 2021 censuses [8].

2.2. Estimating Mortality Caused by Air Pollution

The estimation of the health burden resulting from exposure to PM10 and O3 was achieved by utilising the software program AirQ+ Version 2.2.4, which was developed by the WHO Regional Office for Europe with the purpose of quantifying the health effects of air pollution. Calculations were based on methodologies and concentration-response functions established by WHO referenced in the preceding epidemiological studies [6,9]. In the present study, the premature mortality associated with cardiorespiratory diseases due to short-term exposure to PM10 and O3 was estimated. The mean annual PM10 and O3 concentrations were used, with respective cut-off values of 45 μg/m3 and 100 μg/m3 as recommended by the WHO [10]. The default relative risk (RR) values from AirQ+, based on a meta-analysis of 13 cohort studies, were also used in combination with population and health data for each region [10].

2.3. VSL-Economic Burden Approach

In order to calculate the value of a statistical life (VSL) due to premature mortality associated with air pollution (O3 and PM10 concentrations), the approach developed by the OECD (Organization for Economic Co-operation and Development) was used [3] based on Equation (1) for the period 2001–2019. The value of a statistical life (VSL) is defined as the amount that citizens are willing to pay to reduce mortality rates in various aspects of their daily lives.
V S L c h a n g i n g = V S L 2005 Y c / Y 2005 β 1 + % Δ Ρ + % Δ Υ β
where VSL2005 is the VSL value based on the OECD (€2.43 million), Yc is the GDP per capita of each region studied, for each year studied. The indicator c stands for the year under study, Y2005 is the GDP is per capita of the country, Greece, for the year 2005, % Δ Ρ and % Δ Υ is the annual percentage changes in the Consumer Price Index and GDP per capita, respectively, and coefficient b denotes the income elasticity [3]. To determine the Economic Burden resulting from premature mortality due to exposure to PM10 and O3, the following equation was utilized for calculation:
E c o n o m i c   B u r d e n = V S L c h a n g i n g M
where M represents the estimated number of deaths resulting from exposure to PM10 and O3 pollutants in the examined areas per 100,000 inhabitants, calculated by the AirQ+ software.

3. Results and Discussion

3.1. The Temporal Variation of PM10 and O3 Concentrations

Regarding the mean annual PM10 concentrations, they exceeded the EU annual limit value of 40 μg/m3 at several stations during the early 2000s, with the highest values observed at Lykovrysi (up to 63 μg/m3 in 2004), Marousi (70 μg/m3 in 2002), and Athinas (peaking at 58 μg/m3 in 2004). Over the study period, a consistent downward trend is evident across all stations. By 2019, mean annual PM10 concentrations had decreased substantially, ranging from 18 μg/m3 at Thrakomakedones to 36 μg/m3 at Athinas. This decline is particularly pronounced post-2010, coinciding with the economic recession and reductions in traffic and industrial activity. Unlike PM10, ground-level ozone concentrations remained persistently high throughout the study period, particularly at suburban and peri-urban stations such as Agia Paraskevi and Thrakomakedones. Annual mean O3 concentrations frequently exceeded 80 μg/m3 at these sites, with values peaking at 97 μg/m3 (in Agia Paraskevi the year 2003) and 97 μg/m3 (in Thrakomakedones the year 2013). In contrast, in the city center the Athinas station consistently reported lower O3 levels, typically below 45 μg/m3, reflecting ozone titration due to higher NOₓ emissions in dense urban environments. As for the total number of exceedances of the limit values, they vary considerably depending on the type of pollutant and the region. Within the Municipality of Athens, there is a lower frequency of exceedances of the O3 concentration limit, while a higher number of exceedances of the PM10 concentration limit is observed. On the contrary, Agia Paraskevi has a higher frequency of O3 exceedances compared to PM10. At the Thracomacedones station (northern GAA), the limit for O3 concentration exceeded several times throughout the considered period in contrast to PM10. The accumulation of ozone O3 in northern Athens is due to the area’s topography and the sea breeze, which traps the gas at the foot of the Parnitha mountain range.

3.2. Air Pollution Effects: AirQ+ Mortality Cases and Economic Burden

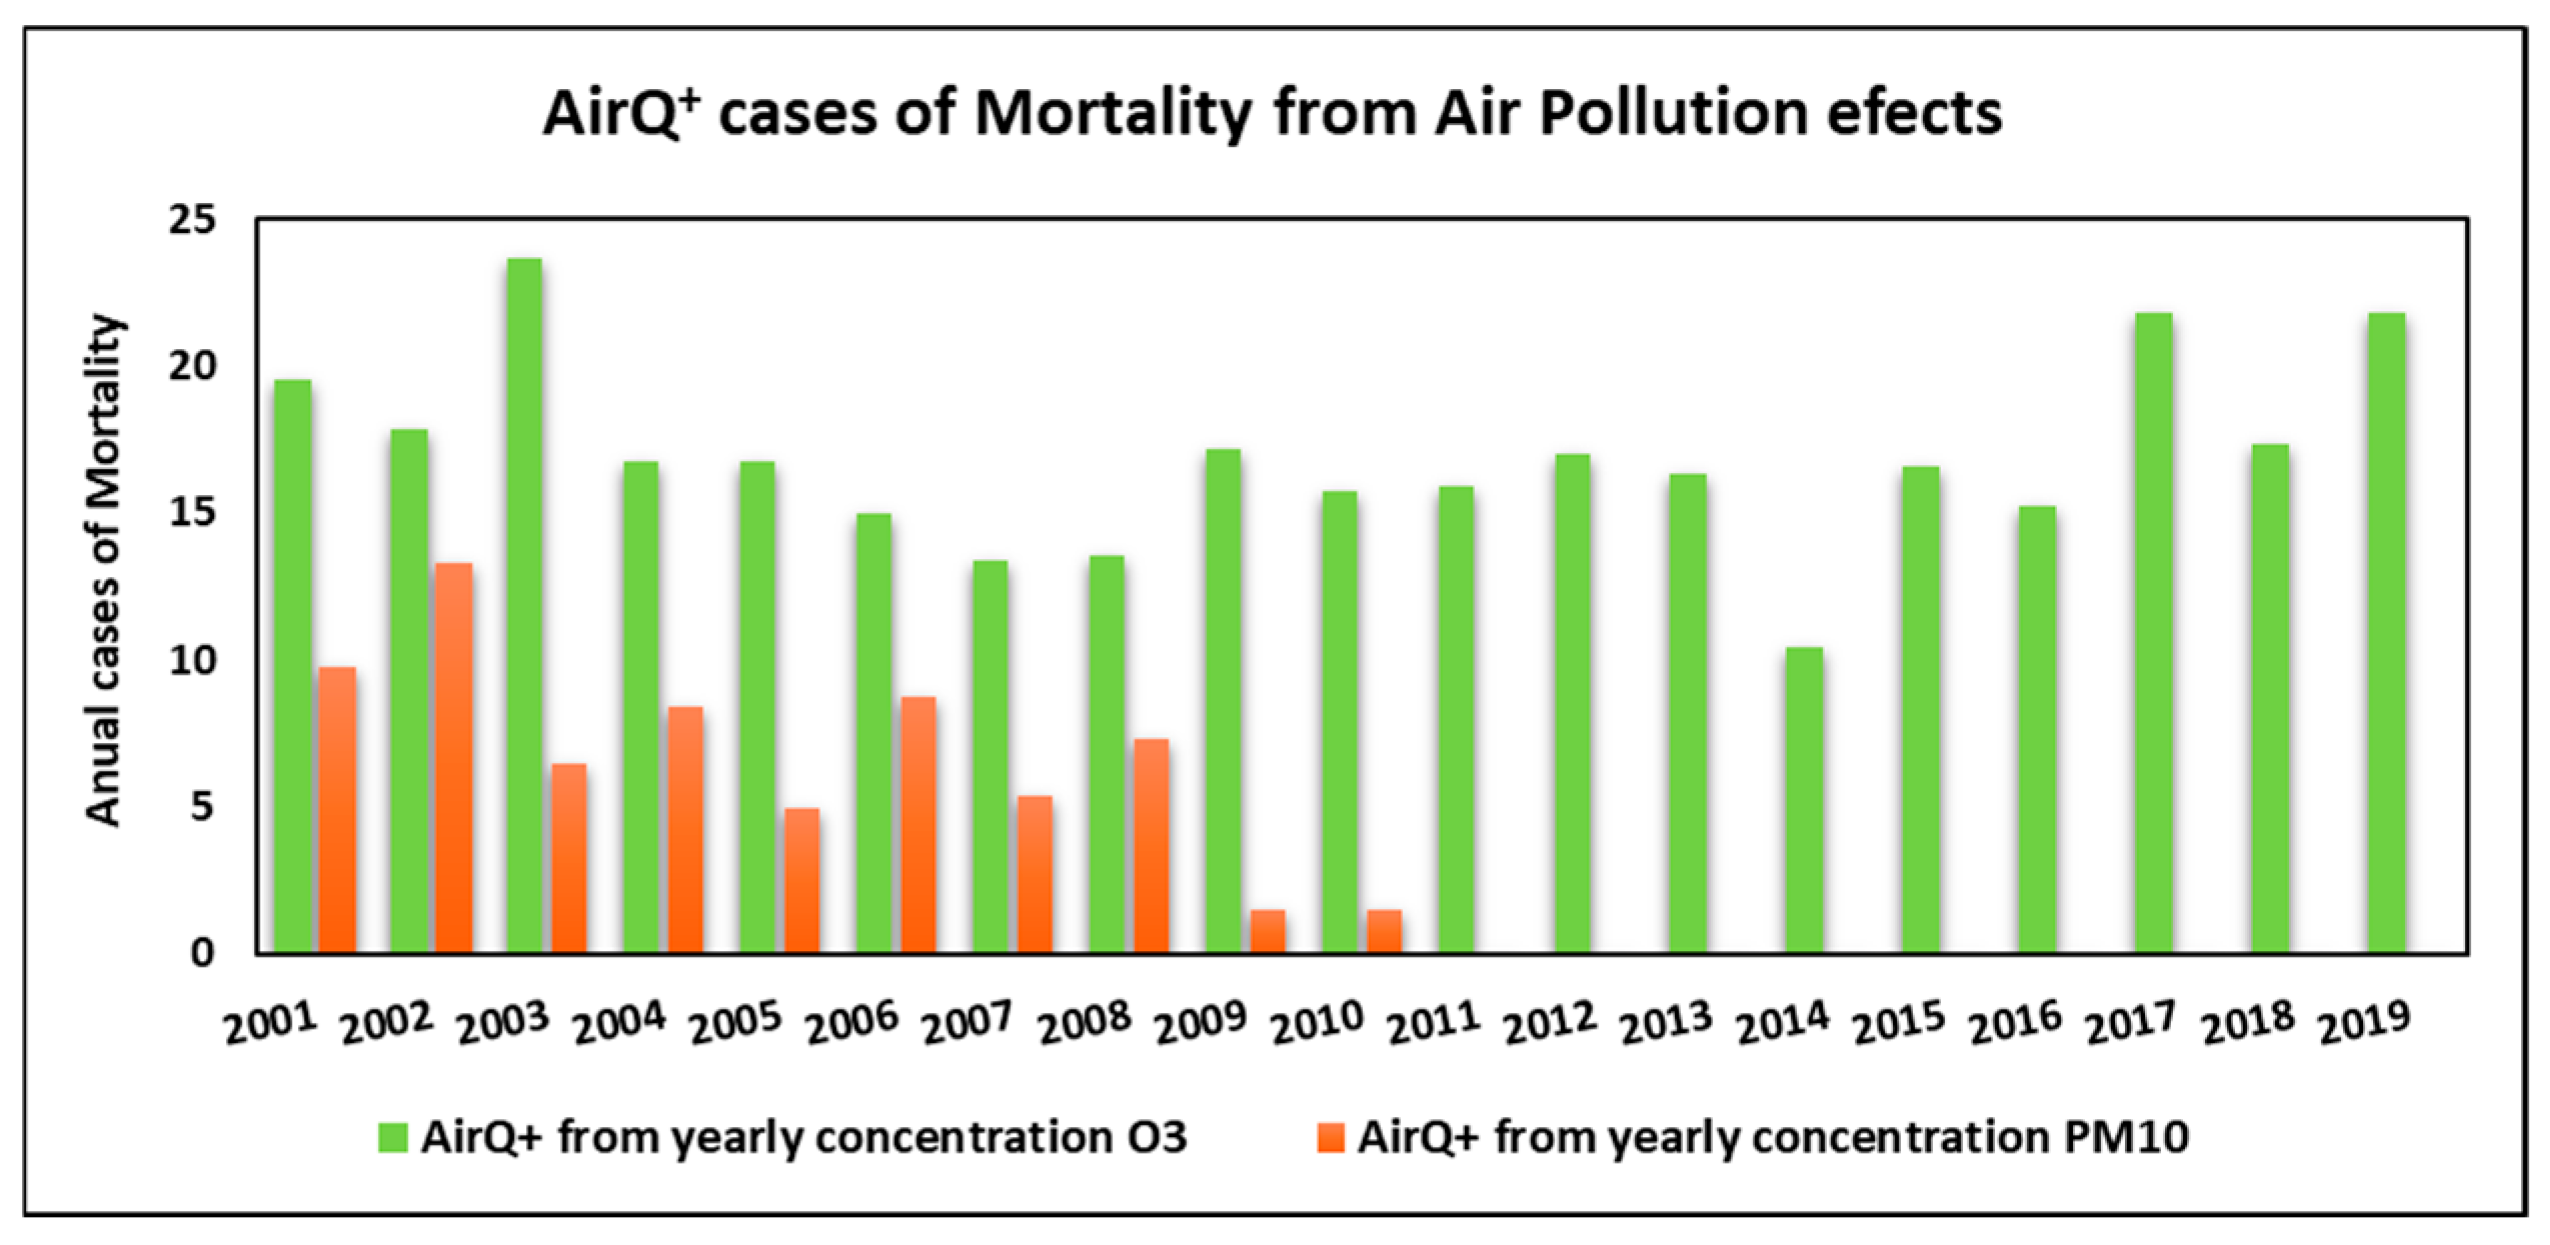
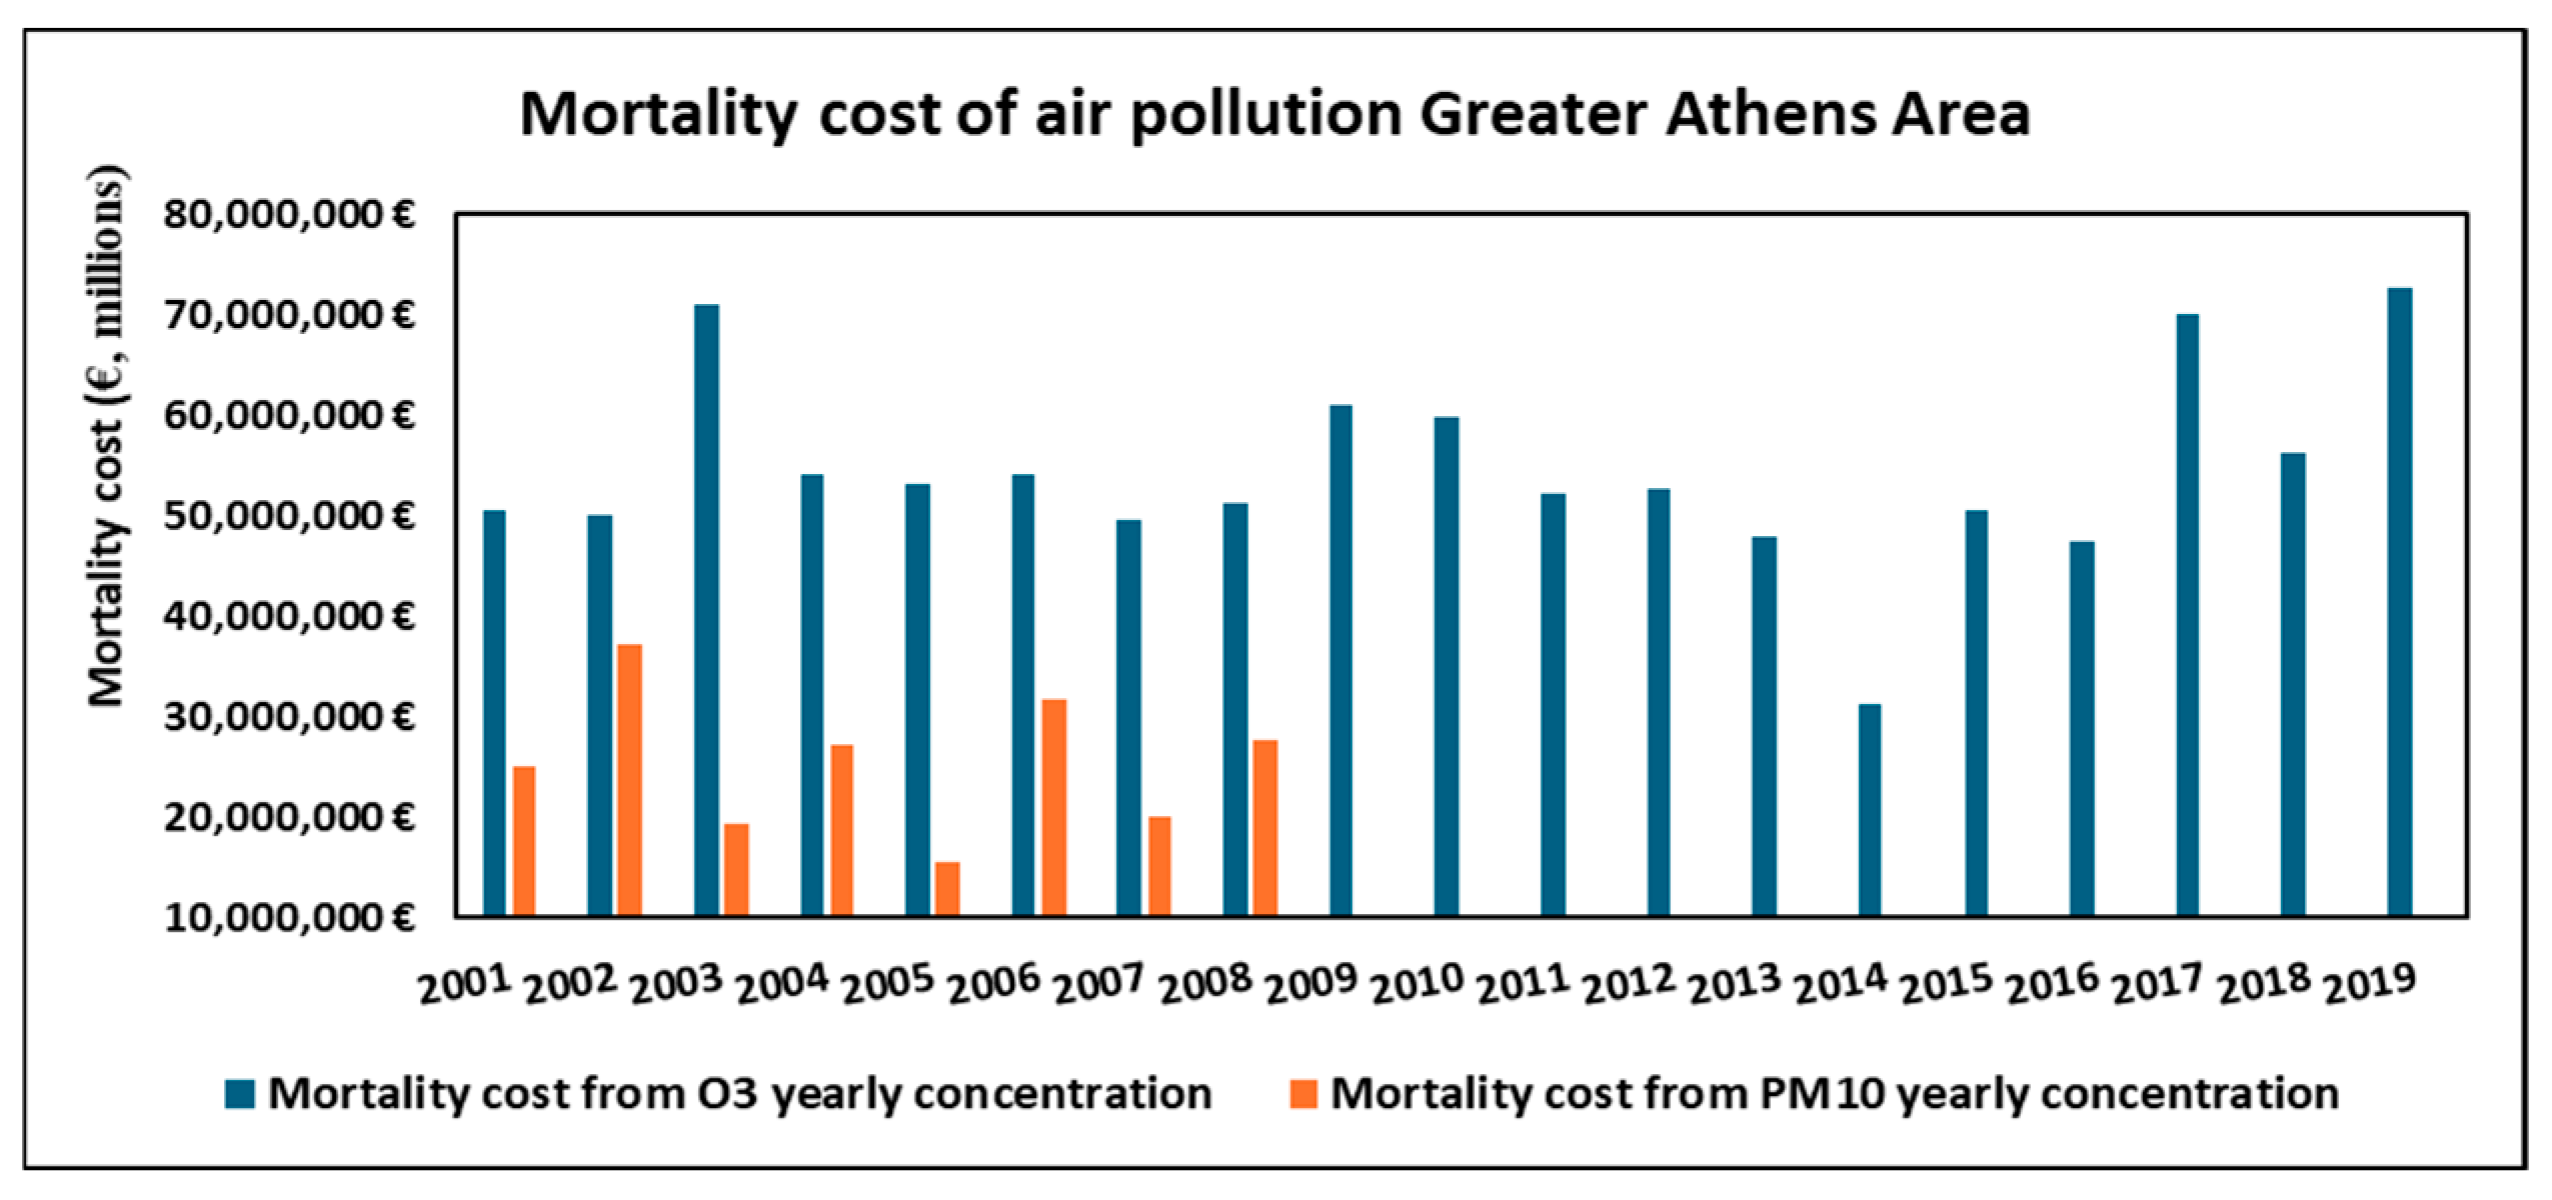
Figure 2 illustrates the number of AirQ+ mortality cases per 100,000 people from the effects of air pollution (PM10, O3) cumulatively at all data stations in the GAA. PM10 pollution was not a factor in the estimated number of deaths per 100,000 inhabitants as of 2011. Results show that there are no major differences in the number of premature deaths caused by O3 pollution during the period 2001–2019. This is due to the pollutant’s constant concentration, but also due to its long-term effect on the inhabitants’ health. The economic costs estimate of premature mortality from PM10 and O3 pollution are presented in Figure 3. Deaths caused by PM10 and O3 pollution were not identical, indicating that each pollutant causes a separate number of deaths. In the first years of the study, costs increased continuously, peaking in 2003 at approximately €90.48 million per 100,000 inhabitants. Subsequently, a decline in costs was observed. From 2011, two years following the onset of the economic crisis in Greece, until 2014, a substantial decrease in costs was evident. However, between 2015 and 2019, there was a general upward trend in costs, with fluctuations reaching approximately €72.56 million per 100,000 inhabitants. The observed increase can be attributed to the increase in O3 concentrations that was observed during this period in all areas and to, the ageing of population. There is evidence that O3 poses health risks specifically for older populations.
Moreover, Figure 3 shows that the Economic Burden of premature mortality due to PM10 and O3 pollution in all the study areas, in all years of the period 2001–2019, at an average of €1253 million per 100,000 inhabitants, or €1.253 billion per 100,000 inhabitants. This is close to the results of other studies which found that for the whole prefecture of Attica, the economic costs resulting from premature mortality associated with exposure to PM2.5 and O3, calculated by the same method, range from 1 to 4 billion € for the period 2004–2019 [6,11].

4. Conclusions

In the present study the concentrations of PM10 and O3 in the Greater Athens Area (GAA) between 2001 and 2019 were analysed. Using the AirQ+ software, the number of deaths from cardiorespiratory diseases per 100,000 inhabitants attributed to exposure to the above mentioned pollutants was estimated. The analysis also quantified the associated economic losses due to premature mortality. It was shown that, compared to O3, PM10 had little effect on mortality and economic burden, especially after 2011. From 2001 to 2019, the economic burden of premature mortality due to PM10 and O3 pollution averaged €1253 million per 100,000 inhabitants in all study areas. This can be interpreted as the welfare losses of Greek society resulting from air pollution and reflects only the financial impact of premature deaths—not the broader health-related or societal costs. Consequently, the magnitude of these losses is substantial. The annual change in economic losses was mainly due to changes in O3 levels and GDP per capita, suggesting that reducing air pollution can yield not only significant public health benefits but also considerable economic gains.

Author Contributions

Conceptualization, K.N. and K.-M.F.; methodology, K.N., C.T. and K.M.; formal analysis, K.N. and K.-M.F.; investigation, K.N., T.P. and K.-M.F.; resources, K.N.; data curation, K.N. and T.P.; writing—original draft preparation, K.N., K.-M.F., N.M.M. and K.M.; visualization, K.N. and C.T.; supervision, K.N. All authors have read and agreed to the published version of the manuscript.

Funding

This publication was fully funded by the University of West Attica.

Institutional Review Board Statement

Not applicable.

Informed Consent Statement

Not applicable.

Data Availability Statement

Data are available on request due to restrictions regarding privacy. The data presented in this study are available on request from the corresponding author. The data are not publicly available due to privacy.

Conflicts of Interest

The authors declare no conflicts of interest.

References

  1. World Health Organization. WHO Global Air Quality Guidelines: Particulate Matter (PM2.5 and PM10), Ozone, Nitrogen Dioxide, Sulfur Dioxide and Carbon Monoxide; World Health Organization: Geneva, Switzerland, 2021; ISBN 978-92-4-003422-8. [Google Scholar]
  2. Health Metrics. Evaluation (IHME) GBD Results Tool: GBD 2019 Codebook and Data Guide. 29 June 2022. Available online: http://www.healthdata.org/about/terms-and-conditions (accessed on 20 September 2024).
  3. Viscusi, W.K.; Masterman, C.J. Income Elasticities and Global Values of a Statistical Life. J. Benefit Cost Anal. 2017, 8, 226–250. [Google Scholar] [CrossRef]
  4. World Bank; Institute for Health Metrics and Evaluation. The Cost of Air Pollution: Strengthening the Economic Case for Action; The World Bank: Washington, WA, USA, 2016. [Google Scholar]
  5. Murray, C.J.L. The Global Burden of Disease Study at 30 Years. Nat. Med. 2022, 28, 2019–2026. [Google Scholar] [CrossRef] [PubMed]
  6. Psistaki, K.; Petrou, I.; Paschalidou, A.K.; Kassomenos, P. Temporal and Spatial Characteristics of the Economic Burden Related to Long-Term PM2.5 and O3 Exposure in Greece for the Period 2004–2019. Environ. Sci. Proc. 2023, 26, 14. [Google Scholar] [CrossRef]
  7. HMEE Hellenic Ministry of Environment and Energy. Available online: https://ypen.gov.gr/ (accessed on 30 April 2021).
  8. HSA Hellenic Statistical Authority. Available online: https://www.statistics.gr/en/home/ (accessed on 20 June 2021).
  9. Oliveri Conti, G.; Heibati, B.; Kloog, I.; Fiore, M.; Ferrante, M. A Review of AirQ Models and Their Applications for Forecasting the Air Pollution Health Outcomes. Environ. Sci. Pollut. Res. 2017, 24, 6426–6445. [Google Scholar] [CrossRef] [PubMed]
  10. World Health Organization. Tools for Health Impact Assessment of Air Quality: AirQ+ Software. Available online: https://www.who.int/europe/tools-and-toolkits/airq---software-tool-for-health-risk-assessment-of-air-pollution (accessed on 20 September 2024).
  11. Petrou, I.; Psistaki, K.; Kassomenos, P.A.; Dokas, I.M.; Paschalidou, A.K. Studying the Economic Burden of Premature Mortality Related to PM2.5 and O3 Exposure in Greece between 2004 and 2019. Atmos. Pollut. Res. 2024, 15, 101978. [Google Scholar] [CrossRef]
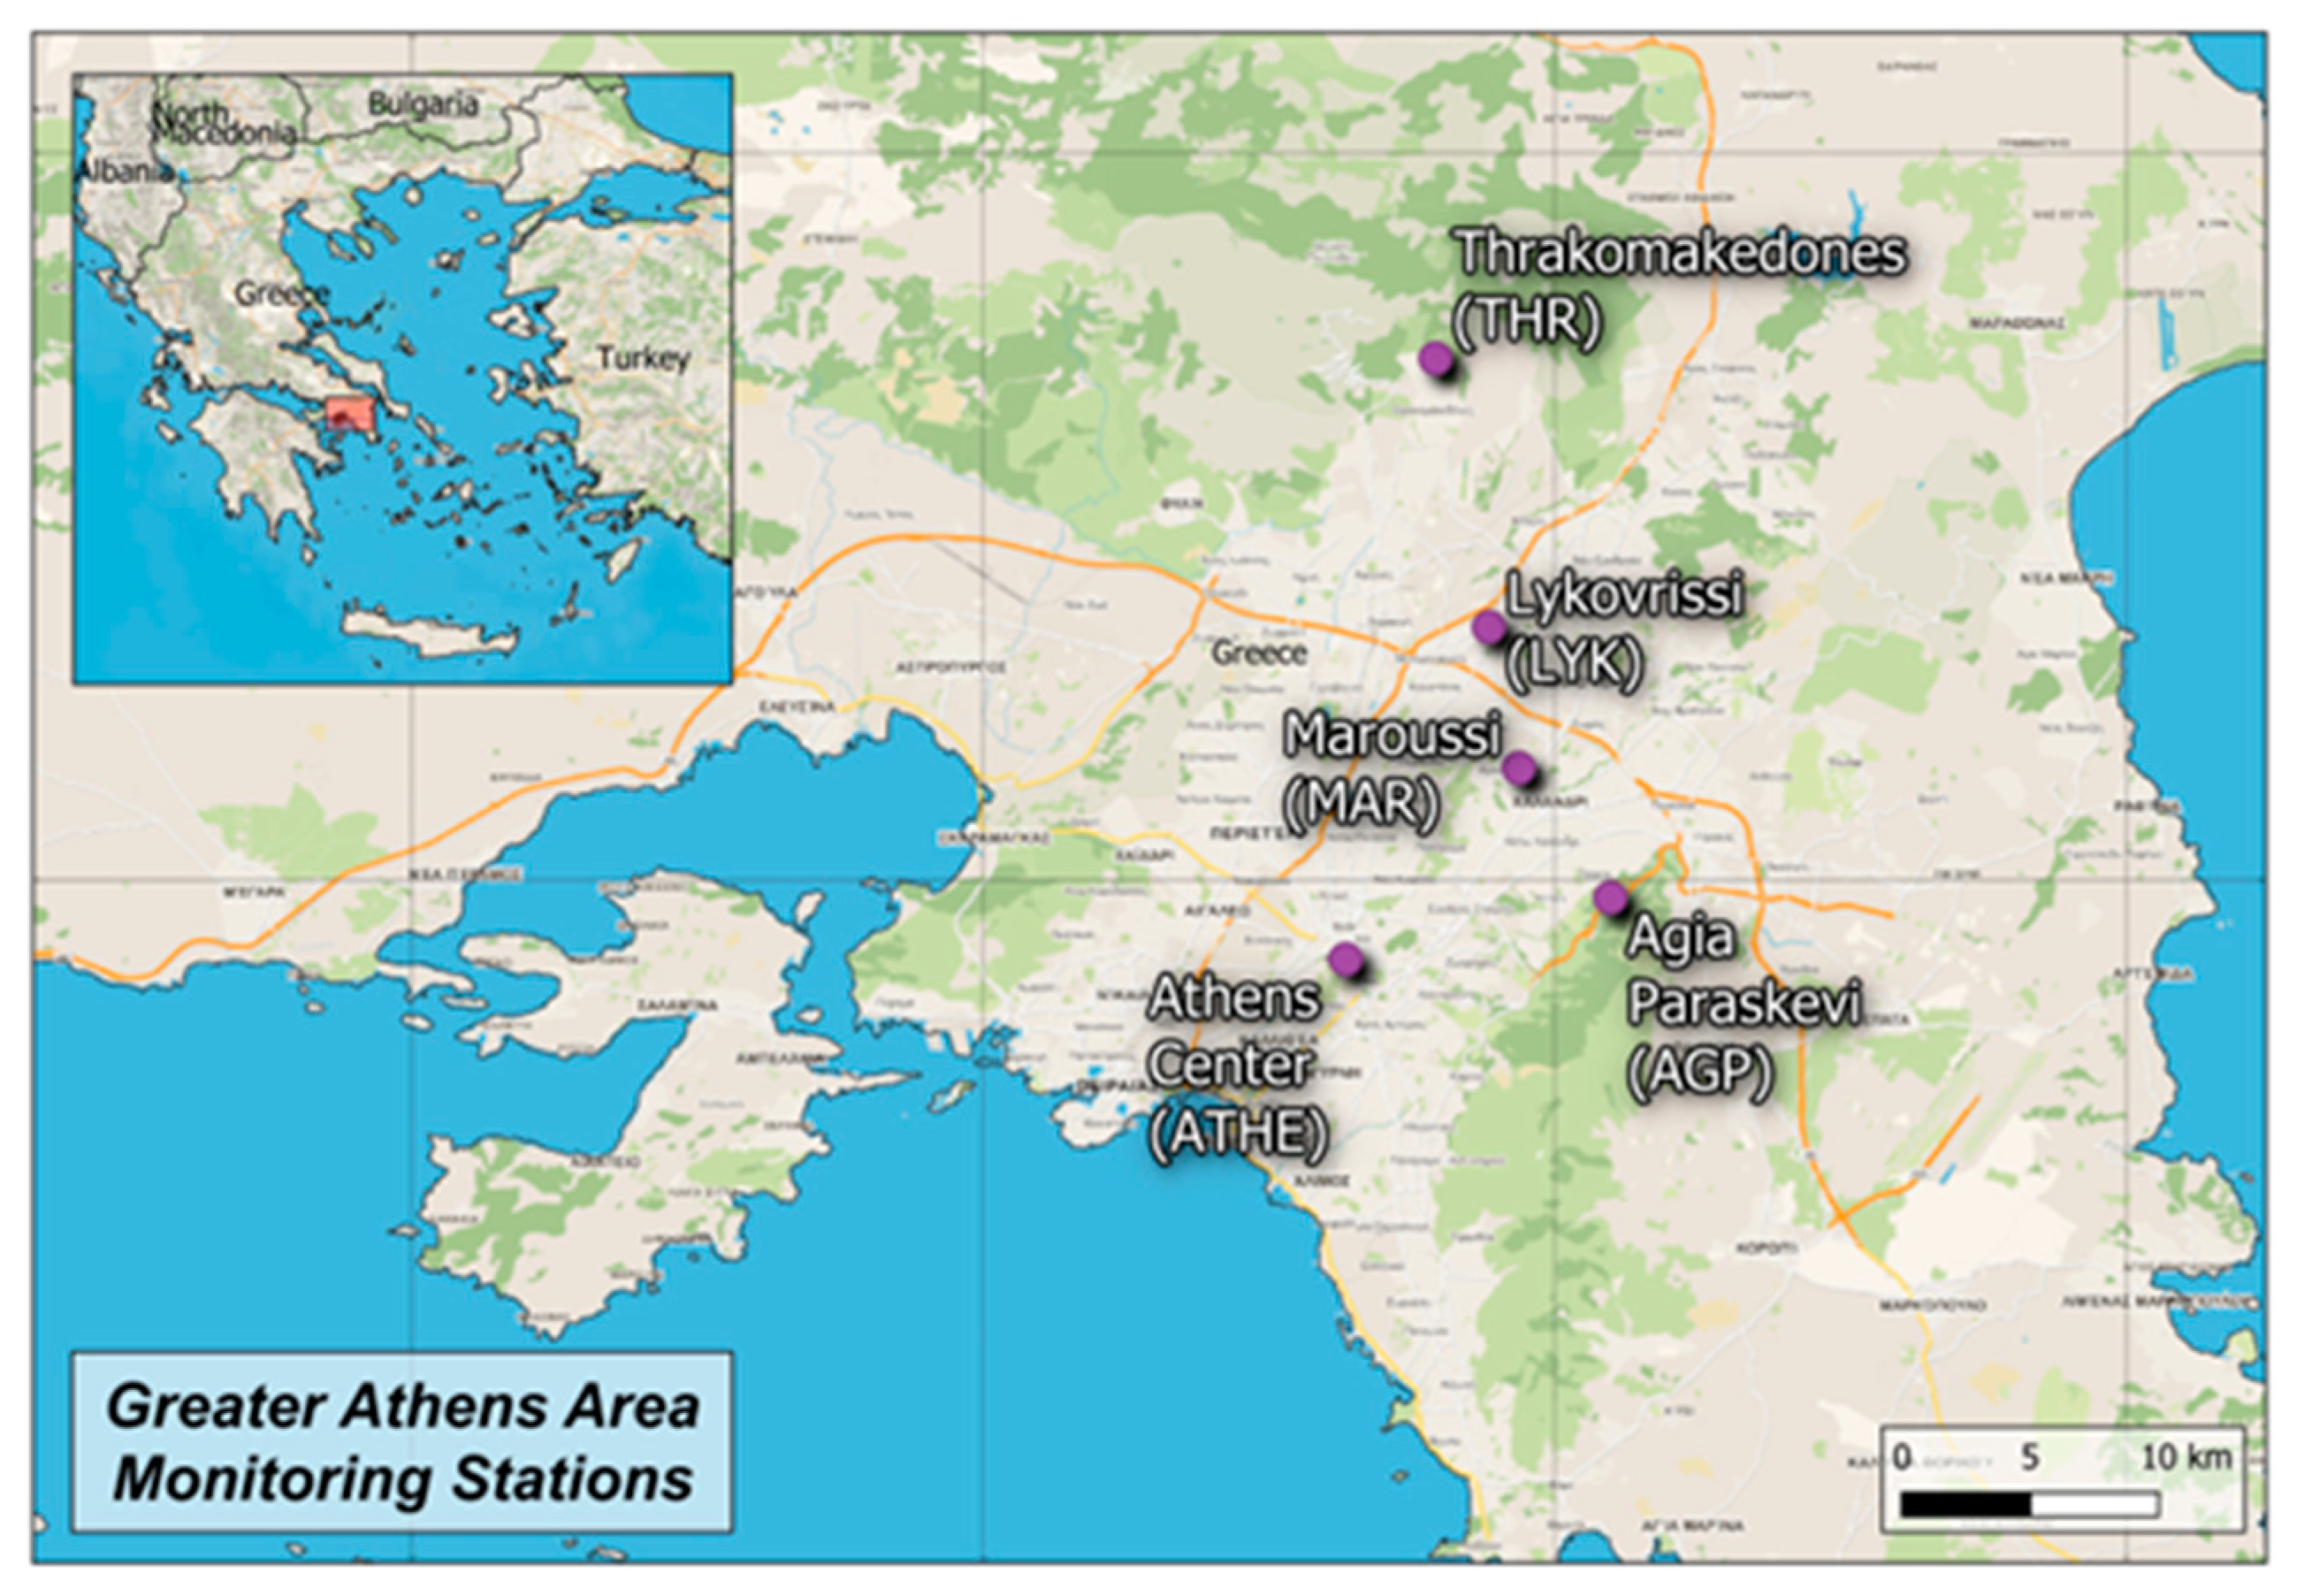
Figure 1. Map with the location of PM10 and O3 monitoring stations (generated by utilizing Quantum GIS with background map data from F4_map).
Eesp 35 00024 g001
Figure 2. AirQ+ mortality cases per 100,000 people from the effects of PM10, O3 cumulatively at all data stations in the Greater Athens Area (2001–2019).
Eesp 35 00024 g002
Figure 3. Economic Burden per 100,000 people from the effects of PM10, O3 cumulatively at all data stations in the Greater Athens Area (2001–2019).
Eesp 35 00024 g003
Table 1. The characteristics of the air pollution monitoring stations within the GAA.
AristotelousAthinasAgia ParaskeviMaroussiThrakomakedonesLykovrissi
AbbreviationARIATHAGPMARTHRLYK
Area Size Km2393981344
Longitude23.72761723.72684523.81942123.78737223.75819523.788986
Latitude37.98806637.97820437.99511038.03083738.14352138.067793
CharacterizationUTUTSBUBSBSB
Population (People)664,000664,00060,00073,000620010,000
O3 Data Completenessn/a89.4%94.8%91.3%87.2%95.9%
Pm10 Data Completeness 87.10%n/a90.02%81.20%83.36%90.21%
Disclaimer/Publisher’s Note: The statements, opinions and data contained in all publications are solely those of the individual author(s) and contributor(s) and not of MDPI and/or the editor(s). MDPI and/or the editor(s) disclaim responsibility for any injury to people or property resulting from any ideas, methods, instructions or products referred to in the content.