Abstract
Our study focuses on investigating the present-day influence of wildfires on the global atmosphere. To achieve this, we utilized four observational biomass burning (BB) emissions datasets for present-day simulations employing the TM5 Chemical Transport Model (CTM). To assess how different emissions estimates influence the model’s ability to simulate the atmosphere, we compared the following datasets over the period 2003–2015: GFED4s, GFASv1.2, FEERv1.0-G1.2 and QFEDv2.6r1. Our study aims to investigate the role of wildfires in affecting important trace gases and aerosols. Their impact on atmospheric composition and their interactions with solar radiation affect the radiative balance at the Earth’s surface and, consequently, temperature trends in the troposphere.
1. Introduction
Biomass burning (BB) is a significant source of trace gases such as carbon dioxide (CO2), carbon monoxide (CO) and nitrogen oxides (NOx), along with carbonaceous aerosols as organic carbon (OC) and black carbon (BC). These emissions are important drivers of atmospheric composition changes, as they interact with solar radiation. These interactions affect the radiative balance of the Earth system [1] and, consequently, temperature trends in the troposphere as well as the hydrological cycle [2].
Carbon monoxide (CO) is a reactive trace gas and a major pollutant. It is considered an important ozone precursor and has high volume mixing ratios. With its lifetime ranging from weeks to months, CO is a tracer for air pollution transport [3]. Additionally, CO is a major sink for hydroxyl radicals (OH). In the troposphere when CO is oxidized by OH, it produces CO2, while its reactions are affecting indirectly the formation and lifetime of other atmospheric constituents and greenhouse gases [4].
Black carbon (BC) is formed during the incomplete combustion of carbon fuels. It is linked to the increase of atmospheric and surface temperature, as it is a strongly absorbing substance in the visible wavelength of radiation [5]. Moreover, its climate impacts also involve modifications of snow and sea ice albedo. When BC particles are deposited on ice, they accelerate the glacier melting rate [6]. Other effects can be found in precipitation, as BC affects cloud formation by altering the atmospheric temperature inside, below or above them [7].
2. Biomass Burning Emissions Datasets
Four BB emissions datasets were employed in this study. General information about each inventory is given below.
The BB emissions inventories that we used are:
- Global Fire Emissions Database (GFED4s),
- Global Fire Assimilation System (GFASv1.2),
- Fire Energetics Emissions Research (FEERv1.0-G1.2), and
- Quick Fire Emission Dataset (QFEDv2.6r1).
2.1. GFED4s
The GFED4s dataset employs a bottom-up approach, utilizing observed burned area and active fire data to estimate emissions [8]. It includes a methodology for estimating burned area from “small fires” based on MODIS active fire detections [9]. Moreover, fuel consumption is parameterized by field measurements in different biomes [10]. Compared to previous versions, it applies different emission factors for temperate and boreal ecosystems.
2.2. GFASv1.2
The GFASv1.2 dataset [11] employs a top-down approach, assimilating Fire Radiative Power (FRP) to calculate BB emissions. FRP is a measure of energy released throughout the combustion process, thus, is a measure of combusted vegetation [12] remotely sensed by satellites. It includes a method for filtering spurious FRP observations, and it corrects gaps in the observations caused by cloud cover. GFAS makes use of biome-specific conversion factors calculated from linear regressions between the FRP of GFAS and the dry matter combustion rate of GFEDv3.1 [11].
2.3. FEERv1.0-G1.2
The FEERv1.0-G1.2 [13] dataset also employs a top-down approach, using MODIS FRP to derive BB emission rates. The gridded emission coefficient (Ce) product is used to calculate total particulate matter (TPM) on a regional scale, based on both FRP and Aerosol Optical Thickness (AOT) [13].
2.4. QFEDv2.6r1
The QFEDv2.6r1 dataset [14] emissions are based on the FRP approach and feature a sophisticated treatment of cloud-obscured land areas, employing a cloud correction method that was developed in the GFAS dataset [14].
3. Datasets Analysis
To evaluate and compare the four BB emission datasets, we created global maps illustrating the spatial distribution of black carbon (Figure 1), and carbon monoxide (Figure 2), as two example species (one aerosol and one gas), over the period 2003 to 2015. This period was chosen to align with the temporal range of all datasets. The analysis indicates consistent spatial patterns in BB hotspots although with different magnitudes.
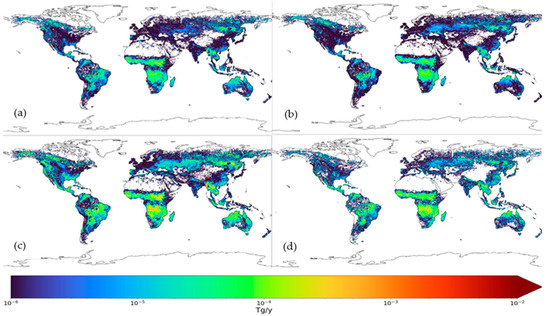
Figure 1.
Spatial distribution of annual mean black carbon (BC) biomass burning emissions (in Tg/yr) for the period 2003–2015, as estimated by (a) GFASv1.2, (b) GFED4s, (c) QFEDv2.6r1, (d) FEERv1.0-G1.2.
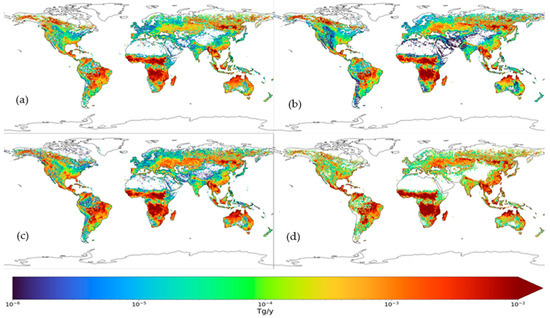
Figure 2.
Spatial distribution of annual mean carbon monoxide (CO) biomass burning emissions (in Tg/yr) for the period 2003–2015, as estimated by (a) GFAS1.2, (b) GFED4s, (c) QFEDv2.6r1, (d) FEERv1.0-G1.2.
3.1. Black Carbon
Among these datasets, GFAS, FEER, and QFED employ a top-down approach, while GFED uses a bottom-up approach. It is important to note that the FEER and QFED datasets utilize MODIS aerosol optical depth (AOD) to determine scaling factors for emissions of black carbon (BC), organic carbon (OC), and particulate matter less than 2.5 μm in diameter (PM2.5), which includes both BC and OC. More specifically, QFED applies different global scaling constants for BC, OC, and PM2.5, while FEER employs relationships between fire radiative power (FRP) and smoke AOD to derive regional total particulate matter (TPM) emissions. In contrast, GFAS recommends a global scaling factor of 3.4 and GFED does not impose any AOD constraints [15].
In all four BB emission datasets, we observe pronounced BC emissions in the regions of Africa, South America, Australia, Boreal Asia, and Southeast Asia. The spatial distribution patterns of BC emissions are similar between the GFED and GFAS datasets, with GFED showing the lowest BC emissions overall. BC emissions in QFED and FEER are higher compared to GFED and GFAS, capturing elevated emissions primarily in South America and Africa, with QFED recording the highest emissions globally. Another significant difference in QFED is its ability to capture elevated BC values at high latitudes, such as in boreal regions of North America and boreal Asia, as well as in the southern and southeastern regions of North America.
3.2. Carbon Monoxide
In all four BB emission inventories, we observe higher CO emissions in the regions of Africa, South America, Boreal North America, Europe, Australia, Central Asia, Boreal Asia, and Southeast Asia. Most of the regions that capture high CO emissions are consistent with the spatial distribution of BC and most of them are BB hotspots. For instance, high CO emissions captured in Africa reflect its status as a continent with one of the largest shares of burned area due to seasonal, savanna and agricultural fires. In boreal Asia and Southeast Asia, CO is primarily related to peat fires in that area [16].
Similar patterns of spatial distribution of CO are observed in every dataset although FEER captures significantly higher emissions globally, followed by QFED. In this case, QFED, GFAS and GFED capture values that are closer to each other, with GFED exhibiting the lowest emissions overall.
3.3. Regional Variations
We further show the year-to-year variations in emissions in the different datasets for two example fire-prone regions, with distinct characteristics, i.e., the Mediterranean and Indonesia.
3.3.1. Indonesia
In the case of Indonesia (Figure 3), QFED and FEER exhibit considerable agreement in the magnitude of BC values that are captured. A notable example of the agreement among FEER, QFED and GFED inventories is their consistent capture of emission spikes during El Niño years (2004, 2006, 2009, 2015). These spikes are driven by severe fire seasons in Indonesia [17], where extreme drought is associated with the El Niño–Southern Oscillation (ENSO). Even though GFAS shows lower values and smaller interannual variability compared to the abovementioned inventories, it follows the same patterns of increase or decrease of emissions with time.
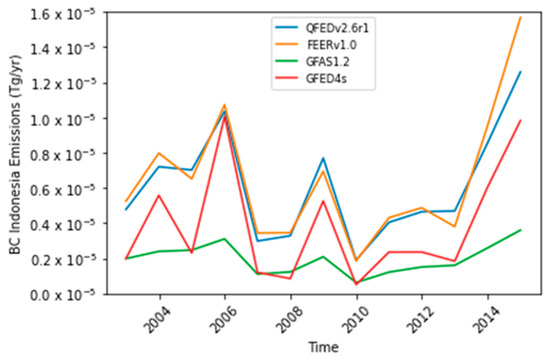
Figure 3.
BC emissions in Indonesia over the period 2003–2015, across the four datasets.
3.3.2. Mediterranean Region
In the Mediterranean region (Figure 4), QFED records significantly higher BC emissions by a factor 2–3.5 compared to the other inventories. FEER exhibits the second highest values, consistent with what is recorded in the spatial distribution maps of BC. In this case, GFAS and GFED capture similar values in the Mediterranean, while they also feature smaller year-to-year variations than the other two datasets.
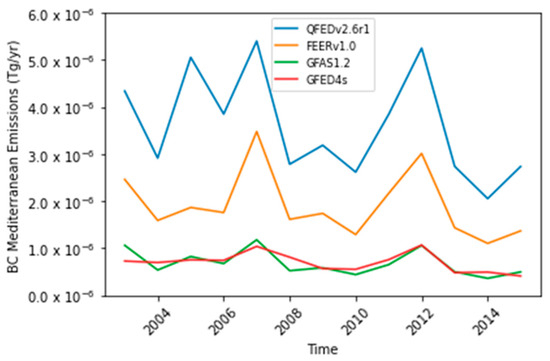
Figure 4.
BC emissions in the Mediterranean over the period 2003–2015, across all datasets.
The Mediterranean ecosystems are fire-prone, recording severe wildfires in recent decades. All captured spikes are associated with major wildfire events in the region. Discrepancies in the datasets can be observed particularly in 2007, when extreme wildfire events occurred in Greece and Italy [18]. These events do not seem to be represented with the same intensity in every dataset. More specifically, QFED and FEER show a distinct spike in 2007, while the increases in GFED and GFAS are less drastic. Overall, QFED, which follows a top-down approach with the addition of the abovementioned cloud correction approach, shows both the highest emissions and the largest interannual variability, compared to the other datasets.
4. Discussion
Analyzing the four BB emissions datasets over the period 2003–2015 we observe differences regarding their magnitude and interannual variations. More specifically, QFED2.6 and FEER1.0 consistently record higher emissions compared to the other two datasets, as seen at both global and regional scales. A possible reason for this outcome is that both datasets have MODIS AOD constraints, although in different ways.
Even though GFAS1.2 estimates emissions with an FRP-based approach, as do FEER1.0 and QFED2.6, it is tuned to GFED3.1 due to its use of biome-specific conversion factors from FRP and the dry matter combustion rate derived from GFED3.1. This possibly explains the similar magnitude of values observed in GFAS1.2 and GFED4s.
Sources of uncertainties for all datasets must be considered. For the FRP-based approaches, gas flares could be mistakenly identified as BB sources leading to overestimations. Moreover, BB emission estimations depend on polar-orbiting satellite measurements which lead to sampling gaps of active fires and the extent of burned area. Other uncertainties are related to emission factors and the contributions of emissions of different biome types [19].
Author Contributions
Conceptualization, A.V.; methodology, S.M., A.V., K.P., C.V., R.-N.M., M.P.P. and K.S.; software, K.P. and C.V.; validation, A.V., K.P. and C.V.; formal analysis, K.P. and C.V.; investigation, K.P. and C.V.; resources, K.P. and C.V.; data curation, K.P. and C.V.; writing—original draft preparation, K.P.; writing—review and editing, A.V.; visualization, C.V.; supervision, A.V.; project administration, A.V.; funding acquisition, A.V. All authors have read and agreed to the published version of the manuscript.
Funding
The present research was funded through the Hellenic Foundation for Research and Innovation (grant no. 15155) via project REINFORCE (impRovEments in the simulation of aerosol-clImate liNkages in earth system models: From glObal to Regional sCalEs) and the AXA Research Fund (project “AXA Chair in Wildfires and Climate”, CPO00163217).
Institutional Review Board Statement
Not applicable.
Informed Consent Statement
Not applicable.
Data Availability Statement
The GFED4s dataset can be accessed through the link: https://www.globalfiredata.org/related.html (accessed on 5 September 2025). The GFAS1.2 emissions dataset is available at: https://ads.atmosphere.copernicus.eu/datasets/cams-global-fire-emissions-gfas?tab=overview (accessed on 5 September 2025). The FEER1.0 dataset is available athttps://science.gsfc.nasa.gov/feer/data/emissions/ (accessed on 5 September 2025). The QFED2.4 is available at: https://portal.nccs.nasa.gov/datashare/iesa/aerosol/emissions/QFED/ (accessed on 5 September 2025).
Conflicts of Interest
The authors declare no conflict of interest.
References
- Kuniyal, J.C.; Guleria, R.P. The current state of aerosol-radiation interactions: A mini review. J. Aerosol Sci. 2019, 130, 45–54. [Google Scholar] [CrossRef]
- Ramanathan, V.; Callis, L.; Cess, R.; Hansen, J.; Isaksen, I.; Kuhn, W.; Lacis, A.; Luther, F.; Mahlman, J.; Reck, R.; et al. Climate-chemical interactions and effects of changing atmospheric trace gases. Rev. Geophys. 1987, 25, 1441–1482. [Google Scholar] [CrossRef]
- Chen, Y.; Ma, Q.; Lin, W.; Xu, X.; Yao, J.; Gao, W. Measurement report: Long-term variations in carbon monoxide at a background station in China’s Yangtze River Delta region. Atmos. Chem. Phys. 2020, 20, 15969–15982. [Google Scholar] [CrossRef]
- Faïn, X.; Rhodes, R.H.; Philip, P.; Petrenko, V.V.; Fourteau, K.; Chellman, N.; Crosier, E.; McConnell, J.R.; Brook, E.J.; Blunier, H.; et al. Northern Hemisphere atmospheric history of carbon monoxide since preindustrial times reconstructed from multiple Greenland ice cores. Clim. Past Discuss. 2021, 18, 631–647. [Google Scholar] [CrossRef]
- Núñez, X.C.; Ruiz, L.V.; García, C.G. Black carbon and organic carbon emissions from wildfires in Mexico. Atmósfera 2014, 27, 165–172. [Google Scholar] [CrossRef]
- Evangeliou, N.; Kylling, A.; Eckhardt, S.; Myroniuk, V.; Stebel, K.; Paugam, R.; Zibtsev, S.; Stohl, A. Open fires in Greenland in summer 2017: Transport, deposition and radiative effects of BC, OC and BrC emissions. Atmos. Chem. Phys. 2019, 19, 1393–1411. [Google Scholar] [CrossRef]
- Bond, T.C.; Doherty, S.J.; Fahey, D.W.; Forster, P.M.; Berntsen, T.; DeAngelo, B.J.; Flanner, M.G.; Ghan, S.; Kärcher, B.; Koch, D.; et al. Bounding the role of black carbon in the climate system: A scientific assessment. J. Geophys. Res. Atmos. 2013, 118, 5380–5552. [Google Scholar] [CrossRef]
- Van Der Werf, G.R.; Randerson, J.T.; Giglio, L.; Van Leeuwen, T.T.; Chen, Y.; Rogers, B.M.; Mu, M.; van Marle, M.J.E.; Morton, D.C.; Collatz, G.J.; et al. Global fire emissions estimates during 1997–2016. Earth Syst. Sci. Data 2017, 9, 697–720. [Google Scholar] [CrossRef]
- Zhang, L.; Henze, D.K.; Grell, G.A.; Torres, O.; Jethva, H.; Lamsal, L.N. What factors control the trend of increasing AAOD over the United States in the last decade? J. Geophys. Res. Atmos. 2017, 122, 1797–1810. [Google Scholar] [CrossRef]
- van Leeuwen, T.T.; Van Der Werf, G.R.; Hoffmann, A.A.; Detmers, R.G.; Rücker, G.; French, N.H.; Archibald, S.; Carvalho, J.A., Jr.; Cook, G.D.; de Groot, W.J.; et al. Biomass burning fuel consumption rates: A field measurement database. Biogeosciences 2014, 11, 7305–7329. [Google Scholar] [CrossRef]
- Kaiser, J.W.; Heil, A.; Andreae, M.O.; Benedetti, A.; Chubarova, N.; Jones, L.; Morcrette, J.-J.; Razinger, M.; Schultz, M.G.; Suttie, M.; et al. Biomass burning emissions estimated with a global fire assimilation system based on observed fire radiative power. Biogeosciences 2012, 9, 527–554. [Google Scholar] [CrossRef]
- Wooster, M.J.; Roberts, G.; Perry, G.L.W.; Kaufman, Y.J. Retrieval of biomass combustion rates and totals from fire radiative power observations: FRP derivation and calibration relationships between biomass consumption and fire radiative energy release. J. Geophys. Res. Atmos. 2005, 110. [Google Scholar] [CrossRef]
- Ichoku, C.; Ellison, L. Global top-down smoke-aerosol emissions estimation using satellite fire radiative power measurements. Atmos. Chem. Phys. 2014, 14, 6643–6667. [Google Scholar] [CrossRef]
- NTRS-NASA Technical Reports Server. The Quick Fire Emissions Dataset (QFED): Documentation of Versions 2.1, 2.2 and 2.4: Technical Report Series on Global Modeling and Data Assimilation, Volume 38. Available online: https://ntrs.nasa.gov/citations/20180005253 (accessed on 5 September 2025).
- Carter, T.S.; Heald, C.L.; Jimenez, J.L.; Campuzano-Jost, P.; Kondo, Y.; Moteki, N.; Schwarz, J.P.; Wiedinmyer, C.; Darmenov, A.S.; da Silva, A.M.; et al. How emissions uncertainty influences the distribution and radiative impacts of smoke from fires in North America. Atmos. Chem. Phys. Discuss. 2019, 20, 2073–2097. [Google Scholar] [CrossRef]
- Uda, S.K.; Hein, L.; Atmoko, D. Assessing the health impacts of peatland fires: A case study for Central Kalimantan, Indonesia. Environ. Sci. Pollut. Res. 2019, 26, 31315–31327. [Google Scholar] [CrossRef] [PubMed]
- Pan, X.; Chin, M.; Ichoku, C.M.; Field, R.D. Connecting Indonesian fires and drought with the type of El Niño and phase of the Indian Ocean dipole during 1979–2016. J. Geophys. Res. Atmos. 2018, 123, 7974–7988. [Google Scholar] [CrossRef]
- Amraoui, M.; Liberato, M.L.; Calado, T.J.; DaCamara, C.C.; Coelho, L.P.; Trigo, R.M.; Gouveia, C.M. Fire activity over Mediterranean Europe based on information from Meteosat-8. For. Ecol. Manag. 2013, 294, 62–75. [Google Scholar] [CrossRef]
- Pan, X.; Ichoku, C.; Chin, M.; Bian, H.; Darmenov, A.; Colarco, P.; Ellison, L.; Kucsera, T.; da Silva, A.; Wang, J.; et al. Six global biomass burning emission datasets: Intercomparison and application in one global aerosol model. Atmos. Chem. Phys. 2020, 20, 969–994. [Google Scholar] [CrossRef]
Disclaimer/Publisher’s Note: The statements, opinions and data contained in all publications are solely those of the individual author(s) and contributor(s) and not of MDPI and/or the editor(s). MDPI and/or the editor(s) disclaim responsibility for any injury to people or property resulting from any ideas, methods, instructions or products referred to in the content. |
© 2025 by the authors. Licensee MDPI, Basel, Switzerland. This article is an open access article distributed under the terms and conditions of the Creative Commons Attribution (CC BY) license (https://creativecommons.org/licenses/by/4.0/).