Proceeding Paper

Reconstructing Saharan Dust–Cloud Scenes with WRF-L: Initial Evaluation of Aerosol-Aware Ice Nucleation Schemes †

1
National Observatory of Athens, IAASARS, 15236 Athens, Greece
2
Geography Department, Harokopio University, 17671 Athens, Greece
3
NASA Langley Research Center, Hampton, VA 23681, USA
*
Author to whom correspondence should be addressed.
Presented at the 17th International Conference on Meteorology, Climatology, and Atmospheric Physics—COMECAP 2025, Nicosia, Cyprus, 29 September–1 October 2025.
Environ. Earth Sci. Proc. 2025, 35(1), 21; https://doi.org/10.3390/eesp2025035021
Published: 11 September 2025

Abstract

This study explores the role of mineral dust in ice nucleation using WRF-L model simulations during the ASKOS-ESA and CPEX-CV campaigns (Cabo Verde, 2022). Numerical experiments are carried out to examine dust impacts and secondary ice production via the Hallett–Mossop process. The results show variability in ice and liquid water paths, with the modeled aerosol optical depth aligning well with AERONET data. A case study of 15 September 2022 reveals notable cloud structure differences in aerosol-aware simulations. These findings can inform future LES simulations with assimilated aerosol fields and radar comparisons, emphasizing the importance of accurately representing aerosol–cloud interactions in atmospheric models.

1. Introduction

Mineral dust aerosols play a critical role in cloud microphysics, particularly by acting as ice-nucleating particles (INPs) in mixed-phase and cirrus clouds [1]. Their presence can influence cloud lifetime, radiative properties, and precipitation processes, making them an important component of weather and climate systems. Despite their significance, the representation of dust-related ice nucleation in atmospheric models remains uncertain, partly due to limited observational constraints and simplified parameterizations [2].
In this study, we use the WRF-L model, a dust-sensitive version of WRF-Chem [3], to simulate cloud scenes observed during the ASKOS-ESA and CPEX-CV campaigns in Cabo Verde (2022) [4,5]. A new aerosol-aware ice nucleation parameterization [6] is implemented and evaluated through mesoscale simulations, aiming to better capture the impact of Saharan dust on cloud formation and evolution.

2. Methods

We replaced the temperature-dependent ice nucleation process in the Morrison microphysics scheme [7,8] with a new aerosol-aware parameterization based on the relationship proposed in [6]. The Morrison scheme also includes secondary ice production through the Hallet and Mossop process [9]. Employing the modified Morison scheme, we conducted initial mesoscale simulations (15 km × 15 km resolution) with the WRF-L model [3]. The model domain was appropriately defined in order to simulate the Saharan dust emission and transport towards the Atlantic Ocean, covering the mineral dust sources of Sahara and the central Atlantic Ocean.
Meteorological forcing is provided by ECMWF-IFS model reanalysis (ERA5) datasets, updated every 6 h. The complete configuration options for the run are listed in Table 1.
These simulations were designed to assess (a) the impact of the new ice nucleation parameterization and (b) the effect of secondary ice production (SIP), incorporating the new aerosol-aware scheme for primary ice nucleation. A summary of these tests is presented in Table 2.
The primary goal of these simulations was to identify cases where notable differences arise from the inclusion or exclusion of specific physical processes. For these purposes, the liquid water path and the ice water path from the model were calculated as the sum of the integral of the concentration of all the different liquid hydrometeors (cloud droplets and rain) or all the ice hydrometeors (snow, ice, and graupel), respectively. The simulations covered the period of the CPEX-CV campaign, held during September 2022, a sub-period of the ASKOS-ESA campaign, during which multiple NASA DC-8 aircraft flights took place.

3. Results and Discussion

3.1. Simulated Aerosol Field

To examine the impact of the indirect aerosol effect in the simulation of a cloud scene by WRF-L, it is important to first accurately simulate the aerosol fields within the domain. In our simulations, the AOD is adequately represented, as shown in Figure 1, except for some days in late August, when the model overpredicts dust.

3.2. Simulated LWP and IWP

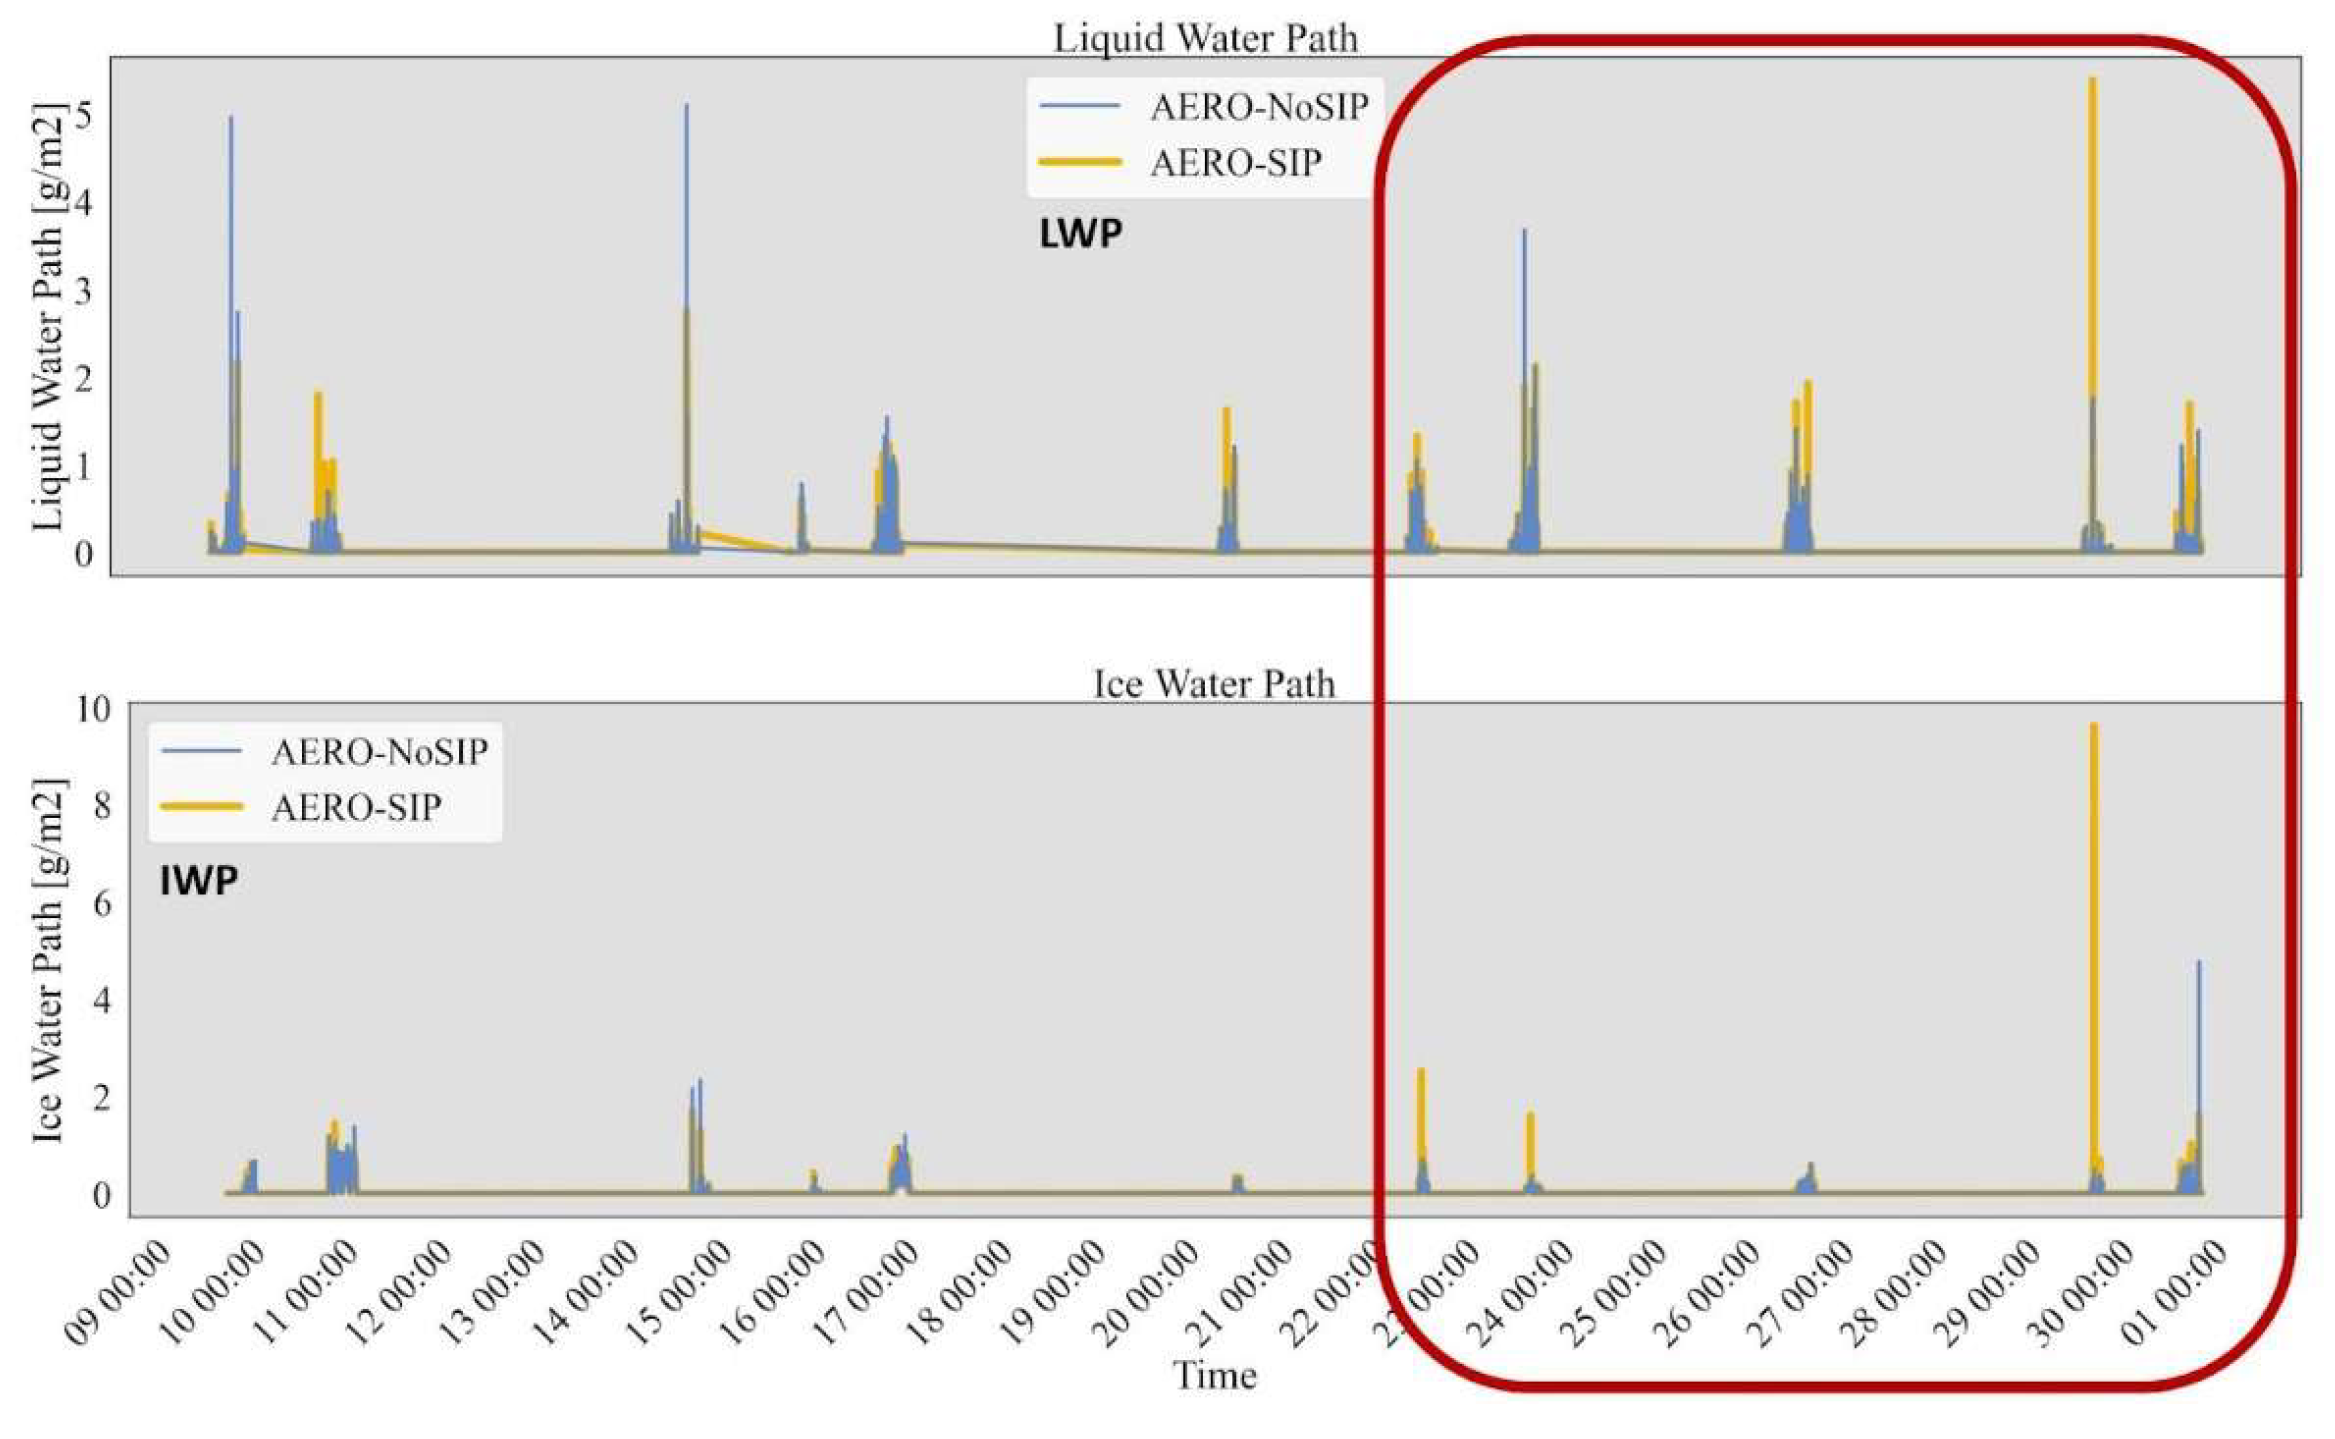
To identify cases of interest where significant differences between model simulations occur, we analyzed the time series of the simulated LWP and IWP, as shown in Figure 2 and Figure 3. Examining the differences in the simulation where we applied either the aerosol-aware scheme or the temperature-aware scheme for primary ice formation in WRF-L (Figure 2), we found three days where the simulated IWP differed significantly (14, 15, and 30 September 2022) and six days where the LWP differed significantly (9, 10, 14, 15, 16, and 30 September 2022). For the experiments shown in Figure 3 (i.e., where the dust-aware parameterization is on, and the secondary ice production through the Hallet and Mossop process is on/off), we found 3 days where the IWP differed significantly (22, 23, and 29 September 2022) and seven days where the LWP differed (9, 10, 14, 20, 26, 29, and 30 September 2022).

3.3. Simulated Cloud Scenes Against Aircraft Observations

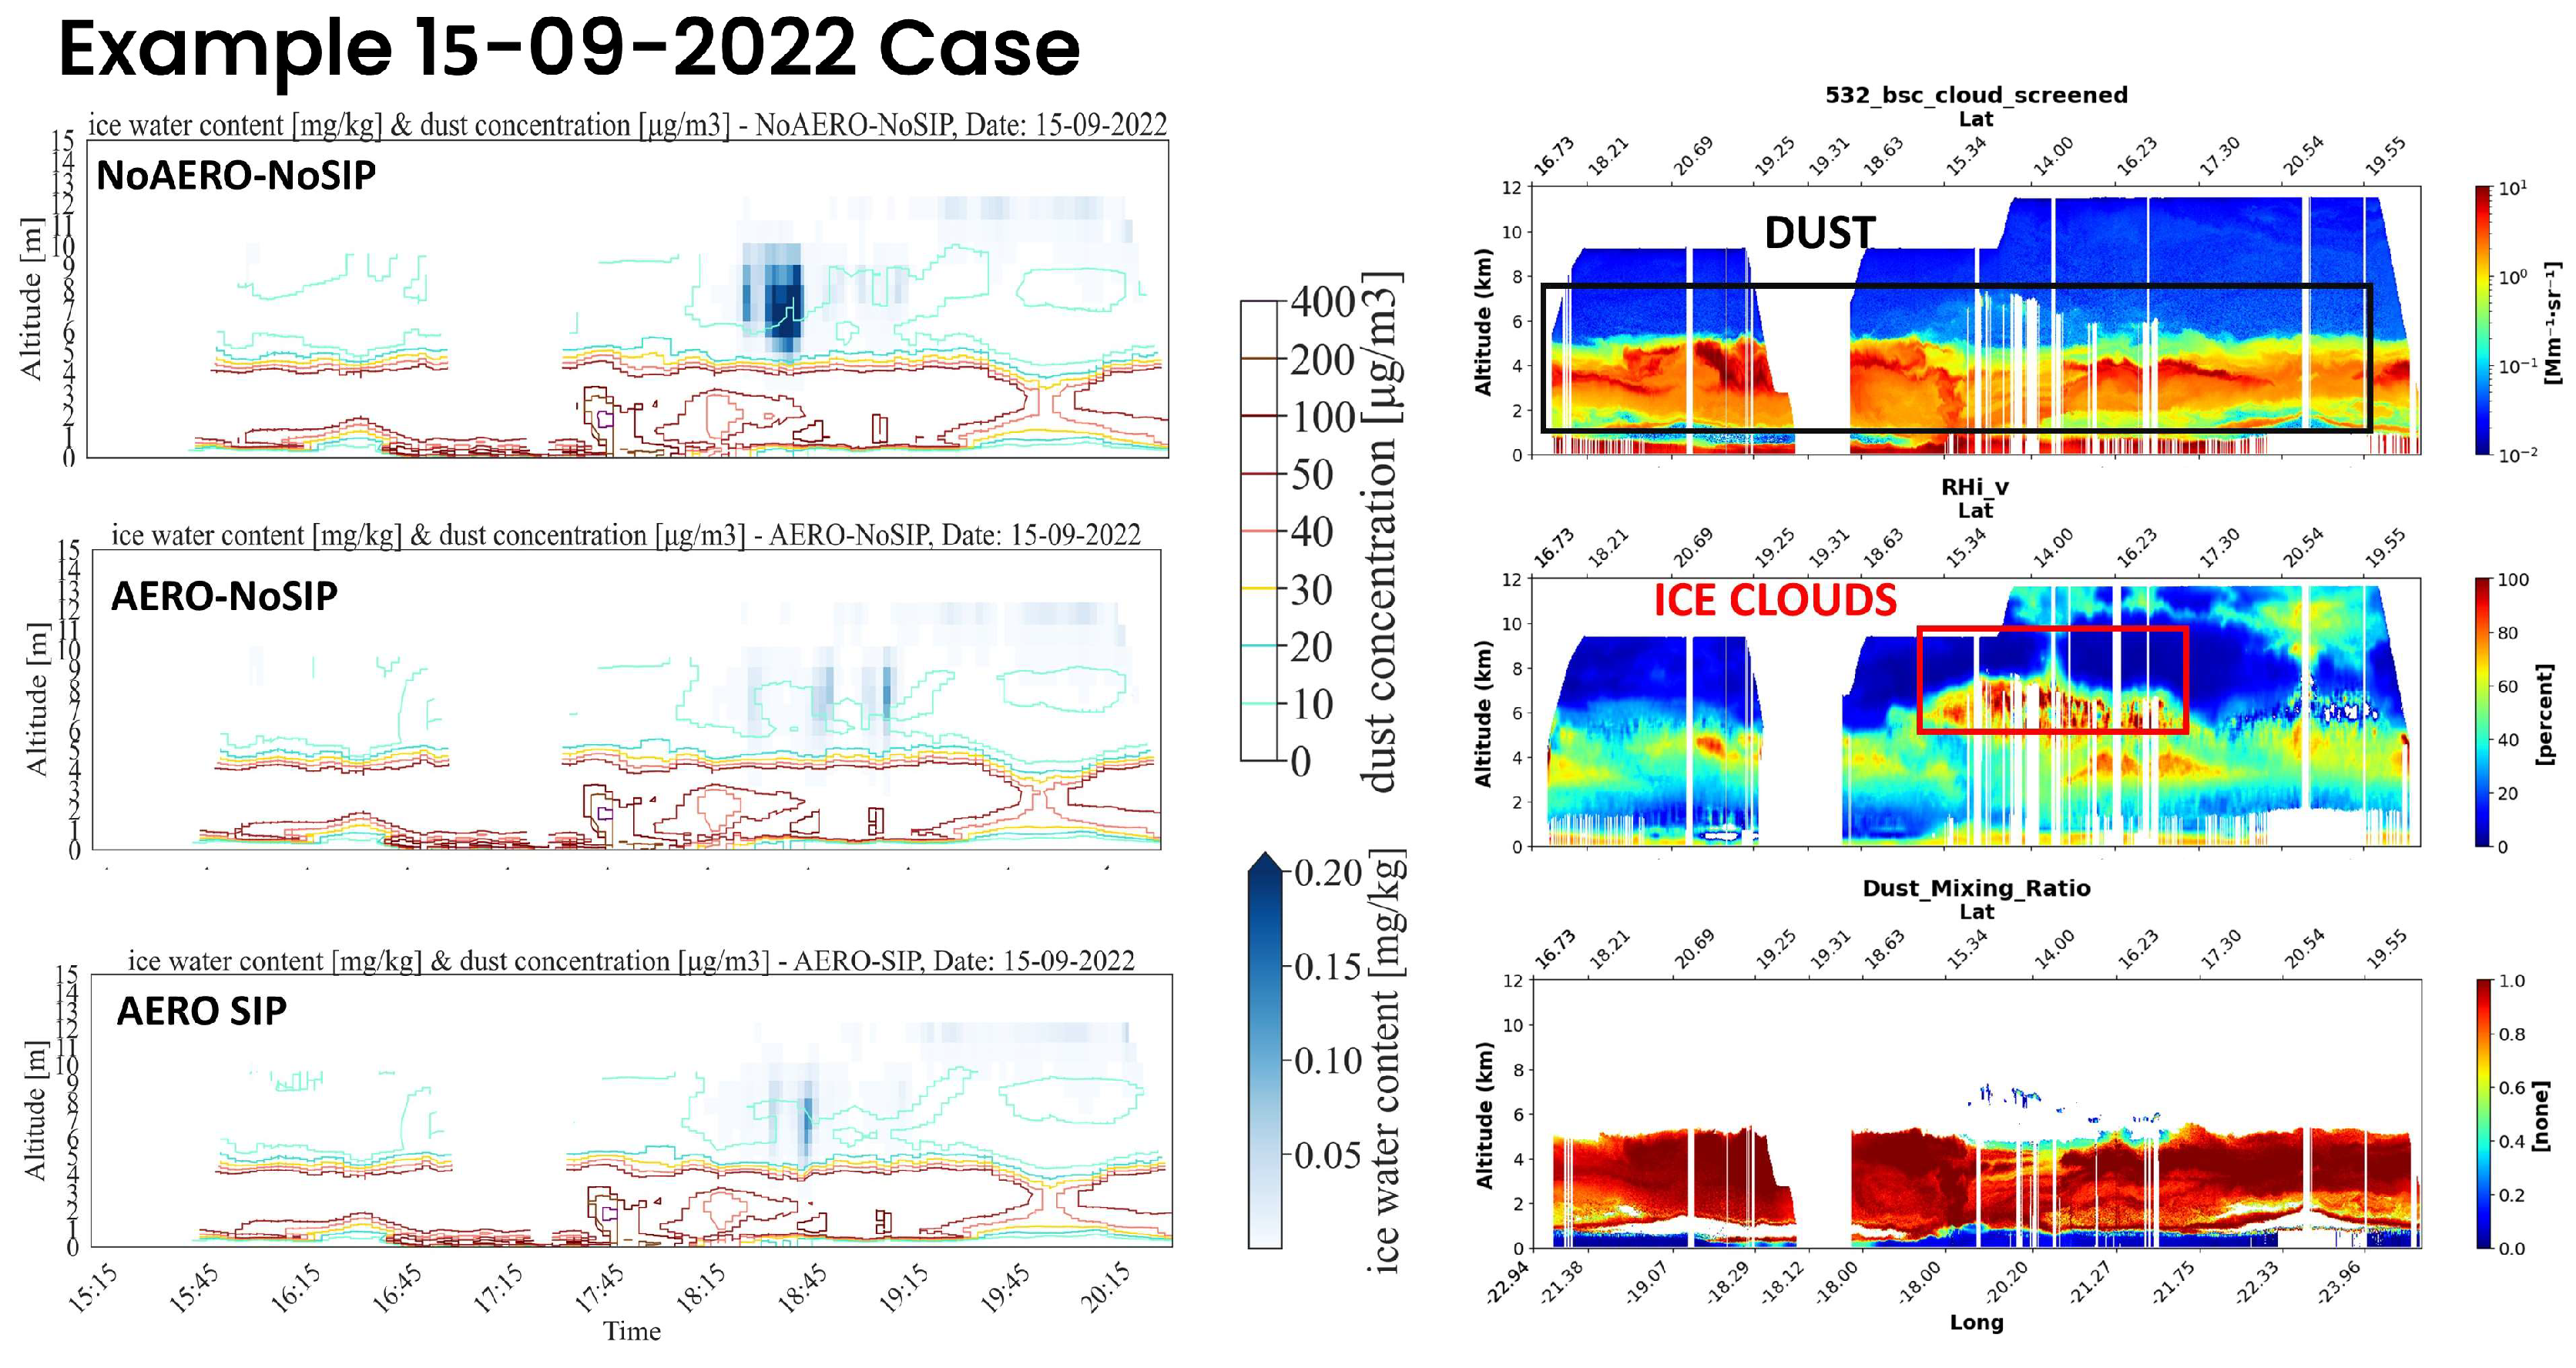
An example of these days is presented in Figure 4. In the left column of the figure, the simulated cold cloud (represented by blue contours) and dust field (illustrated with colored contour lines) from different model experiments (NoAERO-NoSIP, AERO-NoSIP, and AERO-SIP) collocated to the flight of 15-09-2022 are depicted. The right column depicts the High-Altitude Lidar Observatory (HALO) observations from the NASA DC-8 of cloud screened, aerosol volume backscatter coefficient at 532 nm, relative humidity with respect to ice (using MERRA-2 reanalysis temperature fields), and dust mixing ratio for the same flight [17]. The dust layer depth is well captured within the observed altitude range (0–4.5 km). Between 5.5 and 8 km, regions with relative humidity (RH) with respect to ice greater than 100% are observed, indicating the presence of cold clouds. In all three model experiments, the cold cloud scene is reproduced. However, differences arise in the simulated IWC across the simulations. In the AERO-NoSIP and AERO-SIP cases, the cold cloud appears less dense and more fragmented than in the NoAERO-NoSIP case. This can be attributed to the fact that temperature-aware parameterization tends to overestimate ice crystal concentrations [18]. The cold clouds simulated in the AERO-NoSIP and AERO-SIP experiments consist of broken cloud structures, featuring three and two distinct cores, respectively.

4. Future Steps

Building on the initial mesoscale simulations and the implementation of the aerosol-aware ice nucleation scheme, the next phase of this work will focus on further analysis and refinement. Specifically, we plan to carry out the following:
  • Perform detailed comparisons of model outputs with available ground-based and airborne radar measurements to evaluate the accuracy of cloud and ice structure simulations. This will help validate the sensitivity of the modeled IWP and LWP to aerosol–cloud interactions.
  • Conduct large-eddy simulations (LESs) for selected days that exhibited significant differences between simulation setups in order to more accurately resolve cloud dynamics and microphysical processes influenced by mineral dust.
  • Incorporate assimilated aerosol fields into the LES framework to better constrain the representation of dust layers and improve model initializations.
  • Extend the simulations using available data from more recent campaigns.
These steps will strengthen the linkage between observed and modeled cloud structures and contribute to an improved understanding and representation of dust-driven ice nucleation in regional and global climate models.

Author Contributions

Conceptualization, E.D., E.M., and V.A.; methodology, E.D., E.M., V.A., P.K.; software, E.D.; data, E.D. and A.R.N.; validation, E.D.; investigation, E.D. and E.M.; resources, E.D. and V.A.; writing—original draft preparation, E.D.; writing—review and editing, all. All authors have read and agreed to the published version of the manuscript.

Funding

This research was funded by the Horizon Europe program under grant agreement no. 101137680 via the project CERTAINTY (Cloud-aERosol inTeractions & their impActs IN The earth sYstem) and by the PANGEA4CalVal project (grant agreement 101079201) funded by the European Union. This work is a contribution to the AIRSENSE project, which is part of the Atmosphere Science and the Horizon Europe program CiROCCO project (under grant agreement no. 101086497). The views and opinions expressed are, however, those of the author(s) only and do not necessarily reflect those of the European Union or REA. Neither the European Union nor REA can be held responsible for them.

Institutional Review Board Statement

Not applicable.

Informed Consent Statement

Not applicable.

Data Availability Statement

Data are available upon request to Eleni Drakaki (eldrakaki@noa.gr) and Eleni Marinou (elmarinou@noa.gr). HALO airborne data are openly available at https://www-air.larc.nasa.gov/cgi-bin/ArcView/cpex.2022#NEHRIR.AMIN/ (accessed 8 September2025).

Acknowledgments

This work was supported by computational time granted by the National Infrastructures for Research and Technology S.A. (GRNET S.A.) in the National HPC facility—ARIS—under project ID pr016030_thin_MIAMI. We would also like to thank the numerous developers who contributed to the free and open-source tools used for the data visualization and analysis, particularly Matplotlib [19], xarray [20], and Cartopy [21].

Conflicts of Interest

The authors declare no conflict of interest.

Abbreviations

The following abbreviations are used in this manuscript:
LWPLiquid water path
IWPIce water path
HALOHigh-Altitude Lidar Observatory

References

  1. Hoose, C.; Möhler, O. Heterogeneous Ice Nucleation on Atmospheric Aerosols: A Review of Results from Laboratory Experiments. Atmos. Chem. Phys. 2012, 12, 9817–9854. [Google Scholar] [CrossRef]
  2. Cziczo, D.J.; Froyd, K.D.; Hoose, C.; Jensen, E.J.; Diao, M.; Zondlo, M.A.; Smith, J.B.; Twohy, C.H.; Murphy, D.M. Clarifying the Dominant Sources and Mechanisms of Cirrus Cloud Formation. Science 2013, 340, 1320–1324. [Google Scholar] [CrossRef] [PubMed]
  3. Drakaki, E.; Amiridis, V.; Tsekeri, A.; Gkikas, A.; Proestakis, E.; Mallios, S.; Solomos, S.; Spyrou, C.; Marinou, E.; Ryder, C.L.; et al. Modeling Coarse and Giant Desert Dust Particles. Atmos. Chem. Phys. 2022, 22, 12727–12748. [Google Scholar] [CrossRef]
  4. Marinou, E.; Amiridis, V.; Paschou, P.; Tsikoudi, I.; Tsekeri, A.; Daskalopoulou, V.; Baars, H.; Floutsi, A.; Kouklaki, D.; Pirloaga, R.; et al. ASKOS Campaign 2021/2022: Overview of Measurements and Applications; display, 2023. In Proceedings of the EGU General Assembly 2023, Vienna, Austria, 23–28 April 2023. [Google Scholar]
  5. Nowottnick, E.P.; Rowe, A.K.; Nehrir, A.R.; Zawislak, J.A.; Piña, A.J.; McCarty, W.; Barton-Grimley, R.A.; Bedka, K.M.; Bennett, J.R.; Brammer, A.; et al. Dust, Convection, Winds, and Waves: The 2022 NASA CPEX-CV Campaign. Bull. Am. Meteorol. Soc. 2024, 105, E2097–E2125. [Google Scholar] [CrossRef]
  6. DeMott, P.J.; Prenni, A.J.; McMeeking, G.R.; Sullivan, R.C.; Petters, M.D.; Tobo, Y.; Niemand, M.; Möhler, O.; Snider, J.R.; Wang, Z.; et al. Integrating Laboratory and Field Data to Quantify the Immersion Freezing Ice Nucleation Activity of Mineral Dust Particles. Atmos. Chem. Phys. 2015, 15, 393–409. [Google Scholar] [CrossRef]
  7. Morrison, H.; Thompson, G.; Tatarskii, V. Impact of Cloud Microphysics on the Development of Trailing Stratiform Precipitation in a Simulated Squall Line: Comparison of One- and Two-Moment Schemes. Mon. Weather. Rev. 2009, 137, 991–1007. [Google Scholar] [CrossRef]
  8. Morrison, H.; Curry, J.A.; Khvorostyanov, V.I. A New Double-Moment Microphysics Parameterization for Application in Cloud and Climate Models. Part I: Description. J. Atmos. Sci. 2005, 62, 1665–1677. [Google Scholar] [CrossRef]
  9. Hallett, J.; Mossop, S.C. Production of Secondary Ice Particles during the Riming Process. Nature 1974, 249, 26–28. [Google Scholar] [CrossRef]
  10. Chen, F.; Dudhia, J. Coupling an Advanced Land Surface–Hydrology Model with the Penn State–NCAR MM5 Modeling System. Part I: Model Implementation and Sensitivity. Mon. Wea. Rev. 2001, 129, 569–585. [Google Scholar] [CrossRef]
  11. Jiménez, P.A.; Dudhia, J. Improving the Representation of Resolved and Unresolved Topographic Effects on Surface Wind in the WRF Model. JAMC 2012, 51, 300–316. [Google Scholar] [CrossRef]
  12. Iacono, M.J.; Delamere, J.S.; Mlawer, E.J.; Shephard, M.W.; Clough, S.A.; Collins, W.D. Radiative Forcing by Long-lived Greenhouse Gases: Calculations with the AER Radiative Transfer Models. J. Geophys. Res. 2008, 113, 2008JD009944. [Google Scholar] [CrossRef]
  13. Grell, G.A.; Dévényi, D. A Generalized Approach to Parameterizing Convection Combining Ensemble and Data Assimilation Techniques. Geophys. Res. Lett. 2002, 29, 38-1–38-4. [Google Scholar] [CrossRef]
  14. Nakanishi, M.; Niino, H. An Improved Mellor–Yamada Level-3 Model: Its Numerical Stability and Application to a Regional Prediction of Advection Fog. Bound.-Layer Meteorol. 2006, 119, 397–407. [Google Scholar] [CrossRef]
  15. Ginoux, P.; Chin, M.; Tegen, I.; Prospero, J.M.; Holben, B.; Dubovik, O.; Lin, S.-J. Sources and Distributions of Dust Aerosols Simulated with the GOCART Model. J. Geophys. Res. 2001, 106, 20255–20273. [Google Scholar] [CrossRef]
  16. LeGrand, S.L.; Polashenski, C.; Letcher, T.W.; Creighton, G.A.; Peckham, S.E.; Cetola, J.D. The AFWA Dust Emission Scheme for the GOCART Aerosol Model in WRF-Chem v3.8.1. Geosci. Model Dev. 2019, 12, 131–166. [Google Scholar] [CrossRef]
  17. Carroll, B.J.; Nehrir, A.R.; Kooi, S.A.; Collins, J.E.; Barton-Grimley, R.A.; Notari, A.; Harper, D.B.; Lee, J. Differential Absorption Lidar Measurements of Water Vapor by the High Altitude Lidar Observatory (HALO): Retrieval Framework and First Results. Atmos. Meas. Tech. 2022, 15, 605–626. [Google Scholar] [CrossRef]
  18. DeMott, P.J.; Prenni, A.J.; Liu, X.; Kreidenweis, S.M.; Petters, M.D.; Twohy, C.H.; Richardson, M.S.; Eidhammer, T.; Rogers, D.C. Predicting Global Atmospheric Ice Nuclei Distributions and Their Impacts on Climate. Proc. Natl. Acad. Sci. USA 2010, 107, 11217–11222. [Google Scholar] [CrossRef] [PubMed]
  19. Hunter, J.D. Matplotlib: A 2D Graphics Environment. Comput. Sci. Eng. 2007, 9, 90–95. [Google Scholar] [CrossRef]
  20. Hoyer, S.; Hamman, J. Xarray: N-D Labeled Arrays and Datasets in Python. JORS 2017, 5, 10. [Google Scholar] [CrossRef]
  21. Met Office. Cartopy: A Cartographic Python Library with a Matplotlib Interface, Cartopy. 2010. Available online: https://scitools.org.uk/cartopy (accessed on 16 September 2024).
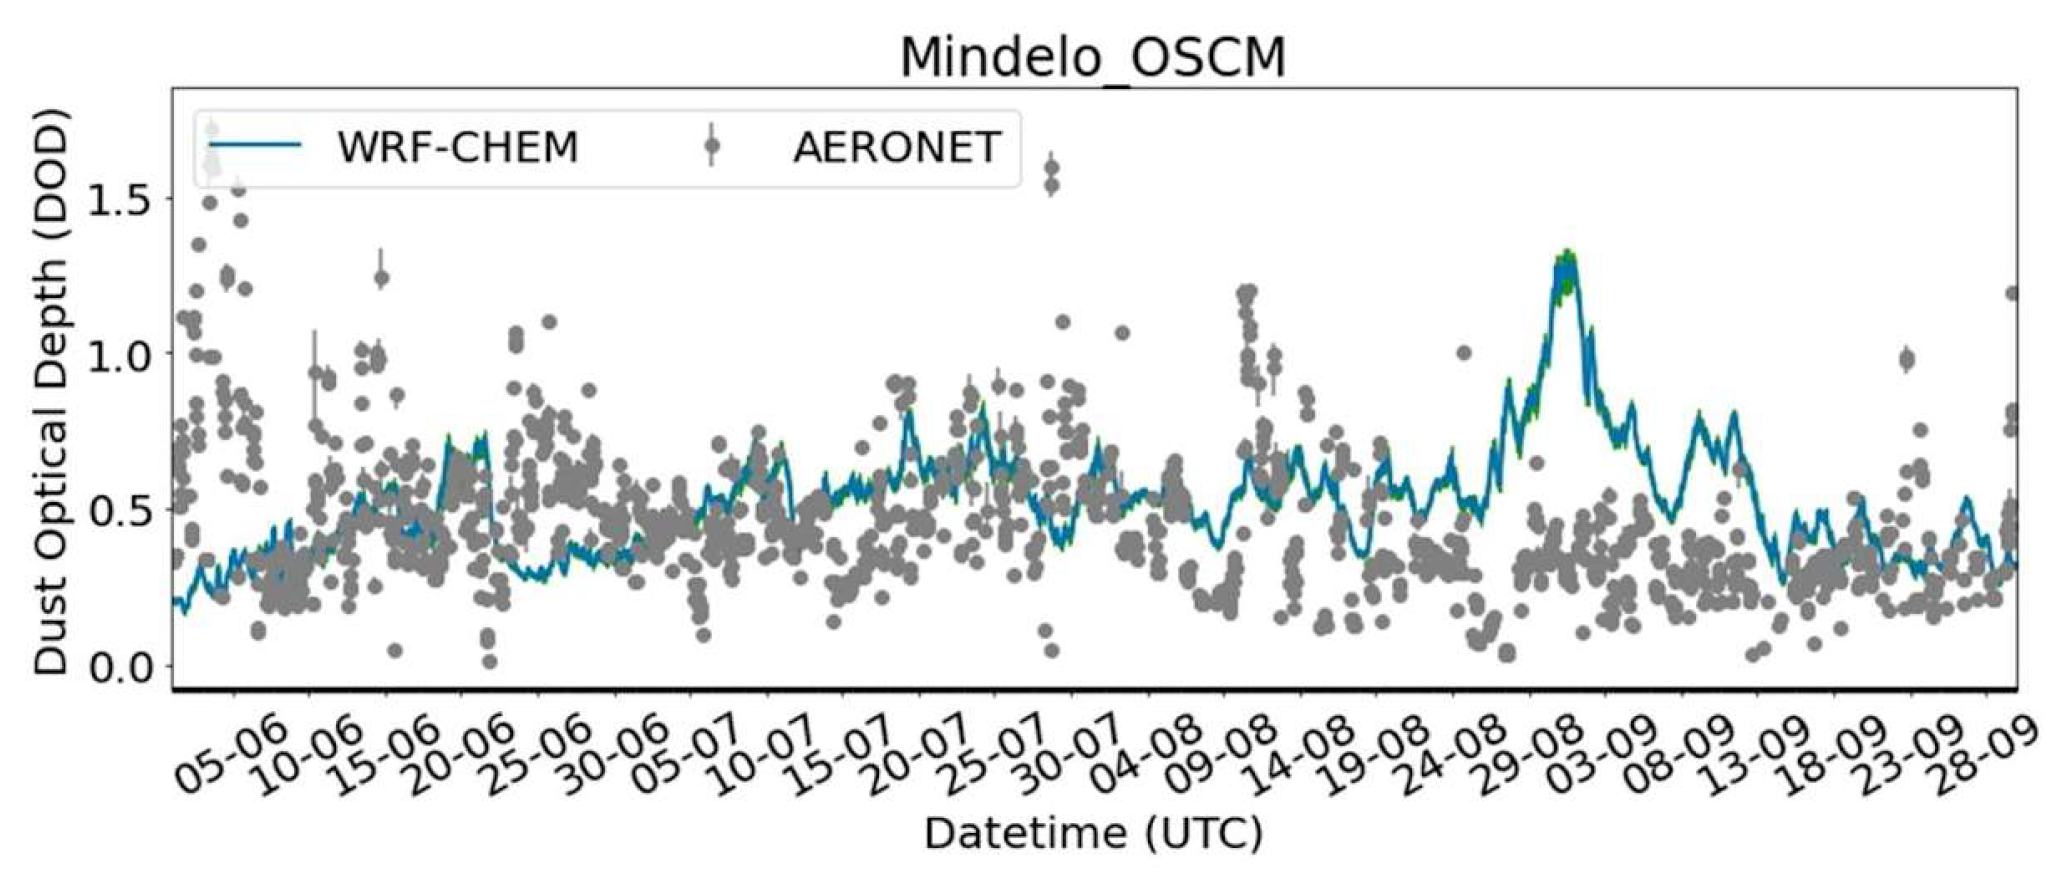
Figure 1. Comparison of the modeled dust optical depth at 550 nm (blue line), collocated in time and space with the AERONET dust-dominated AOD at 550 nm, from the available stations within the domain (gray dots).
Eesp 35 00021 g001
Figure 2. Time series of the LWP and IWP during C-PEX flights for experiments with and without the dust-aware ice nucleation scheme. Red boxes indicate the days with significant differences between the simulated Liquid and ice water path of the different experiments.
Eesp 35 00021 g002
Figure 3. Similar to Figure 2 for experiments with SIP activated and not activated.
Eesp 35 00021 g003
Figure 4. The simulated cold cloud (represented by blue contours) and dust field (illustrated with colored contour lines) from different model experiments (NoAERO-NoSIP, AERO-NoSIP, AERO-SIP) (left) collocated to the CPEX-CV flight of 15 September 2022. The HALO-observed aerosol backscatter, relative humidity with respect to ice, and dust mixing ratio for the flight of 15 September 2022 (right).
Eesp 35 00021 g004
Table 1. Model configuration.
ParameterizationSchemeParameterizationScheme
Surface ModelNoah [10]sf_surface_physics2
Surface LayerMM5 [11]sf_sfclay_physics2
Radiation (SW and LW)RRTMG [12]ra_sw(lw)_physics4
MicrophysicsMorrison 2-moment [8] mp_physics10
CumulusGrell-3 [13] cu_physics5
Boundary LayerMYNN 2.5 [14]bl_pbl_physics5
ChemistryGOCART simple [15,16]chem_opt300
Dust SchemeAFWA [16]dust_opt 3
Table 2. Model experiments performed in this study using the WRF-L model.
MODEL EXPERIMENTSDUST_INSIP
NoAERO-NoSIPNoNo
AERO-NoSIPyesNo
AERO-SIPyesYes
Disclaimer/Publisher’s Note: The statements, opinions and data contained in all publications are solely those of the individual author(s) and contributor(s) and not of MDPI and/or the editor(s). MDPI and/or the editor(s) disclaim responsibility for any injury to people or property resulting from any ideas, methods, instructions or products referred to in the content.